Abstract
This study focuses on the construction and interpretation of a mine water inrush source identification model to enhance the precision and credibility of the model. For water inrush source identification and feature analysis, a novel method combining XGBoost and SHAP is suggested. The model uses Ca2+, Mg2+, K+ + Na+, HCO3-, Cl-, SO42-, Hardness, and pH as discriminators, and the key parameters in the XGBoost model are optimized by introducing the improved sparrow search algorithm. The Sparrow Search Algorithm combines Tent chaos mapping and Levy flight strategy (CLSSA), which makes the optimization process better balance the global search ability and local search ability, so as to improve the efficiency and effect of parameter optimization. Specifically, CLSSA is used to optimize key parameters of XGBoost, including the number of weak estimators (NE), tree depth (TD), model learning rate (LR), and then establishes a mine water inrush source identification model based on the CLSSA-XGBoost. Moreover, the model combines SHAP explainable framework to analyze key features of the identification results and interpret the impact of these features. Verified by 160 sample sets in Xinzhuangzi Mine, the average prediction precision of the CLSSA-XGBoost is 97.78%, the average prediction recall rate is 97.59% and the F1 is 97.61%, which are better than other comparison models. The SHAP provides global and local predictive explanatory analysis, revealing key factors for identifying different water inrush sources, enhancing the credibility of prediction results, and helping mine safety personnel make accurate decisions.
Subject terms: Coal, Hydrology
Introduction
In recent years, as coal mining activities continue to penetrate deep underground, the risk of water inrush accidents in mines has increased significantly1. These accidents not only severely disrupt the normal operation of mines but also greatly increase the safety risks for miners. Therefore, the prevention of mine water inrush is imminent. During the formation process of coal mine water is affected by various physical and chemical effects such as water in the hydrosphere, lithosphere, and geological formations. These effects make the hydrochemical type a key source of information for understanding and analyzing the characteristics of coal mine water aquifers2. Therefore, using the hydrochemical data to build a mine water inrush source prediction model can quickly and accurately identify the water inrush source and reduce the occurrence of mine water inrush accidents3.
In the field of mine water inrush source identification using the hydrochemical data, scholars initially relied on traditional methods, such as discerning water levels and temperatures4,5, as well as changes in isotopes or trace elements in mine water6,7. However, with technological advancement, the integration of traditional methods with modern computer technology has become more mature, and machine learning methods have gradually replaced these traditional methods. For instance, Neural Network algorithms (NN)8,9, Support Vector Machine algorithm (SVM)10, and Random Forest algorithm (RF)11 have been extensively researched in this area. Although machine learning methods demonstrate significant applicability and advantages in this field, the training of these models still relies on expert experience to manually set parameters, making the operational process relatively complex.
Recently, scholars have increasingly used the combination of intelligent optimization algorithms and machine learning algorithms to improve the precision of water source identification in mines and reduce manual operations. For instance, Xu et al.12 introduced the concepts of Tent chaos mapping and adaptive weighting in 2018 and established a water inrush source discrimination model based on the Adaptive Chaos Particle Swarm Optimization (ACPSO)-NN. Additionally, Shao et al.13,14 incorporated the Mean Impact Value (MIV) concept for filtering various discrimination indicators. They optimized the hyperparameters of the SVM using Particle Swarm Optimization (PSO), proposing a MIV-PSO-SVM mining water inrush source identification model. This approach effectively enhanced the overall accuracy of water source identification. Subsequently, they proposed an Improved Whale Optimization Algorithm (IWOA)-Hybrid Kernel Extreme Learning Machine (HKELM) water source discrimination model. Similarly, Dong et al.15,16 utilized the Whale Optimization Algorithm (WOA) to optimize the Extreme Learning Machine (ELM), establishing a WOA-ELM water inrush source identification model. Later, they introduced a Particle Swarm Optimization (PSO)-Extreme Gradient Boosting Tree (XGBoost) water source identification model. Yu et al.17 proposed a PCA-AWOA-ELM mining water inrush source identification model by optimizing the initial weights and thresholds of the ELM with an improved WOA after reducing the original data using Principal Component Analysis (PCA), and comparative analysis with other models validated its effectiveness. Huang et al.18 combined PCA, Chaos Sparrow Search Algorithm (CSSA), and RF to propose a PCA-CSSA-RF water inrush source identification model with high prediction precision in 2023. In summary, these studies have not only accumulated a rich theoretical foundation but also led to practical application results. However, most existing machine learning methods treat the water source sample identification as a “black box” process, making it difficult to understand their decision-making process, leading to a lower credibility of the model. Therefore, the main goal of this study is to construct an efficient and interpretable mine water inrush source identification model to improve the scientificity and effectiveness of mine safety management.
XGBoost algorithm uses tree model, parallel computation and regularization techniques to effectively improve prediction accuracy and adapt to high-dimensional small sample data. Therefore, this study uses the Extreme Gradient Boosting Tree (XGBoost) to identify the source of mine water inrush under the explainable machine learning framework SHAP. Based on the Sparrow Search Algorithm (SSA), Tent chaos mapping and Levy flight strategy are introduced to design an improved Sparrow Search Algorithm (CLSSA), and the CLSSA is used to optimize the key parameters of XGBoost, thereby a mine water inrush source identification model based on CLSSA-XGBoost is constructed. The SHAP framework is applied to the CLSSA-XGBoost model to interpret the prediction results of the model globally and locally, and reveal the key features that affect the identification of water inburst source. It can effectively solve the problem of poor interpretability of the existing machine learning model, and can also provide more reliable and transparent decision support for mine safety management, so as to provide important technical support for avoiding mine water inrush accidents19.
The innovations of this study are as follows: (1) combining CLSSA algorithm with XGBoost for the first time to form an ensemble learning algorithm for mine water inburst source identification; (2) The SHAP framework is used to interpret and analyze the key features in the process of mine water inrush source identification globally and locally, which enhances the reliability of the model prediction results; (3) The superiority of the proposed model is verified by the measured data, and its application potential in the identification of mine water inrush source is demonstrated.
Establishment of mine water inrush source identification model
XGBoost algorithm model
The XGBoost is an ensemble learning method based on gradient-boosting decision tree model optimization proposed by Chen et al.20. The essence of this algorithm lies in progressively incorporating new weak learners to fit the residuals from the previous training round, culminating in a composite prediction score for each sample by summing the scores from all the weak learners.
Based on the tree model, XGBoost uses multi-thread parallel computing to improve the convergence speed, fits the data by gradient boosting, and uses tree pruning strategy and regularization technology to prevent overfitting and reduce the influence of noise data. This method not only improves the prediction accuracy, but also is more suitable for high-dimensional and small sample data, and has been widely used in many fields21. Therefore, in view of the high-dimensional and small sample data of mine water inrush, this study uses XGBoost as the benchmark model to carry out mine water inrush source identification research, and its objective function  can be expressed as follows.
 |
1 |
where, is the number of total samples;
  is the measured value of the
  sample;
  is the loss function, which is the difference between
  and
and  .
.  is the complexity of the tree.
In order to further improve the performance of the model, this study uses the improved Sparrow Search Algorithm for parameter optimization. Since there are many parameters in the XGBoost algorithm, the parameter adjustment process is highly random, parameter optimization is required to improve the classification prediction precision of the model. However, the process of optimizing hyperparameters is essentially a black-box function optimization problem. Excessive optimization of parameters may lead to model redundancy, increase computational complexity, and impact the overall system performance. In the XGBoost model, key parameters affecting predictive performance include the number of weak estimators (NE), tree depth (TD), and model learning rate (LR). NE: This determines the number of weak estimators (trees) to build. More trees improve the accuracy of the model, but also increase the computational complexity. TD: This determines the maximum depth of each tree. Larger tree depths capture more feature interactions, but are more likely to lead to overfitting. LR: This controls how much each tree contributes to the model. A smaller learning rate requires more trees to achieve the same effect, but improves the stability of the model. Therefore, we will use CLSSA to configure the optimal parameters, so as to improve the classification and prediction performance of XGBoost model.
CLSSA algorithm model
The SSA is an innovative intelligent optimization algorithm that imitates the foraging and anti-predatory behaviors of sparrow populations22. In this algorithm, different roles are assigned to sparrows: finders locate food and guide the direction, joiners acquire food based on the information provided by finders, and scouts monitor predators and issue alerts when necessary. However, the traditional SSA algorithm relies on simple random methods for initializing populations, which may lead to insufficient coverage in the optimization space of XGBoost parameters and a tendency to get trapped in local optima. In response to the above challenges, this study introduces Tent chaotic mapping to replace traditional random mapping, enhancing the uniformity and diversity of the population and improves the global search ability of the algorithm. Additionally, we have adopted the Levy flight strategy in place of the original linear flight strategy, which helps the algorithm jump out of the local optimal solution, improves the global search ability, and further optimizes the performance of the algorithm. Based on these improvements, this study proposes a new improved sparrow search algorithm-the CLSSA algorithm, expecting to improve the overall optimization capability of the algorithm through this method, and enhance the robustness of the model in the face of complex mine data.
Tent chaos mapping is a piecewise linear mapping function that has a simple structure, and the results presented by the mapping make the population more evenly distributed in the search space and have good traversability. It can overcome the problem of reduced population diversity in the later stage of SSA optimization, thereby improving the early convergence speed and solution accuracy of SSA. The process of using the Tent chaos mapping to generate a chaotic sequence to initialize the sparrow position  is as follows:
Firstly, chaos sequences are generated from Tent chaos mapping:
 |
2 |
where:  ,
,  is the total number of sparrows in the population, that is, the population size, which determines the number of solutions participating in the search process. Larger population size can improve the global search ability of the algorithm, but it will also increase the computation time, the value range is [50, 200];
 ,
,  is the dimension of the hyperparameters to be optimized;
  is the control parameter of the chaos system, which determines the application ratio of chaotic maps in the initial solution generation process. By adjusting the mapping parameters to increase the diversity of the population and avoid the early convergence of the algorithm, the value range is [0,1].
Then, the chaos sequence in Eq. (2) is mapped to the search space of solutions to obtain the chaos initialization population:
 |
3 |
where:  and
and  are the upper and lower bounds on the values of the parameters to be optimized in dimension
  , respectively.
The Sparrow Search Algorithm is prone to fall into local optimality in the late stage of optimization search, leading to premature convergence and loss of population diversity. Therefore, the Levy flight strategy is introduced to update the population and improve the global search capability. The Levy flight strategy combines short and long range for searching, by exploring a small area around the sparrow carefully through short range, and by walking a long distance so that the sparrow can go to a new area, which ensures that the search area is wider. The Levy stochastic distribution expression is as follows:
 |
4 |
where:  is the Levy flight parameter, which adjusts the step size distribution of individuals in the search space to help the algorithm jump out of local optimum and improve the global search ability, and the value range is (0,2);
  and
and  are random numbers obeying a normal distribution as expressed in Eq. (5):
 |
5 |
The population chaos initialization enhances the global search capability of the sparrow search algorithm, and the Levy flight strategy enhances the later local search capability of the sparrow search algorithm, so combining the two can enhance the overall optimization capability of the sparrow search algorithm.
Algorithm performance testing
To validate the performance of CLSSA, we employed the single-peak Step function and the multi-peak Ackley function as benchmarks for comparison with the traditional SSA algorithm.
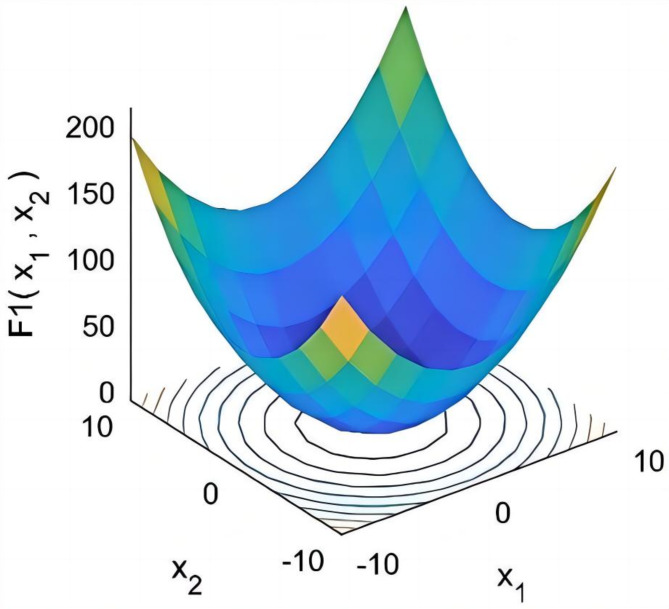
The Step function mainly consists of horizontal line segments, which contain multiple jump points, between which there are a large number of local extrema, as shown in Fig. 1, providing a good challenge to test the algorithm’s local search capability. The function expression is shown in Eq. (6):
 |
6 |
where, definitional domain  , dimension
  , the minimum value in the definitional domain is 0.
Fig. 1.
Test function  .
.
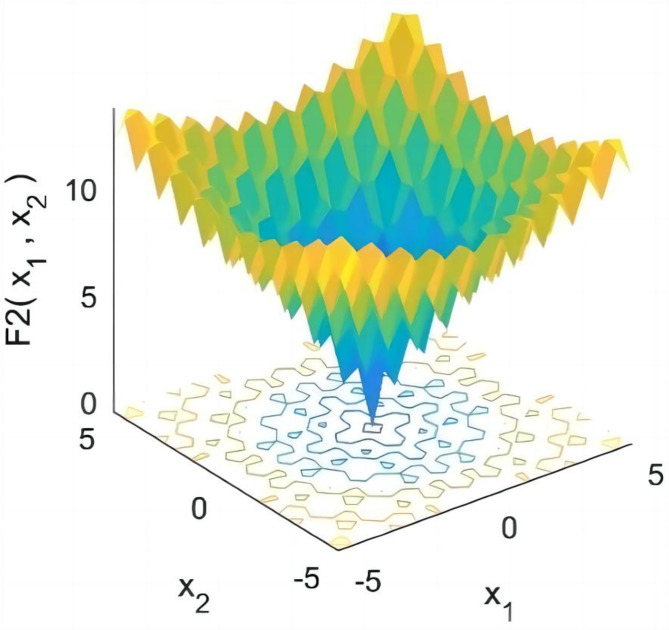
Similarly, the Ackley function possesses numerous local minima around its minimum, as shown in Fig. 2, which provides a challenge for testing the global search capability of the algorithm, and the function expression is shown in Eq. (7). By comprehensively testing these two functions, the performance and efficiency of the CLSSA algorithm can be comprehensively evaluated.
 |
7 |
where, definitional domain  , dimension
  , the minimum value in the definitional domain is 0.
Fig. 2.
Test function  .
.
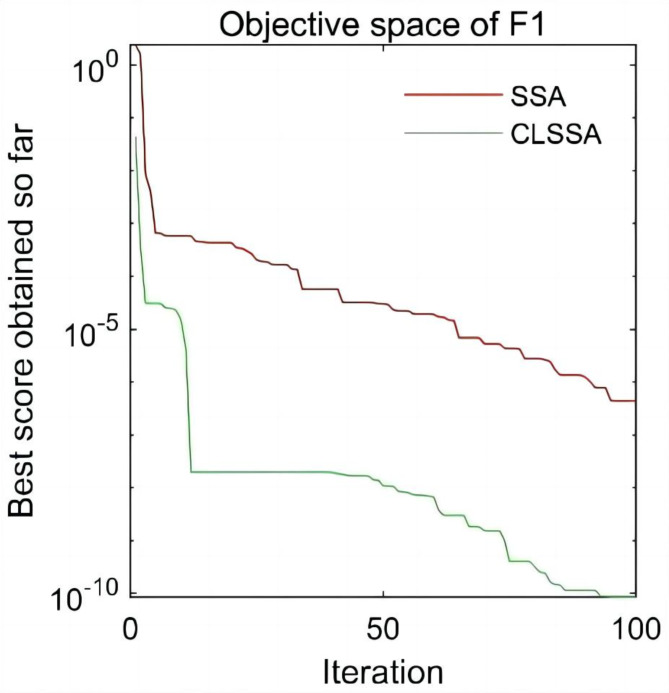
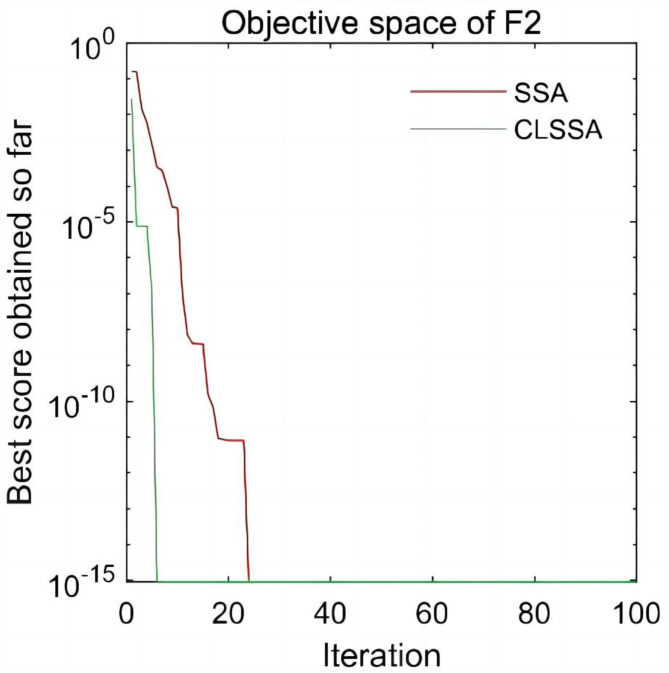
SSA and CLSSA were used to optimize the two test functions for 100 iterations respectively. The optimization process is shown in Figs. 3 and 4. As can be seen from Fig. 3, in the Step test function, the CLSSA algorithm converges to the optimal state value after 100 iterations, but the SSA algorithm falls into a local optimum after 100 iterations; as can be seen from Fig. 4, the SSA and CLSSA algorithms converge to the same optimal state value in the Ackley test function, but CLSSA converges to the optimal value within 5 iterations, while SSA converges to the optimal value within 25 iterations. Experimental results show that the improved algorithm has strong global optimization capabilities.
Fig. 3.
The optimization process of SSA and CLSSA on the function  .
.
Fig. 4.
The optimization process of SSA and CLSSA on the function  .
.
CLSSA-XGBoost model training
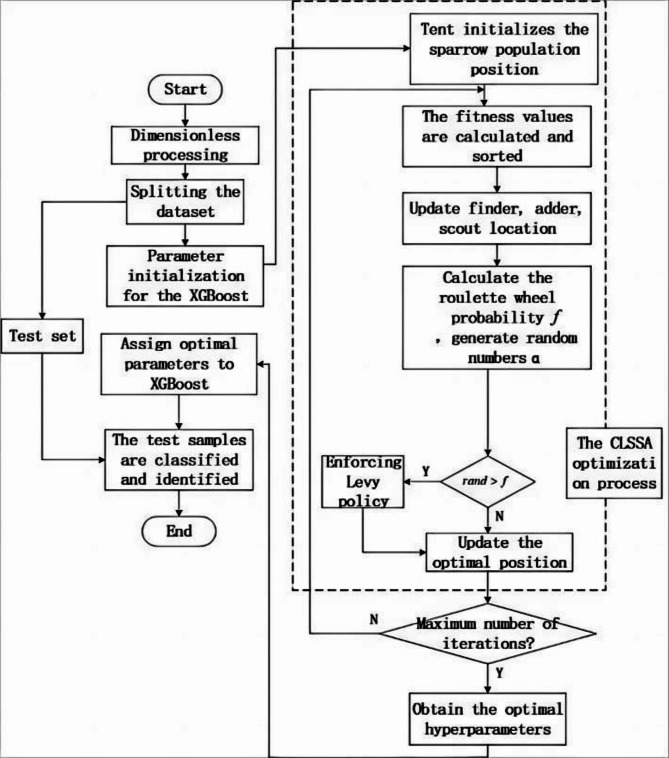
By leveraging the optimization capabilities of the CLSSA algorithm and the learning efficiency of the XGBoost algorithm, we have developed a new integrated model named CLSSA-XGBoost. This model effectively utilizes the CLSSA algorithm to determine the optimal parameter set for the XGBoost training process that minimizes the discrepancy between the predicted and simulated values, thereby significantly enhancing the prediction performance of the XGBoost algorithm. The implementation process of the CLSSA-XGBoost integrated learning algorithm is shown in Fig. 5, illustrating how this integrated approach optimizes the precision of mine water inrush source identification.
Fig. 5.
Process of mine water inrush source identification model.
SHAP: an interpretable machine learning framework for mine water inrush source identification
In the prediction work of mine water inrush source identification, in addition to pursuing accuracy, an in-depth understanding of the underlying reasons why the model makes a particular prediction is crucial, which is directly related to the credibility of the model prediction results and the efficiency of mine safety monitoring. Face with “black box” operations such as integrated learning and deep learning models, the complexity of the inner workings of the models makes their intuitive interpretation challenging for humans. Therefore, it is particularly critical to analyze the interpretability of the prediction results. In this work, interpretability refers to the identification of key features that influence water source discrimination and reveals the decision-making process of the model, thus providing mine inspectors with easy-to-understand predictions of water source identification based on key indicators.
Explainable machine learning is dedicated to making the behavior and predictions of machine learning systems more transparent and understandable to humans. Shapley Additive explanation (SHAP), introduced by Lundberg and Lee, is an explanation framework for interpreting the output of a model23. Based on cooperative game theory24, SHAP assesses the impact of each feature on the prediction outcome of a specific sample by calculating its contribution. Positive contribution values indicate that the prediction results are improved, while negative contribution values decrease the prediction results. Meanwhile, the importance of features is proportional to their influence in the model, which is represented by the absolute magnitude of the contribution value. The explanation of the mine water inrush source identification model using SHAP employs an additive model, where the Shapley value of a feature indicates its impact on the model output: positive values signify a positive influence on the prediction outcome, and negative values indicate a negative influence.
Assuming that the  water inrush source sample is
  , the equation for calculating the Shapley value
  of its
  eigenvalues
  is shown in Eq. (8).
 |
8 |
where,  is the set of all features in the inrush source data set, and its latitude is
  ;
;  is a subset drawn from
  and the size of
  is
is  ;
;  is the predicted value of the model for the water inrush source sample
  when only the feature set
  is used, and when
  is the empty set, the value of
  is called the basic value, which is equivalent to the average value of the predicted value of the model over all the water source samples;
  is the average over all samples of the model’s predicted value for the water source sample
  when feature
  is added to the set of features
  ;
;  denotes the full subset of features in
  after the
  feature is removed.
Based on the Shapley value, the SHAP interpretation of the inrush source identification model can be expressed by an additive model as shown in Eq. (9).
 |
9 |
where,  is the baseline, i.e., the predicted mean of all training samples, of the output of the entire water inrush source identification model;
  is the Shapley value that represents the contribution of the
  feature of the
  water inrush source sample to the predictive model output
  ;
;  is the simplified feature indicator coefficient, which takes the value of 0 or 1;
  means that the feature exists in the sample
  to be interpreted;
  means that the feature does not exist in the sample
  to be interpreted.
For the Shapley value  in the above equation, when
  , it means that the
  feature of the
  water inrush source sample enhances the predicted value, which has a positive effect on the model output, while when
  , it means that the
  feature of the
  water inrush source sample reduces the predicted value, which hurts the model output. Thus, the SHAP algorithm can extrapolate the predictions of the model from the baseline values to the final predicted values, while indicating the contribution of each feature.
Application of mine water inrush source identification model
Selection of discriminant index of water inrush source
This study focuses on the water inrush incident of Xinzhuangzi mine as the research object. Xinzhuangzi coal mine is located in the west of Huainan mining area, Anhui Province, China. It is a monocline structure in general, with strata striking N40°W, dip NEE, and dip Angle varying from 12° to 54°. It is mainly dominated by fault structure, and small folds are developed locally. The surface water system affecting mine safety production is mainly Huaihe River, Qianjia Lake and several subsiding water areas with different sizes. The Huaihe River flows through the mine field, forming the hydrogeological conditions for coal mining under the river with a length of 4 km. There is a flood drainage ditch with a length of about 8.4 km in the west of the mine field. There are three main types of water filling sources in the mine: Ordovician limestone karst water layer G1 (referred to as “Ordovician limestone water”), Carboniferous Taiyuan group limestone karst water layer G2 (referred to as “Tai-grey water”), and Coal series sandstone water layer G3 (referred to as “Coal series water”). Drawing on the research findings of Dong et al.25, eight key hydrochemical characteristics were identified as discriminants for water source identification, including Ca2+(X1), Mg2+(X2), K+ + Na+(X3), HCO3-(X4), Cl-(X5), SO42-(X6), Hardness(X7), pH value(X8).
The influence and numerical standard of these eight selected hydrochemical characteristic factors on the classification of water inrush source types for mine water emergencies are described in the literature3,5,25 and will not be repeated here.
For the analysis, 160 water sample data sets were selected from the long-term water inrush observation records of the Xinzhuangzi Mine, China. Among them, the G1: Ordovician limestone water 51 group (class 1), the G2: Tai-grey water 53 group (class 2), and the G3: Coal series water 56 group (class 3). Selected variable information for the sample data is shown in Table 1. The selected points cover the main hydrogeological units in the mining area, which ensures the representation and diversity of the data and provides a reliable basis for the training and validation of the model. Sample data with balanced no missing values were standardized to eliminate dimensional differences between different features.
Table 1.
Partial variable data of water inrush source samples.
| Water sample number | Mass concentration of ionic components/(mg L−1) | X8 | Label | ||||||
|---|---|---|---|---|---|---|---|---|---|
| X1 | X2 | X3 | X4 | X5 | X6 | X7 | |||
| 1 | 0.32 | 0.48 | 2.15 | 0.90 | 1.15 | 0.03 | 2.24 | 9.30 | G1 |
| 2 | 0.21 | 1.03 | 1.41 | 0.89 | 0.90 | 0.02 | 3.48 | 9.45 | G1 |
| 3 | 0.72 | 0.79 | 4.25 | 1.07 | 3.19 | 0.00 | 4.24 | 8.78 | G1 |
| … | … | … | … | … | … | … | … | … | |
| 57 | 4.20 | 1.94 | 1.96 | 6.67 | 0.76 | 0.68 | 17.24 | 7.15 | G2 |
| 58 | 4.66 | 1.13 | 1.27 | 6.46 | 0.79 | 0.81 | 19.04 | 7.25 | G2 |
| 59 | 3.37 | 1.76 | 2.89 | 7.05 | 0.70 | 0.27 | 14.38 | 7.00 | G2 |
| … | … | … | … | … | … | … | … | … | |
| 158 | 0.59 | 0.43 | 39.62 | 39.72 | 0.79 | 0.13 | 2.86 | 8.00 | G3 |
| 159 | 0.20 | 0.16 | 36.20 | 32.71 | 0.70 | 0.27 | 1.01 | 8.34 | G3 |
| 160 | 0.22 | 0.19 | 31.38 | 26.81 | 0.71 | 0.05 | 1.15 | 8.5 | G3 |
Indicators of assessment
To evaluate the performance of the prediction model for the identification of mine water inrush source, the Precision rate, the Recall rate, and the F1-value are selected as the evaluation indicators for the prediction of mine water inrush source. For the 3-classification problem in this study, the macro average is used for Precision, Recall, and F1-value, as shown in Eqs. (10–12). The Precision rate refers to the proportion mean of the number of correctly classified samples of the three water source categories to the number of samples judged by the model. Recall rate refers to the average ratio of the number of correctly classified samples of three water source categories to the number of true samples of this category. The F1-value is the result of combining precision and recall and is usually used to evaluate the effectiveness of classification models, which is mainly used in this paper to characterize the learning effect of the model with the number of training iterations.
 |
10 |
 |
11 |
 |
12 |
where,  is the total number of classes;
  is the number of correctly predicted classes
  ;
;  is the number of other classes that were incorrectly predicted as class
  ;
; is the number of incorrectly predicted classes
  as other classes.
To verify the effectiveness and practicability of the model proposed in this paper, the final experimental results Precision, Recall, and F1-value are the average of 20 times of water inrush source identification results, and the noise influence of abnormal experiments is reduced through multiple tests.
Model prediction results
The CLSSA-XGBoost model uses a sparrow population size of 60, a spotter share of 70%, a scout share of 20%, a warning value of 0.8, and a maximum number of iterations of 100; The parameter  for the Tent chaos mapping; The parameter
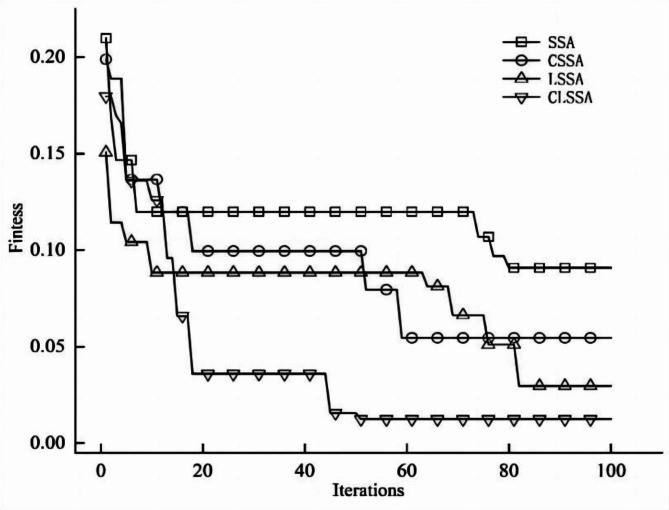
  for the Levy flight strategy. The hyperparameters NE, TD, and LR of the XGBoost algorithm are optimized by the CLSSA algorithm, which has an optimization range of [1,10], [0.01, 1], and [2, 50], respectively. To reduce the stochastic nature of the optimization, we compared the fitness values for each parameter case through five repetitions and finally determined the optimal hyperparameters NE, TD, and LR to be 3, 0.3814, and 43, respectively. To verify the advantage of CLSSA intelligent optimization algorithm in global optimization and convergence speed, SSA, LSSA (Levy-SSA), and CSSA (Tent-SSA) algorithms are used to optimize XGBoost respectively, and the variation of fitness is obtained as shown in Fig. 6.
Fig. 6.
Adaptation change of CLSSA, LSSA, CSSA, SSA.
It can be seen from Fig. 6 that under the same experimental sample conditions, the improved SSA has a better optimization finding effect on XGBoost than the SSA algorithm; CLSSA has the best optimization effect, with the minimum fitness value of 0.012, which can effectively avoid falling into local optimality and has a faster convergence speed. The results show that the CLSSA algorithm has a better optimization effect on XGBoost under the same experimental conditions, can effectively avoid falling into local optimality, and has a fast convergence speed.
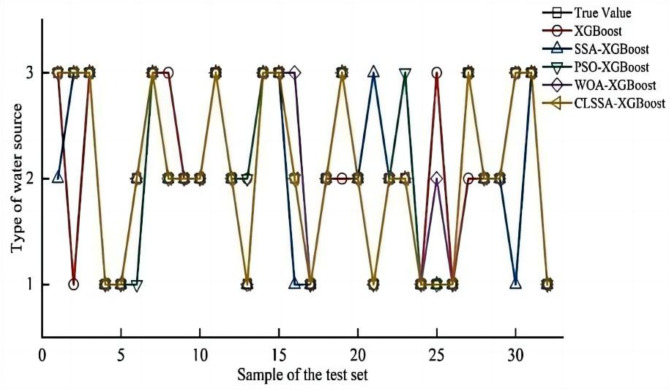
To further verify the superiority of the CLSSA-XGBoost model in identifying water inrush sources, based on data preprocessing, the experimental samples were randomly divided into training sets and test sets according to the ratio of 8:2, and the parameters were optimized and compared with the prediction effect using CLSSA-XGBoost, LSSA-XGBoost, CSSA-XGBoost, SSA-XGBoost and XGBoost models to perform parameter optimization and compare the prediction effects respectively, and the experimental results are shown in Fig. 7.
Fig. 7.
Prediction effects of different models.
Figure 7 shows the prediction results of 32 groups of test sets of water inrush sources. There are 6, 4, 3, and 2 prediction results inconsistent with the true value of XGBoost, SSA-XGBoost, PSO-XGBoost, and WOA-XGBoost models, respectively, while the prediction results of CLSSA-XGBoost model are consistent with the true value. The results show that CLSSA has the most obvious optimization effect on XGBoost. To reduce the test error, the test was repeated 20 times the final results were averaged, and the prediction effects of different models were compared in Table 2.
Table 2.
Predicted results of different models.
| Model | Precision rate/% | Recall rate/% | F1 value/% |
|---|---|---|---|
| XGBoost | 83.48 | 82.68 | 82.84 |
| SSA-XGBoost | 88.70 | 88.59 | 88.51 |
| PSO-XGBoost | 91.97 | 91.94 | 91.82 |
| WOA-XGBoost | 95.32 | 95.28 | 95.04 |
| CLSSA-XGBoost | 97.78 | 97.59 | 97.61 |
Table 2 shows that compared with the unoptimized XGBoost model, the precision rate of the XGBoost model optimized by SSA, PSO, WOA, and CLSSA is increased by 5.22%, 8.49%, 11.84%, and 14.3% respectively. The recall rate is increased by 5.91%, 9.26%, 12.6%, and 14.91%;  values are increased by 5.67%, 8.98%, 12.2%, and 14.77% respectively. The four intelligent optimization algorithms can effectively improve the performance of XGBoost, and the optimization effect of CLSSA is the most obvious. Compared with the unimproved SSA-XGBoost model, the precision rate, recall rate, and
  value of the XGBoost model optimized by CLSSA are significantly improved, indicating that the improved SSA algorithm can effectively improve the performance of the SSA-XGBoost model.
Compared with PSO-XGBoost and WOA-XGBoost models, the precision, recall, and  value of the CLSSA-XGBoost model improved by 5.81%, 2.46%; 5.65%, 2.31%; 5.79%, and 2.57%, respectively, which indicates there is a better performance in identifying global samples and the various categories of CLSSA-XGBoost model. The results show that CLSSA can prevent the model from falling into the local optimality prematurely, has better global optimization capabilities, and can significantly improve the prediction performance of XGBoost. In summary, the CLSSA-XGBoost model can be used as an effective method for mine water source identification.
Interpretation and analysis of mine water inrush source identification model
Feature importance analysis
The SHAP feature importance reflects the contribution of each feature to the improvement of the prediction ability of the model and is quantified by calculating the influence strength of each feature on the target variable. It can intuitively reflect the impact of features on the model. The higher the importance of the characteristic variable, the more significant its role in identifying the source of water inrush.
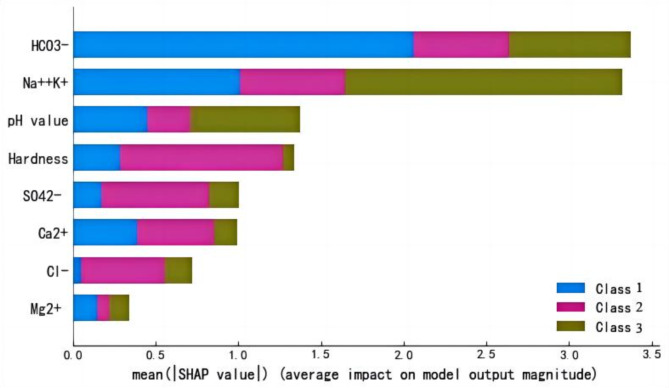
Based on the optimal test scheme, the importance of each characteristic variable in the mine water source identification model for water emergencies was quantified using the SHAP method. As shown in Fig. 8, the vertical axis corresponds to the feature item and the horizontal axis is the absolute mean value of the SHAP value, reflecting the importance of each feature in the prediction. It can be seen that for the mine water inrush source identification model based on XGBoost, the top three most important ones are HCO3-, K+ + Na+, and pH value. For different categories of water inrush sources, the ranking of feature importance is inconsistent.
Fig. 8.
Feature importance analysis.
If we focus only on HCO3-, and K+ + Na+, they are an important basis for judgment for Coal series water and Ordovician limestone water, but for Tai-grey water, the Hardness plays the most critical role.
Main effects analysis of characteristic variables
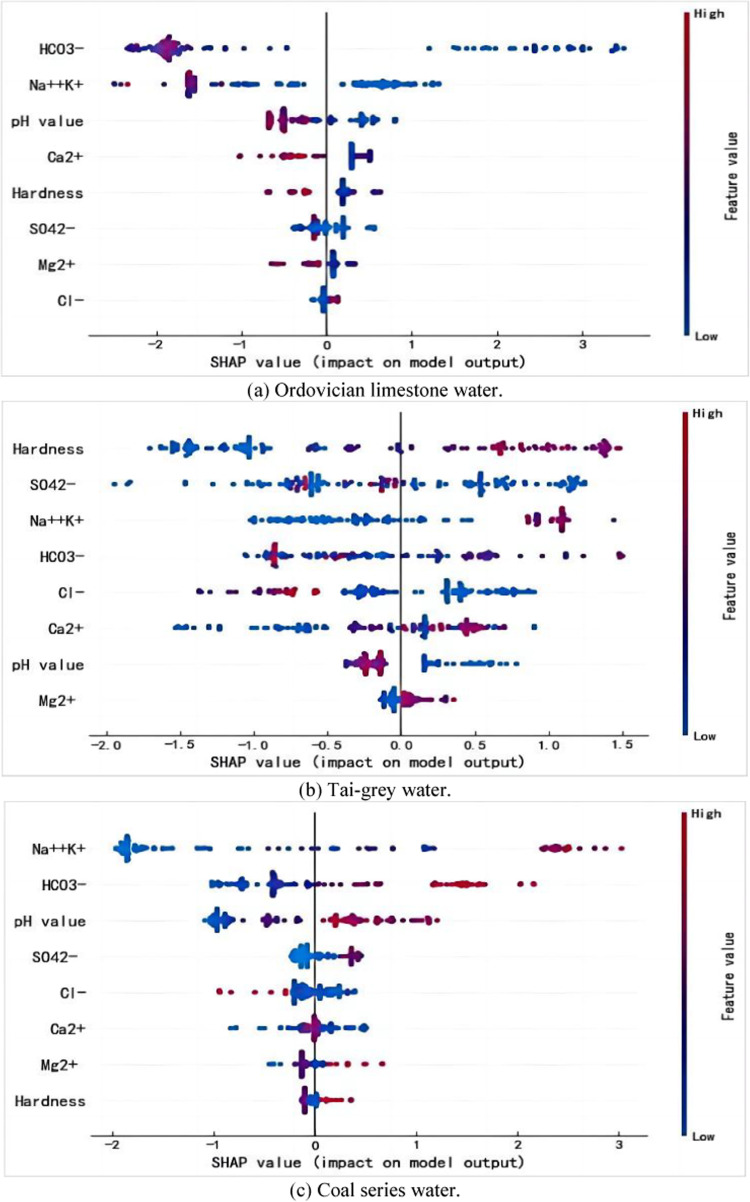
Since the classification problem under study involves multiple categories, to accurately observe the contribution of feature identification of specific categories, this study conducted explanatory analysis on all samples of different water inrush source categories to reveal the mechanism of various features in water inrush source identification. The output results are shown in Fig. 9, Each point in Fig. 9 represents the Shapley value of the corresponding sample point for each feature, with the redder color of each point indicating a larger value for the feature itself, and the bluer color of each point indicating a smaller value for the feature itself; The  axis represents the Shapley value when the Shapley value of the feature is greater than 0, it means that the feature has a positive impact on the model prediction result when the Shapley value of the feature is less than 0, it means that the feature hurts the model prediction result; the
  axis is the features, which are ranked according to the size of their importance from top to bottom.
Fig. 9.
SHAP summary plot.
For Ordovician limestone water, as shown in Fig. 9a, HCO3- is the most important feature for determining that the water inrush source is Ordovician limestone water, with its SHAP value ranges from [− 2.4, 3.5], and the red dots are clustered on the left side of the horizontal axis, and the blue dots are clustered on the right side of the horizontal axis, which indicates that the lower the concentration of HCO3-, the higher the probability of the water inrush source to be recognized as Ordovician limestone water, showing a negative correlation. Similarly, the negatively correlated features also include K+ + Na+ and pH values, the smaller their values, the higher the probability of being identified as Ordovician limestone water. The distribution of Cl- shows that its SHAP value ranges from [− 0.1, 0.1], which shows a weak positive correlation with the identification as Ordovician limestone water.
For Tai-grey water, as shown in Fig. 9b, the Hardness is the most important feature for determining that the water inrush source is Tai-grey water, with its SHAP value ranging from [− 1.75, 1.5], and the blue dots are clustered on the left side of the horizontal axis, and the red dots are clustered on the right side of the horizontal axis, which indicates that the higher the Hardness, the higher the probability of the water inrush source to be recognized as Tai-grey water, showing a positive correlation. Similarly, the positively correlated features also include HCO3-, which has a higher probability of being identified as Tai-grey water for larger values. The distribution of Mg2+ shows that its SHAP value ranges from [− 0.1, 0.3], which is a weak positive correlation with the identification of Tai-grey water.
For Coal series water, as shown in Fig. 9c, K+ + Na+ is the most important feature for determining that the water inrush source is Coal series water, with its SHAP value ranging from [− 2,3], and the blue dots are clustered on the left side of the horizontal axis, and the red dots are clustered on the right side of the horizontal axis, which indicates that the higher the concentration of K+ + Na+, the higher the probability of the water inrush source to be recognized as Coal series water, showing a positive correlation. Similarly, the positively correlated features also include HCO3- and pH values, the higher their values, the higher the probability of being identified as Coal series water. The distribution of Hardness shows that its SHAP value ranges from [− 0.1, 0.3], which is a weak positive correlation with the identification as Coal series water.
In summary, in the water inrush identification model, HCO3-, K+ + Na+, and pH values are important indicators for determining Ordovician limestone water and Coal series water, which show a strong negative correlation with Ordovician limestone water and a strong positive correlation with Coal series water; Hardness is an important indicator for determining Tai-grey water, which shows strong positive correlation with Tai-grey water.
Local interpretability of model prediction results
To further explain the influence of each feature on the prediction results, local interpretability analysis is carried out on samples from different categories of Ordovician limestone water, Tai-grey water, and Coal series water, respectively, to enhance the understanding of how the input features make predictions.
As shown in Fig. 10, the red features in the figure indicate that their Shapley values are positive, which will bring a positive contribution to the predicted values, and the larger the area of the color patch, the greater the impact on the model output, and vice versa. The right subgraph is a specific prediction waterfall chart. The vertical axis is the feature name and feature value, and  the horizontal axis is the model baseline value. Starting from the baseline value, add (red part) or subtract (blue part) the Shapley value of each feature to obtain the prediction
  for that sample.
Fig. 10.
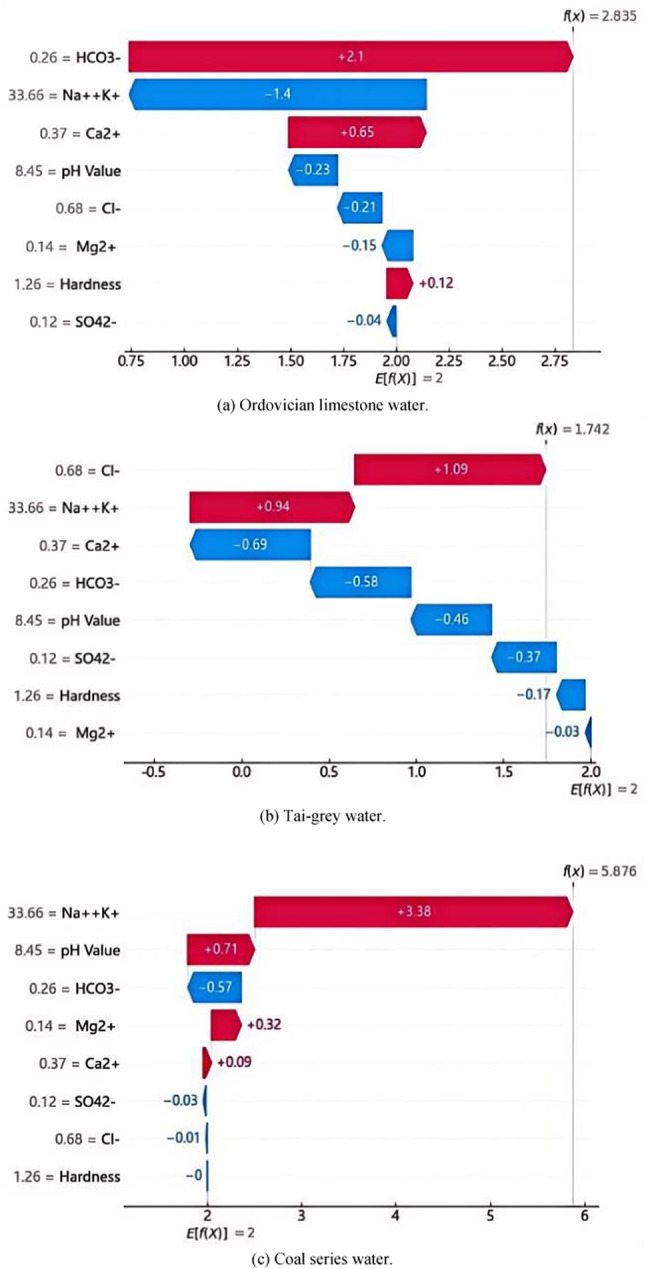
Examples of interpretation of prediction results for specific samples.
Figure 10 respectively shows the contribution of each characteristic when the same data sample is predicted to be Ordovician limestone water, Tai-grey water and Coal series water. As can be seen from Fig. 10a, this figure shows that the model output increases from the baseline value  is 2 to the final output
  is 2.835. As can be seen from Fig. 10c, this figure shows that the model output increases from the baseline value
  is 2 to the final output
  is 5.876. From the flow direction of the waterfall diagram, the value of the feature Na+ + K+ increases by 3.38, which has the greatest impact on the model prediction. Characteristic pH and Mg2+ also have a positive effect, increasing by 0.71 and 0.32, respectively. On the other hand, the value of the characteristic HCO3- has a negative effect on the model, with a reduction of 0.57. As can be seen from Fig. 10b, this figure shows the opposite of Fig. 10a and c, revealing the contribution of features to the model’s prediction of the negative effect of the category (i.e. not the category). The final value here is 1.742, which is lower than the baseline value, indicating that these features combine to make the model tend to think that the example does not belong to the class under consideration.
The waterfall map starts with a baseline value, and the SHAP values for each feature are stacked sequentially, eventually accumulating to  . For multiclass classification, this final
  is the original output of the model, which, after being transformed by the softmax function, becomes the probability that the sample is classified as the corresponding class. For the
  output shown in Fig. 10, its final predicted probability situation is shown in Table 3 below.
Table 3.
Sample forecast situation table.
| Sample number | True class | Prediction class | Corresponding class prediction probability | ||
|---|---|---|---|---|---|
| Ordovician limestone water | Tai-grey water | Coal series water | |||
| Sample No. 157 | Coal series water | Coal series water | 0.044921 | 0.015058 | 0.940021 |
Table 3 shows that the difference in  values of different categories can be explained by the different confidence of the model for different categories, that is, the probability of the model predicting this category is different. The output
  of the model is the highest positive value for coal series water, indicating that the model is most confident in its prediction for this category. The characteristic Na+ + K+ and pH provide the largest positive contribution in this category, while the other features have relatively little impact. This indicates that the characteristic Na+ + K+ and pH play an important positive role in the model decision. This set of analyses shows that the prediction decision of the model is influenced not only by the value of the feature, but also by the interaction between the feature and the predicted category. Especially in classification tasks, different features have different contributions to different categories. For example, a feature may provide a positive contribution in predicting one class and a negative contribution on another class.
In the SHAP analysis stage, the waterfall plot reflects the contribution of each feature to the prediction probability of a particular class based on the model prediction. These are used to explain how the  (final model prediction) is determined by the input features. By comparing the SHAP waterfall diagrams of different categories of each sample, a comprehensive view of the decision-making process of the model prediction can be obtained, which is helpful to explain the decision-making process of the model and provide the interpretability of the model to some extent. These comprehensive data information will greatly help the safety monitoring department to make more accurate and effective decisions.
Conclusions and future works
This study successfully constructs the CLSSA-XGBoost ensemble learning model for the identification of mine water inrush. Utilizing the SHAP theory, we have deeply interpreted the prediction results from both global and local perspectives, ensuring their rationality. Ultimately, a series of experimental validations and comparative analyses confirmed the effectiveness of the proposed method. The main conclusions drawn are as follows:
Within the traditional SSA algorithm, this study introduced Tent chaos mapping and Levy flight strategies, effectively overcoming the algorithm’s tendency to get trapped in local optima and significantly accelerating its convergence speed. Moreover, the improved CLSSA algorithm effectively resolved the issue of insufficient fitting capacity due to reliance on subjective experience in the optimization of hyperparameters of XGBoost, achieving high-precision identification of mine water inrush sources.
By integrating the explainable machine learning framework SHAP theory with the CLSSA-XGBoost ensemble learning algorithm, this research uncovered key features influencing different types of mine water inrush sources and analyzed the specific impact of individual sample features on the prediction results. This integration not only enhanced the interpretability of the CLSSA-XGBoost algorithm but also increased the reliability of the prediction results for identifying mine water inrush sources.
Experimental results demonstrate that the CLSSA-XGBoost ensemble learning algorithm has high predictive precision, showing improvements of 14.3%, 9.08%, 5.81%, and 2.46% in predictive precision compared to XGBoost, SSA-XGBoost, PSO-XGBoost, and WOA-XGBoost algorithms, respectively. Utilizing SHAP theory, we identified HCO3-, K+ + Na+, and pH value as significant indicators for Ordovician limestone water and Coal series water, showing a strong negative correlation with Ordovician limestone water and a strong positive correlation with Coal series water. Hardness was proven to be a critical indicator for Tai-grey water, exhibiting a significant positive correlation. The SHAP theory not only identifies key features influencing the types of mine water inrush sources but also enables causal analysis of different samples’ prediction results, providing detailed local interpretations for the model’s predictions, greatly enhancing the interpretability of the model.
However, the data set used in this study is only from Xinzhuangzi Mine, and the data scale is relatively small, which may affect the generalization ability of the model. In addition, although the SHAP framework provides the interpretability of the model, there may still be some complexity in explaining the importance of features when dealing with high-dimensional data. In the future, the model can be further applied to more mine scenarios and further improve its practicability and reliability by introducing more environmental variables. Explore more efficient explanatory methods to improve the transparency of the model. And different metaheuristic algorithms are applied to further optimize the model to improve the ability to deal with complex data.
Acknowledgements
This research was financially supported by the China National Natural Science Foundation (71771111). This research was financially supported by the University-local government scientific and technical cooperation cultivation project of Ordos Institute-LNTU, YJY-XD-2024-B-013).
Author contributions
Conceptualization, B.K., and T.W.; investigation, B.K.; resources, T.W.; writing—original draft preparation, B.K., and T.W.; writing—review and editing, T.W.; All authors have read and agreed to the published version of the manuscript.
Data availability
The datasets used and analyzed during the current study are available from the corresponding author upon reasonable request.
Declarations
Competing interests
The authors declare no competing interests.
Footnotes
Publisher’s note
Springer Nature remains neutral with regard to jurisdictional claims in published maps and institutional affiliations.
References
- 1.Du, Z., Wu, Q., Zhao, Y. et al. A multi-constraint and multi-objective optimization layout method for a mine water inrush monitoring network. Sci. Rep.13, 11817 (2023). [DOI] [PMC free article] [PubMed] [Google Scholar]
- 2.Dong, S., Zheng, L., Tang, S. & Shi, P. A scientometric analysis of trends in coal mine water inrush prevention and control for the period 2000–2019. Mine Water Environ.39, 3–12 (2020). [Google Scholar]
- 3.Wang, X., Xu, Z., Sun, Y. et al. Construction of multi-factor identification model for real-time monitoring and early warning of mine water inrush. Int. J. Min. Sci. Technol.31(5), 853–866 (2021). [Google Scholar]
- 4.Wang, Y., Shi, L., Wang, M. & Liu, T. Hydrochemical analysis and discrimination of mine water source of the Jiaojia Gold Mine area, China. Environ. Earth Sci.79, 1–14 (2020). [Google Scholar]
- 5.Yang, J. Dong, S., Wang, H., Li, G., Wang, T. & Wang, Q. Mine water source discrimination based on hydrogeochemical characteristics in the northern ordos basin, China. Mine Water Environ.40, 433–441 (2021). [Google Scholar]
- 6.Singh, R., Venkatesh, A. S. et al. Stable isotope systematics and geochemical signatures constraining groundwater hydraulics in the mining environment of the Korba Coalfield, Central India. Environ. Earth Sci.77, 1–17 (2018). [Google Scholar]
- 7.Guan, Z., Jia, Z., Zhao, Z. & You, Q. Identification of inrush water recharge sources using hydrochemistry and stable isotopes: A case study of mindong no. 1 coal mine in North-East Inner Mongolia, China. J. Earth Syst. Sci.128, 1–12 (2019). [Google Scholar]
- 8.Chen, Y., Tang, L. & Zhu, S. Comprehensive study on identification of water inrush sources from deep mining roadway. Environ. Sci. Pollut. Res. 1–16 (2022). [DOI] [PubMed]
- 9.Yan, P., Shang, S. et al. Research on the processing of coal mine water source data by optimizing BP neural network algorithm with sparrow search algorithm. IEEE Access9, 108718–108730 (2021). [Google Scholar]
- 10.Ma, D., Duan, H., Cai, X., Li, Z., Li, Q. & Zhang, Q. A global optimization-based method for the prediction of water inrush hazard from mining floor. Water10, 1618 (2018). [Google Scholar]
- 11.Baudron, P., Alonso-Sarría, F. et al. Identifying the origin of groundwater samples in a multi-layer aquifer system with random forest classification. J. Hydrol.499, 303–315 (2013). [Google Scholar]
- 12.Xu, X., Li, Y. Z. & Tian, K. Y. Application of ACPSO-BP neural network in discriminating mine water inrush source. J. Chongqing Univ.41, 91–101 (2018). [Google Scholar]
- 13.Shao, L. S. & Li, X. C. Indentification of mine water inrush source based on MIV-PSO-SVM. Coal Sci. Technol.41, 91–101 (2018). [Google Scholar]
- 14.Shao, L. S. & Zhan, X. F. Identification method of mine water inrush source based on IWOA-HKELM. China Saf. Sci. J.29, 113–118 (2019). [Google Scholar]
- 15.Dong, D. L., Chen, Y. Y., Ni, L. G., Li, Y., Qin, H. Q. & Wei, X. Y. Fast discriminant model of mine water inrush source based on WOA-ELM algorithm. J. China Coal Soc.46(03), 984–993 (2021). [Google Scholar]
- 16.Dong, D. L. et al. A rapid identification model of mine water inrush based on PSO-XGBoost. Coal Sci. Technol.51, 72–82 (2023). [Google Scholar]
- 17.Yu, X. G., Liu, Y. F. & Zhai, P. H. Identification of mine water inrush source based on PCA-AWOA-ELM model. Coal Sci. Technol.51, 72–82 (2023). [Google Scholar]
- 18.Huang, M., Mao, A., Lu, S. C., Wang, Y. B. & Shao, L. S. Identification of mine water inrush source based on PCA-CSSA-RF model. J. Saf. Environ.23, 2607–2614 (2023). [Google Scholar]
- 19.Zhang, Y., Tang, S. & Shi, K. Risk assessment of coal mine water inrush based on PCA-DBN. Sci. Rep.12, 1370 (2022). [DOI] [PMC free article] [PubMed] [Google Scholar]
- 20.Chen, T. & Guestrin, C. XGBoost: A scalable tree boosting system. in Proceedings of the 22nd ACM SIGKDD International Conference on Knowledge Discovery and Data Mining. 785–794 (2016).
- 21.Xu, Y., Zhang, D. et al. Prediction of phytoplankton biomass and identification of key influencing factors using interpretable machine learning models. Ecol. Indic.158, 111320 (2024). [Google Scholar]
- 22.Xue, J. & Shen, B. A novel swarm intelligence optimization approach: Sparrow search algorithm. Syst. Sci. Control Eng.8, 22–34 (2020). [Google Scholar]
- 23.Lundberg, S. M. & Lee, S. I. A unified approach to interpreting model predictions. Adv. Neural Inf. Process. Syst. 30, https://arxiv.org/abs/1705.07874 (2017).
- 24.Štrumbelj, E. & Kononenko, I. Explaining prediction models and individual predictions with feature contributions. Knowl. Inf. Syst.41, 647–665 (2014). [Google Scholar]
- 25.Dong, F., Yin, H., Cheng, W. et al. Study on water inrush pattern of Ordovician limestone in North China Coalfield based on hydrochemical characteristics and evolution processes: A case study in Binhu and Wangchao Coal Mine of Shandong Province, China. J. Clean. Prod.380, 134954 (2022). [Google Scholar]
Associated Data
This section collects any data citations, data availability statements, or supplementary materials included in this article.
Data Availability Statement
The datasets used and analyzed during the current study are available from the corresponding author upon reasonable request.


