Abstract
To elucidate the role of IGF1R inhibition in the pathogenesis of Graves’ orbitopathy (GO), the effects of linsitinib (Lins) on a recombinant human TSHR antibody (M22) and IGF1 to activate TSHR and IGF1R of human orbital fibroblasts (HOFs) obtained from patients without GO (HOFs) and patients with GO (GHOFs) were studied using in vitro three-dimensional (3D) spheroid models in addition to their 2D planar cell culture. For this purpose, we evaluated 1) cellular metabolic functions by using a seahorse bioanalyzer (2D), 2) physical properties including size and stiffness of 3D spheroids, and mRNA expression of several extracellular matrix (ECM) proteins, their modulators (CCL2 LOX, CTGF, MMPs), ACTA2 and inflammatory cytokines (IL1β, IL6). Administration of IGF1 and M22 induced increases of cellular metabolic functions with the effect on HOFs being much more potent than the effect on GHOFs, suggesting that IGF1R and TSHR of GHOFs may already be stimulated. Lins had effects similar to those of IGF1/M22 on cellular biological functions of HOFs but not on those of GHOFs. As for physical properties of 3D GHOFs spheroids, stiffness but not size was significantly increased by IGF1 and/or M22. In contrast, Lins significantly inhibited the M22-induced increase in stiffness despite the fact that Lins alone had no effect. The mRNA expression levels of several genes of ECM proteins and most of the other genes also fluctuated similarly to the changes in stiffness of 3D spheroids despite the fact that Lins induced up-regulation of inflammatory cytokines and MMP3. The findings presented herein indicate that IGF1R inhibition by Lins may beneficially affect GO-related fibrogenesis.
Keywords: Three-dimensional (3D) cell culture, Graves’ orbitopathy, IGF-1, Orbital fibroblast, Linsitinib, M22
Subject terms: Cytokines, Hormones, Proteins, Medical research, Molecular medicine, Eye manifestations
Introduction
Graves’ orbitopathy (GO) caused by autoimmune pathogenesis is clinically characterized by several ocular manifestations including 1) upper eyelid retraction and edema and 2) erythema of the periorbital tissues and conjunctivae, and exophthalmos1–3. As for the molecular pathology of GO, autoimmune based overstimulation of the thyroid-stimulating hormone (TSH) receptor (TSHR) and insulin-like growth factor 1(IGF1) receptor (IGF1R), both of which are expressed in orbital fibroblasts (OFs) and form a complex by a crosstalk mechanism4, induce inflammation and differentiation into adipocytes and myofibroblasts and hyaluronan production5–7.
IGF1 and IGF2 bind to activate a shared and ubiquitously expressed transmembrane receptor, IGF1R, that exists as a homodimer of protomers, each of which consists of three domains: an extracellular ectodomain, a transmembrane and a cytoplasmic tyrosine kinase domain8. The tyrosine kinase domain mediating the intrinsic tyrosine kinase activity is stimulated by binding to IGF1 and IGF2, resulting in autophosphorylation and stimulation of various signaling cascades9. Linsitinib (Lins), also known as OSI-906, is a potent selective small-molecule dual inhibitor of IGF1R and insulin receptor (IR)10that effectively inhibits the intrinsic tyrosine kinase activity of IGF1R by binding to the cytoplasmic tyrosine kinase domain9. After binding of the cognate ligands to the IGF1R and IR, Lins specifically inhibits autophosphorylation, thereby blocking the activation by downstream pathways of IGF1 and IGF2 such as AKT and ERK signaling9. Since IGF1R and TSHR stimulation is known to induce GO pathogenesis11, it was rationally speculated that IGF1R inhibition by Lins could be a possible therapeutic strategy of GO pathogenesis. Recently, Gulbins et al. reported promising results showing that Lins attenuates disease development and progression in a mouse model with thyroid eye disease12. However, a suitable in vitro GO model is needed to test the efficacy of Lins before application to human GO subjects.
Recently, we independently established an in vitro three-dimensional (3D) spheroid model for a better understanding of GO pathogenesis by a 3D drop culture method using human OFs (HOFs) obtained from patients without GO (HOFs) and patients with GO (GHOFs)13. The size and degree of stiffness of 3D GHOF spheroids were significant smaller and higher, respectively, than those of 3D HOF spheroids. Furthermore, modulation of expression of ECM proteins, their modulators including MMPs, lysyl oxidase (LOX), hypoxia inducible factor 2A (HIF2A), and inflammatory cytokines in 3D GHOP spheroids was significantly different from that in 3D HOF spheroids13. Therefore, we considered that our newly developed in vitro 3D spheroid models using GHOFs and HOFs would be useful for studing GO pathogenesis. Furthermore, using these models, we also found that various ophthalmic drugs including prostaglandin derivatives (PG) that induce various periorbital unfavorable adverse effects had different effects on 3D GHOF spheroids and 3D HOF spheroids14. Therefore, we were very interested in testing the effects of Lins on our newly developed in vitro 3D spheroid models.
In the present study, to elucidate the pharmacological effects of Lins on GO pathogenesis, HOFs and GHOFs were treated with a recombinant human TSHR antibody, M22, IGF-1 and Lins and then subjected to cellular metabolic analysis by a seahorse bioanalyzer, physical property analysis of 3D spheroids and qPCR for various ECM proteins, their modulators, and inflammatory cytokines.
Materials & methods
All of procedures in the current study involving human participants conducted at Sapporo Medical University Hospital, Japan, were approved by the institutional review board (approved number, 312–3190) and were in accordance with the tenets of the Declaration of Helsinki and the national laws for the protection of personal data. Informed consent was obtained from all individual participants included in this study.
Isolation and 3D cultures of human orbital fibroblasts (HOFs)
Isolation of HOFs was performed by a previously described method using surgically obtained orbital fat explants from 5 non-GO patients with orbital fat herniation and 5 GO patients (Table 1). In the absence and presence of 10°ng/ ml M22, 10°μM IGF-1 and/or 10°μM Lins (IGF-1 receptor antibody) according to previously reported data15–17, two-dimensionally (2D) and three-dimensionally (3D) spheroid cultures were processed for a period of 6 days as described in recent reports14,18,19. Briefly, orbital fat explants were cultured in a 2D culture medium composed of DMEM supplemented with 10% fetal bovine serum (FBS), 1% L-glutamine, and 1% Antibiotic–Antimycotic on 100 mm dishes at 37 °C with 5% CO2 with the medium was changed every other day. Subsequently, the HOFs obtained during 3 to 7 passages were further cultured as described above until 100% confluence.
Table 1.
Demographic characteristics of all subjects.
| No | Age (year-old) | Gender | Surgery | Origin of specimen | Thyroid disease | Clinical activity score | Thyroid function | Treatment history | Systemic diseases | |
|---|---|---|---|---|---|---|---|---|---|---|
| GO | 1 | 48 | Male | Strabismus surgery | Temporal portion of orbit | Graves’ disease | 1 | Normal | Steroid puls therapy, radiation | None |
| 2 | 70 | Male | Strabismus surgery | Temporal portion of orbit | Graves’ disease | 0 | High thyroid antibody | Thiamazole | T2DM, HT | |
| 3 | 75 | Male | Strabismus surgery | Temporal portion of orbit | Graves’ disease | 0 | Normal | Steroid puls therapy, radiation | None | |
| 4 | 51 | Male | Strabismus surgery | Temporal portion of orbit | Graves’ disease | 1 | Normal | Steroid puls therapy, radiation, thiamazole | None | |
| 5 | 69 | Female | Strabismus surgery | Temporal portion of orbit | Graves’ disease | 0 | Normal | Steroid puls therapy, radiation | HT | |
| Non-GO | 1 | 61 | Female | Strabismus surgery | Temporal portion of orbit | None | 0 | Normal | None | None |
| 2 | 59 | Male | Orbital fat herniation | Superior temporal portion of orbit | None | 0 | Normal | None | None | |
| 3 | 69 | Male | Orbital fat herniation | Superior temporal portion of orbit | None | 0 | Normal | None | HT | |
| 4 | 69 | Male | Orbital fat herniation | Superior temporal portion of orbit | None | 0 | Normal | None | HT | |
| 5 | 81 | Male | Orbital fat herniation | Superior temporal portion of orbit | None | 0 | Normal | None | HT |
T2DM: type 2 diabetes, HT: hypertension.
For 3D spheroid culture, 100% confluent HOFs obtained as described above were washed twice with phosphate buffered saline (PBS) and resuspended in a 2D culture medium. After centrifugation at 300 × g for 5 min, the HOF pellet was collected and resuspended in a spheroid medium composed of 2D culture medium supplemented with 0.25% Methocel. The number of HOFs in a 28-μL aliquot was adjusted to be approximately 20,000 and placed into each well of a hanging drop culture plate (No. HDP1385; Sigma-Aldrich) until day 6 with daily exchange of 14 μL of the medium.
Measurement of real-time cellular metabolic functions
The oxygen consumption rate (OCR) and extracellular acidification rate (ECAR) of planar cultured HOFs and GHOFs were measured using a Seahorse XFe96 Bioanalyzer (Agilent Technologies) according to the manufacturer’s instructions. In brief, approximately 20,000 of planar cultured cells in the absence or presence of 10 ng/ml M22, 10 μM IGF-1 and/or 10 μM Lins were placed in each well of an XFe96 Cell Culture Microplate (Agilent Technologies, #103,794–100) and the plates were incubated under standard humid and normoxia conditions until the day of assay. On the day of assay, the culture medium was replaced with 180 μL of assay buffer (Seahorse XF DMEM assay medium, Agilent Technologies, #103,575–100), supplemented with 5.5 mM glucose, 2.0 mM glutamine, and 1.0 mM sodium pyruvate (pH 7.4). The assay plates were then incubated in a CO2-free incubator at 37 °C for 1 h before the measurements. OCR and ECAR were measured using the Seahorse XFe96 Bioanalyzer under a 3-min mixing and 3-min measuring protocol at baseline and following the injection of oligomycin (final concentration: 2.0 μM), carbonyl cyanide p-trifluoromethoxyphenylhydrazone (FCCP, final concentration: 5.0 μM), a mixture of rotenone/antimycin A (final concentration: 1.0 μM), and 2-deoxyglucose (2-DG, final concentration: 10 mM). After completion of the assay, the assay buffer was removed and cells on the wells were lysed with 10 μL of Cell Lytic buffer (#C3228, Sigma-Aldrich), and then the amount of total cellular protein was measured by the BCA protein assay (TaKaRa Bio, Shiga, Japan). OCR and ECAR values were normalized to total cellular protein.
Calculation of metabolic indices
Metabolic indices were calculated using the OCR and ECAR values obtained by the Seahorse XFe96 Bioanalyzer as follows. Basal respiration was determined by subtracting OCR with rotenone/antimycin A from OCR at baseline. ATP-linked respiration was determined by the difference in OCR after the addition of oligomycin. Maximal respiration was determined by subtracting OCR with rotenone/antimycin A from OCR after the addition of FCCP. Non-mitochondrial respiration was determined as OCR with rotenone/antimycin A. Basal ECAR was determined by subtracting ECAR with 2-DG from ECAR at the baseline. Glycolytic capacity was determined by subtracting ECAR with 2-DG from ECAR with oligomycin. Glycolytic reserve was determined by the difference in ECAR after the addition of oligomycin. Non-glycolytic acidification was determined as the end point of ECAR after injection of 2-DG.
Physical property measurements of 3D spheroids
The 3D spheroid configuration was observed by using a phase contrast microscope (PC, Nikon ECLIPSE TS2; Tokyo, Japan) as described previously13. For measurement of the size of each 3D spheroid, the largest cross-sectional area (CSA) of PC image was measured and analyzed by the Image-J software version 1.51n (National Institutes of Health, Bethesda, MD)13.
The micro-indentation force (μN) required to achieve a 50% deformation of the 3D HOF spheroids during a period of 20 s was measured using a micro-squeezer (CellScale, Waterloo, ON, Canada) as described previously and force/displacement (μN/μm) was calculated13.
Immunocytochemistry of 3D spheroid
Immunocytochemistry of the 3D HOF and GHOF spheroids was carried out using the following first antibodies: an anti-human COL1, COL4, COL6, or FN rabbit antibody (1:200 dilution) and a mixture of second antibody, a goat anti-rabbit IgG (488 nm, 1:1000 dilution), phalloidin (594 nm, 1:1000 dilutions) and DAPI (1:1000 dilutions). Confocal immunofluorescent images were obtained as described in recent reports18,19.
Quantitative PCR
Total RNA extracted from 3D spheroids at Day 6 under several conditions as described above using an RNeasy mini kit (Qiagen, Valencia, CA) and following reverse transcription by the SuperScript IV kit (Invitrogen) were processed according to the manufacturer’s instructions. cDNA levels expressed as fold changes relative to the expression of a housekeeping 36B4 (Rplp0) gene were then calculated. The sequences of the primers and Taqman probes used are shown in Table 2.
Table 2.
The sequences of the primers and Taqman probes used in the present study.
| Sequence | Exon Location | RefSeqNumber | ||
|---|---|---|---|---|
| human RPLP0 | Probe | 5’-/56-FAM/CCCTGTCTT/ZEN/CCCTGGGCATCAC/3IABkFQ/−3’ | 2–3 | NM_001002 |
| Primer2 | 5’-TCGTCTTTAAACCCTGCGTG-3’ | |||
| Primer1 | 5’-TGTCTGCTCCCACAATGAAAC-3’ | |||
| human COL1A1 | Probe | 5’-/56-FAM/TCGAGGGCC/ZEN/AAGACGAAGACATC/3IABkFQ/−3’ | 1–2 | NM_000088 |
| Primer2 | 5’-GACATGTTCAGCTTTGTGGAC-3’ | |||
| Primer1 | 5’-TTCTGTACGCAGGTGATTGG-3’ | |||
| human COL4A1 | Probe | 5’-/56-FAM/TCATACAGA/ZEN/CTTGGCAGCGGCT/3IABkFQ/−3’ | 51–52 | NM_001845 |
| Primer2 | 5’-AGAGAGGAGCGAGATGTTCA-3’ | |||
| Primer1 | 5’-TGAGTCAGGCTTCATTATGTTCT-3’ | |||
| human COL6A1 | Probe | /56-FAM/CAGGTTTCG/ZEN/GTCACAGCGGTAGT/3IABkFQ/ | 2–3 | NM_001848 |
| Primer2 | 5’-CCTCGTGGACAAAGTCAAGT-3’ | |||
| Primer1 | 5’-GTGAGGCCTTGGATGATCTC-3’ | |||
| human FN1 | Probe | /56-FAM/TACAGCTTA/ZEN/TTCTCCCTCGCCCAG/3IABkFQ/ | 3–4 | NM_212482 |
| Primer2 | 5’-CGTCCTAAAGACTCCATGATCTG-3’ | |||
| Primer1 | 5’-ACCAATCTTGTAGGACTGACC-3’ | |||
| human ACTA2 | Probe | 5’-/56-FAM/AGACCCTGT/ZEN/TCCAGCCATCCTTC/3IABkFQ/−3’ | 8–9 | NM_001613 |
| Primer2 | 5’-AGAGTTACGAGTTGCCTGATG-3’ | |||
| Primer1 | 5’-CTGTTGTAGGTGGTTTCATGGA-3’ | |||
| human IL6 | Probe | 5’-/56-FAM/CAACCACAA/ZEN/ATGCCAGCCTGCT/3IABkFQ/−3’ | 4–5 | NM_000600 |
| Primer2 | 5’-GCAGATGAGTACAAAAGTCCTGA-3’ | |||
| Primer1 | 5’-TTCTGTGCCTGCAGCTTC-3’ | |||
| human IL1b | Probe | 5’-/56-FAM/AGAAGTACC/ZEN/TGAGCTCGCCAGTGA/3IABkFQ/−3’ | 1–3 | NM_000576 |
| Primer2 | 5’-CAGCCAATCTTCATTGCTCAAG-3’ | |||
| Primer1 | 5’-GAACAAGTCATCCTCATTGCC-3’ | |||
| human CCL2 | Probe | 5’-/56-FAM/AGACGCGGA/ZEN/CGATGATGTGAACAC/3IABkFQ/−3’ | 6–7 | NM_004360 |
| Primer2 | 5’-AGCAGCCACCTTCATTCC-3’ | |||
| Primer1 | 5’-GCCTCTGCACTGAGATCTTC-3’ | |||
| human LOX | Probe | 5’-/56-FAM/CACAATTTC/ZEN/ACCGTATTAGAAGGCAAAGCA/3IABkFQ/−3’ | 6–7 | NM_002317 |
| Primer2 | 5’-TTCCCACTTCAGAACACCAG-3’ | |||
| Primer1 | 5’-ACATTCGCTACACAGGACATC-3’ | |||
| human CTGF | Probe | 5’-/56-FAM/CAGCCAGAA/ZEN/AGCTCAAACTTGATAGGC/3IABkFQ/−3’ | 4–5 | NM_001901 |
| Primer2 | 5’-GCTCGGTATGTCTTCATGCTG-3’ | |||
| Primer1 | 5’-GAAGCTGACCTGGAAGAGAAC-3’ | |||
| human MMP2 | Probe | 5’-/56-FAM/TTCTGTCCC/ZEN/CATGAAGCCCTGTTC/3IABkFQ/−3’ | 6–7 | NM_004530 |
| Primer2 | 5’-TCCACCACCTACAACTTTGAG-3’ | |||
| Primer1 | 5’-GTGCAGCTGTCATAGGATGT-3’ | |||
| human MMP3 | Probe | 5’-/56-FAM/AGCTTCAGT/ZEN/GTTGGCTGAGTGAAAGA/3IABkFQ/−3’ | 4–5 | NM_002422 |
| Primer2 | 5’-TGAACAATGGACAAAGGATACAAC-3’ | |||
| Primer1 | 5’-TGAGTGAGTGATAGAGTGGGT-3’ | |||
| human MMP9 | Probe | 5’-/56-FAM/CCAGGAGGA/ZEN/AAGGCGTGTGC/3IABkFQ/−3’ | 3–4 | NM_004994 |
| Primer2 | 5’-ACATCGTCATCCAGTTTGGTG-3’ | |||
| Primer1 | 5’-CGTCGAAATGGGCGTCT-3’ | |||
| human MMP14 | Probe | 5’-/56-FAM/TTGTTCCTC/ZEN/AAAGTGCCTGTTTGCTC/3IABkFQ/−3’ | 1–1 | NM_004995 |
| Primer2 | 5’-TTCGCCGACTAAGCAGAAG-3’ | |||
| Primer1 | 5’-CTTGAATTCCTAGACCGCTGT-3’ |
Statistical analysis
All statistical analyses were performed using Graph Pad Prism 8 or 9 (GraphPad Software, San Diego, CA). To analyze the differences between groups, grouped analysis with two-way analysis of variance (ANOVA) followed by Tukey’s multiple comparison test was performed. Data are presented as arithmetic means ± standard error of the mean (SEM). The p value less than 0.05 was considered to be statistically significant.
Results
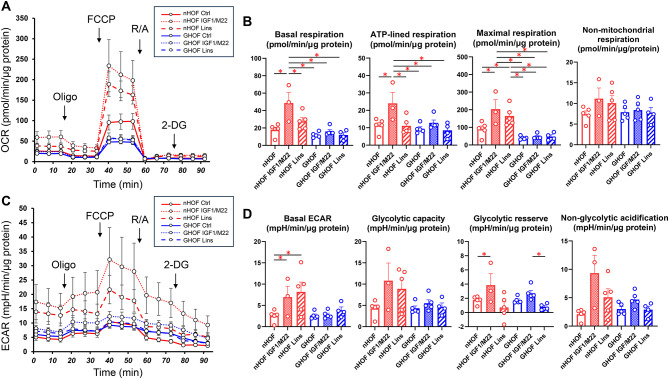
To study the pathophysiological significance of IGF1R and TSHR stimulation and/or IGF1R inhibition of orbital fatty tissue without or with GO pathogenesis, we initially evaluated the effects of IGF1/M22 stimulation and /or Lins on cellular metabolic functions of non-GO-related human orbital fibroblast (HOFs) and GO-related human orbital fibroblast (GHOF). As shown in Fig. 1, simultaneous stimulation of both IGF-1R and TSHR by IGF-1 and M22, respectively, caused significant increases in both mitochondrial and glycolytic functions in HOFs, but such effects were substantially less in GHOFs. In addition, treatment with Lins alone induced significant enhancement of maximal respiration in HOFs but not in GHOFs. These findings suggest that IGF-1R and TSHR may already be stimulated in GHOFs and that the diverse effects of treatment with Lins can be observed only in HOFs, in which IGF-1R- and TSHR-mediated signals are not activated.
Fig. 1.
Effects of IGF-1, M22 and/or linsitinib (Lins) on the cellular metabolic functions in planar cultured HOFs and GHOFs. Planar cultured HOFs and GHOFs that were treated without (control: Ctrl) and with both 10 μM IGF-1 and 10 ng/ml M22 or 10 μM Lins were subjected to a real-time metabolic function analysis using a Seahorse XFe96 Bioanalyzer. Panel A; plot of OCR values, Panel B; key parameters of mitochondrial functions, Panel C: plot of ECAR values, Panel D; key parameters of glycolytic functions. All experiments were performed using fresh preparations (n = 3–5). Data are presented as means ± the standard error of the mean (SEM). *p < 0.05.
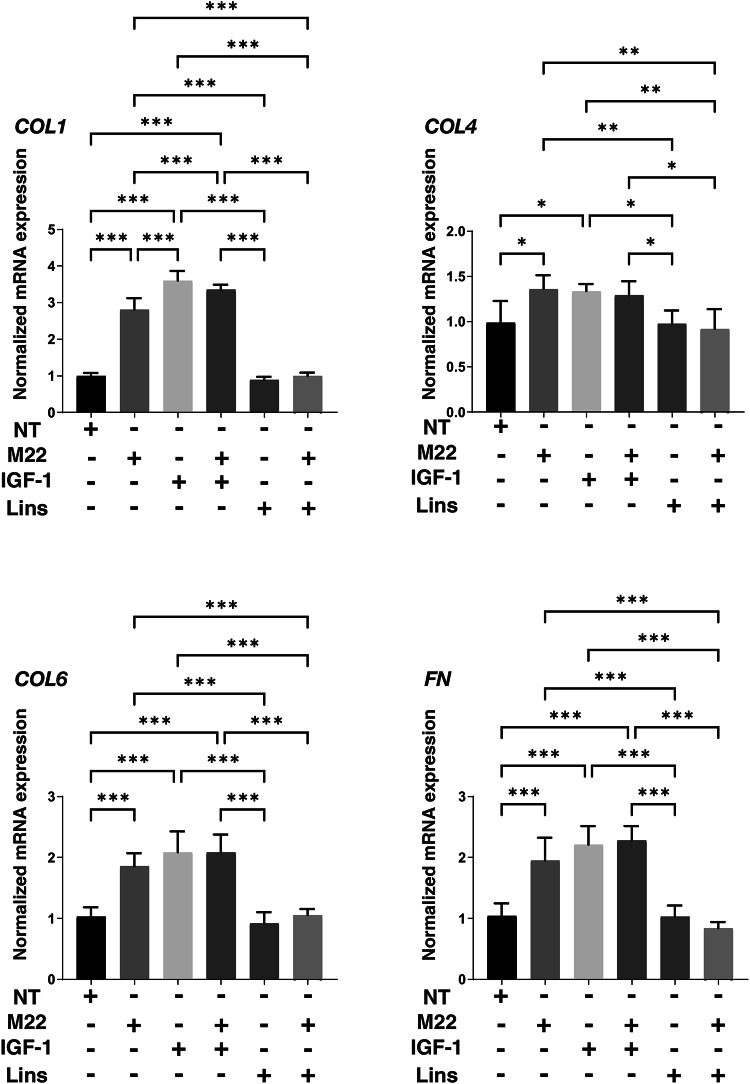
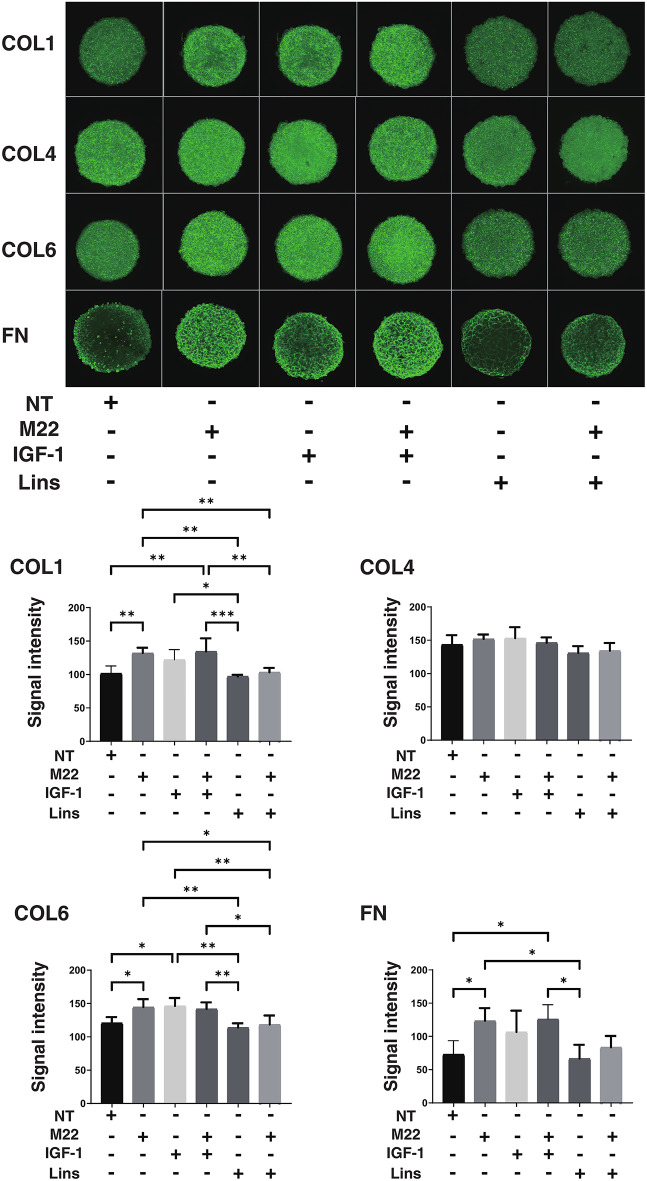
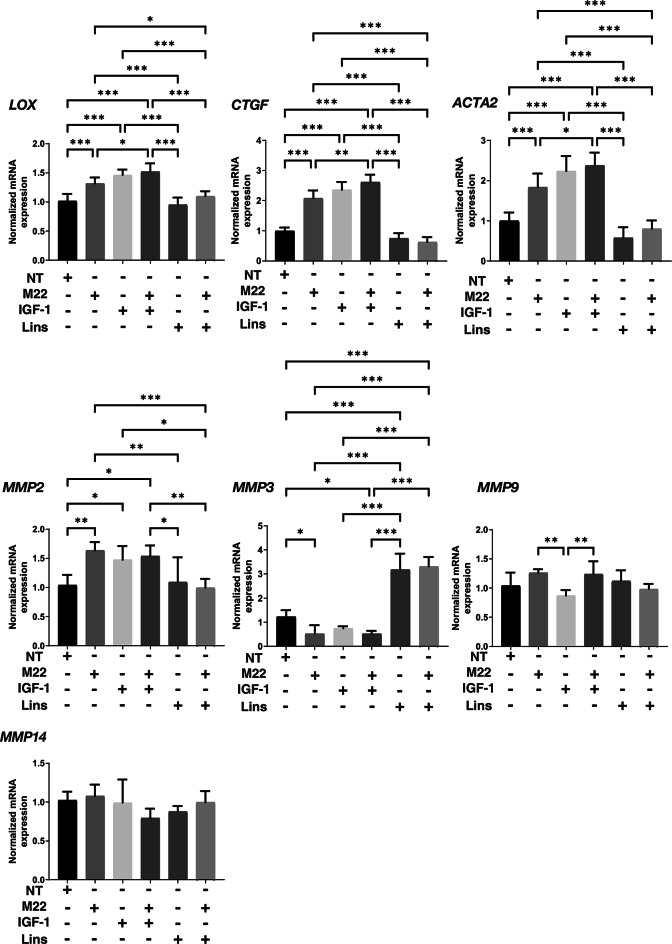
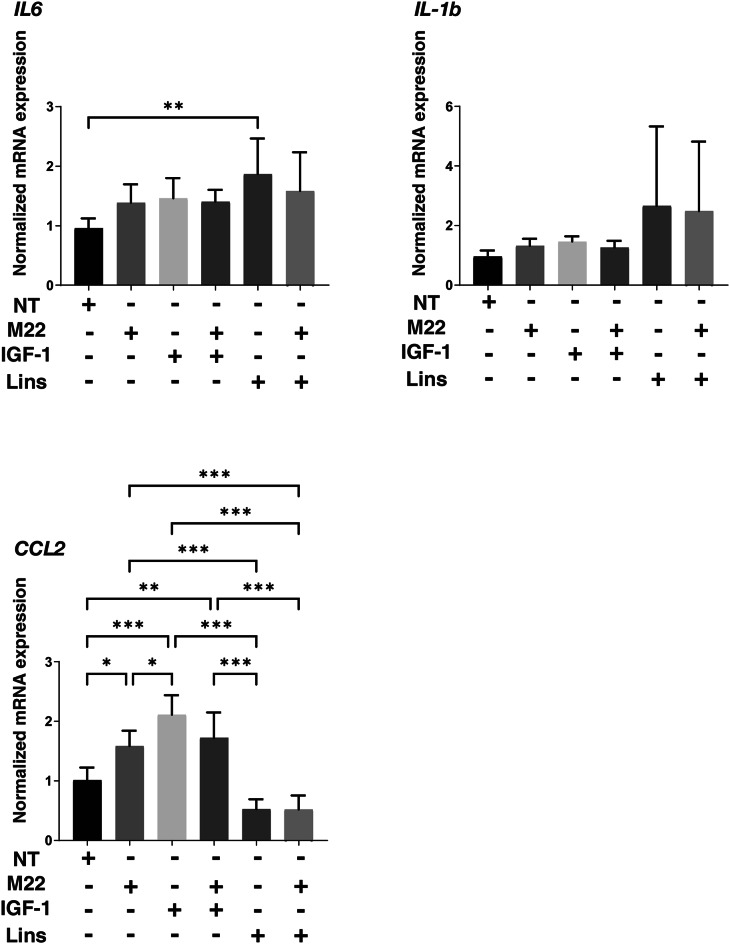
Next, to study the effects of IGF-1R stimulation, TSHR stimulation and/or Lins on 3D HOF spheroids, 1) analysis of physical properties, size and stiffness, 2) analysis of the expression of major ECM proteins including COL1, COL4, COL6 and FN by qPCR and immunocytochemistry, and 3) qPCR for inflammatory cytokines (IL6, IL1b), CCL2, ECM modulators (LOX, CTGF, MMP2, 3, 9 and 14) and ACTA2 were performed. In terms of physical properties, although the size of 3D HOF spheroids was not significantly modulated except for an increase induced by M22 and Lins (Fig. 2), their stiffness was substantially modulated (Fig. 3); that is, 1) IGF1 or M22, but not Lins, used alone increased the stiffness, 2) both IGF1 and M22 caused a further increase in stiffness, and 3) Lins cancelled the M22-induced increase in stiffness. The effect of Lins on stiffness of 3D HOF spheroids was rationally supported by changes in the expression levels of all four ECMs including COL1, COL4 COL6 and FN revealed by qPCR (Fig. 4) and immunolabeling (Fig. 5). In addition, qPCR analysis indicated that the gene expression levels of ACTA2, CCL2, CTGF, LOX and MMP2 also similarly fluctuated (Fig. 6). In contrast, the mRNA expression of the inflammatory cytokines IL6 and IL1b was significantly and relatively up-regulated, respectively, by Lins, (Fig. 7) and among the other MMPs, the expression of MMP3 was significantly up-regulated by Lins and Lins/M22 despite no significant changes in MMP1 and MMP14 (Fig. 6). Collectively, the results suggested that Lins may have beneficial effects of decreasing IGF-1 and M22-induced fibrogenesis of 3D HOF spheroids despite stimulation by inflammation.
Fig. 2.
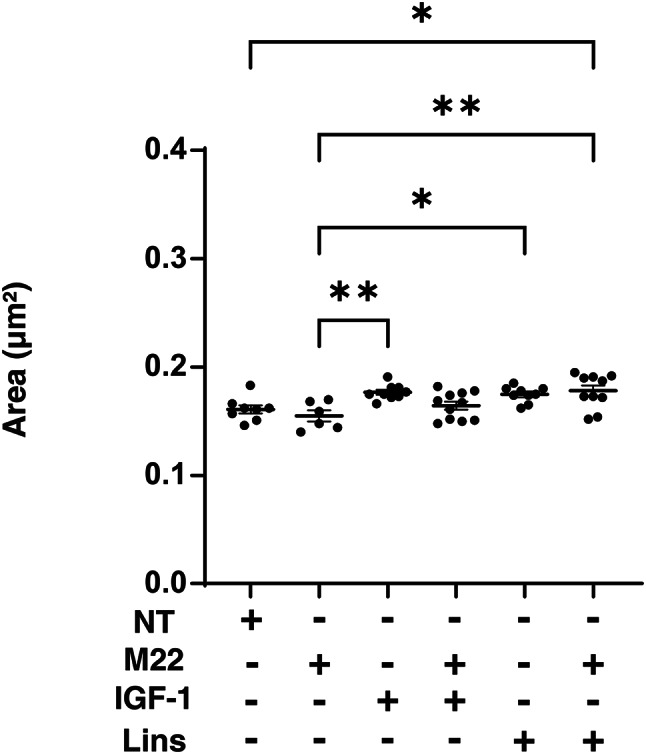
Effects of M22, IGF-1 and/or linsitinib on the mean sizes of 3D HOF spheroids. Panel A) Mean area sizes (μm2) of 3D HOF spheroids cultured in the absence (nontreated control, NT) or presence of 10 ng/ml M22, 10 μM IGF-1 and/or 10 μM linsitinib (Lins) for 6 days are plotted. Panel B) Representative phase contrast images of the 3D HOF spheroids under several conditions at Day 6 are shown (scale bar: 100 μm). All experiments were performed in triplicate using fresh preparations, each consisting of 6–11 spheroids. Data are presented as arithmetic means ± standard error of the mean (SEM). *P < 0.05, **P < 0.01.
Fig. 3.
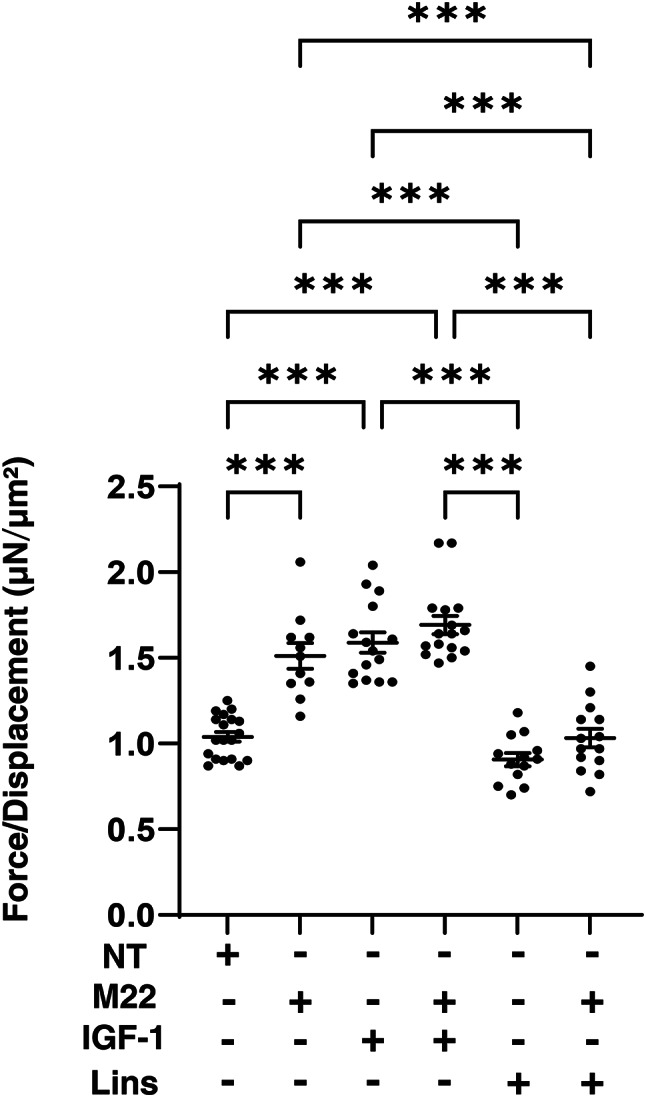
Effects of M22, IGF-1 and/or linsitinib on stiffness of 3D HOF spheroids. Living 3D HOF spheroids cultured in the absence (nontreated control, NT) or presence of 10 ng/ml M22, 10 μM IGF-1 and/or 10 μM linsitinib (Lins) for 6 days were each directly compressed until inducing their semi-diameter by a micro-squeezer during a period of 20 s. The index of the required micro-indentation force (μN) divided by semi-diameter (μm) was plotted. All experiments were performed in triplicate using fresh preparations, each consisting of 11–19 spheroids. Data are presented as arithmetic means ± standard error of the mean (SEM). ***P < 0.005.
Fig. 4.
mRNA expression of ECMs in 3D HOF spheroids under several conditions. Six-day cultured 3D HOF spheroids in the absence (nontreated control, NT) or presence of 10 ng/ml M22, 10 μM IGF-1 and/or 10 μM linsitinib (Lins) were subjected to qPCR analysis to estimate the mRNA expression of ECMs (COL1: collagen 1, COL4: collagen 4, COL6: collagen 6, and Fn: fibronectin. All experiments were performed in duplicate using fresh preparations, each of which consisted of 16 spheroids. Data are presented as arithmetic means ± standard error of mean (SEM). *P < 0.05, ** P < 0.01 (ANOVA followed by a Tukey’s multiple comparison test).
Fig. 5.
Immunolabeling of ECMs in 3D HOF spheroids under several conditions. Six-day cultured 3D HOF spheroids in the absence (nontreated control, NT) or presence of 10 ng/ml M22, 10 μM IGF-1 and/or 10 μM linsitinib (Lins) were subjected to immunocytechemistry using specific antibodies against COL1: collagen 1, COL4: collagen 4, COL6: collagen 6 and Fn: fibronectin. Representative confocal images are shown. All experiments were performed in duplicate using fresh preparations, each of which consisted of 6 spheroids. Scale bar: 100 μM.
Fig.6.
mRNA expression of LOX, CTGF, ACTA2, and MMPs in 3D HOF spheroids under several conditions. Six-day cultured 3D HOF spheroids in the absence (nontreated control, NT) or presence of 10 ng/ml M22, 10 μM IGF-1 and/or 10 μM linsitinib (Lins) were subjected to qPCR analysis to estimate the mRNA expression of LOX: lysil oxidase, CTGF: Connective Tissue Growth Factor, ACTA2: actin alpha 2, MMP2, 3, 9 and 14. All experiments were performed in duplicate using fresh preparations, each of which consisted of 16 spheroids. Data are presented as arithmetic means ± standard error of the mean (SEM). *P < 0.05, ** P < 0.01 (ANOVA followed by Tukey’s multiple comparison test).
Fig. 7.
mRNA expression of IL6, IL1β, and CCL2 in 3D HOF spheroids under several conditions. Six-day cultured 3D HOF spheroids in the absence (nontreated control, NT) or presence of 10 ng/ml M22, 10 μM IGF-1 and/or 10 μM linsitinib (Lins) were subjected to qPCR analysis to estimate the mRNA expression of IL1β: interleukin-1β,IL6: interleukin-6,and CCL2:C–C motif chemokine ligand 2. All experiments were performed in duplicate using fresh preparations, each of which consisted of 16 spheroids. Data are presented as arithmetic means ± standard error of the mean (SEM). *P < 0.05, ** P < 0.01 (ANOVA followed by Tukey’s multiple comparison test).
Discussion
It was reported that biological interactions between TSHR and IGF-1R signaling occur in primary cultures of GHOFs16,17,20and that the interactions induce a synergistic increase in the secretion of hyaluronic acid (HA), a major bioproduct in the pathogenesis of GO3. It has been shown that autoantibodies against TSHR in peripheral blood circulation are responsible for the TSHR stimulation and that treatment of GHOFs with M22, a human monoclonal stimulating TSHR antibody21, resulted in synergistic stimulation of HA secretion15. However, the mechanism for IGF-1R stimulation is still unclear because it was reported that autoantibodies in GO patients bind to and directly activate IGF-1R22,23and that IGF-1R is activated not by IGF-1R antibodies but by crosstalk with TSHR activation by TSHR antibodies24. Marcus-Samuels et al. reported that GO-related immunoglobulins did not directly activate IGF-1R since the formation of pAKT25, a major mediator of IGF-1R signaling stimulating IGF-1R antibodies, was not detected in sera from patients with GO26. Therefore, based on these observations, various autoantibodies that bind to and stimulate TSHR27and IGF-1R28,29 have been used in studies on the pathogenesis of GO. In the present study, M22 and IGF-1 were used to stimulate both TSHR and IGF-1R of HOFs and GHOFs and the effect of an IGF-1R antagonist, Lins, on 2D and 3D cultured cells was investigated. It was found that 1) IGF-1/M22 enhanced cellular metabolic functions and their effects on HOFs were much more potent than their effects on GHOFs, suggesting that both receptors of GHOFs were already stimulated, 2) Lins had effects similar to those IGF-1/M22 on cellular biological functions of HOFs but not on cellular biological functions of GHOFs, 3) the stiffness but not the size of 3D HOF spheroids was substantially increased by IGF-1 and/or M22, although Lins markedly inhibited the M22 and/or IGF-1-induced increase in stiffness despite the fact that Lins alone had no effect, and 4) the mRNA expression of several genes including genes for ECM proteins and their modulators showed fluctuations similar to the changes of 3D spheroid stiffness, though Lins induced up-regulation of inflammatory cytokines and MMP3. Collectively, the results indicated that IGF1 and/or M22 synergistically induced fibrogenetic changes in 3D HOF spheroids, suggesting that IGF1 and M22-treated 3D HOF spheroids may become an in vitro GO model.
In our previous studies, we showed that TGF-β-induced fibrogenesis of 3D spheroids obtained from various sources of cells including human trabecular meshwork cells30, retinal pigment epithelium cells31and corneal stromal fibroblasts32induced a decrease in spheroid size and an increase in spheroid stiffness. However, in the case of M22 and/or IGF1-induced fibrogenesis in 3D HOF spheroids, only an increase in their stiffness was observed and spheroid size was not affected. Although mechanisms causing difference between TGF-β-induced fibrogenesis and M22 and/or IGF1-induced fibrogenesis remain to be elucidated, we speculate that M22 and/or IGF1 may induce not only an increase of fibrogenesis but also an increase of HA production. If our speculation is collect, it is reasonable to assume that sizes of 3D HOF spheroids were not altered by IGF-1 and/or M22 due to compensation of fibrogenesis-related decrease in the volume of 3D HOF spheroids by HA production. In support of this idea, it has been shown that TSHR and IGF-1R are within 40 nm of each other in orbital fibroblasts33and crosstalk of both receptor signaling increases with the secretion of HA3. We have developed in vitro models of various noncancerous and cancerous diseases by using a single-cell type related hanging drop culture method which the simplest technique is affected only by gravity force and buoyant force among various types of 3D spheroid culture methods, and found that the biological aspects of the spheroids generated by the hanging drop culture were totally different from those of 2D cultured cells34. In fact, we showed that spontaneous adipogenesis before adipogenic differentiation in 3T3-L1 spheroids35,36and spontaneous tight junction proteins in H9c2 cardiomyocyte spheroids37 but not in 2D cultured 3T3-L1 cells and 2D cultured H9c2 cells, respectively. Collectively, it was suggested that our developed spheroid culture method may provide preferable spatial environment for crosstalk of TSHR and IGF-1R.
The IGF-1R signaling axis is a complex and precisely regulated network for cell proliferation, growth, and survival, and IGF-1R is therefore a potential and promising therapeutic target for patients with various diseases and various malignancies including breast cancer, sarcoma, and non-small cell lung cancer (NSCLC)38. The following agents have been developed as: 1) IGF-1R blocking mechanism by IGF-1R binding monoclonal antibodies: dalotuzumab, figitumumab, cixutumumab, ganitumab, R1507 and AVE1642 and 2) IGF-1R pathway-targeting mechanisms by monoclonal antibodies against IGF-1 and IGF-2 (MEDI-573 and BI 836,845) and by a small molecule inhibitor for tyrosine kinase of IGF-1R (OSI-906)38. Among these, Lins (OSI-906) is a novel, highly selective and orally bioavailable dual insulin-like growth factor 1 (IGF-1R)/insulin receptor (IR) kinase inhibitor with a favorable preclinical profile9. A phase III clinical study of Lins in patients with locally advanced or metastatic adrenocortical carcinoma is currently being conducted along with several phase II clinical studies39,40. Regarding GO, it was shown that teprotumumab, a therapeutic IGF-I receptor inhibitor, dramatically alters the clinical course of GO and it has recently become the only medical therapy for GO thus far approved by the US FDA. In addition, thyrocytes treated with recombinant human TSH showed a rapid increase of phosphorylated ERK, which was completely blocked when combined with 1H7, an anti-IGF-1R blocking monoclonal antibody16. These collective findings indicate that treatment with Lins is a promising therapeutic strategy for GO. In fact, Lins prevented the development and progression of thyroid eye disease in the early stage of disease in an experimental murine model for Graves’ disease12. Collectively, our results obtained by using the in vitro 3D HOF spheroid model mimicking GO pathogenesis strongly suggested that Lins-induced IGF-1R inhibition may have a beneficial effect on GO-related fibrogenesis.
As limitations of the present study, there are unsolved issues regarding Lins including 1) the unfavorable effect of Lins in inducing up-regulation of inflammatory cytokines and 2) increase in cellular metabolic functions of HOFs. Therefore, further studies on characteristics of the pharmacological and pathological aspects of Lins toward down-stream signaling of IGF-1R of HOFs and GHOFs will be required.
Author contributions
F.H. and M.S. performed some of the experiments and analyzed the data and wrote the initial manuscript, T.S. performed some of the experiments, analyzed data, and edited the manuscript, A.U. performed some of the experiments and analyzed data, T.O. performed some of the experiments and analyzed data, N.N. performed some of the experiments and analyzed data, M.F. analyzed the data and provided conceptual advice, H.O. analyzed data and provided conceptual advice, M.W. designed the experiments, analyzed the data, and edited the manuscript.
Data availability
The datasets used and analysed during the current study are available from the corresponding author on reasonable request.
Declarations
Competing interests
The authors declare no competing interests.
Footnotes
Publisher’s note
Springer Nature remains neutral with regard to jurisdictional claims in published maps and institutional affiliations.
Fumihito Hikage, Megumi Suzuki contributed equally to this manuscript.
References
- 1.Davies, T. F. et al. Graves’ disease.. Nat. Rev. Dis. Primers.6, 52. 10.1038/s41572-020-0184-y (2020). [DOI] [PubMed] [Google Scholar]
- 2.Smith, T. J. & Hegedüs, L. Graves’ disease. N. Engl. J. Med.375, 1552–1565. 10.1056/NEJMra1510030 (2016). [DOI] [PubMed] [Google Scholar]
- 3.Bahn, R. S. Graves’ ophthalmopathy. N. Engl. J. Med.362, 726–738. 10.1056/NEJMra0905750 (2010). [DOI] [PMC free article] [PubMed] [Google Scholar]
- 4.Krieger, C. C., Perry, J. D., Morgan, S. J., Kahaly, G. J. & Gershengorn, M. C. TSH/IGF-1 receptor cross-talk rapidly activates extracellular signal-regulated kinases in multiple cell types. Endocrinology158, 3676–3683. 10.1210/en.2017-00528 (2017). [DOI] [PMC free article] [PubMed] [Google Scholar]
- 5.Dik, W. A., Virakul, S. & van Steensel, L. Current perspectives on the role of orbital fibroblasts in the pathogenesis of graves’ ophthalmopathy. Exp. Eye Res.142, 83–91. 10.1016/j.exer.2015.02.007 (2016). [DOI] [PubMed] [Google Scholar]
- 6.Turcu, A. F. et al. A small molecule antagonist inhibits thyrotropin receptor antibody-induced orbital fibroblast functions involved in the pathogenesis of graves ophthalmopathy. J Clin. Endocrinol. Metab.98, 2153–2159. 10.1210/jc.2013-1149 (2013). [DOI] [PMC free article] [PubMed] [Google Scholar]
- 7.Smith, T. J. TSH-receptor-expressing fibrocytes and thyroid-associated ophthalmopathy. Nature reviews Endocrinology11, 171–181. 10.1038/nrendo.2014.226 (2015). [DOI] [PMC free article] [PubMed] [Google Scholar]
- 8.Li, J., Choi, E., Yu, H. & Bai, X. C. Structural basis of the activation of type 1 insulin-like growth factor receptor. Nat. Commun.10, 4567. 10.1038/s41467-019-12564-0 (2019). [DOI] [PMC free article] [PubMed] [Google Scholar]
- 9.Mulvihill, M. J. et al. Discovery of OSI-906: a selective and orally efficacious dual inhibitor of the IGF-1 receptor and insulin receptor. Future. medicinal chemistry1, 1153–1171. 10.4155/fmc.09.89 (2009). [DOI] [PubMed] [Google Scholar]
- 10.Puzanov, I. et al. A phase I study of continuous oral dosing of OSI-906, a dual inhibitor of insulin-like growth factor-1 and insulin receptors, in patients with advanced solid tumors. Clinical cancer research : an official journal of the American Association for Cancer Research21, 701–711. 10.1158/1078-0432.Ccr-14-0303 (2015). [DOI] [PubMed] [Google Scholar]
- 11.Smith, T. J. & Janssen, J. Insulin-like growth factor-I receptor and thyroid-associated ophthalmopathy. Endocrine reviews40, 236–267. 10.1210/er.2018-00066 (2019). [DOI] [PMC free article] [PubMed] [Google Scholar]
- 12.Gulbins, A. et al. Linsitinib, an IGF-1R inhibitor, attenuates disease development and progression in a model of thyroid eye disease. Frontiers in endocrinology14, 1211473. 10.3389/fendo.2023.1211473 (2023). [DOI] [PMC free article] [PubMed] [Google Scholar]
- 13.Hikage, F., Atkins, S., Kahana, A., Smith, T. J. & Chun, T. H. HIF2A-LOX pathway promotes fibrotic tissue remodeling in thyroid-associated orbitopathy. Endocrinology160, 20–35. 10.1210/en.2018-00272 (2019). [DOI] [PMC free article] [PubMed] [Google Scholar]
- 14.Ichioka, H., Ida, Y., Watanabe, M., Ohguro, H. & Hikage, F. Prostaglandin F2α and EP2 agonists, and a ROCK inhibitor modulate the formation of 3D organoids of grave’s orbitopathy related human orbital fibroblasts. Exp. Eye. Res.10.1016/j.exer.2021.108489 (2021). [DOI] [PubMed] [Google Scholar]
- 15.Krieger, C. C., Neumann, S., Place, R. F., Marcus-Samuels, B. & Gershengorn, M. C. Bidirectional TSH and IGF-1 receptor cross talk mediates stimulation of hyaluronan secretion by graves’ disease immunoglobins. J. Clin. Endocrinol Metab100, 1071–1077. 10.1210/jc.2014-3566 (2015). [DOI] [PMC free article] [PubMed] [Google Scholar]
- 16.Tsui, S. et al. Evidence for an association between thyroid-stimulating hormone and insulin-like growth factor 1 receptors: a tale of two antigens implicated in grave’s disease. Journal of immunology (Baltimore Md: 1950)181, 4397–4405. 10.4049/jimmunol.181.6.4397 (2008). [DOI] [PMC free article] [PubMed] [Google Scholar]
- 17.Zhang, L. et al. Possible targets for nonimmunosuppressive therapy of graves’ orbitopathy. J. Clin. Endocrinol Metab99, E1183-1190. 10.1210/jc.2013-4182 (2014). [DOI] [PubMed] [Google Scholar]
- 18.Ida, Y., Hikage, F., Itoh, K., Ida, H. & Ohguro, H. Prostaglandin F2α agonist-induced suppression of 3T3-L1 cell adipogenesis affects spatial formation of extra-cellular matrix. Sci. Rep.10, 7958. 10.1038/s41598-020-64674-1 (2020). [DOI] [PMC free article] [PubMed] [Google Scholar]
- 19.Itoh, K., Hikage, F., Ida, Y. & Ohguro, H. Prostaglandin F2α agonists negatively modulate the size of 3D organoids from primary human orbital fibroblasts. Invest. Ophthalmol. Vis. Sci.61, 13. 10.1167/iovs.61.6.13 (2020). [DOI] [PMC free article] [PubMed] [Google Scholar]
- 20.Santisteban, P., Kohn, L. D. & Di Lauro, R. Thyroglobulin gene expression is regulated by insulin and insulin-like growth factor I, as well as thyrotropin, in FRTL-5 thyroid cells. J. Biol. Chem.262, 4048–4052 (1987). [PubMed] [Google Scholar]
- 21.Sanders, J. et al. Characteristics of a human monoclonal autoantibody to the thyrotropin receptor: sequence structure and function. Thyroid : official journal of the American Thyroid Association14, 560–570. 10.1089/1050725041692918 (2004). [DOI] [PubMed] [Google Scholar]
- 22.Smith, T. J. et al. re: "TSHR/IGF-1R cross-talk, not IGF-1R stimulating antibodies, mediates graves’ ophthalmopathy pathogenesis" (thyroid 2017;27:746–747). Thyroid : official journal of the American Thyroid Association27, 1458–1459. 10.1089/thy.2017.0281 (2017). [DOI] [PMC free article] [PubMed] [Google Scholar]
- 23.Neumann, S. & Gershengorn, M. C. Rebuttal to smith and janssen (thyroid 2017;27:746–747. DOI: 10.1089/thy.2017.0281). Thyroid : official journal of the American Thyroid Association27, 1459–1460. 10.1089/thy.2017.0472 (2017). [DOI] [PMC free article] [PubMed] [Google Scholar]
- 24.Krieger, C. C. et al. TSH/IGF-1 receptor cross talk in graves’ ophthalmopathy pathogenesis. J. Clin. Endocrinol. Metab.101, 2340–2347. 10.1210/jc.2016-1315 (2016). [DOI] [PMC free article] [PubMed] [Google Scholar]
- 25.Butler, A. A. et al. Insulin-like growth factor-I receptor signal transduction: at the interface between physiology and cell biology. Comparative biochemistry and physiology Part B, Biochemistry & molecular biology121, 19–26. 10.1016/s0305-0491(98)10106-2 (1998). [DOI] [PubMed] [Google Scholar]
- 26.Marcus-Samuels, B. et al. Evidence that graves’ ophthalmopathy immunoglobulins do not directly activate IGF-1 receptors. Thyroid : official journal of the American Thyroid Association28, 650–655. 10.1089/thy.2018.0089 (2018). [DOI] [PMC free article] [PubMed] [Google Scholar]
- 27.Rapoport, B. & McLachlan, S. M. The thyrotropin receptor in graves’ disease. Thyroid : official journal of the American Thyroid Association17, 911–922. 10.1089/thy.2007.0170 (2007). [DOI] [PubMed] [Google Scholar]
- 28.Smith, T. J., Hegedüs, L. & Douglas, R. S. Role of insulin-like growth factor-1 (IGF-1) pathway in the pathogenesis of graves’ orbitopathy. Best practice & research Clinical endocrinology & metabolism26, 291–302. 10.1016/j.beem.2011.10.002 (2012). [DOI] [PMC free article] [PubMed] [Google Scholar]
- 29.Smith, T. J. & Hoa, N. Immunoglobulins from patients with Graves’ disease induce hyaluronan synthesis in their orbital fibroblasts through the self-antigen, insulin-like growth factor-I receptor. J. Clin. Endocrinol. Metab.89, 5076–5080. 10.1210/jc.2004-0716 (2004). [DOI] [PubMed] [Google Scholar]
- 30.Watanabe, M., Ida, Y., Ohguro, H., Ota, C. & Hikage, F. Establishment of appropriate glaucoma models using dexamethasone or TGFβ2 treated three-dimension (3D) cultured human trabecular meshwork (HTM) cells. Sci. Rep.11, 19369. 10.1038/s41598-021-98766-3 (2021). [DOI] [PMC free article] [PubMed] [Google Scholar]
- 31.Suzuki, S. et al. Hypoxia differently affects TGF-β2-induced epithelial mesenchymal transitions in the 2D and 3D culture of the human retinal pigment epithelium cells. Int. J. Mol. Sci.10.3390/ijms23105473 (2022). [DOI] [PMC free article] [PubMed] [Google Scholar]
- 32.Umetsu, A. et al. TGF-β2 induces epithelial-mesenchymal transitions in 2D planer and 3D spheroids of the human corneal stroma fibroblasts in different manners. Biomedicines10.3390/biomedicines11092513 (2023). [DOI] [PMC free article] [PubMed] [Google Scholar]
- 33.Krieger, C. C., Boutin, A., Neumann, S. & Gershengorn, M. C. Proximity ligation assay to study TSH receptor homodimerization and crosstalk with IGF-1 receptors in human thyroid cells. Frontiers in endocrinology13, 989626. 10.3389/fendo.2022.989626 (2022). [DOI] [PMC free article] [PubMed] [Google Scholar]
- 34.Ohguro, H. et al. Application of single cell type-derived spheroids generated by using a hanging drop culture technique in various In vitro disease models: a narrow review. Cells10.3390/cells13181549 (2024). [DOI] [PMC free article] [PubMed] [Google Scholar]
- 35.Ohguro, H. et al. STAT3 Is the master regulator for the forming of 3D spheroids of 3T3-L1 preadipocytes. Cells10.3390/cells11020300 (2022). [DOI] [PMC free article] [PubMed] [Google Scholar]
- 36.Endo, K. et al. 3D culture induction of adipogenic differentiation in 3T3-L1 preadipocytes exhibits adipocyte-specific molecular expression patterns and metabolic functions. Heliyon9, e20713. 10.1016/j.heliyon.2023.e20713 (2023). [DOI] [PMC free article] [PubMed] [Google Scholar]
- 37.Watanabe, M. et al. mTOR Inhibitors modulate the physical properties of 3D spheroids derived from H9c2 cells. Int. J. Mol. Sci.10.3390/ijms241411459 (2023). [DOI] [PMC free article] [PubMed] [Google Scholar]
- 38.Iams, W. T. & Lovly, C. M. Molecular pathways: clinical applications and future direction of insulin-like growth factor-1 receptor pathway blockade. Clinical cancer research : an official journal of the American Association for Cancer Research21, 4270–4277. 10.1158/1078-0432.Ccr-14-2518 (2015). [DOI] [PMC free article] [PubMed] [Google Scholar]
- 39.Demeure, M. J., Bussey, K. J. & Kirschner, L. S. Targeted therapies for adrenocortical carcinoma: IGF and beyond. Hormones & cancer2, 385–392. 10.1007/s12672-011-0090-6 (2011). [DOI] [PMC free article] [PubMed] [Google Scholar]
- 40.Scagliotti, G. V. & Novello, S. The role of the insulin-like growth factor signaling pathway in non-small cell lung cancer and other solid tumors. Cancer treatment reviews38, 292–302. 10.1016/j.ctrv.2011.07.008 (2012). [DOI] [PubMed] [Google Scholar]
Associated Data
This section collects any data citations, data availability statements, or supplementary materials included in this article.
Data Availability Statement
The datasets used and analysed during the current study are available from the corresponding author on reasonable request.


