Abstract
Background
Polycystic ovary syndrome (PCOS) is a common endocrine disorder affecting women of reproductive age. It is characterized by symptoms such as hyperandrogenemia, oligo or anovulation and polycystic ovarian, significantly impacting quality of life. However, the practical implementation of machine learning (ML) in PCOS diagnosis is hindered by the limitations related to data size and algorithmic models. To address this research gap, we have increased the sample size in our study and aim to utilize two ML algorithms to analyze and validate diagnostic biomarkers, as well as explore immune cell infiltration patterns in PCOS.
Methods
We performed RNA-seq analysis on granulosa cell, including 13 samples from normal controls and 25 samples from women with PCOS. The data from our study were combined with publicly available databases. Batch effects were corrected using the ‘sva’ package in R software. Differential expression analysis was performed to identify genes that exhibited significant differences between the two groups. These differentially expressed genes (DEGs) were further analyzed for Gene Ontology (GO) terms and Kyoto Encyclopedia of Genes and Genomes (KEGG) pathways. Hub genes were selected by intersecting the results of both methods after using LASSO and SVM-RFE for central gene selection for DEGs. Receiver Operating Characteristic (ROC) curves were employed to verify the accuracy of models by SVM and XGBoost. CIBERSORT analysis was performed to determine the relative abundances of immune cell populations. GSEA was analyzed to illustrate the expression patterns of genes within highly enriched functional pathways. RT-qPCR was used to validate the reliability of hub genes.
Results
824 DEGs were found between the normal control and PCOS groups, including 376 upregulated and 448 downregulated genes. These DEGs were associated with endocytosis, salmonella infection and focal adhesion based on the KEGG enrichment analysis. Through overlapping LASSO and SVM-RFE algorithms, we identified four hub genes (CNTN2, CASR, CACNB3, MFAP2) that are significantly associated with the PCOS group. The diagnostic efficacy validation set using SVM and XGBoost yielded AUC values of 0.795 and 0.875, respectively, indicating their potential as diagnostic biomarkers. Consistent with the data analysis, the upregulation of CNTN2, CASR, CACNB3, and MFAP2 in PCOS was confirmed by RT-qPCR analysis on human granulosa cells. Furthermore, according to CIBERSORT analysis, a significant reduction in CD4 memory resting T cells was revealed in the PCOS group compared to the normal control group (P < 0.05).
Conclusions
This study identified CNTN2, CASR, CACNB3, and MFAP2 as potential diagnostic biomarkers for PCOS, which provides strong evidence for existing research on hub genes. Furthermore, the analysis of immune cell infiltration revealed the significant involvement of CD4 memory resting T cells in the onset and progression of PCOS. These findings shed light on potential mechanisms underlying PCOS pathogenesis and provide valuable insights for future research and therapeutic interventions.
Keywords: Polycystic ovary syndrome, Machine learning, Hub gene, Predictive models, Bioinformatics, CIBERSORT
Background
Polycystic ovary syndrome (PCOS) is a common endocrine disorder among women of reproductive age, typically starting in adolescence, with a prevalence of 6 − 21% [1]. PCOS is implicated as the cause in up to 30% of couples seeking infertility treatment. Moreover, it elevates the risk of obesity, insulin resistance (IR), metabolic syndrome, and cardiovascular diseases [2–4]. Research has found that early screening for PCOS is crucial and can lead to better long-term reproductive and metabolic outcomes [5]. A cross-sectional study investigating PCOS diagnostic experiences via an online questionnaire found that one third of women reported diagnostic delays [6]. Therefore, exploring potential biomarkers that contribute to the development of polycystic ovary syndrome is critical.
High-throughput sequencing technology is an effective method for identifying possible disease-associated genes for the discovery of new diagnostic and therapeutic approaches [7, 8]. Machine Learning (ML) is a statistical-based approach that employs algorithms to analyze previous data and predict output values with acceptable accuracy. It is particularly valuable for evaluating high-dimensional transcriptome data and identifying biologically significant genes [9, 10]. With the development of machine learning, more and more study applied ML to PCOS [11–13]. Previous study combining high-throughput sequencing analysis and ML to find potential biomarkers based on RNA-seq from public databases [12], but only use one algorithmic model to identify critical genes [13]. However, larger data size and more refined algorithmic models are required to make the real perception and application of ML in PCOS diagnosis clearer.
In our research, we incorporate RNA-seq and machine learning techniques to identify potential diagnostic biomarkers for PCOS and investigate the role of immune cell infiltration in PCOS pathogenesis. RNA-seq serves as a powerful tool enabling comprehensive analysis of gene expression profiles, thus facilitating the identification of differentially expressed genes associated with PCOS. In order to identify potential biomarker genes for PCOS, which can enhance early diagnosis and intervention strategies, we utilized two ML algorithms (LASSO and SVM-RFE) based on our own RNA-seq data and publicly available databases. These algorithms have demonstrated robust performance even in complex RNA-seq datasets and are resilient to noise and outlier properties. Different from previous studies, we not only integrated multiple high-throughput sequencing data of PCOS for analysis, but more importantly, we combined two eligible machine learning algorithms to screen for signature genes. In addition, to determine the relative abundances of immune cell populations, we performed CIBERSORT analysis.
Methods
Study design and participant selection
RNA-seq was conducted on a total of 6 normal control individuals and 10 women diagnosed with PCOS. The study protocol received approval from the Ethics Committee of the Second Xiangya Hospital of Central South University, following the guidelines of the Council for International Organizations of Medical Sciences. Diagnosis of PCOS in women was based on the 2003 Rotterdam criteria, requiring the presence of at least two of the following clinical manifestations: (1) oligo-ovulation and/or anovulation; (2) clinical and/or biochemical hyperandrogenemia; and (3) polycystic ovaries. Prior to confirming the diagnosis of PCOS, individuals with thyroid disease, diabetes, hypertension, cardiovascular disease, endometriosis, neoplasia, renal disease, or recent use of hormonal drugs within the last three months were excluded. The normal control group consisted solely of infertile individuals with tubal occlusion or male azoospermia.
Collection of human granulosa cells and RNA extraction
We collected granulosa cells from 6 normal control individuals and 10 women with PCOS. All individuals were on the first in vitro fertilization cycle and treated with gonadotropin-releasing hormone antagonist regimen. Transvaginal ultrasound-guided follicular aspiration. Follicular fluid samples from each subject were centrifuged, and granulosa cells with the supernatant discarded were collected and washed in phosphate-buffered saline (PBS) as described previously [14]. Washed cell precipitates were resuspended in PBS, layered on Ficoll (LTS1077; TBD Science) solution and separated from erythrocytes by centrifugation. The cell layer at the Ficoll/PBS interface was aspirated and rinsed with PBS to remove residual Ficoll. The final cell sediment was incubated in DMEM-F12 medium containing 10% fetal bovine serum and 1% penicillin-streptomycin in a humidified atmosphere of 5% CO2 at 37 °C for 12 h. The granulosa cells were then collected for subsequent RNA extraction. Total RNA was extracted from collected human granulosa cells according to TRIzol reagent (CW0580S; Cowin Biotech) under the manufacturer’s protocol.
RNA sequencing (RNA-seq) analysis
After RNA quantification and identification, 1 mg of RNA was taken from each sample for sequencing. The mRNA was isolated and interrupted to fragment the mRNA. After synthesizing a two-stranded cDNA, the ends of the double-stranded cDNA are repaired. The junction is ligated to the cDNA with the addition of the A base at the 3’ end. The product is amplified. According to the product requirements, select the appropriate detection method for quality normal control of the library. After denaturing the PCR product to single-stranded, the single-stranded cyclic product is obtained by cyclization, and the linear DNA molecules that have not been cyclized are digested. The single-stranded cyclic DNA molecules are replicated by ring rolling to form a DNA nanoball (DNB) containing multiple copies. The resulting DNBs are spiked into mesh pores on the chip using high-density DNA nano-chip technology and sequenced by co-probe anchored polymerization (cPAS). After clustering generation, library preparations were sequenced on the DNBSEQ platform and 150 bp paired-end reads were generated. Salmon is a tool data for rapid quantification of transcripts from RNA-seq. Use salmon v1.10.2 mapping-based model to quantify pairs of clean reads with reference transcripts [15]. All downstream analyses are based on high quality clean data. Reference genome and gene model annotation files were downloaded directly from the Genome website. Bioinformatics analysis was performed using the R studio tool. P value < 0.05 and |logFC| > 0.495 were used to define significant differentially expressed genes.
Bioinformatics analysis
Data collection
Given the difficult accessibility of ovarian granulosa cells, in order to expand the sample to ensure the accuracy of the analysis, another 7 normal controls and 15 women with PCOS were obtained from two datasets of the GEO database [16], GSE34526 and GSE137684. Finally, 13 normal controls and 25 women with PCOS were enrolled in this study for analysis. The datasets GSE155489, GSE168404, and GSE95728 were utilized for external validation and underwent the same processing. Among these, GSE155489 contains 4 PCOS samples and 4 control samples, GSE168404 includes 5 PCOS samples and 5 control samples, and GSE95728 comprises 7 PCOS samples and 7 control samples. Datasets related to PCOS (Polycystic Ovary Syndrome) were screened in the Gene Expression Omnibus (GEO) database (http://www.ncbi.nlm.nih.gov/geo/) to identify datasets associated with Polycystic Ovary Syndrome. The search was conducted using the keywords “PCOS” or “granulosa cells”. Inclusion criteria for the PCOS group were as follows: (1) the dataset must include patient groups with Polycystic Ovary Syndrome and normal control groups; (2) sequencing should be performed on granulosa cells.
Differentially expressed genes analysis
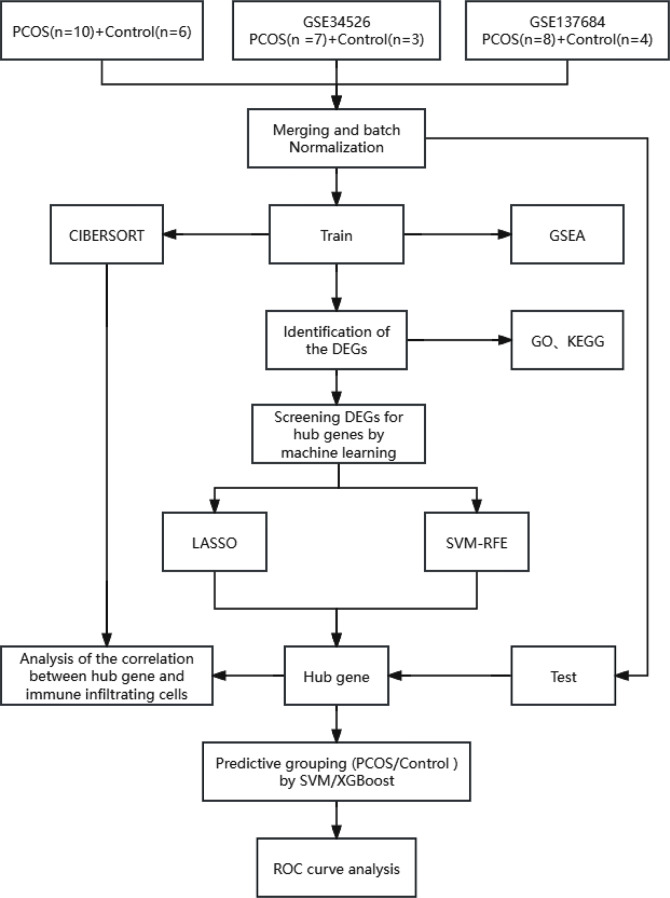
Data form RNA-seq analysis and two datasets, GSE34526 and GSE137684 were merged, and batch effects were corrected using the ‘sva’ package in R software. Additionally, visualization of the data was performed. The whole analytic workflow is shown in Fig. 1. After preparing the data, we conducted differentially expressed genes analysis on the PCOS datasets using the R package “LIMMA”, calculating the differences between the PCOS group and the normal control group. To better accommodate data variability, dynamic logFC was calculated by the following formulas to set a threshold to filter out genes with significant changes that may be biologically significant.
Fig. 1.
Flowchart describing the process of exploration. GSEA gene set enrichment analysis, CIBERSORT cell-type identification by estimating relative subsets of RNA transcripts, DEGs differentially expressed genes, GO gene ontology, KEGG kyoto encyclopedia of genes and genomes, LASSO least Absolute Shrinkage and Selection operator, SVM-RFE support vector machine recursive feature elimination, XGBoost extreme gradient boosting, ROC receiver operating characteristic curve
|logFC| > [mean (|logFC|) + 2sd (|logFC|)] [17].
Finally, the thresholds for differentially expressed genes (DEGs) analysis were set at P < 0.05 and |logFC| > 0.495.
Enhancement of functionality
To identify the functions of differential genes in PCOS, we employed the “clusterProfiler” R package to conduct enrichment analysis on Gene Ontology (GO) terms and Kyoto Encyclopedia of Genes and Genomes (KEGG) pathways.
Hub genes selection and validation
We employed both SVM-RFE and LASSO for the feature selection of hub genes associated with PCOS. SVM-RFE is a feature selection method based on Support Vector Machines, which operates by iteratively training SVM models and removes the least important features. Conversely, LASSO is a regularization technique commonly applied in linear regression models for feature selection. It introduces an L1 regularization term into the loss function, summing the absolute values of model coefficients. LASSO achieves automatic feature selection and sparse solutions by forcing certain coefficients to shrink towards zero. We chose to intersect the results of both methods to enhance the robustness of the feature selection process after using LASSO and SVM-RFE for central gene selection for DEGs, which helps to identify genes that show significance in various models. These two machine learning algorithms were implemented by R packages “e1071” and “glmnet”. Through the intersection analysis of features selected by the two algorithms, we ultimately identified the hub genes associated with PCOS.
We divided the datasets into training and validation sets. Within each set, we employed SVM and XGBoost models utilizing the identified hub genes to predict PCOS. The performance of these predictions was assessed based on Receiver Operating Characteristic (ROC) curve, with the Area Under the Curve (AUC) calculated to gauge the predictive power of the algorithms. Statistical significance was determined through a two-tailed test, with P < 0.05.
SHAP
We further illustrate the importance of features by employing SHAP (SHapley Additive exPlanations), which enables us to focus on feature engineering, thereby visualizing the impact of features on model predictions within machine learning (ML) models. We implement this using the R package “shapviz”.
Evaluation and correlation analysis of immune cells
For each sample, we performed CIBERSORT analysis to determine the relative abundances of immune cell populations. This was accomplished by R package “cibersort”, which leverages LM22 gene signature matrix to quantify levels of 22 distinct immune cell types [18]. Subsequently, comparisons were made between samples from PCOS and normal control subjects. We assessed the correlations between infiltrating immune cell and the hub genes using non-parametric (Spearman’s correlation) to elucidate their relationships.
GSEA
To illustrate the expression patterns of genes highly enriched functional pathways, we employed the “clusterProfiler” package in R for Gene Set Enrichment Analysis (GSEA). Statistical significance was defined by adjusted P < 0.05. Genome-wide enrichment analysis was conducted between patients with Polycystic Ovary Syndrome (PCOS) and normal control groups.
After identifying key hub genes using machine learning, we further explored the expression patterns of genes within the functional pathways associated with these individual hub genes. Specifically, we calculated the median expression value of each hub gene across all PCOS patients and categorized patients into “High” or “Low” expression groups based on whether their gene expression values exceeded the median. Subsequently, we performed GSEA on the high and low expression groups of these hub genes in PCOS patients to investigate the differences in gene expression patterns within functional pathways between the two groups. Using this approach, we studied the four hub genes that we identified.
Validation of hub genes by RT-qPCR in human granulosa cells
Real-time fluorescence quantitative PCR (RT-qPCR) was then performed to quantify the expression levels of hub genes (CNTN2, CASR, CACNB3, MFAP2) in the normal control and PCOS groups. The primer sequences of these four genes are shown in Table 1. Student’s t-test was used to statistically analyze the comparison between groups. Data are expressed as mean and standard error (SEM). P < 0.05 was considered as significant difference.
Table 1.
Primer sequence used in quantitative real-time qPCR analysis
| Target genes | Primer Sequence |
|---|---|
| CNTN2 | Forward 5’-GTCACGGGAGTACCAGAACG-3’ |
| CNTN2 | Reverse 5’-TGTAGACAAAGTACTGGGCATCG-3’ |
| CASR | Forward 5’-GCCAAGAAGGGAGAAAGAC-3’ |
| CASR | Reverse 5’-CACACTCAAAGCAGCAGG-3’ |
| CACNB3 | Forward 5’-TTGGACGCTGACACCATCAACC-3’ |
| CACNB3 | Reverse 5’-AGCGAATGAGACGCTGGAGTAC-3’ |
| MFAP2 | Forward 5’-TCCGCCGTGTGTACGTCATT-3’ |
| MFAP2 | Reverse 5’-CTGGCCATCACGCCACATTT-3’ |
Results
Screening of DEGs in PCOS
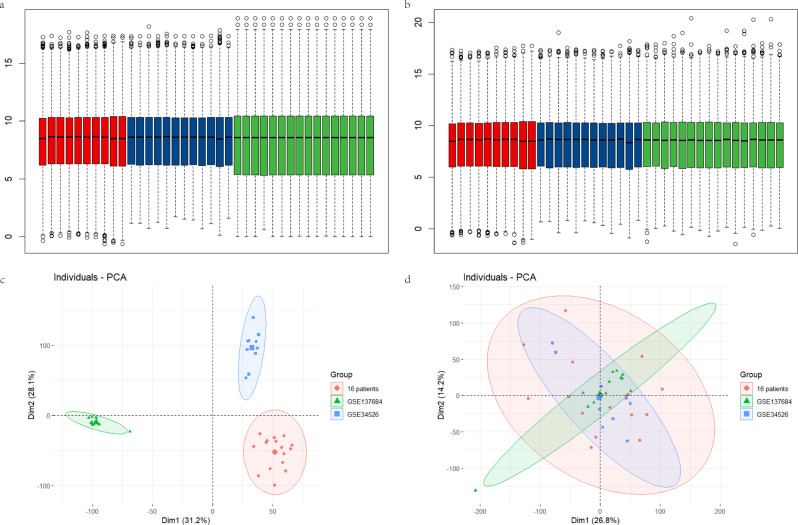
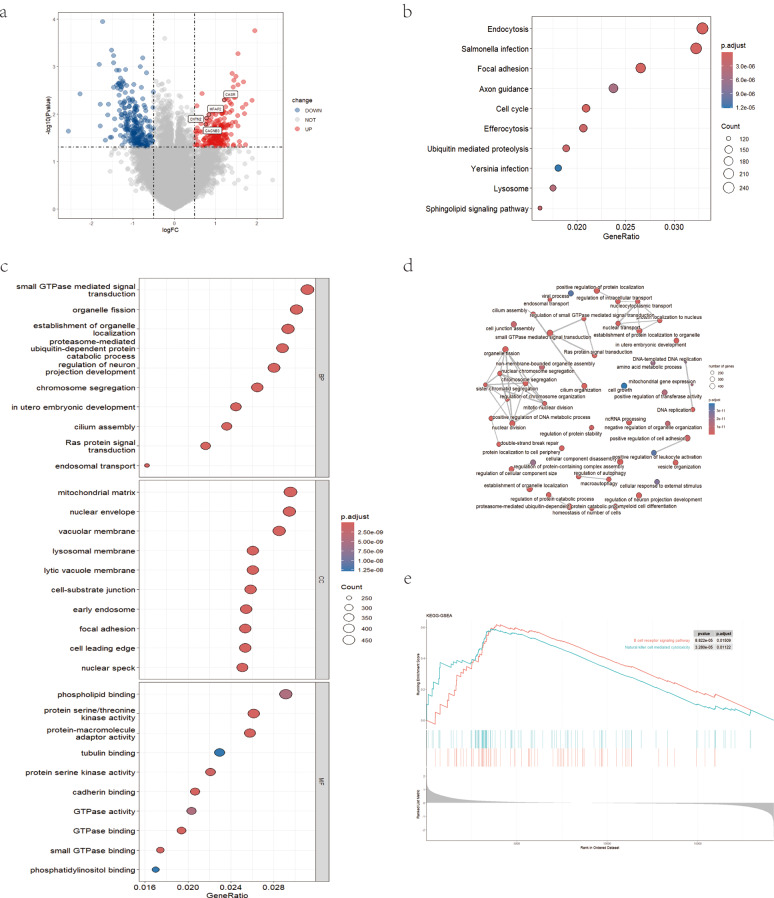
We combined the selected datasets (GSE34526, GSE137684, and data from 16 patients), adjusted for batch effects, and standardized the data to ensure consistent processing (Fig. 2). As shown in Fig. 3a, we identified 824 differentially expressed genes (DEGs), with 376 genes upregulated and 448 genes downregulated.
Fig. 2.
Standardization of samples and removal of batch effects. (a) Overall distribution of sample expression from three datasets, which are distinctly different, including data from 16 patients (green), GSE34526 (red), and GSE137684 (blue). (b) Expression levels of the three databases after the removal of batch effects. (c) PCA plots of the three databases before the elimination of batch effects. (d) PCA plots of the three databases after the batch effects have been removed
Fig. 3.
Analyses and identification of DEGs in PCOS and normal control groups. (a) Volcano plot of differential gene expression. (b, c) DEGs were represented by dot plots displaying GO and KEGG enrichment. (d) Network plot showing connection between functions from GO enrichment. (e) GSEA analysis of signature genes. DEGs differentially expressed genes, GO gene ontology, KEGG kyoto encyclopedia of genes and genomes, GSEA gene set enrichment analysis
Functional characterization of significant DEGs
To deepen our understanding of the DEGs, we conducted functional analyses. The KEGG enrichment analysis highlighted associations of DEGs with endocytosis, salmonella infection, and focal adhesion. We also observed enrichments in multiple signal transduction pathways, including the cell cycle, ubiquitin-mediated proteolysis, lysosome, and sphingolipid signaling pathway (Fig. 3b). Notably enriched biological processes included small GTPase mediated signal transduction, organelle fission, and establishment of organelle localization. In terms of cellular components, the GO analysis revealed an abundance of DEGs in the mitochondrial matrix, nuclear envelope, and vacuolar membrane. In the molecular function analysis, DEGs were particularly enriched in phospholipid binding, protein serine/threonine kinase activity, and protein-macromolecule adaptor activity (Fig. 3c, d). Furthermore, GSEA demonstrated DEGs were enriched in B cell receptor signaling pathway and natural killer cell-mediated cytotoxicity (Fig. 3e).
Identification of potential diagnostic genes based on machine learning algorithms and validation of diagnostic hub biomarkers
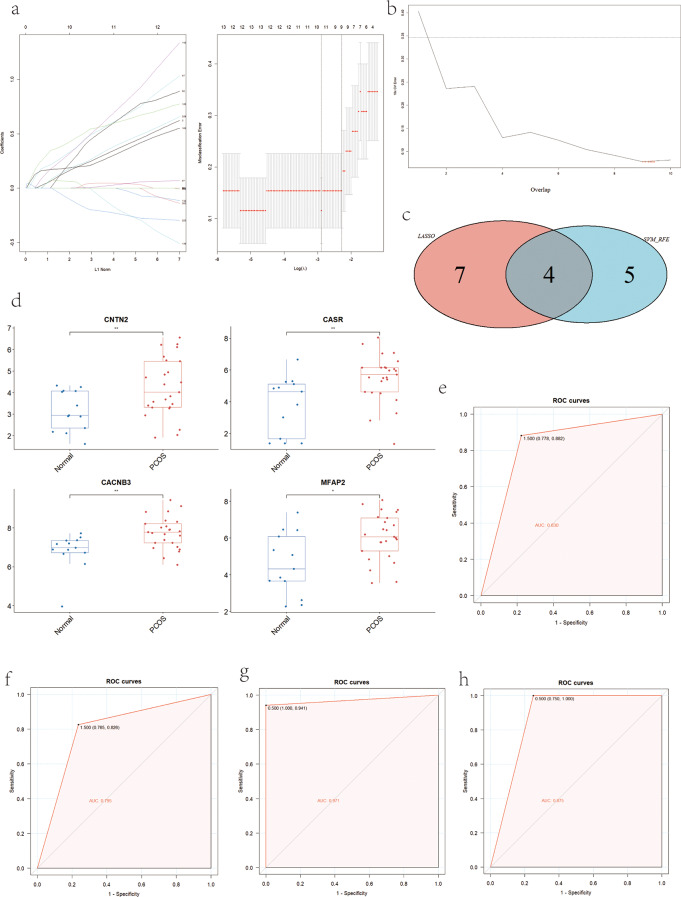
To identify hub genes with significant discriminative power between PCOS and normal controls, we employed the LASSO logistic regression algorithm and SVM-RFE. The LASSO logistic regression analysis identified 11 genes with non-zero coefficients based on the LASSO coefficient profiles. The optimal tuning parameter (λ) was determined to be 0.06851194 through the selection of the tuning parameter map (Fig. 4a). The SVM-RFE algorithm identified 9 genes with the lowest 10-fold cross-validation (CV) error (Fig. 4b). By overlapping the results from both algorithms, a Venn diagram in Fig. 4c revealed four gene targets (CNTN2, CASR, CACNB3, MFAP2) as potential diagnostic markers. The expression levels of these hub genes (CNTN2, CASR, CACNB3, MFAP2) were displayed in Fig. 4d, illustrating their upregulation in the PCOS group compared to the normal control group.
Fig. 4.
Screening candidate hub genes for PCOS diagnosis. (a) Based on LASSO logistic regression algorithm to screen diagnostic markers. (b) Application of SVM_RFE for biomarker screening. (c) Venn diagram showed the intersection of diagnostic markers obtained by the two algorithms. (d) Expression level of hub genes (CNTN2, CASR, CACNB3, MFAP2). (e)The ROC curve of the diagnostic efficacy in training set based on SVM_RFE. (f) The ROC curve of the diagnostic efficacy in validation set based on SVM_RFE. (g) The ROC curve of the diagnostic efficacy in training set based on XGBoost. (h) The ROC curve of the diagnostic efficacy in validation set based on XGBoost. SVM-RFE support vector machine recursive feature elimination, LASSO least Absolute Shrinkage and Selection operator, XGBoost extreme gradient boosting, ROC receiver operating characteristic curve
To validate the model developed by LASSO and SVM, we utilized ROC curves to assess their diagnostic capabilities. A higher area under the curve (AUC) value, closer to 1.0, indicates a more reliable diagnostic model. In this study, the AUC values for the hub genes (CNTN2, CASR, CACNB3, MFAP2) in the training and validation sets, as determined by SVM, were 0.830 [0.778, 0.882] and 0.795 [0.765, 0.826], respectively (Fig. 4e, f). The AUC values for the diagnostic efficacy of hub genes (CNTN2, CASR, CACNB3, MFAP2) in the training and validation sets, as determined by XGBoost, were 0.971 [0.941, 1.000] and 0.875 [0.750, 1.000], respectively (Fig. 4g, h). These results indicate that the hub genes perform well in both the training and validation sets, highlighting their potential as diagnostic biomarkers. It is noteworthy that the XGBoost model achieved a particularly high AUC value in the training set, suggesting its favorable generalization ability. Overall, these findings demonstrate the excellent diagnostic capabilities of machine learning models constructed with the four identified potential biomarkers (CNTN2, CASR, CACNB3, MFAP2).
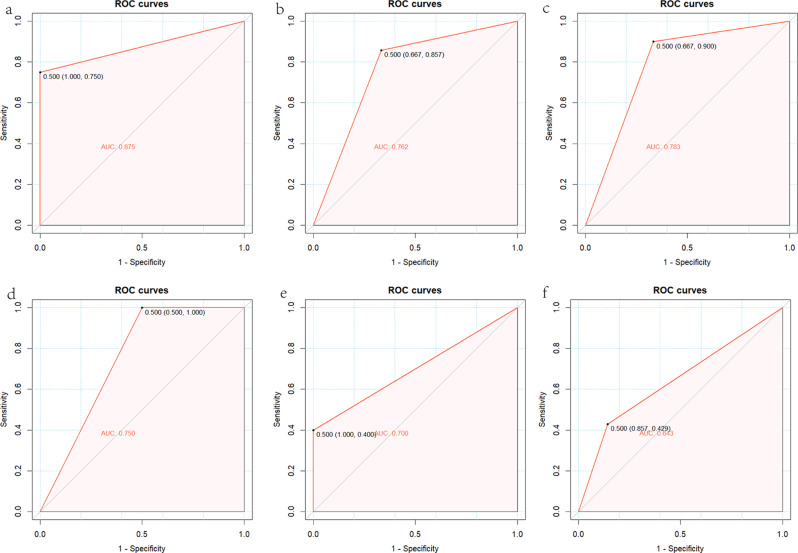
To further confirm the generalizability of the identified potential biomarkers, we have validated the reliability of the model using XGBoost on six datasets including GSE137684, GSE34526, data from 16 patients, GSE155489, GSE168404, and GSE95728. The AUC values for the diagnostic efficacy of hub genes (CNTN2, CASR, CACNB3, MFAP2) in internal datasets were 0.875 [0.750, 1.000] for GSE137684, 0.762 [0.667, 0.857] for GSE34526 and 0.783 [0.667, 0.900] for the data from 16 patients, respectively (Fig. 5a, b, c). As for external datasets, we included GSE155489, GSE168404, and GSE95728, and the AUC values for the diagnostic efficacy of hub genes (CNTN2, CASR, CACNB3, MFAP2) were 0.750 [0.500, 1.000], 0.700 [0.400, 1.000] and 0.643 [0.429, 0.857], respectively (Fig. 5d, e, f). Although the AUC values for the diagnostic efficacy of the external datasets is lower than that of the internal datasets, but they still proves that the model has a reliable generalization ability.
Fig. 5.
Confirming the generalizability of the identified potential biomarkers. (a) The ROC curve of the diagnostic efficacy in GSE137684 based on XGBoost. (b) The ROC curve of the diagnostic efficacy in GSE34526 based on XGBoost. (c) The ROC curve of the diagnostic efficacy in data from 16 patients based on XGBoost. (d) The ROC curve of the diagnostic efficacy in GSE155489 based on XGBoost. (e) The ROC curve of the diagnostic efficacy in GSE168404 based on XGBoost. (f) The ROC curve of the diagnostic efficacy in GSE95728 based on XGBoost
Feature explanation of the model based on SHAP
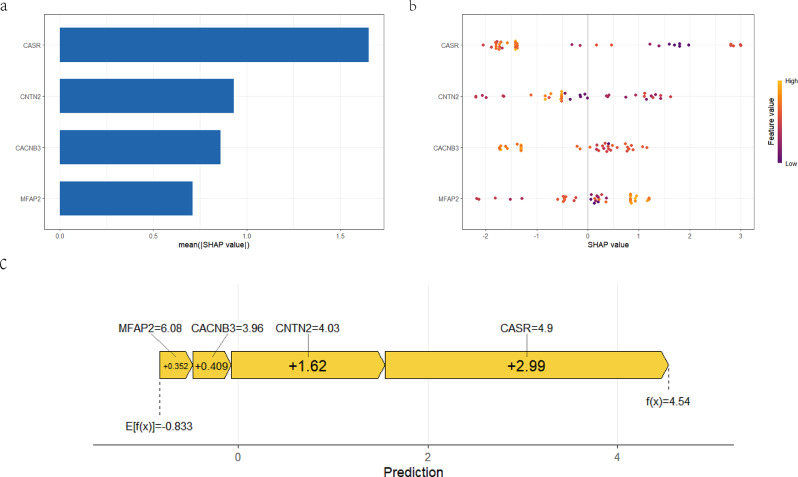
We implemented SHAP analysis based on the trained XGBoost model, and the SHAP summary plots (Fig. 6a, b) demonstrate the global interpretability of the XGB model as well as the importance of four features. In plot 6b, each dot represents a patient sample, where purple indicates a lower SHAP value and yellow indicates a higher SHAP value. As shown in Fig. 6c, the features ‘CACNB3 = 4.9’, ‘CASR = 3.96’, ‘CNTN2 = 4.03’, and ‘MFAP2 = 6.08’ have a positive contribution to the model’s prediction for PCOS, with SHAP values of 0.409, 2.99, 1.62, and 6.08, respectively. This indicates that the higher the values of these features, the greater the probability that the sample will be predicted as PCOS. These results provide a new perspective on the role of features within the model beyond their importance.
Fig. 6.
Feature explanation of the model based on SHAP. (a) The SHAP summary plot demonstrates the features contributing to the XGBoost prediction model’s prediction of PCOS, ranked from highest to lowest contribution. (b) The position of each feature is arranged in descending order of importance according to the model’s predictions. Each dot represents a patient sample, where purple indicates a lower SHAP value and yellow indicates a higher SHAP value. (c) The SHAP force plot illustrates how various features collectively contribute to the final prediction outcome. By observing the magnitude and direction of the force corresponding to each feature, one can understand the specific impact of each feature on the prediction result
Infiltration of immune cells results
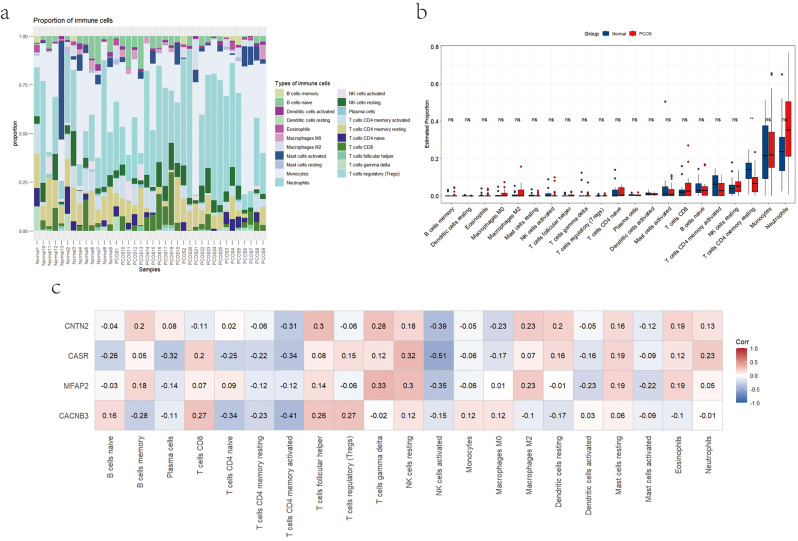
Figure 7a presents histograms depicting the expression levels of 22 immune cell types in the PCOS group and normal control group, as determined by the CIBERSORT algorithm. Monocytes and neutrophils constitute the majority of immune cells in both groups. Interestingly, the PCOS group exhibits higher levels of neutrophils and resting NK cells, while having lower numbers of activated NK cells, CD4 memory resting T cells, and CD4 memory activated T cells compared to the normal control group. Other immune cell populations show relatively minor differences between the two groups, suggesting the need for further experimental validation to understand the underlying causes. In Fig. 7b, the immune cell differential analysis plot highlights a significant reduction (P < 0.05) in CD4 memory resting T cells in the PCOS group compared to the normal control group. Figure 7c depicts the correlation between the identified hub genes and the 22 cell types. The results revealed a negative correlation between CD4 memory resting T cells, CD4 memory activated T cells, activated NK cells, and activated Mast cells with the hub genes. In contrast, resting NK cells and resting Mast cells showed a positive association with the hub genes.
Fig. 7.
Immune cell composition in PCOS and normal control groups. (a) Histogram of the expression levels of 22 types of immune cells in PCOS and normal control groups. (b) Differential expressions of immune cell infiltration between two groups. (c) The correlation analysis between hub genes and the 22 cell types identified by CIBERSORT
Function enrichment analysis of signature genes
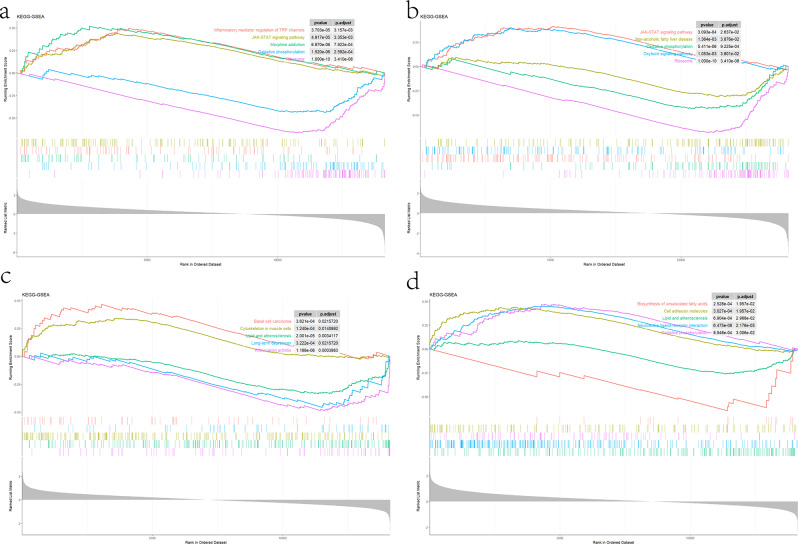
GSEA pathway enrichment analysis was performed for hub genes. CNTN2 demonstrated positive correlations with inflammatory mediator regulation of TRP channels, JAK-STAT signaling pathway and Morphine addiction, but negative with oxidative phosphorylation and ribosome (Fig. 8a). As for CASR, which is positively correlated with JAK-STAT signaling pathway and oxytocin signaling pathway, but negatively correlated with non-alcoholic fatty liver disease, oxidative phosphorylation and ribosome (Fig. 8b). CACNB3, encodes a regulatory beta subunit of the voltage-dependent calcium channel, which is positively related to basal cell carcinoma, cytoskeleton in muscle cells, but displayed negative correlations with lipid and atherosclerosis, long-term depression and rheumatoid arthritis (Fig. 8c). In addition, MFAP2 demonstrated positive correlations with cell adhesion molecules, neuroactive ligand-receptor interaction, and oxidative phosphorylation, which is negatively related to biosynthesis of unsaturated fatty acids, lipid and atherosclerosis (Fig. 8d).
Fig. 8.
GSEA for the single diagnostic gene. (a) GSEA analysis for CNTN2. (b) GSEA analysis for CASR. (c) GSEA analysis for CACNB3. (d) GSEA analysis for MFAP2. GSEA gene set enrichment analysis
Validation of hub genes by RT-qPCR in human granulosa cells
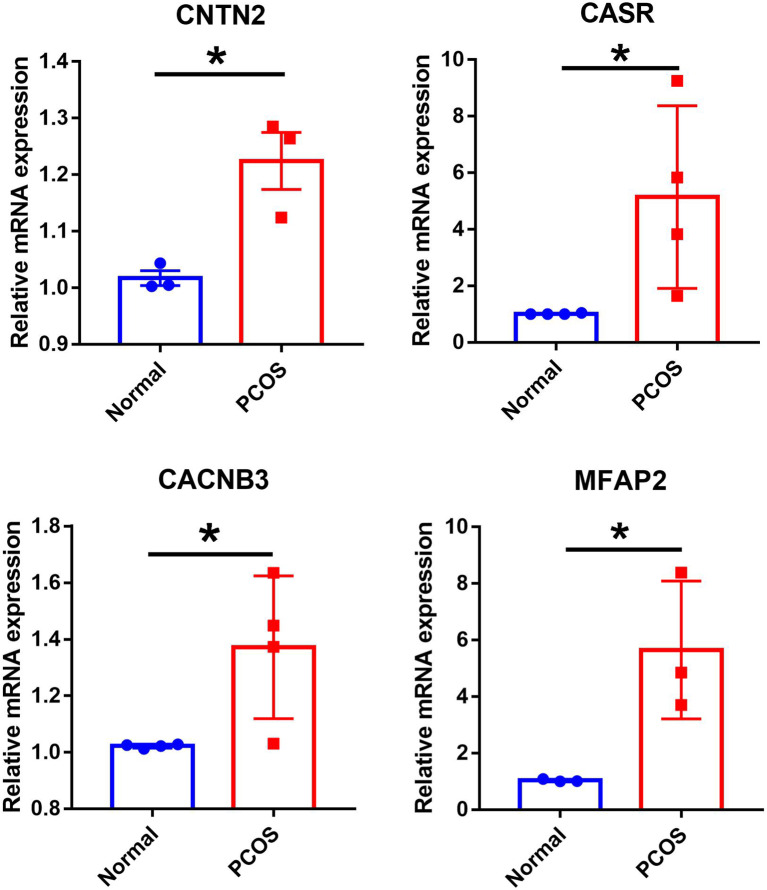
We performed RT-qPCR to validate the expression levels of the hub genes in ovarian granulosa cells from normal control individuals and women with PCOS. Our findings were consistent with the data analysis, as we observed upregulation of CNTN2, CASR, CACNB3, and MFAP2 in granulosa cells from PCOS patients compared to normal controls (Fig. 9).
Fig. 9.
Validation of RT-qPCR in human. Expression levels of hub genes (CNTN2, CASR, CACNB3 and MFAP2) in granulosa cells of normal control and PCOS groups. *P < 0.05
Discussion
Polycystic ovary syndrome (PCOS) is a heterogeneous endocrine disorder that affects women of reproductive age globally [19]. However, the underlying mechanisms of PCOS pathogenesis remain unclear [20]. Studies have revealed the significant involvement of granulosa cells in PCOS pathogenesis [21]. Within the granulosa cell population, both mural granulosa cells and cumulus granulosa cells have been identified and recognized for their distinct functional characteristics [22]. In this study, our focus was directed towards mural granulosa cells to identify a specific diagnostic marker for PCOS. Furthermore, we investigated the impact of immune cell infiltration on PCOS.
Our study identified 824 differentially expressed genes (DEGs) between the PCOS and normal control groups. Among these DEGs, 376 genes were upregulated and 448 genes were downregulated. Subsequent GO enrichment analysis indicated that these DEGs were primarily involved in small GTPase mediated signal transduction, organelle fission, establishment of organelle localization, phospholipid binding, protein serine/threonine kinase activity, and protein-macromolecule adaptor activity. KEGG enrichment analysis showed association with endocytosis, salmonella infection and focal adhesion, cell cycle, ubiquitin mediated proteolysis, lysosome and sphingolipid signaling pathway. We further employed two machine learning algorithms, LASSO and SVM-RFE, to effectively screen and identify specific diagnostic markers for PCOS. The Least Absolute Shrinkage and Selection Operator (LASSO) is a regression-based method used for variable selection in models with a large number of covariates. It identifies variables by minimizing the probability of classification error [23]. SVM recursive feature elimination (SVM-RFE) is a classification algorithm commonly employed for feature ranking and selection purposes. It helps identify the most significant features for accurate classification [24]. In our study, we successfully identified four hub genes (CNTN2, CASR, CACNB3, MFAP2) associated with PCOS. To assess their diagnostic efficacy, we evaluated the area under the curve (AUC) in the validation set using SVM and XGBoost algorithms. The AUC values were 0.795 for SVM and 0.875 for XGBoost, indicating promising diagnostic performance of these hub genes. Considering the better performance of the model in XGBoost, we further validated the model based on internal datasets and external datasets using XGBoost, confirming a better generalizability ability of the prediction model. Additionally, SHAP (SHapley Additive exPlanations) has demonstrated that CACNB3, CASR, CNTN2, and MFAP2 have a positive contribution to the prediction of PCOS, meaning that when the values of these features increase, the probability of the model predicting PCOS also increases. SHAP [25] provides us with a new perspective on features, not only in terms of their importance within the model but also in terms of how the feature values positively or negatively affect the model’s prediction for PCOS. This helps us to gain a deeper understanding of the model and guides us on how to adjust features or model parameters to optimize the model, reducing errors that may arise from sample limitations and other factors. The results of SHAP is consistent with the mRNA expression distribution of the hub genes between the PCOS group and the normal control group, and subsequent RT-qPCR validation has yielded the same results. The role of the hub genes revealed by SHAP in the predictive model aligns with their biological performance trends.
In our study, we followed a similar approach to Liu et al. by combining LASSO and SVM-RFE to identify hub genes for PCOS diagnosis [12]. However, there were differences in our feature selection strategies, specifically regarding the input of differentially expressed genes in the models. While Liu et al. selected the intersection of genes from the training and validation groups, which resulted in only 90 genes after excluding 95% of the DEGs, we included all 824 DEGs to mitigate selection bias and account for sample diversity. This difference in strategy likely contributed to the divergent results between our study and Liu et al., as the exclusion of certain genes in their approach may have overlooked critical factors relevant to our findings.
CNTN2, a member of the contact proteins family and the immunoglobulin superfamily of cell adhesion molecules, is involved in the development and maintenance of the nervous system. It specifically regulates the proliferation and differentiation of cerebellar neurons [26, 27]. While there is limited direct evidence linking CNTN2 to PCOS, a study by Qin et al. reported elevated levels of CNTN2 mRNA in the ovaries of pubertal goats. It suggested that this elevation may be involved in reproductive regulation by activating the receptor tyrosine kinase/Ras/MAPK signaling pathway, influencing GnRH receptor signaling, or affecting transcription factors (TFs) associated with related genes [28]. This indirect evidence indicates a potential role for CNTN2 in reproductive processes, but further research is needed to explore its specific involvement in PCOS.
CASR, consistent with previous research, has been found to be significantly elevated in patients with PCOS and may serve as a functional marker for the condition [29]. CASR is a calcium sensing receptor that plays a crucial role in maintaining calcium homeostasis by directly sensing changes in extracellular calcium ion concentration [30]. Our study provides strong evidence for the involvement of CASR in the pathogenesis of PCOS. Upregulated CASR leads to a lower extracellular calcium set point, resulting in reduced parathyroid hormone secretion, decreased renal calcium reabsorption, and increased calcitonin secretion, leading to lower circulating calcium levels [31]. It has been reported that activated CASR can promote IL-6 secretion through signaling pathways involving Gαs/PKC, MEK1/2, mTORC1, and trans-activated EGFR [32]. Studies have shown that IL-6 levels are significantly increased in individuals with PCOS compared to those without the condition [33]. Therefore, CASR may be involved in the development and progression of PCOS through the activation of IL-6.
CACNB3 encodes a regulatory β-subunit of voltage-dependent calcium channels that play a role in regulating calcium channel surface expression and gating. Additionally, it is believed to be a key regulator of migratory dendritic cell migration, controlling tissue-specific immune responses during injury and inflammation [34]. These findings suggest that CACNB3 may be associated with inflammation in PCOS. Although there is limited research linking CACNB3 specifically to PCOS, further investigations are necessary to fully understand the role of CACNB3 in the pathogenesis of the condition.
Microfibrillar-associated protein 2 (MFAP2) is an extracellular matrix protein that interacts with microfibrils and modulates the bioavailability of signaling molecules like TGF-β [35]. Currently, there is no direct evidence supporting a significant role for MFAP2 in the development of PCOS. Previous studies have suggested that MFAP2 can activate the TGF-β/Smad3 signaling pathway [36]. Shen et al. found that activation of the TGF-β1/Smad3 signaling pathway, demonstrated through experiments on rats, may inhibit follicle development in polycystic ovary syndrome (PCOS) by regulating granulosa cell apoptosis [37]. Moreover, TGF-β1 has been shown to inhibit the activity of P450 aromatase, an enzyme involved in the conversion of androgens to estrogens [38]. Therefore, the upregulation of MFAP2 likely triggers the activation of the TGF-β/Smad3 signaling pathway, impacting granulosa cell apoptosis and potentially contributing to the pathogenesis of PCOS. Despite limited research on MFAP2 in PCOS, it holds promise as a novel therapeutic target pending further validation.
Given the increasing evidence that immune dysregulation is associated with PCOS, understanding the immune landscape can provide insights into the disease’s mechanisms [39]. Therefore, in our study, we utilized the CIBERSORT algorithm to analyze the immune cell composition in both the PCOS and normal control groups [40, 41], which is aim to investigate the potential role of immune cell infiltration in the pathogenesis of PCOS and to explore how these immune cells may interact with the identified hub genes (CNTN2, CASR, CACNB3, and MFAP2), Similar to previous studies, our findings revealed significant differences (P < 0.05) in immune cell populations, particularly a notable reduction in CD4 memory resting T cells in the PCOS group compared to controls [42, 43]. One possible explanation for this decrease is that programmed cell death protein 1 (PD-1), which is highly expressed in CD4 T cells in the follicular fluid of PCOS patients, may fail to induce T cell activation or recruitment, leading to the failure of dominant follicle selection and development, ultimately resulting in anovulation in PCOS [44, 45]. PD-1 is an inducible receptor that can inhibit T cell responses by interacting with programmed death ligand 1 (PD-L1) and PD-L2. Studies have demonstrated that an adequate and appropriately distributed population of T cells can contribute to follicular survival by providing trophic growth factors or suppressing adverse immunoreactivity [46]. Insufficient or deficient T cell populations may disrupt the control of follicular selection and development, thereby promoting the development of PCOS [47]. On the other hand, interleukin-2 (IL-2), produced by adjacent CD4 T cell populations, is involved in the development of CD4 memory T cells [48]. However, the expression of IL-2 is lower in the PCOS group compared to the normal control group [49]. The aforementioned studies suggest that the reduction of CD4 T cells may have implications for follicular development and ovulation, which are critical processes affected in PCOS. Furthermore, we conducted correlation analyses between the identified hub genes and the various immune cell types. Our results indicated a negative correlation between CD4 memory resting T cells and the hub genes (CNTN2, CASR, CACNB3, and MFAP2), suggesting that alterations in these immune cells may influence the expression of the hub genes and, consequently, the pathogenesis of PCOS. Further experiments are needed to determine the complex relationship between hub genes and immune infiltration in polycystic ovary syndrome.
However, our study possesses certain limitations. Firstly, the CIBERSORT analysis relied on a limited amount of available genetic information, which could have been influenced by disease-induced perturbations, interactions with cellular heterogeneity, or phenotypic plasticity properties. Secondly, although the sample size has been expanded compared to previous studies, it remains relatively small. Therefore, further validation using a larger cohort is necessary. Thirdly, potential limitations of this study encompass inherent biases associated with factors such as race, region, and clinical measurement methods.
In this study, we identified four upregulated hub genes in PCOS and observed notable differences in immune cells, particularly CD4 memory resting T cells, between PCOS and normal subjects. Exploring the involvement of these hub genes and CD4 memory resting T cells in the pathogenesis of PCOS represents a promising avenue for future research. We will also devote greater attention to understanding the role of immune cells in the development of PCOS, with a specific focus on elucidating the changes occurring within the microenvironment of granulosa cells in PCOS. Furthermore, the findings of this study highlight the need for further large-scale experiments and clinical investigations to validate the reliability of our results.
In summary, we conducted a screening of potential biomarkers for PCOS and explored the role of immune cell infiltration in the pathogenesis of PCOS. We anticipate that our study will contribute to the advancement of clinical diagnosis and treatment strategies for PCOS.
Conclusions
This study identified CNTN2, CASR, CACNB3, and MFAP2 as potential diagnostic biomarkers for PCOS. The findings regarding immune cell infiltration highlight the significant involvement of CD4 memory resting T cells in the pathogenesis and progression of PCOS. The discovery of novel genes associated with PCOS and the analysis of immune cell infiltration provide valuable insights into understanding the underlying mechanisms of PCOS and have the potential to facilitate the development of new diagnostic and therapeutic strategies. However, further validation through large-scale experimental and clinical studies is necessary to confirm these results.
Acknowledgements
Not applicable.
Abbreviations
- PCOS
Polycystic Ovary Syndrome
- LASSO
Least Absolute Shrinkage and Selection Operator
- SVM
RFE-Support Vector Machine with Recursive Feature Elimination
- ROC
Receiver Operating Characteristic
- AUC
Area Under the Curve
- AI
Artificial Intelligence
- ML
Machine Learning
- TRP
Transient Receptor Potential
- TFs
Transcription Factors
- GnRH
Gonadotropin-releasing Hormone
- HA
Hyperandrogenism
Author contributions
All authors made a significant contribution to this work. J.C (Jingfei Chen) and J.C (Jianlin Chen) designed the study. W.C (Wenxiu Chen) and J.M (Jianliang Miao) wrote the manuscript. J.M (Jianliang Miao) collected, analyzed, and interpreted the data. J.C (Jingfei Chen) and J.C (Jianlin Chen) critically reviewed, edited, and approved the manuscript. All authors read and approved the final manuscript.
Funding
This project was supported by National Natural Science Foundation of China [No. 82201879 to Jingfei Chen]; Hunan Provincial Natural Science Foundation of China [No. 2022JJ40675 to Jingfei Chen]; Scientific Research Project of Hunan Provincial Health Commission [No. B202305037231 to Jingfei Chen]; Scientific Research Launch Project for new employees of the Second Xiangya Hospital of Central South University (to Jingfei Chen); China Postdoctoral Science Foundation (to Jingfei Chen).
Data availability
The data from RNA-seq will be shared upon reasonable request to the corresponding author. The publicly available dataset used in this study can be downloaded from the GEO database (http://www.ncbi.nlm.nih.gov/geo/).
Declarations
Ethics approval and consent to participate
The study protocol involving human participants was reviewed and approved by the Ethics Committee of the Second Xiangya Hospital of Central South University according to the Council for International Organizations of Medical Sciences. Informed consent was provided by all participants in the study.
Consent for publication
Not applicable.
Clinical trial number
Not applicable.
Competing interests
The authors declare no competing interests.
Footnotes
Publisher’s note
Springer Nature remains neutral with regard to jurisdictional claims in published maps and institutional affiliations.
Wenxiu Chen and Jianliang Miao contributed equally to this work.
Contributor Information
Jingfei Chen, Email: jingfeichen@csu.edu.cn.
Jianlin Chen, Email: jianlinchen@csu.edu.cn.
References
- 1.Walter K. What is polycystic ovary syndrome? JAMA. 2022;327(3):294. [DOI] [PubMed] [Google Scholar]
- 2.Barthelmess EK, Naz RK. Polycystic ovary syndrome: current status and future perspective. Front Biosci. 2014;6(1):104–19. [DOI] [PMC free article] [PubMed] [Google Scholar]
- 3.Yadav S, Delau O, Bonner AJ, Markovic D, Patterson W, Ottey S, Buyalos RP, Azziz R. Direct economic burden of mental health disorders associated with polycystic ovary syndrome: systematic review and meta-analysis. eLife 2023, 12. [DOI] [PMC free article] [PubMed]
- 4.Azziz R, Marin C, Hoq L, Badamgarav E, Song P. Health care-related economic burden of the polycystic ovary syndrome during the reproductive life span. J Clin Endocrinol Metab. 2005;90(8):4650–8. [DOI] [PubMed] [Google Scholar]
- 5.Manique MES, Ferreira A. Polycystic ovary syndrome in adolescence: challenges in diagnosis and management. Revista Brasileira De Ginecol E Obstetricia: Revista da Federacao Brasileira das Sociedades de Ginecol E Obstet. 2022;44(4):425–33. [DOI] [PMC free article] [PubMed] [Google Scholar]
- 6.Gibson-Helm M, Teede H, Dunaif A, Dokras A. Delayed diagnosis and a lack of Information Associated with Dissatisfaction in Women with Polycystic Ovary Syndrome. J Clin Endocrinol Metab. 2017;102(2):604–12. [DOI] [PMC free article] [PubMed] [Google Scholar]
- 7.Tan Q. Deciphering the DNA methylome of polycystic ovary syndrome. Mol Diagn Ther. 2020;24(3):245–50. [DOI] [PubMed] [Google Scholar]
- 8.Zhang WY, Chen ZH, An XX, Li H, Zhang HL, Wu SJ, Guo YQ, Zhang K, Zeng CL, Fang XM. Analysis and validation of diagnostic biomarkers and immune cell infiltration characteristics in pediatric sepsis by integrating bioinformatics and machine learning. World J Pediatrics: WJP. 2023;19(11):1094–103. [DOI] [PMC free article] [PubMed] [Google Scholar]
- 9.Choi RY, Coyner AS, Kalpathy-Cramer J, Chiang MF, Campbell JP. Introduction to machine learning, neural networks, and Deep Learning. Translational Vis Sci Technol. 2020;9(2):14. [DOI] [PMC free article] [PubMed] [Google Scholar]
- 10.Handelman GS, Kok HK, Chandra RV, Razavi AH, Lee MJ, Asadi H. eDoctor: machine learning and the future of medicine. J Intern Med. 2018;284(6):603–19. [DOI] [PubMed] [Google Scholar]
- 11.Silva IS, Ferreira CN, Costa LBX, Sóter MO, Carvalho LML, de Sales CAJ, Candido MF, Reis AL, Veloso FM. Polycystic ovary syndrome: clinical and laboratory variables related to new phenotypes using machine-learning models. J Endocrinol Investig. 2022;45(3):497–505. [DOI] [PubMed] [Google Scholar]
- 12.Liu S, Zhao X, Meng Q, Li B. Screening of potential biomarkers for polycystic ovary syndrome and identification of expression and immune characteristics. PLoS ONE. 2023;18(10):e0293447. [DOI] [PMC free article] [PubMed] [Google Scholar]
- 13.Wu Y, Xiao Q, Wang S, Xu H, Fang Y. Establishment and analysis of an Artificial neural network model for early detection of polycystic ovary syndrome using machine learning techniques. J Inflamm Res. 2023;16:5667–76. [DOI] [PMC free article] [PubMed] [Google Scholar]
- 14.Qi X, Yun C, Sun L, Xia J, Wu Q, Wang Y, Wang L, Zhang Y, Liang X, Wang L, et al. Gut microbiota-bile acid-interleukin-22 axis orchestrates polycystic ovary syndrome. Nat Med. 2019;25(8):1225–33. [DOI] [PMC free article] [PubMed] [Google Scholar]
- 15.Patro R, Duggal G, Love MI, Irizarry RA, Kingsford C. Salmon provides fast and bias-aware quantification of transcript expression. Nat Methods. 2017;14(4):417–9. [DOI] [PMC free article] [PubMed] [Google Scholar]
- 16.Kaur S, Archer KJ, Devi MG, Kriplani A, Strauss JF 3rd, Singh R. Differential gene expression in granulosa cells from polycystic ovary syndrome patients with and without insulin resistance: identification of susceptibility gene sets through network analysis. J Clin Endocrinol Metab. 2012;97(10):E2016–2021. [DOI] [PMC free article] [PubMed] [Google Scholar]
- 17.Jiang Y, Leng J, Lin Q, Zhou F. Epithelial-mesenchymal transition related genes in unruptured aneurysms identified through weighted gene coexpression network analysis. Sci Rep. 2022;12(1):225. [DOI] [PMC free article] [PubMed] [Google Scholar]
- 18.Newman AM, Liu CL, Green MR, Gentles AJ, Feng W, Xu Y, Hoang CD, Diehn M, Alizadeh AA. Robust enumeration of cell subsets from tissue expression profiles. Nat Methods. 2015;12(5):453–7. [DOI] [PMC free article] [PubMed] [Google Scholar]
- 19.Joham AE, Peña AS. Polycystic ovary syndrome in adolescence. Semin Reprod Med. 2022;40(1–02):e1–8. [DOI] [PubMed] [Google Scholar]
- 20.Sadeghi HM, Adeli I, Calina D, Docea AO, Mousavi T, Daniali M, Nikfar S, Tsatsakis A, Abdollahi M. Polycystic ovary syndrome: a Comprehensive Review of Pathogenesis, Management, and Drug Repurposing. Int J Mol Sci 2022, 23(2). [DOI] [PMC free article] [PubMed]
- 21.Jozkowiak M, Piotrowska-Kempisty H, Kobylarek D, Gorska N, Mozdziak P, Kempisty B, Rachon D, Spaczynski RZ. Endocrine disrupting chemicals in polycystic ovary syndrome: the relevant Role of the Theca and Granulosa cells in the pathogenesis of the ovarian dysfunction. Cells 2022, 12(1). [DOI] [PMC free article] [PubMed]
- 22.Lin N, van Zomeren K, van Veen T, Mzyk A, Zhang Y, Zhou X, Plosch T, Tietge UJF, Cantineau A, Hoek A, et al. Quantum Sensing of Free radicals in Primary Human Granulosa cells with Nanoscale Resolution. ACS Cent Sci. 2023;9(9):1784–98. [DOI] [PMC free article] [PubMed] [Google Scholar]
- 23.McEligot AJ, Poynor V, Sharma R, Panangadan A. Logistic LASSO regression for dietary intakes and breast Cancer. Nutrients 2020, 12(9). [DOI] [PMC free article] [PubMed]
- 24.Huang S, Cai N, Pacheco PP, Narrandes S, Wang Y, Xu W. Applications of support Vector Machine (SVM) Learning in Cancer Genomics. Cancer Genomics Proteomics. 2018;15(1):41–51. [DOI] [PMC free article] [PubMed] [Google Scholar]
- 25.Lundberg SM, Lee S-I. A unified approach to interpreting model predictions. In: Proceedings of the 31st International Conference on Neural Information Processing Systems. Long Beach, California, USA: Curran Associates Inc.; 2017: 4768–4777.
- 26.Liu Y, Gao H, Shang Y, Sun S, Guan W, Zheng T, Wu L, Cong M, Zhang L, Li G. IKVAV functionalized oriented PCL/Fe(3)O(4) scaffolds for magnetically modulating DRG growth behavior. Colloids Surf B Biointerfaces. 2024;239:113967. [DOI] [PubMed] [Google Scholar]
- 27.Liu W, Shrestha R, Lowe A, Zhang X, Spaeth L. Self-formation of concentric zones of telencephalic and ocular tissues and directional retinal ganglion cell axons. eLife 2023, 12. [DOI] [PMC free article] [PubMed]
- 28.Qin P, Pan Z, Zhang W, Wang R, Li X, Lu J, Xu S, Gong X, Ye J, Yan X, et al. Integrative proteomic and transcriptomic analysis in the female goat ovary to explore the onset of puberty. J Proteom. 2024;301:105183. [DOI] [PubMed] [Google Scholar]
- 29.Liu W, Tang T, Feng J, Wang C, Lin L, Wang S, Zeng K, Zou R, Yang Z, Zhao Y. Knowledge graph construction based on granulosa cells transcriptome from polycystic ovary syndrome with normoandrogen and hyperandrogen. J Ovarian Res. 2024;17(1):38. [DOI] [PMC free article] [PubMed] [Google Scholar]
- 30.Li RJW, Barros DR, Kuah R, Lim YM, Gao A, Beaudry JL, Zhang SY, Lam TKT. Small intestinal CaSR-dependent and CaSR-independent protein sensing regulates feeding and glucose tolerance in rats. Nat Metab. 2024;6(1):39–49. [DOI] [PubMed] [Google Scholar]
- 31.Canaff L, Zhou X, Hendy GN. The proinflammatory cytokine, interleukin-6, up-regulates calcium-sensing receptor gene transcription via Stat1/3 and Sp1/3. J Biol Chem. 2008;283(20):13586–600. [DOI] [PubMed] [Google Scholar]
- 32.Hernández-Bedolla MA, González-Domínguez E, Zavala-Barrera C, Gutiérrez-López TY, Hidalgo-Moyle JJ, Vázquez-Prado J, Sánchez-Torres C, Reyes-Cruz G. Calcium-sensing-receptor (CaSR) controls IL-6 secretion in metastatic breast cancer MDA-MB-231 cells by a dual mechanism revealed by agonist and inverse-agonist modulators. Mol Cell Endocrinol. 2016;436:159–68. [DOI] [PubMed] [Google Scholar]
- 33.Rudnicka E, Suchta K, Grymowicz M, Calik-Ksepka A, Smolarczyk K, Duszewska AM, Smolarczyk R, Meczekalski B. Chronic low Grade inflammation in Pathogenesis of PCOS. Int J Mol Sci 2021, 22(7). [DOI] [PMC free article] [PubMed]
- 34.Woo MS, Ufer F, Sonner JK, Belkacemi A, Tintelnot J, Sáez PJ, Krieg PF, Mayer C, Binkle-Ladisch L, Engler JB, et al. Calcium channel β3 subunit regulates ATP-dependent migration of dendritic cells. Sci Adv. 2023;9(38):eadh1653. [DOI] [PMC free article] [PubMed] [Google Scholar]
- 35.Huang J, Xu Y, Qi S, Zheng Q, Cui C, Liu L, Liu F. The potent potential of MFAP2 in prognosis and immunotherapy of triple-negative breast cancer. Discov Oncol. 2024;15(1):202. [DOI] [PMC free article] [PubMed] [Google Scholar]
- 36.Sun Y, Chen X, Chen L, Bao B, Li C, Zhou Y. MFAP2 promotes HSCs activation through FBN1/TGF-β/Smad3 pathway. J Cell Mol Med. 2023;27(21):3235–46. [DOI] [PMC free article] [PubMed] [Google Scholar]
- 37.Shen H, Wang Y. Activation of TGF-β1/Smad3 signaling pathway inhibits the development of ovarian follicle in polycystic ovary syndrome by promoting apoptosis of granulosa cells. J Cell Physiol. 2019;234(7):11976–85. [DOI] [PubMed] [Google Scholar]
- 38.Cheng JC, Fang L, Yan Y, He J, Guo Y, Jia Q, Gao Y, Han X, Sun YP. TGF-β1 stimulates aromatase expression and estradiol production through SMAD2 and ERK1/2 signaling pathways in human granulosa-lutein cells. J Cell Physiol. 2021;236(9):6619–29. [DOI] [PubMed] [Google Scholar]
- 39.Yan S, Gao Z, Ding J, Chen S, Wang Z, Jin W, Qu B, Zhang Y, Yang L, Guo D, et al. Nanocomposites based on nanoceria regulate the immune microenvironment for the treatment of polycystic ovary syndrome. J Nanobiotechnol. 2023;21(1):412. [DOI] [PMC free article] [PubMed] [Google Scholar]
- 40.Xie N, Wang F, Chen D, Zhou J, Xu J, Qu F. Immune dysfunction mediated by the competitive endogenous RNA network in fetal side placental tissue of polycystic ovary syndrome. PLoS ONE. 2024;19(3):e0300461. [DOI] [PMC free article] [PubMed] [Google Scholar]
- 41.Shen HH, Zhang YY, Wang XY, Li MY, Liu ZX, Wang Y, Ye JF, Wu HH, Li MQ. Validation of mitochondrial biomarkers and immune dynamics in polycystic ovary syndrome. American journal of reproductive immunology (New York, NY: 1989) 2024, 91(4):e13847. [DOI] [PubMed]
- 42.Yao X, Wang X. Bioinformatics searching of diagnostic markers and immune infiltration in polycystic ovary syndrome. Front Genet. 2022;13:937309. [DOI] [PMC free article] [PubMed] [Google Scholar]
- 43.Li Z, Peng A, Feng Y, Zhang X, Liu F, Chen C, Ye X, Qu J, Jin C, Wang M, et al. Detection of T lymphocyte subsets and related functional molecules in follicular fluid of patients with polycystic ovary syndrome. Sci Rep. 2019;9(1):6040. [DOI] [PMC free article] [PubMed] [Google Scholar]
- 44.Benedict CA, Loewendorf A, Garcia Z, Blazar BR, Janssen EM. Dendritic cell programming by cytomegalovirus stunts naive T cell responses via the PD-L1/PD-1 pathway. J Immunol (Baltimore Md: 1950). 2008;180(7):4836–47. [DOI] [PMC free article] [PubMed] [Google Scholar]
- 45.Chikuma S. Basics of PD-1 in self-tolerance, infection, and cancer immunity. Int J Clin Oncol. 2016;21(3):448–55. [DOI] [PubMed] [Google Scholar]
- 46.Wu R, Fujii S, Ryan NK, Van der Hoek KH, Jasper MJ, Sini I, Robertson SA, Robker RL, Norman RJ. Ovarian leukocyte distribution and cytokine/chemokine mRNA expression in follicular fluid cells in women with polycystic ovary syndrome. Hum Reprod (Oxford England). 2007;22(2):527–35. [DOI] [PubMed] [Google Scholar]
- 47.Krishna MB, Joseph A, Subramaniam AG, Gupta A, Pillai SM, Laloraya M. Reduced tregs in peripheral blood of PCOS patients - a consequence of aberrant Il2 signaling. J Clin Endocrinol Metab. 2015;100(1):282–92. [DOI] [PubMed] [Google Scholar]
- 48.Tubo NJ, Pagán AJ, Taylor JJ, Nelson RW, Linehan JL, Ertelt JM, Huseby ES, Way SS, Jenkins MK. Single naive CD4 + T cells from a diverse repertoire produce different effector cell types during infection. Cell. 2013;153(4):785–96. [DOI] [PMC free article] [PubMed] [Google Scholar]
- 49.Demir M, Kalyoncu S, Ince O, Ozkan B, Kelekci S, Saglam G, Sutcu R, Yilmaz B. Endometrial Flushing Tumor Necrosis Factor Alpha and interleukin 2 levels in women with polycystic ovary syndrome, Leiomyoma and Endometrioma: comparison with healthy controls. Geburtshilfe Frauenheilkd. 2019;79(5):517–23. [DOI] [PMC free article] [PubMed] [Google Scholar]
Associated Data
This section collects any data citations, data availability statements, or supplementary materials included in this article.
Data Availability Statement
The data from RNA-seq will be shared upon reasonable request to the corresponding author. The publicly available dataset used in this study can be downloaded from the GEO database (http://www.ncbi.nlm.nih.gov/geo/).


