Abstract
Microtubule assembly takes place at the centrosome and noncentrosomal microtubule–organizing centers (MTOCs). However, the mechanisms controlling the activity of noncentrosomal MTOCs are poorly understood. Here, using the fission yeast Schizosaccharomyces pombe as a model organism, we demonstrate that the kinesin-14 motor Klp2 interacts with the J-domain Hsp70/Ssa1 cochaperone Rsp1, an inhibitory factor of microtubule assembly, and that Klp2 is required for the proper localization of Rsp1 to microtubules. In addition, we demonstrate that Klp2 is not required for the localization of Mto1, a factor promoting microtubule assembly, to microtubules. Moreover, Rsp1-Ssa1 inhibits the interaction of Mto1-Mto2 with the gamma-tubulin small complex. The absence of Klp2 reduces the colocalization of Rsp1 and Mto1 foci on preexisting microtubules, resulting in an increased microtubule-dependent microtubule assembly. Our results suggest that Klp2 regulates the activity of noncentrosomal MTOCs by targeting Rsp1 to the sites of Mto1 activity and reveal a mechanism for the inhibition of noncentrosomal microtubule assembly by a kinesin-14 motor.
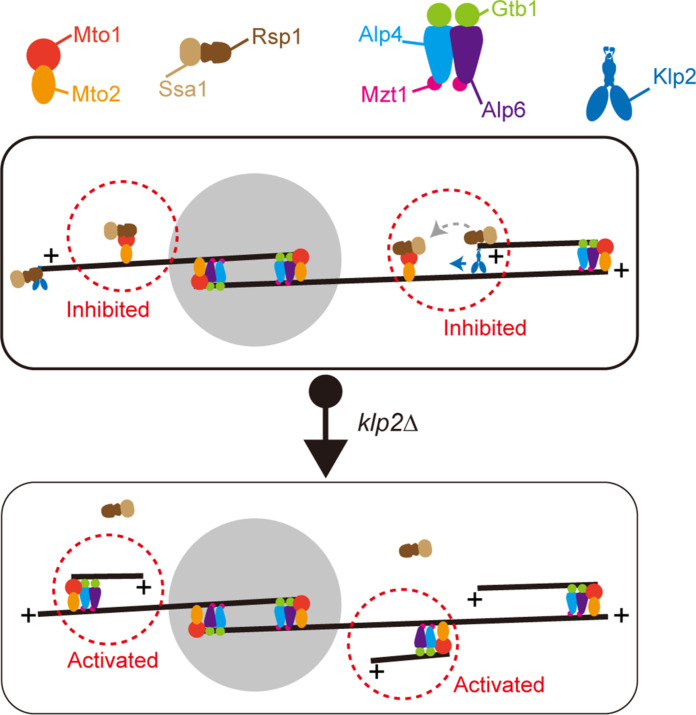
Microtubule-dependent microtubule assembly is inhibited by transporting a cochaperone to the nucleation sites.
INTRODUCTION
Cells require different microtubule arrays to perform specific functions. Microtubules were traditionally considered to emanate from the centrosome [the spindle pole body (SPB) in yeasts]. This view has been changed recently because many findings show that microtubules in many types of cells also emanate from noncentrosomal microtubule–organizing centers (MTOCs) (1, 2). These noncentrosomal MTOCs include various subcellular structures, such as the nuclear envelope, the Golgi apparatus, the cell cortex, and preexisting microtubules (1–3).
A key mechanism for creating microtubule arrays is the nucleation of newly generated microtubules on existing ones (i.e., microtubule-dependent microtubule assembly) (1, 4–11). For example, the augmin complex localizes to the surface of preexisting microtubules and promotes microtubule assembly, which in turn plays important role in forming bipolar spindles during mitosis and meiosis (4–7).
Similar to microtubules in mammalian cells, microtubules in the fission yeast Schizosaccharomyces pombe are assembled not only at the SPB/centrosome but also at multiple non-SPB sites, termed interphase MTOCs (iMTOCs). These iMTOCs include the sites within the cytoplasm, on the nuclear envelope, and at the microtubule lattice (2, 12, 13). Therefore, S. pombe has been serving as an excellent model organism for studying noncentrosomal microtubule assembly. In general, two to four antiparallel microtubule bundles with opposite polarity extend along the cell axis, with their plus ends pointing toward the cell tips and their minus ends overlapping at the nuclear envelope (13). A group of evolutionarily conserved proteins including the kinesin-14 motor Klp2 (HSET in humans), the microtubule cross-linker Ase1 (PRC1 in humans), and the microtubule nucleation–promoting factor Mto1 (CDK5RAP2 in humans) coordinate the formation of antiparallel microtubule arrays (8, 14, 15). Unlike other organisms, fission yeast lacks the augmin complex, which is required for the assembly of microtubules on preexisting ones in plant and mammalian cells. However, Mto1 appears to functionally substitute for the augmin complex to promote microtubule assembly by recruiting gamma-tubulin ring complex (γ-TuRC) to iMTOCs (16–18). The N-terminal CM1 (centrosomin motif 1) region and the C-terminal MASC domain of Mto1 mediate the interaction with γ-TuRC and the localization to the SPB, respectively (17–19). In addition, Mto1 generally functions with Mto2 as a complex, which is required to promote the interaction of Mto1 with γ-TuRC and to mediate the proper localization of γ-TuRC (20). Mto2 is also involved in multimerizing Mto1 in a γ-TuRC–independent manner, and the multimerization is necessary for microtubule nucleation (17).
The activation of microtubule nucleation by the Mto1-Mto2 complex is required for microtubule-dependent microtubule assembly (13, 17, 21). After emerging on an existing microtubule, the newly generated microtubules are generally oriented in an antiparallel fashion by the combined action of Klp2 and Ase1 (8). Klp2 guides the newly generated microtubule to grow toward the minus end of the preexisting microtubule, while Ase1 stabilizes the overlapping region of the two antiparallel microtubules. Therefore, Mto1-Mto2, Klp2, and Ase1 form a minimal system to generate antiparallel microtubule arrays. Despite considerable progress that has been made to understand the underlying mechanism of microtubule-dependent microtubule assembly, the mechanism inhibiting microtubule-dependent microtubule assembly is not known.
We observed that many Mto1 foci are present on preexisting microtubules but only a few of them initiate microtubule growth simultaneously (22). This observation indicates that Mto1 activity is likely inhibited once Mto1 binds to a microtubule. The nature of this inhibition is still unclear.
Rsp1, the cochaperone of Hsp70 (Ssa1 in fission yeasts) (23), might be involved in the inhibition of microtubule-dependent microtubule growth. We previously reported that Rsp1 interacts with Mto1 and determine its localization to non-SPB sites, including the microtubule lattice (22). We also showed that Rsp1 functions as an inhibitory factor of microtubule assembly because Rsp1 overexpression impairs the interaction between Mto1 and Alp4, a component of the gamma-tubulin small complex (γ-TuSC), and reduces the localization of Mto1 to all MTOCs (22). Consistently, Rsp1 has been implicated in disassembly of the equatorial post-anaphase microtubule array during cytokinesis (24). The mechanism of Rsp1 targeting to Mto1 on the microtubule lattice remains unknown.
In this study, we report an interaction between Klp2 and Rsp1 and demonstrate that this interaction mediates the localization of Rsp1 to the microtubule lattice and the inhibition of microtubule assembly. We provide evidence that Rsp1-Ssa1 physically interacts with Mto1-Mto2 and inhibits the interaction of Mto1-Mto2 with γ-TuSC. Moreover, Klp2 is required to mediate the colocalization of Rsp1 with Mto1 on a preexisting microtubule. Thus, we reveal an uncharacterized role of Klp2 in inhibiting microtubule assembly.
RESULTS
Klp2 physically interacts with Rsp1
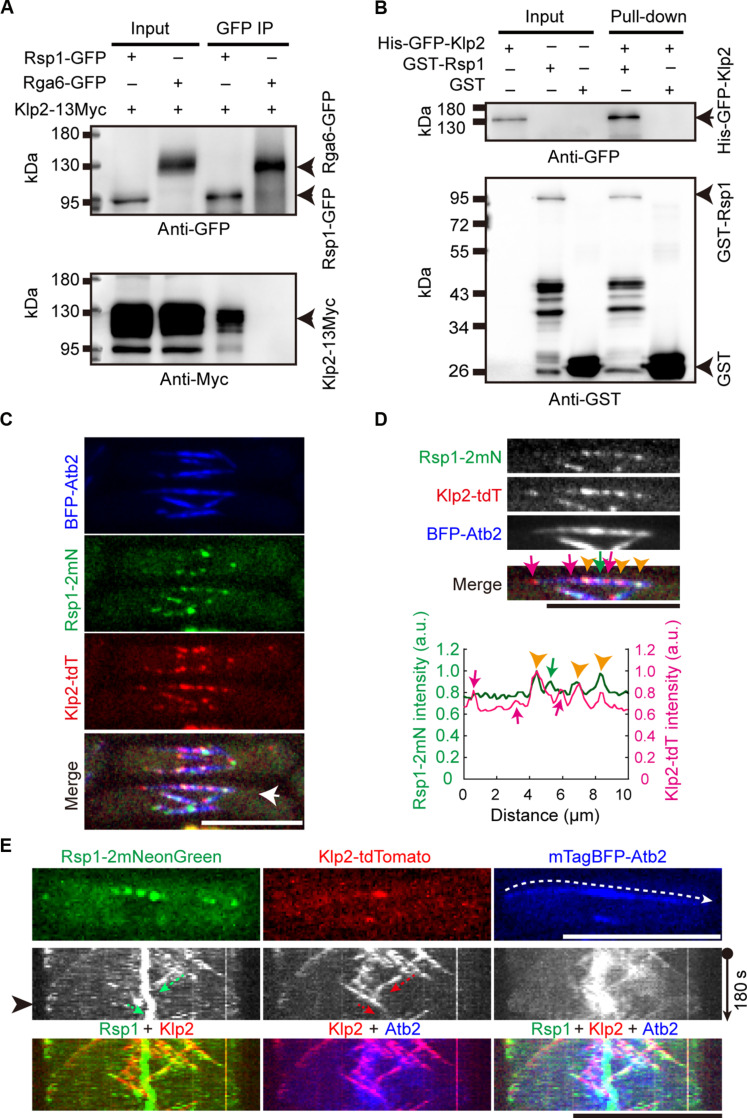
During the study of Rsp1 (22), the cochaperone of Hsp70 (24), we identified Klp2, a kinesin-14 protein (8), as a binding protein of Rsp1. In this present study, we verified the interaction by coimmunoprecipitation assays with strains carrying Klp2-13Myc and expressing Rsp1–green fluorescent protein (GFP) or Rga6-GFP [a protein localizing to the plasma membrane (25, 26)]. Rsp1-GFP, but not Rga6-GFP, coprecipitated with Klp2-13Myc (Fig. 1A). Glutathione S-transferase (GST) pull-down assays with recombinant proteins GST, GST-Rsp1, and His-GFP-Klp2, all purified from Escherichia coli, confirmed this result (Fig. 1B). These data suggest that Rsp1 and Klp2 interact physically.
Fig. 1. Interaction and colocalization of Rsp1 and Klp2.
(A) Coimmunoprecipitation of Klp2-13Myc and Rsp1-GFP or Rga6-GFP. Western blotting was performed with antibodies against GFP and Myc. Arrowheads indicate Rga6-GFP, Rsp1-GFP, and Klp2-13Myc, respectively. (B) GST pull-down experiments were performed with purified recombinant proteins GST, GST-Rsp1, and His-GFP-Klp2 as indicated. Western blotting was performed with antibodies against GFP and GST. (C) Maximum projection images of WT cells expressing Rsp1-2mNeonGreen, Klp2-tdTomato, and BFP-Atb2. White arrow indicates the microtubule used for intensity measurement in (D). Scale bar, 10 μm. (D) Magnified images indicated in (C). Intensity profile graph of Rsp1-2mNeonGreen and Klp2-tdTomato is shown below. Red arrows, Klp2-tdTomato puncta not colocalizing with Rsp1-2mNeoGreen; orange arrowheads, Klp2-tdTomato puncta colocalizing with Rsp1-2mNeoGreen; green arrow, the Rsp1-2mNeoGreen punctum not colocalizing with Klp2-tdTomato. Scale bar, 10 μm. (E) Kymograph graphs of Rsp1-2mNeonGreen, Klp2-tdTomato, and mTagBFP-Atb2 in WT cells. Dashed white arrow indicates the path that was used to generate the graph, and the cell image shown on the top corresponds to the intensity profile indicated by the white arrowhead. Green and red arrows indicate the co-movement of Rsp1-2mNeonGreen and Klp2-tdTomato. Scale bar, 10 μm. a.u., arbitrary unit.
We previously showed that the expression level of Rsp1 is quite low within the cell (22). To visualize Rsp1, we tagged it with a tandem mNeonGreen tag (i.e., 2mNeonGreen). A strain expressing Rsp1-2mNeonGreen, Klp2-tdTomato, and mTagBFP-Atb2 (α-tubulin tagged with mTagBFP) was generated. Spinning-disk microscopy revealed that only some Rsp1-2mNeonGreen foci colocalized with Klp2-tdTomato on microtubules (Fig. 1, C and D), indicating the presence of multiple interacting proteins for Rsp1. Consistently, Rsp1 also interacts with a microtubule nucleation–promoting factor Mto1 (22). In addition, we performed high temporal resolution (5-s intervals) live-cell microscopy to observe dynamic localization of Rsp1-2mNeonGreen and Klp2-tdTomato and confirmed that Rsp1-2mNeonGreen colocalized with some Klp2-tdTomato puncta (Fig. 1E), presumably at growing microtubule plus ends, as Klp2 localizes to growing microtubule plus ends in an Mal3-dependent manner (8, 27). Thus, Klp2 and Rsp1 interacts physically but do not always colocalize on microtubules.
Rsp1 localizes to microtubules in a Klp2-dependent manner
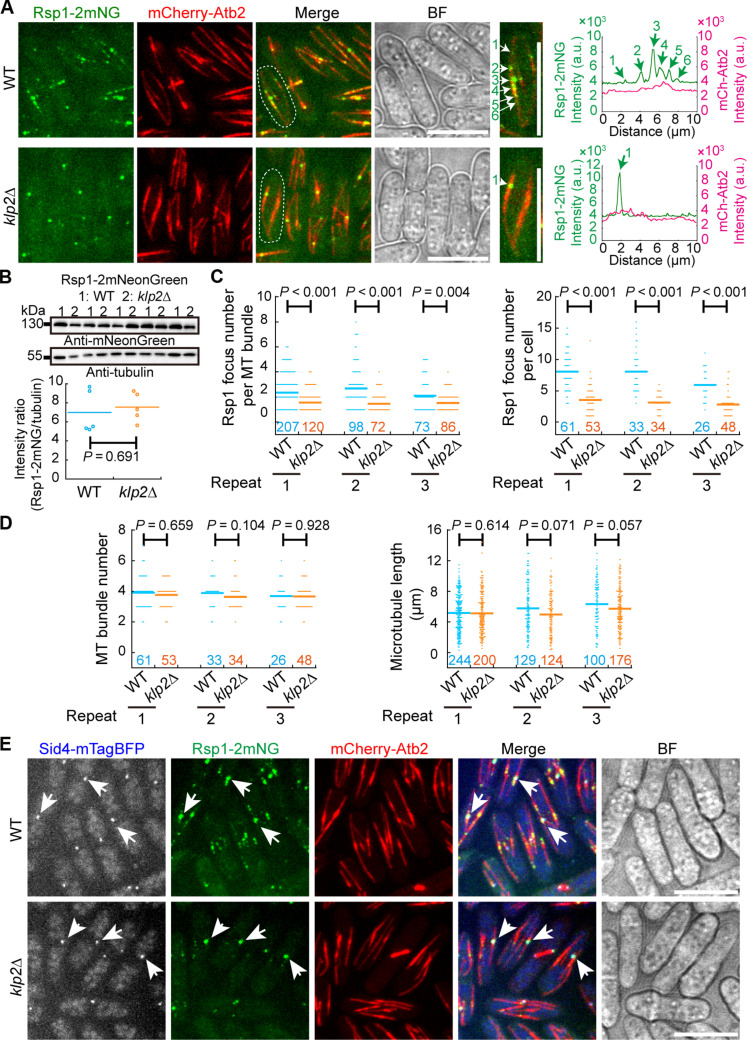
Next, we investigated the localization interdependency of Rsp1 and Klp2. Specifically, we compared wild type (WT) and klp2-deleted (klp2Δ) cells expressing Rsp1-2mNeonGreen and mCherry-Atb2 (α-tubulin tagged with mCherry). The absence of Klp2 impaired the localization of Rsp1-2mNeonGreen to the microtubule lattice (Fig. 2A). This was not due to a change in Rsp1-2mNeonGreen expression as the expression level of Rsp1-2mNeonGreen was comparable in WT and klp2Δ cells (Fig. 2B). Quantification revealed that WT cells had more Rsp1-2mNeonGreen foci on a microtubule bundle or in a cell than klp2Δ cells (Fig. 2C). Of note, the absence of Klp2 did not alter the number and length of microtubule bundles (Fig. 2D and fig. S1, A and B). Therefore, the reduction of Rsp1-2mNeonGreen foci in klp2Δ cells was not due to a change in the number and length of microtubule bundles. The microtubule growth rate, but not the microtubule shrinkage rate of klp2Δ cells, decreased slightly but significantly (fig. S1, C and D). This finding may reflect the alteration of free tubulin in the cytoplasm of klp2Δ cells because the alteration in the availability of free tubulin is expected to affect microtubule growth. Using a strain carrying the SPB marker Sid4, tagged with mTagBFP, we found that the remaining brightest Rsp1-2mNeonGreen dot in klp2Δ cells corresponded to the SPB (Fig. 2E) (22). Hence, Klp2 is required to mediate the localization of Rsp1 to the non-SPB sites within a microtubule bundle.
Fig. 2. Klp2-dependent localization of Rsp1 on the microtubule lattice.
(A) Maximum projection images of WT and klp2-deletion (klp2Δ) cells expressing Rsp1-2mNeonGreen and mCherry-Atb2. Dashed white lines indicate the magnified cells shown on the right. Line-scan intensity profiles of the indicated microtubules are shown on the right. White and green arrows indicate Rsp1 puncta on microtubule bundles. Note that the localization of Rsp1 to the microtubule lattice is impaired in klp2Δ cells. Scale bar, 10 μm. (B) Expression of Rsp1-2mNeonGreen in WT and klp2Δ cells. Antibodies against mNeonGreen and tubulin were used for the Western blotting assays. Intensity ratio of Rsp1-2mNeonGreen over tubulin was quantified below. Five sets of samples were analyzed. The P value was calculated by the Wilcoxon–Mann-Whitney rank sum test, and the bars represent the mean. (C) Quantification of Rsp1-2mNeonGreen foci per microtubule bundle and per cell. Cells in (A) were used for the quantification. Three independent experiments (indicated by repeat) were performed, and the number of microtubule bundles or cells analyzed is indicated. The P values were calculated by the Wilcoxon–Mann-Whitney rank sum test, and the bars represent the mean. (D) Quantification of microtubule bundle number per cell on the left and microtubule bundle length on the right. Cells in (A) were used for the quantification. Three independent experiments (indicated by repeat) were performed, and the number of cells or microtubule bundles analyzed is indicated. The P values were calculated by the Wilcoxon–Mann-Whitney Rank Sum test, and the bars represent the means. (E) Maximum projection images of WT and klp2Δ cells expressing Rsp1-2mNeonGreen, Sid4-mTagBFP (the SPB marker), and mCherry-Atb2. White arrows indicate the SPB and the SPB-localized Rsp1. BF, bright field. Scale bar, 10 μm.
Rsp1 does not regulate the localization of Klp2 to microtubules
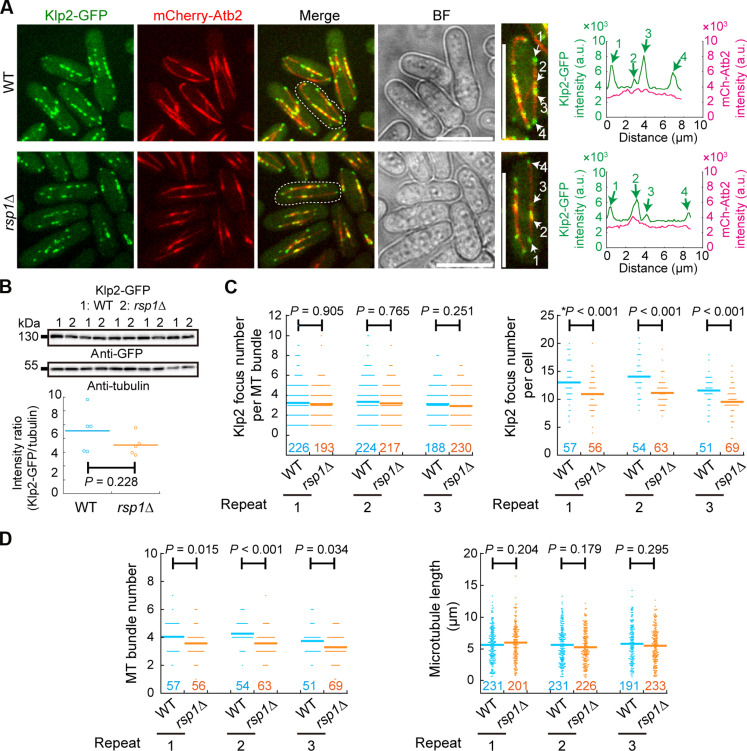
To test whether Rsp1 regulates Klp2 localization, we analyzed the localization of Klp2 in WT and rsp1Δ cells. Live-cell microscopy revealed that the absence of Rsp1 did not affect the localization of Klp2 to microtubules (Fig. 3A). Neither was the expression level of Klp2 affected by the absence of Rsp1 (Fig. 3B). Quantification confirmed that the number of Klp2 foci on a microtubule bundle was similar in WT and rsp1Δ cells (Fig. 3C, left). The number of Klp2 foci in a cell was slightly more in WT cells than in rsp1Δ cells (Fig. 3C, right). As Klp2 localizes to only microtubule plus ends (8), the reduced number of Klp2 foci in rsp1Δ cells reflects the reduced microtubule bundle number in rsp1Δ cells, as reported previously (22, 24). Consistently, quantification confirmed that the number of microtubule bundles significantly decreased in rsp1Δ (Fig. 3D, left) but the average length of microtubule bundles remained unchanged in rsp1Δ (Fig. 3D, right). Thus, we conclude that Klp2 is necessary for localizing Rsp1 to microtubules but not vice versa.
Fig. 3. Rsp1-independent localization of Klp2 to microtubules.
(A) Maximum projection images of WT and rsp1Δ cells expressing Klp2-GFP and mCherry-Atb2. Dashed white lines indicate the magnified cells on the right. Line-scan intensity profiles of the indicated microtubule bundles are shown on the right; white and green arrows indicate Klp2 puncta on microtubule bundles. Scale bar, 10 μm. (B) Expression of Klp2-GFP in WT and rsp1Δ cells. Antibodies against GFP and tubulin were used for the Western blotting assays. Intensity ratio of Klp2-GFP over tubulin was quantified below. Five sets of samples were analyzed. The P value was calculated by Student’s t test, and the bars represent the mean. (C) Quantification of Klp2-GFP foci per microtubule bundle and per cell. Cells in (A) were used for the quantification. Three independent experiments (indicated by repeat) were performed, and the number of microtubule bundles or cells analyzed is indicated. The P values were calculated by the Wilcoxon–Mann-Whitney rank sum test, and the asterisk mark the P value calculated by Student’s t test. Bars are the means. (D) Quantification of microtubule bundle number per cell on the left and microtubule bundle length on the right. Cells in (A) were used for the quantification. Three independent experiments (indicated by repeat) were performed, and the number of cells or microtubule bundles analyzed is indicated. The P values were calculated by the Wilcoxon–Mann-Whitney Rank Sum test, and the bars represent the means. BF, bright field.
Klp2 regulates the localization of Ase1 on microtubules and inhibits microtubule-dependent microtubule assembly
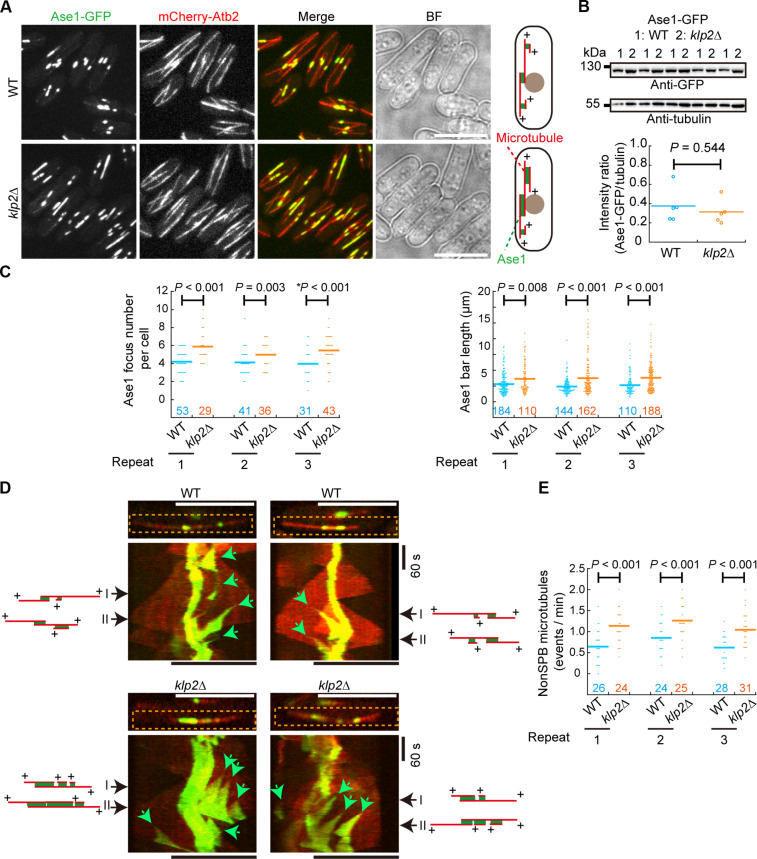
Klp2 and the microtubule cross-linker Ase1 work in concert to organize antiparallel microtubule arrays (8). Ase1 localizes preferentially to the overlapping region of antiparallel microtubules (28, 29) and thus serves as an ideal marker for non-SPB microtubules that are generated on preexisting microtubules. Therefore, we examined microtubule-dependent microtubule assembly in WT and klp2Δ cells expressing Ase1-GFP and mCherry-Atb2 (Fig. 4A). Western blotting assays revealed that the expression level of Ase1-GFP was comparable in WT and klp2Δ cells (Fig. 4B). Quantification revealed that klp2Δ cells had more Ase1 foci/bars in a cell (Fig. 4C), suggesting that more non-SPB microtubules emerged on a preexisting microtubule in klp2Δ cells. In addition, we measured the length of Ase1 bars, revealing that klp2Δ cells contained more Ase1 bars with a longer length than WT cells (Fig. 4, A and C). To directly observe non-SPB microtubules generated on existing ones, we performed live-cell imaging at a high temporal resolution (3-s intervals) to monitor Ase1 and microtubule dynamics in WT and klp2Δ cells (Fig. 4D). Kymograph analysis revealed that non-SPB microtubules were visible in both WT and klp2Δ cells and merging events of non-SPB microtubules were detectable (Fig. 4D). Quantification showed that the frequency of non-SPB microtubule generation was significantly higher in klp2Δ cells than in WT cells (Fig. 4E). Despite the crucial role of Klp2 in inhibiting the generation of non-SPB microtubules within a microtubule bundle, Klp2 did not appear to regulate microtubule generation at other MTOCs, including the ones on the nuclear envelope and within the cytoplasm, because the absence of Klp2 did not affect microtubule generation from these MTOCs (fig. S2). Collectively, the absence of Klp2 enhances microtubule-dependent microtubule assembly, i.e., Klp2 plays a crucial role in inhibiting microtubule-dependent microtubule assembly.
Fig. 4. Klp2 inhibits microtubule-dependent microtubule assembly.
(A) Maximum projection images of WT and klp2Δ cells expressing Ase1-GFP and mCherry-Atb2. Diagrams illustrate Ase1 localization on microtubules. Scale bar, 10 μm. (B) Expression of Ase1-GFP in WT and klp2Δ cells. Antibodies against GFP and tubulin were used for the Western blotting assays. Intensity ratio of Ase1-GFP over tubulin was quantified below. Five sets of samples were analyzed. The P value was calculated by Student’s t test, and the bars represent the mean. (C) Quantification of Ase1 focus/bar number per cell on the left and Ase1 focus/bar length on the right. Cells in (A) were used for the quantification. Three independent experiments (indicated by repeat) were performed, and the number of cells or Ase1 foci/bars analyzed is indicated. The P values were calculated by the Wilcoxon–Mann-Whitney Rank Sum test, and the asterisk marks the P value calculated by Student’s t test. Bars represent the mean. (D) Kymograph graphs of Ase1-GFP and mCherry-Atb2 in WT and klp2Δ cells. Dashed rectangles indicate the microtubules bundles for the kymograph analysis (below). Green arrows indicate the generation of non-SPB microtubules. Diagrams illustrate Ase1-GFP localization and microtubule organization at the time point indicated by black arrows. Scale bar, 10 μm. (E) Frequency of non-SPB microtubule assembly in WT and klp2Δ cells. The frequency was calculated by dividing observation time (in minutes) by total number of non-SPB microtubule assembly events. Note that the absence of Klp2 increases the frequency. Three independent experiments (indicated by repeat) were performed. The P value was calculated by Student’s t test, and the number of microtubule bundles analyzed is indicated. Bars are the means. BF, bright field.
Klp2 promotes the colocalization of Rsp1 and Mto1 foci on microtubules
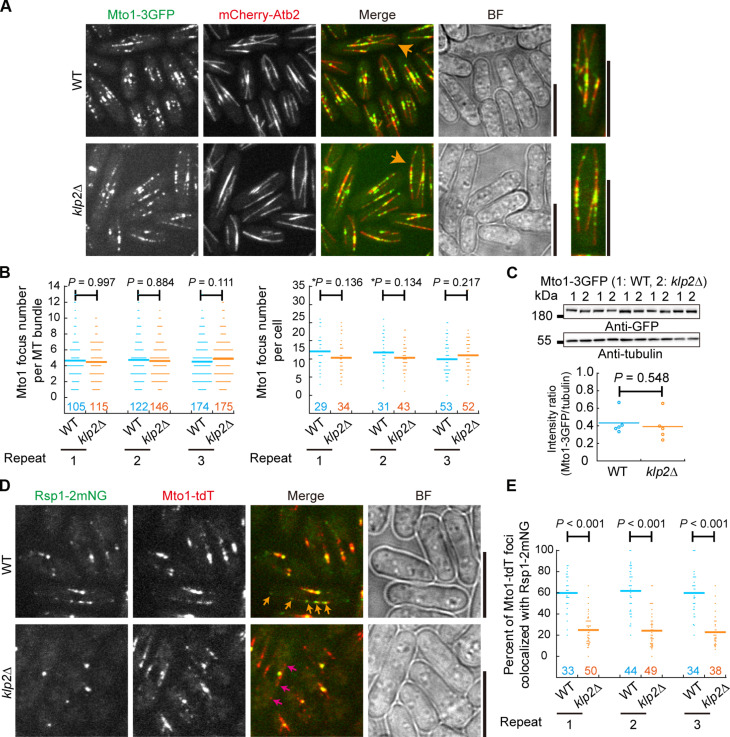
Mto1 forms a complex with Mto2 and localizes to the microtubule lattice to promote non-SPB microtubule assembly (13, 17, 21). We examined the localization of Mto1-3GFP on microtubules in WT and klp2Δ cells (Fig. 5A). The absence of Klp2 did not affect the localization of Mto1-3GFP on a microtubule bundle or in a cell (Fig. 5B) and did not alter Mto1-3GFP expression (Fig. 5C). We then examined the colocalization of Rsp1-2mNeonGreen and Mto1-tdTomato in WT and klp2Δ cells (Fig. 5D). The proportion of Rsp1-2mNeonGreen and Mto1-tdTomato foci that overlapped was significantly lower in klp2Δ cells than in WT cells (Fig. 5E).
Fig. 5. Klp2 does not alter the localization of Mto1 on microtubules.
(A) Maximum projection images of WT and klp2Δ cells expressing Mto1-3GFP and mCherry-Atb2. Orange arrows indicate the magnified images on the right. Scale bar, 10 μm. (B) Quantification of Mto1-3GFP foci per microtubule bundle and per cell. Three independent experiments (indicated by repeat) were performed, and the number of microtubule bundles or cells analyzed is indicated. The P values were calculated by the Wilcoxon–Mann-Whitney rank sum test, and asterisks mark the P values calculated by Student’s t test. Bars are the means. (C) Expression of Mto1-3GFP in WT and klp2Δ cells. Antibodies against GFP and tubulin were used for the Western blotting assays. Intensity ratio of Mto1-3GFP over tubulin was quantified below. Five sets of samples were analyzed. The P value was calculated by the Wilcoxon–Mann-Whitney rank sum test, and bars represent the means. (D) Maximum projection images of WT and klp2Δ cells expressing Rsp1-2mNeonGreen and Mto1-tdTomato. Orange arrows, Mto1-tdTomato puncta colocalizing with Rsp1-2mNeonGreen; pink arrows, Mto1-tdTomato puncta not colocalizing with Rsp1-2mNeonGreen. Scale bar, 10 μm. (E) The percentage of Mto1-tdTomato puncta colocalizing with Rsp1-2mNeonGreen in WT and klp2Δ cells. Three independent experiments (indicated by repeat) were performed, and the number of cells analyzed is indicated. The P values were calculated by the Wilcoxon–Mann-Whitney rank sum test, and bars are the means. BF, bright field.
To observe the initial events of Rsp1 localization on microtubules, we depolymerized microtubules in cells that were grown in a perfusion chamber and monitored Rsp1 localization after microtubule regrowth (fig. S3, A to C). We found that Rsp1 signals appeared on microtubules as soon as microtubule growth resumed in WT cells but not in klp2Δ cells (fig. S3, A to C). In WT cells, multiple Rsp1 foci emerged as microtubule growth resumed, whereas in klp2Δ cells, only the SPB-localized Rsp1 existed (fig. S3, A to C). Quantification revealed that the percentage of microtubules (in a cell) displaying non-SPB Rsp1-2mNeonGreen signals was significantly higher in WT cells (~89.2%) than in klp2Δ cells (~5.7%) (fig. S3D). In addition, we analyzed the localization dynamics of Mto1 and Rsp1 by high temporal resolution (5-s intervals) live-cell microscopy. In addition to the static localization at the SPB, Mto1 exhibited a directive motion toward the SPB, which may be due to the pulling of Klp2 at the plus ends of the non-SPB microtubules (fig. S4A) (8). Non-SPB–localized Mto1 foci that were immotile were also found (fig. S4A). Similarly, motile and immotile Rsp1 foci were observed (fig. S4B), and the motile foci likely represented growing microtubule plus ends because the average velocity of the motile Rsp1 foci was approximate 3 μm/min, a value close to the microtubule growth rate (fig. S4C). Collectively, these results suggest that Klp2 inhibits microtubule-dependent microtubule assembly by recruiting Rsp1 to the microtubule lattice and enhancing the colocalization between Rsp1 and Mto1 on microtubules.
Klp2 transports Rsp1 to the sites of Mto1 activity
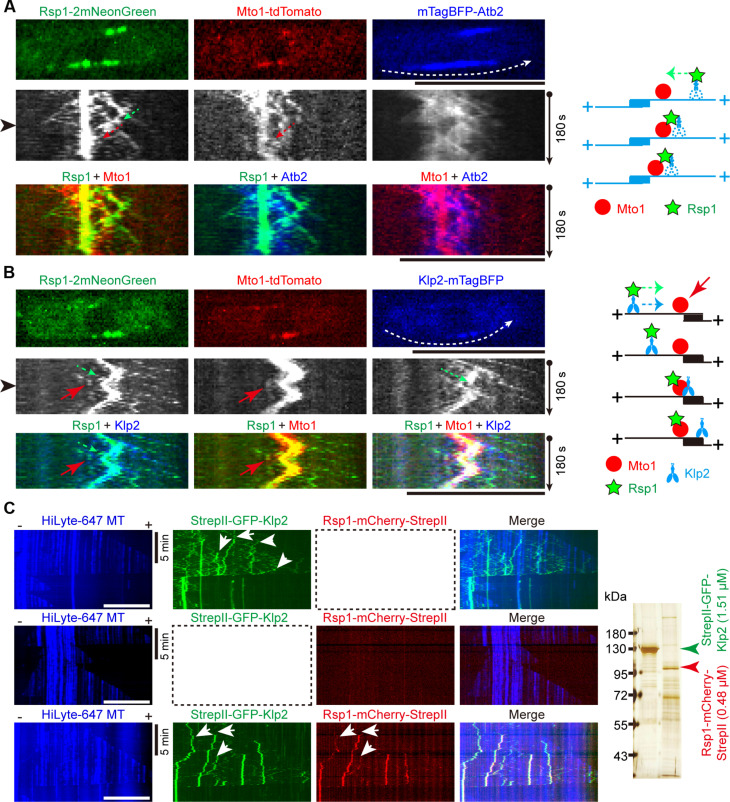
Using a strain coexpressing Rsp1-2mNeonGreen, Mto1-tdTomato, and mTagBFP-Atb2, we directly observed the localization dynamics of Rsp1 and Mto1 on a microtubule bundle (Fig. 6A). We found cases in which Rsp1-2mNeonGreen moved directionally toward the SPB and encountered and comigrated with Mto1-tdTomato. Moreover, we created a strain coexpressing Rsp1-2mNeonGreen, Mto1-tdTomato, and Klp2-mTagBFP and performed live-cell imaging to observe their localization dynamics (Fig. 6B). We found cases in which Rsp1-2mNeonGreen and Klp2-mTagBFP comigrated toward the SPB before encountering Mto1-tdTomato, and Rsp1-2mNeonGreen colocalized with Mto1-tdTomato afterward. Total internal reflection fluorescence (TIRF) microscopy confirmed that GFP-Klp2 recruits and transports Rsp1-mCherry along a microtubule (Fig. 6C). To provide insights into understanding how Klp2, Rsp1, and Mto1 interact with each other within the cell, we also determined the molecular stoichiometry of Klp2, Rsp1, and Mto1 within the cell by Western blotting assays, using Rlc1 as an internal reference, whose concentration is approximate 0.6 μM determined previously (30). The concentrations of Klp2, Rsp1, and Mto1 were estimated to be approximate 0.202, 0.121, and 0.079 μM, respectively (fig. S5, A to C). Because Klp2, a kinesin motor protein, generally functions as dimers within a cell, 0.202 μM of Klp2 can bind 0.101 μM of Rsp1, which is lower than the one determined here (i.e., 0.121 μM). This is consistent with the finding that only some Rsp1-2mNeonGreen foci colocalized with Klp2-tdTomato (Fig. 1, C to E). The number of Rsp1 and Klp2 is 1.5- and 2.6-fold more than the number of Mto1, respectively, within a cell (fig. S5). Collectively, these results support a model in whichKlp2 transports Rsp1 along microtubules and targets it to the sites of Mto1 activity.
Fig. 6. The localization dynamics of Klp2, Rsp1, and Mto1.
(A) Kymograph graphs of Rsp1-2mNeonGreen, Mto1-tdTomato, and mTagBFP-Atb2 in WT cells. Dashed white arrow in the image shown on the top indicates the path that was used to generate the graph below, and the cell image shown on the top corresponds to the intensity profile indicated by the black arrowhead. Dashed green arrow indicates the trajectory of Rsp1-2mNeonGreen movements. Dashed red arrow indicates the comigration motion of Rsp1-2mNeonGreen and Mto1-tdTomato. Diagram illustrating the indicated localization dynamics of Rsp1-2mNeonGreen and Mto1-tdTomato is shown on the right. Scale bar, 10 μm. (B) Kymograph graphs of Rsp1-2mNeonGreen, Mto1-tdTomato, and Klp2-mTagBFP in WT cells. Dashed white arrow in the image shown on the top indicates the path that was used to generate the graph below, and the cell image shown on the top corresponds to the intensity profile indicated by the black arrowhead. Dashed green arrow indicates the comigration motion of Rsp1-2mNeonGreen and Klp2-mTagBFP; red arrows indicate the comigration motion of Rsp1-2mNeonGreen and Mto1-tdTomato. Diagram illustrating the indicated localization dynamics of Rsp1-2mNeonGreen, Mto1-tdTomato, and Klp2-mTagBFP is shown on the right. Scale bar, 10 μm. (C) Kymograph graphs of the indicated sets of TIRF microtubule experiments: (i) HiLyte Fluor-647–tubulin and StrepII-GFP-Klp2; (ii) HiLyte Fluor-647–tubulin and Rsp1-mCherry-StrepII; and (iii) HiLyte Fluor-647–tubulin, StrepII-GFP-Klp2, and Rsp1-mCherry-StrepII. White arrows indicate microtubule-associated Klp2 and/or Rsp1. Horizontal scale bars, 10 μm; vertical scale bars, 5 min. Silver staining gel of StrepII-GFP-Klp2 and Rsp1-mCherry-StrepII used in the TIRF microtubule experiments is shown on the right, and the corresponding protein concentrations are indicated.
Mto1-Mto2 physically interacts with Rsp1-Ssa1 and γ-TuSC in vitro
To understand how the enhancement of the colocalization between Rsp1 and Mto1 inhibits microtubule-dependent microtubule assembly, we investigated the interactions among Mto1, Rsp1, and γ-TuSC by pull-down assays, which require generation and purification of the corresponding proteins. In addition to γ-TuSC, Mto1 and Rsp1 execute functions by forming complexes with their interacting proteins. Therefore, we copurified Mto1 and Rsp1 with their interacting proteins for the pull-down assays.
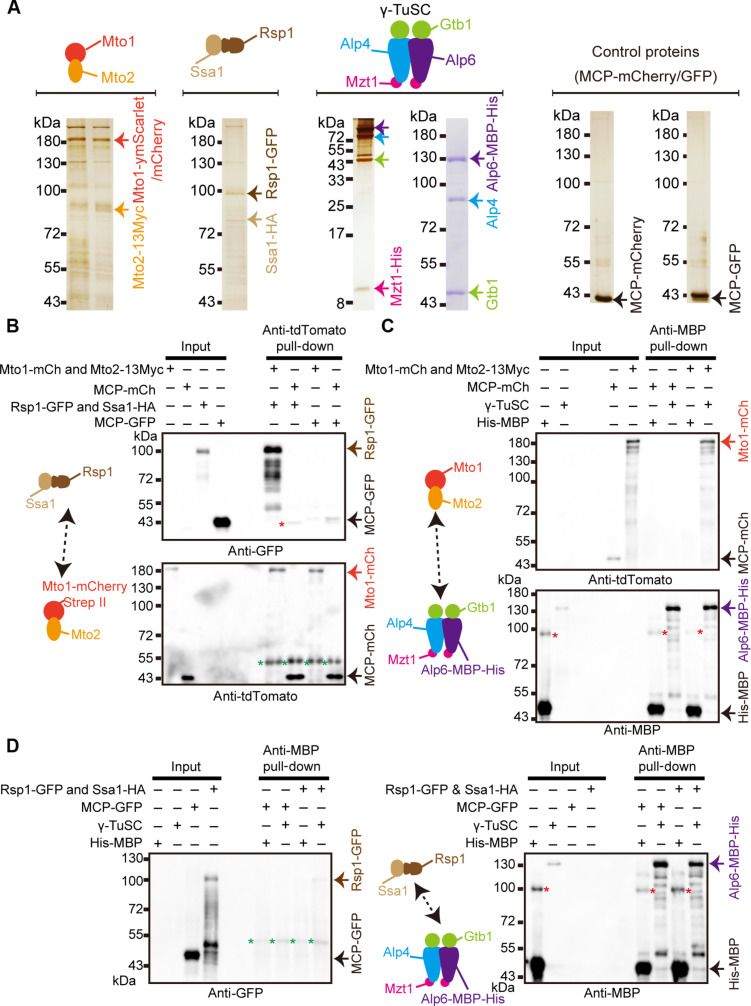
Specifically, it has been established that Mto1 and Mto2 form a complex to promote microtubule nucleation (17, 19, 20). Thus, we copurifed Mto1-ymScarlet-StrepII or Mto1-mCherry-StrepII and Mto2-13Myc from S. pombe cells with streptactin resins (Fig. 7A, left, and fig. S6) and used them in the biochemical assays stated below.
Fig. 7. Interactions between Mto1-Mto2, Rsp1-Ssa1, and the γ-tubulin small complex.
(A) Protein purification. Mto1-ymScarlet-StrepII or Mto1-mCherry-StrepII was coexpressed with Mto2-13Myc in S. pombe cells and copurified with streptactin resins. Rsp1-GFP-StrepII was coexpressed with Ssa1-HA in S. pombe cells and copurified with streptactin resins. The γ-TuSC consisting of Alp6-MBP-His, Alp4 (without tag), and Gtb1 (without tag), and Mzt1-His were expressed in High Five insect cells and copurified with amylose resins. MCP-mCherry-StrepII or MCP-GFP-StrepII was expressed in HEK293T cells and copurified with streptactin resins. (B) Interaction assay between Mto1-Mto2 and Rsp1-Ssa1 using the purified proteins in (A). Mto1-mCherry-StrepII-Mto2-13Myc or control MCP-mCherry-StrepII was bound to tdTomato antibody–coated Protein A magnetic beads and incubated with Rsp1-GFP-StrepII-Ssa1-HA or control MCP-GFP-StrepII. Antibodies against tdTomato and GFP were used in the Western blotting analysis. Note that the tdTomato antibody recognized mCherry tag. Green asterisks indicate antibody heavy chain, and red asterisk indicates a nonspecific band. A representative result from two independent experiments is shown. (C) Interaction assay between Mto1-Mto2 and γ-TuSC using the purified proteins in (A). γ-TuSC or His-MBP was bound to MBP antibody–coated Protein A magnetic beads and incubated with Mto1-mCherry-StrepII-Mto2-13Myc complex or control MCP-mCherry-StrepII. Antibodies against tdTomato and MBP were used in the Western blotting assays. Red asterisks indicate nonspecific bands. A representative result from three independent experiments is shown. (D) Interaction assay between Rsp1-Ssa1 and γ-TuSC using the purified proteins in (A). γ-TuSC or His-MBP was bound to MBP antibody–coated Protein A magnetic beads and incubated with Rsp1-GFP-StrepII-Ssa1-HA complex or control MCP-GFP-StrepII. Antibodies against GFP and MBP were used in the Western blotting assays. Red asterisks, nonspecific bands; green asterisks, antibody heavy chain. A representative result from two independent experiments is shown.
It has been unclear how the cochaperone Rsp1 function to inhibit microtubule assembly. Nonetheless, Rsp1 forms a complex with Ssa1 (i.e., Hsp70) to promote equatorial MTOCs disassembly (24). Given the intimate relationship between Ssa1 and Rsp1, we copurified Rsp1-GFP-StrepII and Ssa1-HA from S. pombe cells with streptactin resins (Fig. 7A, second panel from the left, and fig. S6) and used the Rsp1-Ssa1 complex in the biochemical assays stated below.
Last, γ-TuSC components Alp6–maltose binding protein (MBP)–His, Alp4 (without tag), and Gtb1 (without tag), and Mzt1-His were coexpressed in High Five insect cells and purified with amylose resins (images next to the right most panel, Fig. 7A and fig. S6). In addition, control proteins MS2-coat protein (MCP)–mCherry-StrepII and MCP-GFP-StrepII were expressed and purified from human embryonic kidney (HEK) 293T cells with streptactin resins (Fig. 7A, right).
To test the interaction between Rsp1-Ssa1 and Mto1-Mto2, Mto1-mCherry-StrepII-Mto2-13Myc, or MCP-mCherry-StrepII was immobilized on Protein A magnetic beads with an antibody against tdTomato (note that this antibody also recognizes mCherry) and incubated with Rsp1-GFP-StrepII-Ssa1–hemagglutinin (HA) or MCP-GFP-StrepII. After wash, the precipitated protein samples were analyzed by Western blotting with antibodies against GFP and mCherry. As shown in Fig. 7B, Mto1-mCherry-StrepII-Mto2-13Myc–coated beads precipitated Rsp1-GFP-StrepII-Ssa1-HA, but not MCP-GFP-StrepII. This result suggests that Mto1-Mto2 and Rsp1-Ssa1 interact physically, which is consistent with our previous in vivo data (22). We also confirmed the interaction between Mto1-Mto2 and γ-TuSC (17, 20, 31) (Fig. 7C), using a similar method. However, we did not observe a strong affinity between Rsp1-Ssa1 and γ-TuSC in vitro (Fig. 7D). Thus, Mto1-Mto2 interacts with both Rsp1-Ssa1 and γ-TuSC, whereas Rsp1-Ssa1 weakly interact with γ-TuSC.
Rsp1-Ssa1 and γ-TuSC interact with Mto1-Mto2 in a competitive manner in vitro
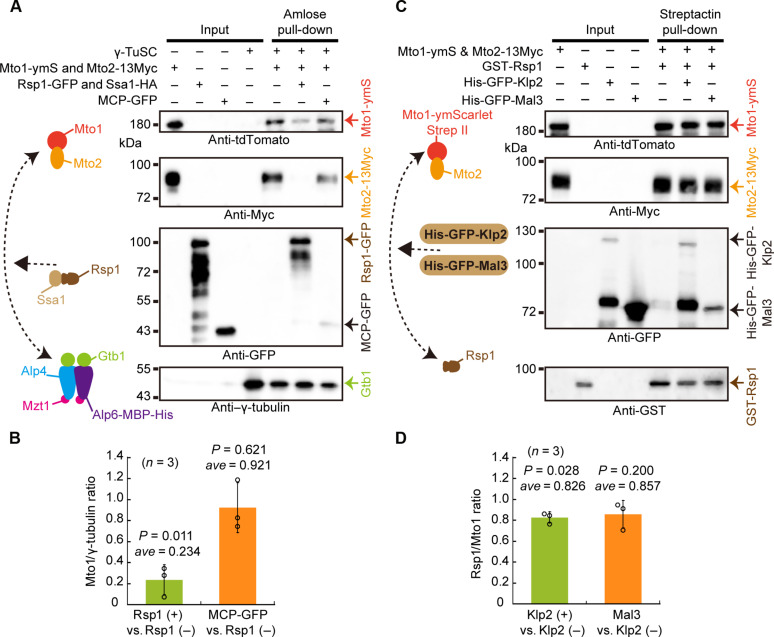
Given that Mto1-Mto2 interacts with both Rsp1-Ssa1 and γ-TuSC, we further tested how Rsp1-Ssa1 affects the interaction between Mto1-Mto2 and γ-TuSC. We first immobilized γ-TuSC on amylose resins via Alp6-MBP-His and then incubated γ-TuSC–coated amylose resins with Mto1-ymScarlet-StrepII-Mto2-13Myc, with Mto1- ymScarlet-StrepII-Mto2-13Myc and Rsp1-GFP-StrepII-Ssa1-HA, or with Mto1- ymScarlet-StrepII-Mto2-13Myc and MCP-GFP-StrepII. We found that the presence of Rsp1-GFP-StrepII-Ssa1-HA, but not MCP-GFP-StrepII, substantially reduced the binding of Mto1-Mto2 to γ-TuSC (Fig. 8, A and B). Consistently, Rsp1 overexpression notably reduced the colocalization between Mto1 and Alp4-GFP, a component of γ-TuSC (fig. S7, A and B).
Fig. 8. Rsp1-Ssa1 affects the interaction between Mto1-Mto2 and γ-TuSC and Klp2 slightly affects the interaction between Mto1-Mto2 and Rsp1.
(A) Competitive binding assay of Rsp1-Ssa1 and Mto1-Mto2 to γ-TuSC. The purified proteins from Fig. 7A were used. γ-TuSC was immobilized on amylose resins and incubated with either Mto1-ymScarlet-StrepII-Mto2-13Myc alone, Mto1-ymScarlet-StrepII-Mto2-13Myc, and Rsp1-GFP-StrepII-Ssa1-HA, or Mto1-ymScarlet-StrepII-Mto2-13Myc and MCP-GFP. Antibodies against tdTomato, Myc, GFP, and γ-tubulin were used in the Western blotting assays. Note that the tdTomato antibody recognized ymScarlet. (B) Quantification of the band intensity of Mto1 relative to Gtb1. Rsp1(+) versus Rsp1(−), the intensity ratio of the middle lane over the leftmost lane (pull-down samples); MCP-GFP versus Rsp1(−), the intensity ratio of the rightmost lane over the leftmost (pull-down samples). Three independent experiments were performed. Error bars indicate the SD, and P values were calculated by Student’s t test. (C) Competitive binding assay of Rsp1 and Klp2 or Mal3 to Mto1-Mto2. Mto1-ymScarlet-StrepII-Mto2-13Myc was bound to Streptactin resins and incubated with either GST-Rsp1 alone, GST-Rsp1, and His-GFP-Klp2, or GST-Rsp1 and His-GFP-Mal3. Antibodies against tdTomato, Myc, GFP, and GST were used in the Western blotting assays. (D) Quantification of the band intensity of Rsp1 relative to Mto1. Klp2(+) versus Klp2(−), the intensity ratio of the middle lane over the leftmost lane (pull-down samples); Mal3 versus Klp2(−), the intensity ratio of the rightmost lane over the leftmost (pull-down samples). Three independent experiments were performed. Error bars indicate the SD, and P values were calculated by Student’s t test.
Since Rsp1 interacts with both Klp2 and Mto1 (Figs. 1B and 7B), we further tested the effect of Klp2 on the interaction Mto1-Mto2 and Rsp1. Competitive pull-down assays revealed that the presence of Klp2 only slightly reduced the binding of Mto1-Mto2 to Rsp1 (0.826-fold of the original), which was similar to the result obtained with control protein Mal3 (Fig. 8, C and D). Collectively, these results suggest that Rsp1-Ssa1 plays a role in inhibiting the interaction of Mto1-Mto2 and γ-TuSC, while Klp2 does not have a notable effect on the interaction of Rsp1 and Mto1-Mto2.
DISCUSSION
Mto1 (CDK5RAP2 in humans) promotes microtubule-dependent microtubule assembly by activating microtubule nucleation on the microtubule lattice (13, 17, 21). However, not all Mto1 foci on a microtubule lattice can initiate microtubule assembly at the same time (22), indicating the presence of a mechanism that inhibits Mto1 activity and prevents excessive microtubule assembly on a preexisting microtubule. We propose a model in which Klp2 mediates colocalization of Rsp1 and Mto1 and inhibits Mto1-dependent microtubule assembly via Rsp1 (Fig. 9).
Fig. 9. Working model illustrating the role of Klp2 in inhibiting microtubule-dependent microtubule assembly.
The synergism of Klp2, Rsp1, and Mto1 in regulating microtubule-dependent microtubule assembly. In WT cells, Klp2 transports Rsp1 along the preexisting microtubules toward the minus end and delivers Rsp1 to Mto1. Rsp1 interacts with Mto1 and prevents microtubule-dependent microtubule assembly. In klp2Δ cells, Rsp1 fails to reach Mto1 on the microtubules, and thus, Mto1-mediated non-SPB microtubule assembly is enhanced.
The model is supported by the findings that the absence of Klp2 abolished the localization of Rsp1, but not Mto1, to microtubules (Figs. 2A and 5A) and enhanced non-SPB microtubule assembly (Fig. 4, D and E). This may seem to contradict our previous report that the absence of Rsp1 impairs non-SPB microtubule assembly on preexisting microtubules (22). However, there is a key difference between the two studies. In the present work, Rsp1 is absent specifically from the microtubule lattice in klp2Δ cells, but not from the SPB (Fig. 2E), whereas in our previous work (22), Rsp1 is absent from the whole cell (i.e., rsp1Δ cells). Since Rsp1 facilitates the localization of Mto1 to the microtubule lattice by indirectly preventing accumulation of Mto1 at the SPB (22), the absence of Rsp1 in rsp1Δ cells leads to more Mto1 at the SPB and, consequently, less Mto1 on the microtubule lattice. However, in klp2Δ cells, as shown here, Rsp1 still localizes to the SPB but not to the microtubule lattice (Fig. 2E). Moreover, unlike in rsp1Δ cells, the localization of Mto1 to the microtubule lattice in klp2Δ cells was unaffected (Fig. 5A). Thus, the reduced colocalization Rsp1 and Mto1 in klp2Δ cells relieves the inhibition on Mto1 and promotes microtubule-dependent microtubule assembly.
Our biochemical data confirmed the physical interactions of Mto1-Mto2 with Rsp1-Ssa1 and γ-TuSC (Fig. 7, B and C). It is unlikely that Rsp1-Ssa1 regulates γ-TuSC directly as their interaction is weak (Fig. 7D). Rsp1-Ssa1 may regulate γ-TuSC indirectly through Mto1-Mto2 as the presence of Rsp1-Ssa1 significantly reduced the binding of Mto1-Mto2 to γ-TuSC in vitro (Fig. 8, A and B). In agreement with this, we previously reported that Rsp1 overexpression reduces the affinity of Mto1 for Alp4 (22), a component of γ-TuSC, and decreases microtubule bundle number (22). Moreover, Rsp1 overexpression reduces the colocalization of Mto1 and Alp4 (fig. S7A). Therefore, Rsp1-Ssa1 forms a complex with Mto1-Mto2 to inhibit microtubule assembly.
The present work also demonstrates that Klp2 mediates the colocalization between Rsp1 and Mto1 on the microtubule lattice. Similar to Mto1, Klp2 physically interacts with Rsp1 (Fig. 1, A and B). Moreover, Klp2 is required for the localization of Rsp1, but not Mto1, to the microtubule lattice (Fig. 2A and Fig. 5A). We reported previously that Mto1 is also required for the localization of Rsp1 to the microtubule lattice, but not the SPB (22). These results support a model in which Mto1 is necessary, but not sufficient, for targeting Rsp1 to the microtubule lattice. For efficient targeting of Rsp1 to Mto1 on microtubules, Klp2 is required. In agreement with this model, the absence of Klp2 significantly decreases the proportion of Mto1 foci that overlap with Rsp1 (Fig. 5, D and E). Klp2 is a minus end–directed kinesin and localizes to microtubule plus ends in an Mal3-dependent manner (8, 27). In addition, Klp2 synergizes with Ase1 to organize antiparallel microtubule arrays (8). Thus, Klp2 that resides at the plus ends of newly generated non-SPB microtubules may recruit Rsp1 and deliver it to Mto1 (Fig. 6B), by which Mto1-mediated assembly of non-SPB microtubules is inhibited (Fig. 9).
What is the function of the Klp2-dependent mechanism that inhibits microtubule-dependent microtubule assembly? In general, in WT cells, the overlapping regions of antiparallel microtubule bundles are short and close to the nucleus (Fig. 4A), which is generally positioned at the middle of a cell (32). However, in klp2Δ cells, the overlapping regions of antiparallel microtubule bundles are longer and randomly distributed along the whole microtubule bundles (Fig. 4, C to E). Thus, the Klp2-dependent mechanism may help to define the middle overlapping region of an antiparallel microtubule bundle, which is required to direct proper positioning of the nucleus (32). In conclusion, this study uncovers an uncharacterized role of Klp2 in inhibiting microtubule-dependent microtubule assembly and provides insights into how the interphase microtubule bundles are spatiotemporally organized.
MATERIALS AND METHODS
Yeast strains construction
Yeast strains were constructed by random spore analysis or tetrad dissection. Gene deletion and tagging were achieved by the polymerase chain reaction–based homologous recombination method by using the pFA6a series of plasmids. The fluorescently tagged proteins shown in Figs. 1 to 6 were expressed from their own promoters (except Rsp1-GFP and Rga6-GFP in Fig. 1A, which were expressed from the cam1 promotor). Yeast transformation was performed by using the lithium acetate method. The strains used in this study are listed in table S1.
Molecular cloning
Plasmids were constructed using two methods: the conventional method of digestion and ligation with restriction enzymes (NEB) and T4 ligase (NEB) or homologous recombination with the ClonExpressII one-step cloning kit (Vazyme). The plasmids used in this study are listed in table S2.
For coexpression of γ-TuSC and Mzt1-His, plasmids were constructed, as previously reported (31). alp6 (GCP3, pCF.4541), alp4 (GCP2, pCF.4542), gtb1 (γ-tubulin, pCF.4544), mzt1 (MOZART1, pCF.4543), and MBP (MBP tag, pCF.4545) gene were synthesized and codon optimized by Sangon Biotech). These genes were subcloned into pFastBac Dual, a vector for simultaneous expression of two proteins in insect cells. mzt1 was digested with BamHI and NotI and ligated into pFastBac1 vector to express Mzt1-His (pCF.4546). alp6 was digested with BamHI and NotI and ligated into pCF.4545, which carries TEV-MBP-His between NotI and PstI, to generate pCF.4547 (Alp6-TEV-MBP-His). gtb1 was digested with XhoI and KpnI and ligated into pCF.4542 (Alp4) and pCF.4547 (Alp6-TEV-MBP-His) to coexpress Alp4-Gtb1 (pCF.4550) and Alp6-TEV-MBP-His-Gtb1 (pCF.4551), respectively.
For expression of StrepII-GFP-Klp2, MCP-GFP-StrepII, and MCP-mCherry-StrepII in HEK293T cells, klp2 was subcloned into pTT5-StrepII-GFP, and MCP was subcloned into pTT5-GFP-StrepII and pTT5-mCherry-StrepII vectors bearing a CMV5 promoter. For expression of proteins from fission yeast cells, Mto1-ymScarlet-StrepII, Mto1-mCherry-StrepII, Mto2-13Myc, Rsp1-mCherry-StrepII, Rsp1-GFP-StrepII, and Ssa1-HA were subcloned into pJK148 or pJK210 vectors that carry the nmt1 promoter. For expression of GST, GST-Rsp1, His-GFP-Klp2, His-GFP-Mal3, and His-MBP proteins from E. coli cells, rsp1, klp2, mal3, and MBP were subcloned into pGEX-4 T-2/pGEX-6P-1 (GST-tag constructs) or pET28a (His-tag constructs).
MBC washout experiments with perfusion chambers
To create a perfusion chamber, two pieces of double sticky tape were used to attach a poly-lysine (2 mg/ml; P2636, SigmaAldrich)–coated coverslip to a slide. Yeast cells were flowed into the perfusion chamber, which was placed upside down to allow attachment of yeast cells to the poly-lysine–coated coverslip. To observe microtubule regrowth after microtubule depolymerization, methyl benzimidazol-2yl carbamate (MBC) washout experiments were conducted. Specifically, Edinburg minimal medium (EMM) supplied with adenine, leucine, uracil, histidine, and lysine (0.225 g/liter each; referred as EMM5S) (Formedium) and containing MBC (200 μg/ml) was flowed into the perfusion chamber to depolymerize microtubules. After microtubule depolymerization, MBC was washed out with fresh EMM5S, followed by observation of microtubule regrowth by live-cell microscopy.
Microscopy and imaging data analysis
Fission yeast strains were cultured in EMM5S media at 30°C. All imaging experiments were carried out with a PerkinElmer UltraVIEW VoX spinning-disk confocal microscope equipped with a Hamamatsu C9100-23B EMCCD camera and a Nikon CFI Apochromat TIRF 100 × objective (numerical aperture = 1.49). Imaging data were analyzed with MetaMorph (version 7.8, www.moleculardevices.com) and ImageJ (version 1.50i). Signal intensity was measured and kymograph graphs were created with MetaMorph. Plots and column graphs were created with KaleidaGraph (version 4.5.0, www.synergy.com). Statistical analysis was performed with Origin 2023 and KaleidaGraph.
TIRF microscopy
HiLyte Fluor 647–labeled GMPCPP-stabilized microtubule seeds were made as described previously (10). In vitro dynamic microtubule assays were performed according to the procedure described previously (10). For assays in the presence of purified GFP-Klp2 or Rsp1-mCherry, 2 mM adenosine triphosphate was included in the reaction mixture. TIRF microscopy was performed as described previously (10). Specifically, for observing the behaviors of Klp2 and Rsp1, images were collected for 15 min with an interval of 3.3 s.
Analysis of protein expression
To analyze protein expression in fission yeast, whole-cell protein extracts were prepared by the trichloroacetic acid method. The proteins were analyzed by Western blotting with antibodies against GFP (1:2000 dilution; 600-101-215, Rockland-inc), mNeonGreen (1:1000 dilution; home-made, GenScript), and β-tubulin (1:10,000 dilution; 63-160, Bio Academia). The protein intensity was measured by MetaMorph (version 7.8, Molecular Devices), and statistical analysis was performed with Origin 2023 and KaleidaGraph (version 4.5.0, Synergy).
Statistical analysis
The data in two groups for comparison were tested for normality using the software Origin 2023. If the data from two groups are normally distributed, we used Student’s t test to calculate the P value. Otherwise, we used the nonparametric Wilcoxon–Mann-Whitney rank sum test to calculate the P value.
Protein purification and biochemistry assays
The detailed methods for protein purification and biochemistry assays are presented in Supplementary Methods.
Acknowledgments
We thank members in the Fu laboratory for helpful discussion.
Funding: This work was supported by grants from the National Key Research and Development Program of China (2022YFA1303100) (X.Y.), National Natural Science Foundation of China (92354304, 32070707, and 31621002) (C.F.), the Fundamental Research Funds for the Central Universities (WK9110000151) (C.F.), the Center for Advanced Interdisciplinary Science and Biomedicine of IHM (QYPY20220003) (C.F.), the China Postdoctoral Science Foundation (2023TQ0342) (S.Z.), and the National Natural Science Foundation of China Young Scientist Fund (32300563) (S.Z.).
Author contributions: Conceptualization: C.F. Methodology: L.N., W.L., Z.L., X.L., X.Y., S.X., K.J., S.Z., and C.F. Investigation: L.N., W.L., Z.L., and F.Z. Visualization: L.N., W.L., F.Z., and S.Z. Supervision: X.L., X.Y., S.X., K.J., S.Z., and C.F. Writing—original draft: C.F. Writing—review and editing: L.N., S.Z., and C.F.
Competing interests: The authors declare that they have no competing interests.
Data and materials availability: All data needed to evaluate the conclusions in the paper are present in the paper and/or the Supplementary Materials.
Supplementary Materials
This PDF file includes:
Supplementary Text
Figs. S1 to S7
Tables S1 and S2
References
REFERENCES AND NOTES
- 1.Wu J., Akhmanova A., Microtubule-organizing centers. Annu. Rev. Cell Dev. Biol. 33, 51–75 (2017). [DOI] [PubMed] [Google Scholar]
- 2.Petry S., Vale R. D., Microtubule nucleation at the centrosome and beyond. Nat. Cell Biol. 17, 1089–1093 (2015). [DOI] [PubMed] [Google Scholar]
- 3.Liu W., Zheng F., Wang Y., Fu C., Alp7-Mto1 and Alp14 synergize to promote interphase microtubule regrowth from the nuclear envelope. J. Mol. Cell Biol. 11, 944–955 (2019). [DOI] [PMC free article] [PubMed] [Google Scholar]
- 4.Goshima G., Mayer M., Zhang N., Stuurman N., Vale R. D., Augmin: A protein complex required for centrosome-independent microtubule generation within the spindle. J. Cell Biol. 181, 421–429 (2008). [DOI] [PMC free article] [PubMed] [Google Scholar]
- 5.Ho C. M., Hotta T., Kong Z., Zeng C. J., Sun J., Lee Y. R., Liu B., Augmin plays a critical role in organizing the spindle and phragmoplast microtubule arrays in Arabidopsis. Plant Cell 23, 2606–2618 (2011). [DOI] [PMC free article] [PubMed] [Google Scholar]
- 6.Petry S., Pugieux C., Nedelec F. J., Vale R. D., Augmin promotes meiotic spindle formation and bipolarity in Xenopus egg extracts. Proc. Natl. Acad. Sci. U.S.A. 108, 14473–14478 (2011). [DOI] [PMC free article] [PubMed] [Google Scholar]
- 7.Sanchez-Huertas C., Freixo F., Viais R., Lacasa C., Soriano E., Luders J., Non-centrosomal nucleation mediated by augmin organizes microtubules in post-mitotic neurons and controls axonal microtubule polarity. Nat. Commun. 7, 12187 (2016). [DOI] [PMC free article] [PubMed] [Google Scholar]
- 8.Janson M. E., Loughlin R., Loiodice I., Fu C., Brunner D., Nedelec F. J., Tran P. T., Crosslinkers and motors organize dynamic microtubules to form stable bipolar arrays in fission yeast. Cell 128, 357–368 (2007). [DOI] [PubMed] [Google Scholar]
- 9.Petry S., Groen A. C., Ishihara K., Mitchison T. J., Vale R. D., Branching microtubule nucleation in Xenopus egg extracts mediated by augmin and TPX2. Cell 152, 768–777 (2013). [DOI] [PMC free article] [PubMed] [Google Scholar]
- 10.Zhang Y., Hong X., Hua S., Jiang K., Reconstitution and mechanistic dissection of the human microtubule branching machinery. J. Cell Biol. 221, e202109053 (2022). [DOI] [PMC free article] [PubMed] [Google Scholar]
- 11.Murata T., Sonobe S., Baskin T. I., Hyodo S., Hasezawa S., Nagata T., Horio T., Hasebe M., Microtubule-dependent microtubule nucleation based on recruitment of gamma-tubulin in higher plants. Nat. Cell Biol. 7, 961–968 (2005). [DOI] [PubMed] [Google Scholar]
- 12.Luders J., Stearns T., Microtubule-organizing centres: A re-evaluation. Nat. Rev. Mol. Cell Biol. 8, 161–167 (2007). [DOI] [PubMed] [Google Scholar]
- 13.Sawin K. E., Tran P. T., Cytoplasmic microtubule organization in fission yeast. Yeast 23, 1001–1014 (2006). [DOI] [PMC free article] [PubMed] [Google Scholar]
- 14.Daga R. R., Lee K. G., Bratman S., Salas-Pino S., Chang F., Self-organization of microtubule bundles in anucleate fission yeast cells. Nat. Cell Biol. 8, 1108–1113 (2006). [DOI] [PubMed] [Google Scholar]
- 15.Carazo-Salas R. E., Nurse P., Self-organization of interphase microtubule arrays in fission yeast. Nat. Cell Biol. 8, 1102–1107 (2006). [DOI] [PubMed] [Google Scholar]
- 16.Borek W. E., Groocock L. M., Samejima I., Zou J., de Lima Alves F., Rappsilber J., Sawin K. E., Mto2 multisite phosphorylation inactivates non-spindle microtubule nucleation complexes during mitosis. Nat. Commun. 6, 7929 (2015). [DOI] [PMC free article] [PubMed] [Google Scholar]
- 17.Lynch E. M., Groocock L. M., Borek W. E., Sawin K. E., Activation of the γ-tubulin complex by the Mto1/2 complex. Curr. Biol. 24, 896–903 (2014). [DOI] [PMC free article] [PubMed] [Google Scholar]
- 18.Samejima I., Miller V. J., Rincon S. A., Sawin K. E., Fission yeast Mto1 regulates diversity of cytoplasmic microtubule organizing centers. Curr. Biol. 20, 1959–1965 (2010). [DOI] [PMC free article] [PubMed] [Google Scholar]
- 19.Samejima I., Miller V. J., Groocock L. M., Sawin K. E., Two distinct regions of Mto1 are required for normal microtubule nucleation and efficient association with the γ-tubulin complex in vivo. J. Cell Sci. 121, 3971–3980 (2008). [DOI] [PMC free article] [PubMed] [Google Scholar]
- 20.Samejima I., Lourenco P. C., Snaith H. A., Sawin K. E., Fission yeast mto2p regulates microtubule nucleation by the centrosomin-related protein mto1p. Mol. Biol. Cell 16, 3040–3051 (2005). [DOI] [PMC free article] [PubMed] [Google Scholar]
- 21.Janson M. E., Setty T. G., Paoletti A., Tran P. T., Efficient formation of bipolar microtubule bundles requires microtubule-bound γ-tubulin complexes. J. Cell Biol. 169, 297–308 (2005). [DOI] [PMC free article] [PubMed] [Google Scholar]
- 22.Shen J., Li T., Niu X., Liu W., Zheng S., Wang J., Wang F., Cao X., Yao X., Zheng F., Fu C., The J-domain cochaperone Rsp1 interacts with Mto1 to organize noncentrosomal microtubule assembly. Mol. Biol. Cell 30, 256–267 (2019). [DOI] [PMC free article] [PubMed] [Google Scholar]
- 23.Kampinga H. H., Craig E. A., The HSP70 chaperone machinery: J proteins as drivers of functional specificity. Nat. Rev. Mol. Cell Biol. 11, 579–592 (2010). [DOI] [PMC free article] [PubMed] [Google Scholar]
- 24.Zimmerman S., Tran P. T., Daga R. R., Niwa O., Chang F., Rsp1p, a J domain protein required for disassembly and assembly of microtubule organizing centers during the fission yeast cell cycle. Dev. Cell 6, 497–509 (2004). [DOI] [PubMed] [Google Scholar]
- 25.Wei W., Zheng B., Zheng S., Wu D., Chu Y., Zhang S., Wang D., Ma X., Liu X., Yao X., Fu C., The Cdc42 GAP Rga6 promotes monopolar outgrowth of spores. J. Cell Biol. 222, e202202064 (2023). [DOI] [PMC free article] [PubMed] [Google Scholar]
- 26.Zheng S., Zheng B., Liu Z., Ma X., Liu X., Yao X., Wei W., Fu C., The Cdc42 GTPase-activating protein Rga6 promotes the cortical localization of septin. J. Cell Sci. 135, jcs259228 (2022). [DOI] [PubMed] [Google Scholar]
- 27.Mana-Capelli S., McLean J. R., Chen C. T., Gould K. L., McCollum D., The kinesin-14 Klp2 is negatively regulated by the SIN for proper spindle elongation and telophase nuclear positioning. Mol. Biol. Cell 23, 4592–4600 (2012). [DOI] [PMC free article] [PubMed] [Google Scholar]
- 28.Yamashita A., Sato M., Fujita A., Yamamoto M., Toda T., The roles of fission yeast ase1 in mitotic cell division, meiotic nuclear oscillation, and cytokinesis checkpoint signaling. Mol. Biol. Cell 16, 1378–1395 (2005). [DOI] [PMC free article] [PubMed] [Google Scholar]
- 29.Loiodice I., Staub J., Setty T. G., Nguyen N. P., Paoletti A., Tran P. T., Ase1p organizes antiparallel microtubule arrays during interphase and mitosis in fission yeast. Mol. Biol. Cell 16, 1756–1768 (2005). [DOI] [PMC free article] [PubMed] [Google Scholar]
- 30.Wu J. Q., Pollard T. D., Counting cytokinesis proteins globally and locally in fission yeast. Science 310, 310–314 (2005). [DOI] [PubMed] [Google Scholar]
- 31.Leong S. L., Lynch E. M., Zou J., Tay Y. D., Borek W. E., Tuijtel M. W., Rappsilber J., Sawin K. E., Reconstitution of microtubule nucleation in vitro reveals novel roles for Mzt1. Curr. Biol. 29, 2199–2207.e10 (2019). [DOI] [PMC free article] [PubMed] [Google Scholar]
- 32.Tran P. T., Marsh L., Doye V., Inoue S., Chang F., A mechanism for nuclear positioning in fission yeast based on microtubule pushing. J. Cell Biol. 153, 397–412 (2001). [DOI] [PMC free article] [PubMed] [Google Scholar]
- 33.Hua S., Jiang K., Expression and purification of microtubule-associated proteins from HEK293T cells for in vitro reconstitution. Methods Mol. Biol. 2101, 19–26 (2020). [DOI] [PubMed] [Google Scholar]
- 34.Wang Z., Meng P., Zhang X., Ren D., Yang S., BON1 interacts with the protein kinases BIR1 and BAK1 in modulation of temperature-dependent plant growth and cell death in Arabidopsis. Plant J. 67, 1081–1093 (2011). [DOI] [PubMed] [Google Scholar]
Associated Data
This section collects any data citations, data availability statements, or supplementary materials included in this article.
Supplementary Materials
Supplementary Text
Figs. S1 to S7
Tables S1 and S2
References


