

Abstract
Chronic inflammation and tissue fibrosis are common responses that worsen organ function, yet the molecular mechanisms governing their crosstalk are poorly understood. In diseased organs, stress-induced gene expression changes fuel maladaptive cell state transitions1 and pathological interaction between cellular compartments. Although chronic fibroblast activation worsens dysfunction in the lung, liver, kidney, and heart, and exacerbates many cancers2, the stress-sensing mechanisms initiating transcriptional activation of fibroblasts are poorly understood. Here, we show that conditional deletion of the transcriptional co-activator Brd4 in infiltrating Cx3cr1-positive macrophages ameliorates heart failure and significantly reduces fibroblast activation. Analysis of single-cell chromatin accessibility and BRD4 occupancy in vivo in Cx3cr1-positive cells identified a large enhancer proximal to Interleukin-1 beta (Il1b), and a series of CRISPR deletions revealed the precise stress-dependent regulatory element that controls Il1b expression. Secreted IL1B activated a fibroblast p65/RELA-dependent enhancer near the transcription factor MEOX1, resulting in a profibrotic response in human cardiac fibroblasts. In vivo, antibody-mediated IL1B neutralization improved cardiac function and tissue fibrosis in heart failure. Systemic IL1B inhibition or targeted Il1b deletion in Cx3cr1-positive cells prevented stress-induced MEOX1 expression and fibroblast activation. The elucidation of BRD4-dependent crosstalk between a specific immune cell subset and fibroblasts through IL1B reveals how inflammation drives profibrotic cell states and supports strategies that modulate this process in heart disease and other chronic inflammatory disorders featuring tissue remodeling.
In human disease, stress-induced signaling converges in the nucleus, where chromatin receives, processes, and amplifies upstream inputs, ultimately leading to altered gene expression, maladaptive cell state transitions and organ dysfunction1. In response to stress, chromatin remodeling can alter the expression of secreted factors thus influencing neighboring cells through non-cell autonomous mechanisms and fueling pathological crosstalk between diverse cellular compartments. We previously demonstrated that pharmacological inhibition of bromodomain and extra-terminal domain (BET) proteins, critical mediators of stress-activated chromatin signaling in various diseases3, modulates a reversible transcriptional switch that governs fibroblast activation in chronic heart failure through the transcription factor (TF) MEOX14. However, the mechanism by which organ-level stress is sensed by cells to trigger downstream fibroblast activation remains unknown. Here, we combined single-cell genomics with dynamic modulation of cell state via small-molecules, cell-type specific genetic perturbation and epigenomic profiling, and CRISPR-based enhancer deletion, to reveal a fundamental and therapeutically relevant mechanism by which pathological cellular crosstalk within a stressed organ drives human disease.
Cx3cr1+ myeloid cells in heart failure
To capture dynamic changes in cell states and identify critical upstream signals that control stress-dependent gene transcription in heart failure pathogenesis, we induced pressure-overload mediated heart failure in mice by performing transverse aortic constriction (TAC) with or without administration of the small molecule BET bromodomain inhibitor JQ15 daily for 30 days (Fig. 1A). BET inhibition exerted a strong protective effect on left ventricular ejection fraction (Fig. 1B)4,6-10. Given our observation that transcriptional changes associated with JQ1 in the cardiomyocyte (CM) compartment are modest compared to other cardiac cell populations4,11, we performed single cell RNA sequencing (scRNA-seq) in non-CMs from mouse hearts using the 10X Genomics platform (Fig. 1A). We captured 41,626 cells from Sham, TAC vehicle-treated (TAC), or TAC JQ1-treated (TAC JQ1) hearts, and identified 20 transcriptional clusters, including fibroblasts (Dcn+), myeloid cells (Lyz2+), endothelial cells (Fabp4+) and pericytes (Abcc9+) (Fig. 1C and Extended Data Fig. 1A).
Fig. 1. Stress-activated Cx3cr1+ macrophages contribute to heart failure pathogenesis.

A. Experimental schematic in Sham and TAC mice treated with JQ1 (50mg/kg daily). B. LV ejection fraction quantified by echocardiography (n=3 per group). Statistical significance shown between TAC and TAC JQ1 at day 30 post TAC. C. UMAP plot of non-cardiomyocyte cells colored by cluster. D. Schematic of correlation analysis between LV ejection fraction and gene expression. E. Number of genes with strong positive and negative correlations across cell populations (min. 250 cells). EC=Endothelial Cells. Lymph=Lymphatic; SMCs=Smooth Muscle Cells. F. Volcano plot of correlation coefficients and p-values for 17,519 genes in myeloid cells, referred to Fig. 1D. Cx3cr1 (pval 6.75e−11) and Il1b (pval 2.66e−9) are highlighted among the 22 genes with scores < −5. G. Expression Dot Plot of the 22 most anti-correlated genes from Fig. 1D. H,I. UMAP plot of myeloid cells colored by cluster (H) and sample identity (I). J. Violin Plots of macrophage markers across myeloid clusters. K. Violin Plots of Cx3cr1 and Il1b expression across samples. L. Heatmap of significance (−log10(p-val)) for GO terms in genes upregulated in TAC vs. TAC JQ1 or TAC JQ1 vs. TAC. Fisher’s exact test. M. Experimental schematic for conditional Brd4 deletion in Cx3cr1+ cells. N. LV ejection fraction quantified by echocardiography in Sham (n=3), Cx3cr1CreERT2 (n=6), Brd4flox/flox (n=12) and Cx3cr1CreERT2;Brd4flox/flox (n=19) TAC. B,N Data are mean ± s.e.m. One-way ANOVA followed by Tukey post hoc test.
To identify dynamically regulated cell states during stress and BET inhibition we correlated echocardiographic changes in cardiac function associated with TAC and JQ1 with changes in gene expression. Genes were defined as having a negative correlation if their expression was anti-correlated with heart function (i.e., upregulated when cardiac function decreased and downregulated when function increased), or a positive correlation in the inverse scenario (Fig. 1D). We performed this analysis in each cluster composed of at least 250 cells. As expected4, fibroblasts had the highest enrichment of genes whose expression significantly correlated with cardiac function (Fig. 1E). Myeloid cells had the next highest number of correlated genes, indicating a high degree of transcriptional plasticity in response to stress and BET inhibition (Fig. 1E). Given the ability of myeloid cells to act as non-cell autonomous amplifiers of the stress-response through secreted factors12-14, we further investigated changes in this cell type.
As BET proteins are transcriptional co-activators and their inhibition is associated with protection in heart failure models6-8, we interrogated myeloid cell genes that were upregulated in disease and downregulated with BET inhibition. We ranked all genes expressed in the myeloid compartment by their correlation score using a stringent statistical threshold (p < 1e−6, corresponding to a correlation score < ± 5) and identified 22 anti-correlated (Fig. 1F) and 24 positively correlated (Fig. 1F and Extended Data Fig. 1B) with cardiac function. Among the anti-correlated genes were cytokines (Il1b), chemokines (Ccl8, Ccl12), chemokine receptors (Cx3cr1), cluster of differentiation (CD) proteins and the TF Runx3 (Fig. 1G). Sub-clustering of the myeloid population identified 7 clusters distributed over 5,463 cells (Fig. 1H,I). Expression of the resident macrophage markers15,16 Lyve1, Folr2 and Timd4 were enriched in clusters 4 and 6, with Lyve1 and Folr2 also marking clusters 0, 2 and 3 (Fig. 1J and Extended Data Fig. 1C-E). Clusters 1 and 5 had high expression of Ccr2, a marker of monocyte-derived macrophages that infiltrate from the circulation17-19 (Fig. 1J and Extended Data Fig. 1C-E). Cx3cr1, which marks both monocyte-derived and resident macrophages20-22, was particularly enriched in cluster 1, together with proinflammatory genes such as Il1b (Fig. 1J). Consistent with Cx3cr1 and Il1b expression being negatively correlated with cardiac function (Fig. 1F), both genes were increased in TAC compared to Sham, and downregulated by JQ1 treatment (Fig. 1K). Cx3cr1 and Il1b were co-expressed in cluster 1 (Fig. 1J), which was enriched in cells from TAC and depleted in Sham and TAC JQ1 conditions (Extended Data Fig. 1F). By scRNA-seq, JQ1 reduced cells expressing Ccr2 (infiltrating macrophages) but did not affect cells expressing Timd4, Lyve1, and Folr2 (resident macrophages) (Extended Data Fig. 1G). Flow cytometry analyses of cardiac tissue at day 7 post-TAC, a time point associated with immune cell expansion23,24, revealed no significant changes in the number of infiltrated immune cells, monocytes, or macrophages following JQ1 (Extended Data Fig. 1H,I). However, in myeloid cells the most enriched GO terms for genes significantly downregulated by BET inhibition were linked to proinflammatory mechanisms like regulation of cytokine and TNF production and macrophage activation (Fig. 1L).
BRD4 function in Cx3cr1+ cells during heart failure
We previously showed the specific importance of BRD4 in aspects of heart failure pathogenesis4,25. Here, we genetically deleted the BET family member BRD4 in Cx3cr1-expressing monocytes and macrophages cells by crossing Brd4flox/flox mice11 with a mouse in which tamoxifen-inducible Cre recombinase expression is directed by the Cx3cr1 promoter region20 (Fig. 1M). Mice were subjected to TAC and 5 days of continuous tamoxifen treatment followed by every other day treatment until day 30 post-TAC, a regimen that would delete Brd4 in both resident and monocyte-derived Cx3cr1-expressing macrophages15. Consistent with Cx3cr1 expression specifically in myeloid cells (Extended Data Fig. 1A), Brd4 mRNA levels were significantly reduced in Cx3cr1CreERT2;Brd4flox/flox versus Brd4flox/flox animals only in CX3CR1Pos cells, while Brd4 expression was not affected in CMs, fibroblasts or endothelial cells (Extended Data Fig. 2A,B). When compared with littermate controls (Cx3cr1CreERT2 or Brd4flox/flox), Cx3cr1CreERT2;Brd4flox/flox mice demonstrated improved cardiac function by echocardiography 30 days after TAC (Fig. 1N). Notably, Brd4 deletion in Cx3cr1-positive cells also reduced fibrosis (Extended Data Fig. 2C).
To explore the contribution of Brd4 from resident versus infiltrating monocyte-derived macrophages in heart failure pathogenesis, we utilized a pulsatile tamoxifen exposure15 to induce Brd4 deletion selectively in resident macrophages marked by Cx3cr1 prior to TAC. We subjected Cx3cr1CreERT2;Brd4flox/flox and Brd4flox/flox mice to 10 days of tamoxifen treatment, followed by a 6-week period without tamoxifen (Extended Data Fig. 2D). During this 6-week period, Cx3cr1-positive blood monocytes undergo turnover from hematopoietic progenitors whereas Cx3cr1-positive resident macrophages do not15. Therefore, at the time these animals were subjected to TAC, Brd4 was specifically depleted in resident cardiac macrophages while remaining intact in circulating monocytes (Extended Data Fig. 2E). Brd4 deletion in resident macrophages did not lead to a significant improvement in cardiac function (Extended Data Fig. 2F), indicating that Brd4 contribution to TAC-induced cardiac dysfunction primarily arises from circulating monocyte-derived macrophages in the heart.
BRD4 drives proinflammatory transcription
To determine the transcriptional consequences of Brd4 deletion in the immune cell compartment, we performed scRNA-seq on sorted cardiac CD45-positive cells from Brd4flox/flox mice after TAC or Sham surgery, and from Cx3cr1CreERT2;Brd4flox/flox mice after TAC (TAC-Brd4KO) (Fig. 2A). We processed 10,450 immune cells and identified 16 transcriptomic clusters. Most of these cells were grouped in a large and heterogeneous population of monocytes/macrophages (clusters 0 to 10 excluding 7), while B cells (cluster 14), T cells (cluster 11) and neutrophils (cluster 12) were fewer in number (Extended Data Fig. 2G-I). We re-clustered the monocyte/macrophage population (Fig. 2B), and found expression of resident macrophage markers (Timd4, Folr2, and Lyve1) was reduced in clusters 1 and 4 which, together with higher expression of Ccr2 and Cx3cr1, suggested that these clusters were likely composed of monocytes that infiltrated the heart following TAC (Fig. 2C,D and Extended Data Fig. 2J,K). We found that cluster 4 was expanded from Sham to TAC (9.3% to 14.9%) and reduced upon Brd4 deletion (14.9% to 2.5%) (Fig. 2E and Extended Data Fig. 2L). We assessed the impact of Brd4 deletion in Cx3cr1-positive cells on monocyte infiltration post-TAC by flow cytometry 7 days after surgery which showed no significant effect on immune cell, monocyte, or macrophage numbers, but a trend suggesting a potential reduction in monocytes (Extended Data Fig. 2M). GO analysis of the genes driving cluster 4 (infiltrating monocytes) were enriched in terms related to the pro-inflammatory response, such as cellular response to lipopolysaccharide (LPS), positive regulation of inflammatory response and cytokine production (Fig. 2F). Among the top cluster 4 marker genes were several encoding the major histocompatibility complex (MHC) class 2 glycoproteins (also present in cluster 3) along with Il1b and Ccr2, both of which were enriched in cluster 4, even when compared to cluster 3 (Fig. 2G). We performed DE analysis in the monocyte/macrophage population between samples (Extended Data Fig. 2N), and identified 13 genes, including Rgs1, Il1b, Cd52, Cd72, and Cx3cr1, that were upregulated by TAC stress and decreased upon Brd4 deletion in Cx3cr1-positive cells (Fig. 2H). The expression of the proinflammatory cytokine Il1b (Interleukin-1β) was particularly interesting as it was enriched in cluster 4 (Fig. 2I,J) and sensitive to cardiac stress and Brd4 deletion in Cx3cr1-positive cells (Fig. 2K).
Fig. 2. BRD4 in Cx3cr1-positive macrophages drives proinflammatory transcription in heart failure pathogenesis.

A. Schematic for scRNA-seq in sorted CD45+ cells from Brd4flox/flox (TAC) and Cx3cr1CreERT2;Brd4flox/flox (TAC Brd4-KO) hearts. B. UMAP of monocytes/macrophages colored by cluster. C. Expression Violin Plots of macrophage markers across clusters. D. Feature Plots of macrophage marker expression. E. UMAP plots of monocytes/macrophages colored by sample identity. F. Heatmap of significance (−log10(p–val)) for proinflammatory GO terms across clusters. G. Expression Dot Plot of the 10 top gene markers in cluster 4 across all clusters. H. Expression Dot Plot of the 13 genes upregulated TAC versus Sham and downregulated in TAC-Brd4KO versus TAC across samples (Log2FC>0.5 and FDR<0.05). I. Violin Plot of Il1b expression across clusters. J. Feature Plot of Il1b expression. K. Violin Plot of Il1b expression across samples.
BRD4 in Cx3cr1+ cells activates fibroblasts
Since many cytokines and chemokines were dysregulated in immune cells upon Brd4 deletion in Cx3cr1-positive cells, we investigated the non-cell autonomous consequences in other cell types in the setting of cardiac stress. We harvested hearts from TAC or TAC-Brd4KO animals and performed single nuclei RNA-seq (snRNA-seq) to capture the transcriptional landscape of all cardiac cells (Fig. 3A). A group of 28,107 nuclei encompassing all the major cardiac cell populations was processed into 17 transcriptomic clusters (Fig. 3B, Extended Data Fig. 3A). The cardiomyocyte population was less represented than expected, likely due to the process of nuclei isolation. The UMAP showed expected differences in the myeloid population upon Brd4 deletion in Cx3cr1-positive cells, but also indicated similar changes in fibroblasts (Fig. 3C). DE analysis between the TAC and TAC-Brd4KO conditions in each major cardiac cell population demonstrated a similar number of dysregulated genes in myeloid cells (n=351) and fibroblasts (n=310), with far fewer in other cell types (Fig. 3D). As Cx3cr1 is not expressed in fibroblasts26 (Extended Data Fig. 1A), and therefore Brd4 is not deleted in this cell population (Extended Data Figs. 2B and 3B-D), the fibroblast gene expression changes reflect a non-cell autonomous effect.
Fig. 3. BRD4 in Cx3cr1+ macrophages activates cardiac fibroblasts non-cell autonomously.

A. Schematic for snRNA-seq and ATAC-seq from Brd4flox/flox (TAC) and Cx3cr1CreERT2;Brd4flox/flox (TAC Brd4-KO) hearts. B,C. UMAP plots of cardiac tissue nuclei by cluster (B) and sample identity (C). D. Number of DE genes between TAC and TAC Brd4-KO across cell populations with ≥800 cell (Log2FC>0.125; FDR<0.05). E,F. Fibroblast UMAP by cluster (E) and sample identity (F). G. Feature Plot of Postn and Meox1 expression in fibroblasts. H. GO terms for genes upregulated in TAC vs. TAC Brd4-KO. Fisher’s exact test. I. scATAC-seq UMAP of cardiac tissue nuclei by cluster. J, K. Fibroblast scATAC-seq UMAP by cluster (J) and sample (K). L. Postn and Meox1 accessibility gene score in fibroblasts. M,N Accessibility score UMAP of genes upregulated in TAC (n=2) vs. TAC Brd4-KO (n=2) (M) and violin plot quantification (N) in fibroblasts. N: Medians are center lines; boxes, 25th and 75th percentiles; whiskers, 1.5 times the IQR. One-tailed Wilcoxon rank sum test with continuity correction. O. Sample distribution within clusters in fibroblasts. P. TF motif enrichment of fibroblast chromatin regions more accessible in cluster 5 vs. cluster 2. Top 10 motifs highlighted. P-values calculated with hypergeometric test. Q. Fibroblast chromatin accessibility in TAC and TAC Brd4-KO at Postn and Meox1 loci. Key regulatory elements in red, showing co-accessibility with gene promoters.
Within the fibroblast population, we identified 7 transcriptional clusters encompassing 7,388 cells (Fig. 3E), with TAC and TAC-Brd4KO fibroblasts clustering separately (Fig. 3F). Cluster 6 was associated with specific expression of fibroblast activation genes such as Postn, Meox1, Comp, Cilp, Mfap4, and Thbs4 (Fig. 3G, Extended Data Fig. 3E-G), and was depleted of TAC-Brd4KO fibroblasts (Extended Data Fig. 3H). GO analysis of the significantly upregulated genes in TAC versus TAC-Brd4KO fibroblasts (n=198) (Extended Data Fig. 3I, top 50 shown) was enriched for profibrotic gene programs such as extracellular matrix and collagen fibril organization (Fig. 3H). In contrast, genes upregulated in TAC-Brd4KO versus TAC (n=112) were instead enriched with terms related to vascular development, angiogenesis, and response to VEGF (Extended Data Fig. 3J). We then compared fibroblast genes downregulated in TAC by JQ1 or Brd4 deletion in Cx3cr1-expressing cells. As expected, JQ1 administration resulted in more downregulated genes (n=375) than immune-specific Brd4 deletion (n=137) (Extended Data Fig. 3K). However, 61 fibroblast genes were affected by both perturbations, including the profibrotic markers Postn, Meox1, and Thbs4 (Extended Data Fig. 3K).
To understand the changes in chromatin states in cardiac cells triggered by Brd4 deletion in Cx3cr1-expressing cells, we performed single-cell Assay for Transposase-Accessible Chromatin sequencing (scATAC-seq) from the same hearts used for snRNA-seq (Fig. 3A). As expected, scATAC-seq annotated all major cell populations identified by snRNA-seq (Fig. 3I and Extended Data Fig. 4A). Given the profound fibroblast gene expression changes identified (Fig. 3D), we focused on the corresponding chromatin accessibility changes in this population. Amongst 7 fibroblast chromatin subclusters (Fig. 3J,K), gene scores (a measure of chromatin accessibility within and around the gene body) suggested that clusters 4 and 5 were enriched for signals from Postn and Meox1, as well as other markers of activated fibroblasts (Fig. 3L and Extended Data Fig. 4B,C). We then scored accessibility across the dysregulated fibroblast genes in our snRNA-seq analysis and found that genes significantly upregulated in TAC versus TAC-Brd4KO displayed decreased accessibility in TAC-Brd4KO, indicating concordance between transcriptional and chromatin changes (Fig. 3M,N). Assessment of sample distributions by scATAC-seq identified clusters 4 and 5 as the most depleted in TAC-Brd4KO samples (Fig. 3O). Differential accessibility analysis between TAC and TAC-Brd4KO identified 460 sites with reduced chromatin accessibility in fibroblasts upon Brd4 deletion in Cx3cr1-expressing cells. Motif analysis of these regions revealed enrichment for TFs critical for profibrotic responses in heart failure, such as SMADs27 and MEOX14, as well as RUNX1 and REL, regulators of proinflammatory responses27 (Extended Data Fig. 4D). Motif enrichment analysis of cluster 5, marked by high accessibility scores for genes upregulated in TAC versus TAC-Brd4KO (Fig. 3M) such as Postn and Meox1 (Fig. 3L), compared to cluster 2 which was over-represented by TAC-Brd4KO fibroblasts (Fig. 3M,O), revealed the greatest enrichment for the MEOX1 motif (Fig. 3P). We also examined the accessibility of previously described4 stress-induced enhancers of Postn and Meox1. We found reductions in chromatin accessibility at the Postn and Meox1 loci in TAC-Brd4KO fibroblasts, including regulatory elements we previously showed were essential for stress-induced activation of those genes (Fig. 3Q, regions highlighted in red)4.
Stress-induced cis-regulation of Il1b
Having found that a BRD4-dependent transcriptional event in Cx3cr1-expressing cells functions non-cell autonomously to activate cardiac fibroblasts under stress, we performed scATAC-seq in sorted CD45-positive cells from Sham, TAC, and TAC-Brd4KO animals to determine how Brd4 deletion in Cx3cr1-positive cells affects chromatin accessibility in the immune compartment (Fig. 4A). We identified 21 clusters, and gene score signals of C1qa, Cd163, and Cd14 identified the monocyte/macrophage population, which was also accessible for Cx3cr1 (Extended Data Fig. 5A,B). The monocyte/macrophage population contained 8 clusters (Fig. 4B,C). Chromatin accessibility of Timd4, Lyve1, and Folr2 was high in cluster 3, consistent with resident macrophages, while cluster 4 displayed a strong signal for the monocyte-derived macrophage marker Ccr2 (Fig. 4D). Interestingly, Cx3cr1 accessibility was almost entirely in cluster 4, as was accessibility of Il1b, one of the most dynamically regulated genes in the scRNA-seq analysis (Fig. 4D). Cells from the TAC condition were greater in number in the Cx3cr1/Il1b accessible Cluster 4 relative to Sham, and Brd4 deletion was associated with a decrease in its composition (Extended Data Fig. 5C,D). The cells with high accessibility for the genes that were upregulated in TAC versus TAC-Brd4KO in the scRNA-seq data overlapped with cluster 4 (Fig. 4B,E). Plotting this accessibility score across samples revealed that Brd4 deletion caused a global reduction in accessibility of TAC-induced gene programs to levels similar as Sham (Fig. 4F). GO analysis of chromatin regions in cluster 4 showed enrichment for proinflammatory processes compared to resident macrophages (cluster 3). (Fig. 4G). TF motif analysis of these regions found REL, IKZF1, and RUNX2 at the top 3 most enriched motifs in cluster 4 versus cluster 3 (Fig. 4H).
Fig. 4. BRD4-bound enhancers regulate stress-induced Il1b expression.

A. Schematic of scATAC-seq in CD45+ cells. B,C. Macrophage UMAP by cluster (B) and sample (C). D. Accessibility score of macrophage markers. E,F. UMAP (E) and violin (F) plots of accessibility score across genes upregulated in TAC vs. TAC Brd4-KO in Sham (n=1), TAC (n=2) and TAC Brd4-KO (n=2). F: Medians are center lines; boxes, 25th and 75th percentiles; whiskers extend 1.5 times IQR. G. GO term of chromatin regions driving cluster 4. Fisher’s exact test. H. TF motif enrichment of cluster 4 chromatin regions (background cluster 3). Hypergeometric test. I. Accessibility changes between samples at 748 macrophage super-enhancers. Genes proximal to candidate enhancers in top right quadrant. J. Chromatin accessibility changes between TAC/TAC Brd4-KO and p65/RELA occupancy at macrophage super-enhancers (same genes from 4I). K. Targeting strategy for Brd4flag allele and schematic for CUT&RUN in CX3CR1+ cells. L. Il1b locus. Distal Peak1-7 highlighted in red. M. Il1b expression in Unstimulated or LPS-treated RAW 264-7 macrophages in CRISPR WT and Peak1-7 KO clones (significance shown between WT and Peak5- and Peak6-KO), n=3, 3 experiments. N. Luciferase assay of Il1b Peak5 and Peak6 with BRD4 and p65/RELA. n=3, 3 experiments. O. scATAC-seq UMAP of human cardiac myeloid cells30. P. Chromatin accessibility gene score of human CX3CR1 and IL1B. Q. Human IL1B locus, cardiac myeloid cell scATAC-seq accessibility in controls and myocardial infarction patients. Red boxes in Peak 5/6. Dashed grey lines: Peak5 y-axis value in Ctrl. M,N. Data are mean ± s.e.m. Two-way (M) and One-way (N) ANOVA followed by Tukey post hoc test. F, Kruskal-Wallis test followed by pairwise one-tailed Wilcoxon tests with FDR correction. I,J, One-sided Wilcoxon rank-sum tests.
To determine which distal elements in the monocyte/macrophage population were most sensitive to stress and Cx3cr1-specific Brd4 deletion, we assembled a catalog of 748 large enhancers28 using scATAC-seq data from diseased hearts (TAC) (Extended Data Fig. 6A). We then constructed a model that identified distal regions with highly dynamic changes across conditions and scored them by their degree of change in TAC versus Sham and TAC versus TAC-Brd4KO conditions (Fig. 4I). We were particularly interested in regions that opened with cardiac stress and had decreased accessibility upon Brd4 deletion (Fig. 4I, top right quadrant). Among the 15 most affected regions were DNA elements proximal to genes such as Il1b, Mreg, Cdh26, Cdh23, Cd83, Ccrl2, and Egr1. Given that REL was the most enriched TF motif in the accessible DNA regions of Cx3cr1-positive cluster 4 (Fig. 4H), we integrated publicly available ChIP-seq data in bone marrow-derived macrophages (BMDMs) for p65/RELA29 and plotted its occupancy across all the identified super-enhancers. The Il1b distal region was among the most enriched genomic regions in p65/RELA binding (Fig. 4J and Extended Data Fig. 6B). To determine which of the distal elements were directly bound by BRD4 in vivo in CX3CR1-positive cells, we generated a mouse in which a 3X-FLAG epitope tag was knocked-in to the N-terminus of BRD4 (Extended Data Fig. 6C-E) and performed anti-FLAG CUT&RUN (Cleavage Under Targets & Release Using Nuclease) on sorted CX3CR1-positive cells from Sham or TAC mice (Fig. 4K and Extended Data Fig. 6F). Notably, most of the downregulated genes in TAC-Brd4KO versus TAC in the scRNA-seq data were bound by BRD4 in Cx3cr1-expressing cells in the TAC condition (Extended Data Fig. 6G,H). Among the 748 identified super-enhancers, 162 exhibited strong TAC-induced BRD4 binding (LogFC>2 over Sham) (Extended Data Fig. 6I). Of the 15 super-enhancers with dynamic chromatin accessibility across conditions (Fig. 4I, top right quadrant), 10 had greater BRD4 binding in TAC, including the large enhancers proximal to Il1b, Mreg, Cdh26, and Cd83 (Extended Data Fig. 6J).
One of the most dynamic BRD4-bound distal elements in stress and upon genetic deletion of Brd4 was proximal to Il1b (Fig. 4I). Il1b was amongst the most negatively correlated genes in the analysis between cardiac function and gene expression in myeloid cells following stress and BET inhibition (Fig. 1F). Moreover, Il1b was one of the most sensitive genes to Brd4 deletion in Cx3cr1-expressing cells, suggesting direct regulation by BRD4 (Fig. 2H,K). Importantly, Il1b encodes a secreted factor (IL1B) that can influence other cell states via paracrine signaling. To pinpoint stress-dependent distal elements within the large Il1b locus, we examined the accessibility of the 3 upstream and 4 downstream chromatin peak regions using scATAC-seq (Extended Data Fig. 7A,B). CUT&RUN from sorted CX3CR1-positive cells demonstrated that upon cardiac stress, peaks 1, 2, 5, and 6 exhibited recruitment of BRD4 (Fig. 4L).
To identify which regions, if any, were functional cis-regulatory elements, we used CRISPR-Cas9 in RAW 264-7 macrophages to target each individual enhancer peak within the Il1b locus and generated 7 clones, each harboring a specific deletion for one of the 7 peaks (Extended Data Fig. 7C-E). Lipopolysaccharides (LPS) triggered upregulation of Il1b expression in control WT clones (Fig. 4M). While most of the CRISPR deletions did not significantly affect LPS-induced Il1b induction, the deletion of peaks 5 and 6 reduced stress-induced expression (Fig. 4M). Given the colocalization of BRD4 and p65/RELA at the Il1b Peak5 and 6 enhancers, we hypothesized that these factors may functionally coregulate these regulatory elements. To test this, we separately cloned the Il1b Peak5 and 6 enhancers into a luciferase reporter and demonstrated additive coregulation by BRD4 and p65/RELA in controlling the transcriptional activity of these regions (Fig. 4N).
Finally, we tested whether we could identify corresponding changes in chromatin states in human cardiac myeloid cells. Single-cell ATAC-seq data from the human adult heart30 identified 8 clusters in myeloid cells (Fig. 4O), with cluster 3 associated with strong accessibility for CX3CR1, IL1B and CCR2 (Fig. 4P and Extended Data Fig. 8A), while clusters 5, 6 and 8 were associated with high accessibility for the resident macrophage markers TIMD4 and LYVE1 (Extended Data Fig. 8A). GO analysis of the accessible chromatin regions driving cluster 3 highlighted the enrichment of proinflammatory processes as compared to other clusters (Extended Data Fig. 8B). We focused on the human IL1B locus and found that the syntenic region of the mouse Il1b Peak5 enhancer was the most accessible region within the locus (Fig. 4Q).
IL1B drives profibrotic function via MEOX1
We hypothesized that IL1B secreted from Cx3cr1-positive cells under the control of BRD4 activates fibroblast stress responses in heart failure. Importantly, fibroblasts express Il1r1, the receptor to which IL1B binds (Extended Data Fig. 9A,B). We used human induced pluripotent stem cells (iPSCs)-derived cardiac fibroblasts (iPSC-CFs) (Extended Data Fig. 9C) to test whether IL1B could modulate the profibrotic response, particularly in the context of its effect in combination with TGFB, a master signaling factor for fibroblast activation. IL1B led to a significant increase in α-smooth muscle (αSMA)-positive fibers, which was further increased when used in combination with TGFB compared to TGFB alone (Extended Data Fig. 9D). IL1B in combination with TGFB triggered increased collagen contraction, a functional hallmark of fibroblast activation, compared to TGFB alone (Extended Data Fig. 9E). Knockdown of IL1R1 impaired the contractility triggered by IL1B and TGFB+IL1B (Extended Data Fig. 9F-J), but had no effect in reducing contractility when TGFB was used alone (Extended Data Fig. 9I). To test if secreted IL1B can function in a paracrine fashion to activate cardiac fibroblasts, we treated BMDMs with LPS (Extended Data Fig. 9K). The medium was treated with IgG or anti-IL1B neutralizing antibody and added to iPSC-derived cardiac fibroblasts plated on collagen pads (Fig. 5A). While the LPS-treated medium with IgG antibody increased fibroblast contractility, neutralizing IL1B significantly attenuated it, demonstrating that IL1B from myeloid cells modulates fibroblast contractile phenotype in a paracrine fashion (Fig. 5A).
Fig. 5. Systemic IL1B inhibition or targeted il1b deletion prevents stress-induced MEOX1 expression and fibroblast activation.

A. Schematic of BMDM-conditioning experiment (left), collagen-contraction assay on human iPSC-CFs (right). n=6, 2 experiments. B. Bulk RNA-seq in iPSC-CFs. MEOX1 is highlighted. C. Collagen contractility of iPSC-CFs, unstimulated or TGFB+IL1B-treated with control or MEOX1-targeting siRNAs. n=3, 3 experiments. D. Human MEOX1 locus showing H3K27Ac and p65/RELA in unstimulated iPSC-CFs (syntenic mouse Meox1 Peak9/10 enhancer highlighted). E. Luciferase assay of MEOX1 enhancer (from D) with BRD4 and p65/RELA. n=4, 2 experiments. F. MEOX1 expression in iPSC-CFs treated with IL1B, TGFB, or TGFB+IL1B with control or p65/RELA-targeting siRNAs. n=3, 3 experiments. G. TAC C57BL/6J mice treated with 500μg IgG or anti-IL1B antibodies, IP injections every 3 days. Non-CMs processed at day 30 for scRNA-seq. H. LV ejection fraction, IgG (n=5), anti-IL1b antibody (n=9). I,J,K. Fibroblast UMAPs by cluster (I), sample (J) and Postn/Meox1 expression (K). L. Violin plots of Postn and Meox1 across fibroblast clusters. M. Sample distribution within fibroblast clusters. N. Violin plots of Postn and Meox1 in fibroblasts across samples. O. Schematic of scRNA-seq from sorted cardiac fibroblasts at day 10 post-TAC with Il1b deletion. P,Q. UMAPs of sorted fibroblasts by cluster (P) and sample (Q). R. Sample distribution within clusters in sorted fibroblasts. S. UMAPs of Postn and Meox1 expression in sorted fibroblasts. T. Violin plots of Postn and Meox1 expression in sorted fibroblasts across samples. U. Working model depicting aspects of the molecular mechanisms regulating crosstalk between Cx3cr1-positive cells and activated fibroblasts through IL1B and MEOX1. A,C,E. Data are mean ± s.e.m. Two-way (A,C) and One-way (E,H) ANOVA followed by Tukey post hoc test.
RNA-seq and DE analysis among fibroblasts identified a small group of genes that were sensitive to TGFB stimulation and had increased expression when TGFB and IL1B were used in combination (Fig. 5B). These included genes such as SERPINA9, EGR2, LRRC152 and MEOX1, a critical transcriptional regulator of cardiac fibroblast activation.4. siRNA-mediated downregulation of MEOX1 abolished the increased fibroblast contractility induced by the combination of IL1B and TGFB (Fig. 5C and Extended Data Fig. 9L-O), suggesting dependency on MEOX1 for the activation of fibroblasts.
Given our observation that p65/RELA was one of the most enriched TF motifs in the open chromatin regions of profibrotic fibroblasts displaying high accessibility for Meox1 (Fig. 3L,P), and that it is activated by IL1B signaling31, we investigated whether p65/RELA was directly involved in MEOX1 regulation. We performed chromatin immunoprecipitation followed by sequencing (ChIP-seq) for H3K27Ac, which marks active chromatin regions, in human iPSC-derived cardiac fibroblasts. Within the human MEOX1 locus, we found that the region associated with strong enrichment of H3K27Ac was the syntenic element of the mouse stress-dependent Meox1 Peak9/10 enhancer4 (Fig. 5D). Several motifs for p65/RELA were present within this 2.7kb distal region (Extended Data Fig. 9P), and p65/RELA ChIP-seq on human cardiac fibroblasts revealed direct binding at the MEOX1 human enhancer (Fig. 5D). As our previous work demonstrated that Meox1 transcription is sensitive to BET inhibition4, which we confirmed in human cardiac fibroblasts treated with IL1B and TGFB (Extended Data Fig. 9Q), we tested whether BRD4 and p65/RELA functionally coregulate the human MEOX1 regulatory element. We cloned this cis-element into a luciferase reporter and found synergistic coregulation by BRD4 and p65/RELA (Fig. 5E). siRNA knockdown of p65/RELA (Extended Data Fig. 9R) abolished TGFB/IL1B-induced MEOX1 activation (Fig. 5F).
IL1B inhibition improves heart function
We tested whether blocking IL1B in vivo could decrease fibroblast activation and related cardiac dysfunction in response to pressure-overload. We performed TAC surgeries in C57BL6/J mice and treated them every 3 days with either IgG control or IL1B neutralizing antibodies for 30 days (Fig. 5G). IL1B neutralization significantly increased cardiac function (Fig. 5H) and reduced fibrosis (Extended Data Fig. 10A). We performed scRNA-seq in non-CMs from hearts of IgG and anti-IL1B treated TAC animals (Fig. 5G) and captured 24,279 cells in 14 transcriptomic clusters, encompassing myeloid, endothelial, and fibroblast cells (Extended Data Fig. 10B,C). We further analyzed the fibroblast population (Fig. 5I,J) and specifically examined genes associated with profibrotic function. Among the 7 clusters identified, clusters 4 and 6 exhibited enrichment in fibroblast stress genes such as Postn, Meox1 and Thbs4 (the latter specifically expressed in cluster 4) (Fig. 5K,L and Extended Data Fig. 10D,E), and were associated with profibrotic gene programs related to extracellular matrix and collagen fibril organization (Extended Data Fig. 10F). Clusters 4 and 6 showed reduced fibroblast representation in hearts treated with anti-IL1B, unlike cluster 3, which was predominantly from anti-IL1B treated hearts and lacked enrichment for Postn or Meox1 (Fig. 5M). Indeed, the expression of Postn and Meox1, and other activated fibroblast markers, was downregulated with IL1B neutralization (Fig. 5N and Extended Data Fig. 10G,H). In accord, GO analysis of the significantly upregulated genes in fibroblasts in IgG versus anti-IL1B treated animals (n=469) identified as top enriched gene programs those associated with extracellular matrix remodeling (Extended Data Fig. 10I). Like changes in the fibroblast transcriptome when Brd4 was deleted in Cx3cr1-expressing cells (Extended Data Fig. 3J), the GO terms of genes upregulated with IL1B neutralization (n=167) were enriched with programs related to angiogenesis and response to VEGF (Extended Data Fig. 10I). Moreover, GO analysis of genes upregulated in clusters 3 and 5 (those over-represented by fibroblasts from the anti-IL1B antibody treatment) revealed the same biological processes as most enriched (Extended Data Fig. 10J), suggesting common fibroblast transcriptional changes associated with cell-type specific Brd4 deletion in Cx3cr1-expressing cells and antibody-mediated IL1B neutralization.
Il1b in Cx3cr1+ cells activates fibroblasts
As systemic neutralizing antibody administration blocked IL1B from various possible cellular sources, we genetically deleted Il1b in Cx3cr1-expressing cells to determine the contribution of secreted IL1B from Cx3cr1-positive cells in regulating the transcriptional activation of cardiac fibroblasts in TAC (Fig. 5O). To capture fibroblast activation within the earliest stages of post-TAC remodeling32, we subjected Il1bflox/flox mice33 and Cx3cr1CreERT2; Il1bflox/flox littermates to TAC and, after 10 days (Extended Data Fig. 11A), performed scRNA-seq on sorted cardiac fibroblasts. We captured 19,787 cells expressing only fibroblast markers (Extended Data Fig. 11B) that encompassed 10 transcriptional clusters (Fig. 5P). The UMAP representation distinctly separated Il1bflox/flox (TAC) and Cx3cr1CreERT2; l1bflox/flox (TAC Il1b-KO) fibroblasts (Fig. 5Q). Cluster 1, characterized by elevated expression of profibrotic markers including Postn and Meox1, along with enrichment for gene programs linked to profibrotic functions (Extended Data Fig. 11C,D), demonstrated a depletion of fibroblasts from TAC Il1b-KO (Fig. 5R). Concordantly, Postn, Meox1, and many other genes associated with fibroblast activation were markedly downregulated in fibroblasts upon Il1b deletion in Cx3cr1-expressing cells (Fig. 5S,T and Extended Data Fig. 11E-G). Like the effect of IL1B neutralizing antibody, GO analysis of the fibroblast genes significantly downregulated in TAC Il1b-KO versus TAC (n=690) revealed enrichment for profibrotic gene programs (Extended Data Fig. 11H).
Finally, we compared the transcriptional responses in fibroblasts after TAC with either systemic IL1B inhibition or genetic deletion of Il1b in Cx3cr1-expressing cells. Merging the scRNA-seq data from fibroblasts in both the TAC IgG/TAC Anti-IL1B (Fig. 5J) and TAC/TAC Il1b-KO (Fig. 5Q) experiments yielded 7 transcriptional clusters (Extended Data Fig. 12A,B). While cluster 0, the largest in number, was equally distributed between samples, cluster 1 was depleted in cells from the Anti-IL1B treatment and Il1b genetic deletion conditions (Extended Data Fig. 12C), displayed the highest expression of Postn and Meox1 (Extended Data Fig. 12D,E), and the greatest enrichment of gene programs linked to fibroblast activation and fibrosis (Extended Data Fig. 12F). We also observed distinct transcriptional consequences in response to either the IL1B antibody neutralization or Il1b genetic deletion (Extended Data Fig. 12C,F). Importantly, both IL1B neutralizing antibody treatment and monocyte-specific Il1b deletion similarly inhibited profibrotic gene transcription (Extended Data Fig. 12G), underscoring the critical role of IL1B signaling in controlling fibroblast activation in response to cardiac stress.
Conclusion
Organ function relies on crosstalk between specialized cell types to maintain homeostasis and respond to stress. Here, we leveraged small-molecule BET bromodomain inhibition and cell-type specific Brd4 genetic deletion in heart failure to uncover stress-activated epigenomic mechanisms by which macrophages provide critical paracrine signals to activate cardiac fibroblasts in disease (Fig. 5U). Our work highlights how cell-compartment-specific perturbations of chromatin signaling can be combined with single-cell genomics to elucidate critical signaling molecules governing cell-to-cell interactions in disease.
We show that deletion of Brd4 in infiltrating, but not resident, Cx3Cr1-positive macrophages is associated with improved cardiac function in murine heart failure. We observed not only a significant decrease in the proinflammatory transcriptional response in the monocyte-derived macrophages but also an equally dramatic transcriptomic shift in fibroblasts, a population of cells that had not been genetically perturbed. In this context, the profibrotic response was decreased, suggesting that in response to stress, BRD4 in Cx3cr1-expressing cells controls the expression of paracrine signals, such as IL1B, that drive activation of tissue fibroblasts and fibrosis.
We found that IL1B was essential for fibroblast activation in heart failure pathogenesis and that via a specific p65/RELA-dependent enhancer, it controls the activation of MEOX1, a critical regulator of the stress-activated fibroblast response4. While much of the study of fibroblast activation in disease has centered on the role of canonical profibrotic signaling pathways such as TGFB34, little is known about how inflammatory signals can influence fibroblast cell states in disease. Our discoveries highlight how cis-regulatory elements, such as the MEOX1 enhancer, can function as hubs to process profibrotic and proinflammatory signaling, providing a mechanistic understanding of how inflammation can modulate tissue fibrosis and remodeling.
Our data suggest that IL1B from Cx3cr1-expressing myeloid cells is a critical modulator of stress-induced fibroblast states and that IL1B antibody-mediated neutralization is sufficient to improve cardiac function in heart disease. Importantly, a parallel contemporaneous study utilizing explanted human heart tissue from patients with cardiomyopathy or acute myocardial infarction independently identified IL1B-mediated macrophage-fibroblast communication as a regulator of pathologic fibroblast activation35. Indeed, an exploratory analysis of a clinical trial evaluating systemic administration of an IL1B neutralizing antibody for the treatment of ischemic cardiac disease36 identified a reduction in heart failure hospitalization and heart-failure related mortality37. As secreted factors such as IL1B can amplify the stress response by acting on receptors expressed in non-immune cells, they represent exciting therapeutic targets that may ameliorate organ dysfunction in disease.
While anti-inflammatory therapies targeting essential immune modulators have promising therapeutic applications, they are also associated with serious adverse events such as a higher incidence of fatal infection and sepsis36,38. Here, we identified the exact stress-activated cis-elements that regulate Il1b activation in heart disease. This mechanistic refinement converging on specific regulatory elements offers key new insights that can catalyze the development of therapeutic approaches to selectively inhibit proinflammatory states in defined cell compartments, which may be a preferable strategy for a wide variety of diseases associated with chronic inflammation and maladaptive tissue remodeling.
Methods
Animal models
All protocols concerning animal use were approved by the Institutional Animal Care and Use Committees at the University of California, San Francisco and conducted in strict accordance with the National Institutes of Health Guide for the Care and Use of Laboratory Animals. Studies were conducted with age-matched male mice in a pure C57BL/6J background. Mice were housed in a temperature- and humidity-controlled facility with a 12-hour light/dark cycle. Brd4flox11 and Cx3cr1CreERT mice39 have been previously described. Brd4flag mice were produced by blastocyst injection of ribonucleoprotein complexes consisting of purified Cas9 protein (IDT), a guide RNA (crRNA targeting Brd4 locus and universal 67mer tracrRNA; IDT), and a single-stranded oligonucleotide DNA template for homology directed repair (IDT) that led to the in-frame insertion of a 3X FLAG epitope tag along with a GGGGS flexible linker immediately downstream of the start codon in exon 3 of the endogenous Brd4 locus (details of gRNAs and HDR are provided in the Tables section). Blastocysts were transferred to pseudopregnant females and pups were weaned at 4 weeks of age. Founder animals were screened for introduction of the 3X FLAG epitope tag by PCR amplification and confirmed by sequencing. Positive founders were outcrossed to wild type C57BL/6J animals and pups were screened for germline transmission of the Brd4flag allele by PCR genotyping with sequencing confirmation. We obtained cryopreserved sperm for the Il1b conditional allele previously generated by Dr. Emmanuel Pinteaux (University of Manchester, UK)33. After rederiving this mouse line, Cx3cr1CreERT; Il1bflox/flox and littermate Il1bflox/flox controls were subjected to TAC (with continuous tamoxifen injection beginning three days prior to TAC surgery). Animals were outcrossed to C57BL/6J animals for >6 generations.
Preparation of JQ1
JQ1 was synthesized and purified in the laboratory of Jun Qi (Dana Farber Cancer Institute), as previously published5. For in vivo experiments, a stock solution [50 mg/ml JQ1 in dimethyl sulfoxide (DMSO)] was diluted to a working concentration of 5 mg/ml in an aqueous carrier (10% hydroxypropyl b-cyclodextrin; Sigma C0926) using vigorous vortexing. Mice were injected at a dose of 50 mg/kg given intraperitoneally once daily. Vehicle control was an equal amount of DMSO dissolved in 10% hydroxypropyl b-cyclodextrin carrier solution. All solutions were prepared and administered using sterile technique. For in vitro experiments, JQ1 was dissolved in DMSO and administered to cells at 500nM final concentration using an equal volume of DMSO as control.
Mouse model of transverse aortic constriction, echocardiography
All mice were male and 10-12 weeks of age. Wild type C57BL/6J mice were obtained from The Jackson Laboratory (Stock No: 000664). Mice were placed on a temperature-controlled small-animal surgical table to help maintain body temperature (37°C) during surgery. Mice were anesthetized with isoflurane, mechanically ventilated (Harvard Apparatus), and subjected to thoracotomy. For TAC surgery, the aortic arch was constricted between the left common carotid and the brachiocephalic arteries using a 7-0 silk suture and a 25-gauge needle, as previously described6. For sham surgeries, thoracotomy was performed as above, and the aorta was surgically exposed without any further intervention. For echocardiography, mice were anesthetized with 1% inhalational isoflurane and imaged using the Vevo 3100 High Resolution Imaging System (FujiFilm VisualSonics Inc.) and the MX550S probe. Measurements were obtained from M-mode sampling and integrated electrocardiogram-gated kilohertz visualization (EKV) images taken in the left ventricle (LV) short axis at the mid-papillary level as previously described6. LV ejection fraction measurement was obtained from high-resolution two-dimensional measurements at end-diastole and end-systole as previously described6. All echocardiography analyses were performed blinded (mice were assigned an alphanumeric code).
Fibrosis quantification
For quantifying fibrosis, mice were euthanized at the appropriate experimental endpoint. Hearts were explanted after perfusion with 10ml of PBS via introduction of a 22.5G needle into the left ventricle apex and clipping of the right atrium. Hearts were washed with PBS and fixed overnight in 2% PFA followed by dehydration to 100% EtOH in a graded series. For paraffin embedding, hearts were processed in an automated system through successive PBS washes, increasing series of alcohols (Aga), Clear Rite 3® (Richard-Allan Scientific) and Shandon Histoplast (Thermo Scientific) at 56°C. Hearts were included in paraffin and sectioned transversely. Sections representative of different z-positions of the ventricles from base to the apex were dewaxed, rehydrated and Picro Sirius Green stained according the manufacturer’s protocol. Sections were diaphanized in xylene and mounted in DPX Mountant for histology (06522, Sigma-Aldrich®). Images were acquired using a Leica DMi8 Widefield Microscope with a 4X objective lens and then white balanced using FIJI software. RGB images were then converted to grayscale using the UnmixColors module in CellProfiler (version 4.2.4). Grayscale images were then segmented to identify total tissue and fibrotic tissue using the IdentifyPrimaryObjects module in CellProfiler. Percentage of fibrosis was calculated by dividing the fibrotic tissue area by the total tissue area. Statistical analysis of the data was performed using Prism 10 with statistical significance determined at p < 0.05 using a t-test followed by a Welch’s correction, given we did not expect equal variances across groups and the different number of samples in each group. One sample in one condition was excluded because the fibrosis percentage was greater than two standard deviations above the mean when considering all the data points across all conditions. A blinded approach (labeling samples with an alphanumeric code) was implemented for analyzing fibrosis.
Flow cytometry analysis and cell sorting
For flow cytometry related experiments, ventricular cardiac tissue was chopped finely with surgical scissors and transferred to 6 cm dishes containing 450 U/ml Collagenase I (Sigma), 60 U/ml hyaluronidase (Sigma) and 60 U/ml DNAse I (Sigma) in DMEM and incubated with shaking for 60 min at 37°C. Samples were then quenched in 5 ml DMEM, filtered through 40 um filters and spun down. Red blood cell lysis was performed with ACK lysing buffer (Invitrogen). Cells were then incubated with Human FcX (Biolegend) to prevent non-specific antibody binding. Cells were then washed in DPBS and incubated with Zombie Aqua Fixable Viability Dye (Thermo). Following viability dye, cells were washed with sort buffer and incubated with cell surface antibodies mix diluted in the BV stain buffer (BD Biosciences) following manufacturer instruction for 30 minutes on ice in the dark and subsequently fixed in Fixation Buffer (BD Biosciences). The antobodies used were: mEFSK4-APC (Miltenyi Biotec, 130-120-802; 1:50), CD45-BUV395 (BD, 564279; 1:200), CD90.2- BV785 (Biolegend, 105331; 1:400), CD11b- BV605 (Biolegend, 101257; 1:200), CD11c-BV650 (Biolegend, 117339; 1:400), Ly6C-BV711 (Biolegend, 128037; 1:200), Ly6G-BV421 (Biolegend, 127628; 1:200), CD64-FITC (Biolegend, 139316; 1:200).
For cell sorting related experiments, non-CMs purified from Langendorff perfused hearts were suspended in 500ul of FACS buffer (5% FBS, 0.01% NaN3 in 1X PBS) and blocked with Fc receptor antibody specific for FcγR III/II (Biolegend TruStain FcX PLUS anti-mouse CD16/32; 1:50 dilution) for 15 minutes, then stained with indicated antibodies for 30-40 minutes. After staining, cells were washed three times with FACS buffer and resuspended in 400ul of 5% FBS in 1X PBS. Stained cells were subjected to flow cytometry using a BD FACSAria II cell sorter. Antibodies used in this study are CD45-PB (Biolengend, 103125; 1:100), Cx3cr1-APC (Biolegend, 149008; 1:100), CD31-PE-Cy7 (Invitrogen, 25-0311-82; 1:50), and mEFSK4-APC (Miltenyi Biotec, 130-120-802; 1:50). All flow cytometry analysis was performed with FlowJo (v10.10).
Langendorff perfusion and cell/nuclei isolation for subsequent single-cell RNA and ATAC sequencing
Cell isolation from mouse hearts were performed using two methodologies: #1) as previously described with minor modifications40 or #2) using a variation of the PAN-INTACT protocol41. For #1, after a proper level of anesthesia was induced, a thoracotomy was performed and the mouse heart was isolated, cannulated, and perfused with perfusion buffer (120.4 mM NaCl, 14.7 mM KCl, 0.6 mM KH2PO4, 0.6 mM Na2HPO4, 1.2 mM MgSO4, 10 mM Na-HEPES, 4.6 mM NaHCO3, 30 mM taurine, 10 mM 2,3-butanedione monoxime, and 5.5 mM glucose, pH 7.0) in a Langendorff perfusion system (Radnoti 120108EZ) for 5-10 minutes at 37°C. The cannulated heart was then digested with digestion buffer (perfusion buffer with 300 units/mL collagenase II (Worthington Biochemical) and 50 μM CaCl2) for approximately 10 min at 37°C. At the end of digestion, the atria and great vessels were removed and the ventricular tissue was transferred and gently teased into small pieces in stop buffer (perfusion buffer with 10% fetal bovine serum) at 37°C. After gently pipetting, the cell suspension was passed through a 250 μM strainer in a 50ml conical centrifuge tube and centrifuged at 30xg for 3 minutes at room temperature (RT). The supernatant, which contained most of the non-cardiomyocytes (non-CMs), was divided from the pellet (which contained the CM fraction). The non-CM fraction was centrifuged again at 30xg for 3 minutes at RT and the supernatant retained. The supernatant was filtered with a cell strainer (70 μm) and centrifuged at 400xg for 3 minutes at RT for eliminating debris. The non-CM pellet was resuspended in 1mL cold PBS 0.5% BSA. Cells were counted with trypan blue using a hemocytometer and 15k cells were used for subsequent 10X Genomics Chromium single-cell RNAseq preparation. For single cell ATAC, 500k isolated and purified non-CMs were resuspended in 100uL lysis buffer (Tris-HCl 10mM pH 7.4, NaCl 10mM, MgCl2 3mM, Tween-20 0.1%, P40 0.1%, Digitonin 0.01%, BSA 1% in nuclease-free water), pipetted 10 times, and kept on ice for 5 minutes. Nuclei were washed with 1mL 1X PBS with 1% BSA and centrifuged for 5 minutes at 4 °C. The nuclei pellet was resuspended in 1mL 1X PBS with 1% BSA and filtered with a 10uM strainer (pluriSelect #43-50010-00). Nuclei were counted after DAPI staining using a hemocytometer and 10k non-CM nuclei were used for subsequent 10X Genomics Chromium single-cell ATAC-seq preparation. The CM fraction underwent a second round of centrifugation at 30xg for 3 minutes at RT in stop buffer and the supernatant was discarded. The CM pellet was finally centrifuged at 400xg for 3 minutes in stop buffer at RT and the supernatant was discarded. For #2, after the mouse heart was isolated, it was rinsed in a sterile 10cm petri dish containing 1X PBS on ice to remove excess blood and transferred to a 10cm petri dish containing 2ml of ice cold lysis buffer (320 mM sucrose, 5 mM CaCl2, 3 mM magnesium acetate, 2 mM EDTA, 0.5 mM EGTA, 10 mM Tris-HCl pH 8.0, 0.20% triton X-100) and minced into very small pieces. The minced heart tissue in 2ml of lysis buffer was transferred to a “Type A” dounce homogenizer and subjected to 50 strokes. This solution was subsequently transferred to a “Type B” dounce homogenizer and subjected to 3 strokes. The solution was serially passed through 100 μM and 70 μM strainers and then centrifuged at 1,000xg at 4 °C for 8 minutes. The nuclear pellet was resuspended in nuclei resuspension buffer (430 mM sucrose, 70 mM KCl, 2 mM MgCl2, 10 mM Tris-HCl ph 7.2, EGTA 5 mM, 10% glycerol). Nuclei were counted after DAPI staining using a hemocytometer and 15,000 nuclei were used for subsequent 10X Genomics Chromium single-nuclei RNAseq and 10,000 nuclei were used for ATAC-seq.
sc/snRNA-seq and scATAC-seq library preparation
For sc/snRNA-seq library preparation, cells or nuclei were loaded onto the 10X Genomics Chromium instrument according to manufacturer’s protocols (Chip G, PN-1000120). All experiments were conducted with version 3.1 NEXT GEM reagents (PN-1000121), using 9 cycles of cDNA amplification for the GEM kit (PN-1000123) and 9 cycles of library amplification for library kit (PN-1000157). Each sample was indexed with a unique sample primer (Single Index Kit T Set A, PN-000213). For scATAC-seq library preparation, nuclei were first transposed with Tn5 enzyme (PN-2000138) and then loaded onto the Chromium instrument (Chip H, PN-1000161) using the version 1.1 NEXT GEM reagents (PN-1000175). Library preparation proceeded with 12 cycles each of GEM barcoding and library amplification. Each sample was indexed with a unique sample primer (Single Index Plate N Set A, PN-3000427). For both scRNA-seq and scATAC-seq, samples were pooled separately into respective libraries and sequenced on an Illumina NextSeq 500 (Illumina, software 4.0.2) and/or a lane of a Novaseq S4 (Illumina, software v1.5), according to manufacturer’s guidelines for sc/snRNA-seq and scATAC-seq, respectively.
sc/snRNA-seq data preparation and analysis
The Cell Ranger pipeline was used for processing all samples post-sequencing (10X Genomics, version 3.1). Samples were demultiplexed and fastq files were generated using cellranger mkfastq. All samples were then individually aligned to the mouse reference genome mm10 using cellranger count with the intron = true flag to be consistent with single nuclei RNA-seq analysis for which intronic reads are also kept. To account for varying sequencing read depth, we further ran cellranger aggr to normalize all samples to mapped read depth of the least sequenced sample. Read-normalized aggregated values from cellranger aggr were used as initial input using the R package Seurat (v4.0.1) using the functions Read10X and CreateSeuratObject with standard variables. Each sample used in aggregation was identified by condition and replicate and assigned a unique name in metadata as “gem.group“. Quality control filtering included removal of outliers due to the number of features/genes (nFeature_RNA > 2000 & nFeature_RNA < 7500), UMI counts (<80,000) and mitochondrial percentage (<15%). SCT normalization was then performed. PCA analysis and batch correction using Harmony was then performed using split.by = "gem.group". Clustering was then run using the functions RunUMAP, FindNeighbors, and FindClusters and the output UMAP graphs were generated by DimPlot. Marker genes were identified by the function FindAllMarkers with standard settings. After initial processing, iterative rounds of filtering poor quality clusters and re-running clustering workflows. Differential gene expression was performed using the Wilcoxon test between two groups with the function FindMarkers. Gene ontology (GO) analysis was run using genes identified with either FindAllMarkers or FindMarkers using Enrichr 42. For merged analyses of the fibroblasts datasets from the TAC IgG/TAC Anti-IL1B and the TAC/TAC Il1b-KO experiments, samples with the greater number of cells were downsampled using the sample() function to match the total number of cells in the smaller experiment, after which datasets were merged using the merge() function to create one merged Seurat object. This merged object was processed as previously described to yield a merged and clustered dataset, and differential gene expression and GO term analysis per-cluster were performed as previously described. Cells were annotated as “positive” for a gene of interest after qualitative evaluation of feature plots, violin plots, and ridge plots of gene expression levels. Expression thresholds were chosen based on the point in these visualizations where background expression of these genes began to diverge between samples, selecting the minimum value where differences in sample groups appeared.
Correlating cardiac function with gene expression
To identify genes correlated with changes in cardiac function across conditions, we designed a regression model to link cell type specific changes between reads in scRNA-seq data to the measured ejection fraction of the left ventricle by echocardiographic assessment. For each gene, we fit a linear model where the output variable is the number of reads in that gene for each cell of the particular cell type of interest and the input is the ejection fraction matched to the same condition that the cells are taken from, using a Poisson distribution to model the counts. We sampled down to 1,000 cells in each cell type and condition, resampling when there were too few cells. A score is assigned to each gene in each cell type using the correlation coefficient of the fitted regression on the ejection fraction. We then normalized the scores for each cell type across genes using the interquartile range, and used the variance of the normalized scores to compute p-values. We use a threshold of +/− 5 (p-value < 1e−6) to consider a gene to be significantly positively or negatively correlated with cardiac function in a given cell type.
scATAC-seq data preparation and analysis
Raw sequencing data were preprocessed with the Cell Ranger ATAC v.2.0 pipeline (10X Genomics). The ArchR v1.0.1 R package43 was used for subsequent analyses according to the ArchR web tutorials. The TSS enrichment score and the number of fragments per nuclei were used to eliminate low quality nuclei from downstream analyses (for Cx3cr1creERT2;Brd4flox/flox whole heart ATAC-seq data (Fig. 3), minTSS=16, minFrags=3163, and maxFrags=1e+6; For Cx3cr1creERT2;Brd4flox/flox CD45Pos ATAC-seq data (Fig. 4), minTSS=15, minFrags=1584, and maxFrags=1e+6), and nuclei doublets were removed using the addDoubletScores and filterDoublets functions, resulting in the ArchRProject to be analyzed. After genome-wide tiling with iterative Latent Semantic Indexing, dimensionality reduction was performed using the addIterativeLSI function. Batch correction among each sample was performed using the addHarmony function. Clustering and the 2D embedded visualization in UMAP space were performed using the addClusters, addUMAP, and plotEmbedding functions, respectively. For Cx3cr1creERT2;Brd4flox/flox CD45Pos ATAC-seq, some clusters prominently enriched with only one sample from Cre positive animals and those nuclei showed lower TSS and lower nFragments than those of nuclei from other clusters. Thus, those clusters were excluded as low quality data with the remainder of the nuclei processed again in the same manner. Gene scores (GS), which were calculated by the accessibility of promoter and gene body regions of each gene and can be treated as a proxy of expression levels of a corresponding gene, were extracted to identify the cluster features using the getMarkerFeatures with useMatrix=”GeneScoreMatrix”. For peak calling per cluster, the addGroupCoverages and the addReproduciblePeakSet functions with peakMethod="Macs2" were used. To identify the cluster specific feature peaks, the getMarkerFeature functions with useMatrix=”PeakMatrix” was used. Differentially accessible region (DAR) analysis between clusters was performed using the getMarkerFeatures function by setting clusters for comparison using the useGroups and bgdGroups functions. The statistically significant DARs were defined with FDR<0.1 and Log2 FC>1. Motif enrichment analyses on the detected DARs were performed using the peakAnnoEnrichment function. To identify the enriched transcription factor binding site motifs in the detected specific feature peaks found in our ATAC-seq analyses, the findMotifsGenome.pl function from HOMER44 (v4.11.1) was used with “-size given” and “-mask” options, incorporating a custom motif dataset that included the experimentally derived MEOX1 motif alongside the standard motif dataset. For de novo discovery of the MEOX1 binding motif we used HOMER (v4.11.1) with the size parameter set to 200, the “mask” option enabled, and using all intersecting peaks across three replicates of MEOX1 anti-HA ChIP-seq in TGFB treated cells as input regions4. The top identified de novo motif was highly enriched, occurring in 58.5% of target regions as compared to 5.23% of background regions (Homer p-value = 1e-2595).
Downstream processing of ATAC-seq data
For downstream analysis of ATAC-seq data we use ArchR generated cell-by-bin matrices. We normalize this matrix per cell using each cell's total reads in transcription start sites (TSS), generating TSS normalized read counts for each cell in each bin. To generate coverage tracks, we use the mean TSS normalized accessibility across cells for the given cell type and condition at each bin. To compare the accessibility of a genetic region across conditions we use the mean of TSS normalized accessibility of cells across bins overlapping the region with a confidence interval computed on the deviation in accessibility across cells. To fit a curve to the change in accessibility over conditions, we fit a spline with two degrees of freedom to the TSS normalized accessibility of cells in each condition. To compute the co-accessibility of a peak with a promoter we use the Jaccard similarity of the binarized version of the ArchR cell-by-bin matrix, counting any bin overlapping the promoter and any bin overlapping the peak of interest. To score gene accessibility modules, ArchR’s addModuleScore function was used with standard settings where features=“significantly upregulated scRNAseq genes” from Seurat’s FindMarkers function. In all cases, significant differentially expressed genes were selected with log2FC > 0.125 and adjusted p-values < 0.05.
Identifying stress sensitive distal elements
To identify distal elements in the monocyte/macrophage population that are sensitive to stress and Cx3cr1-specific Brd4 deletion we first use a modified version of the ROSE28 algorithm on all TAC distal peaks to stitch together peaks using a standard 12.5kb gap. However, in our version, we allow stitching to span gene coding regions but do not consider peaks in those regions. We score each stitched region using the sum of TSS normalized accessibility across the region, omitting reads in gene coding regions. We then use the standard ROSE algorithm to select large (or “super”) enhancers based on setting a threshold using the tangent line to the elbow plot of rank against score. This results in 748 large enhancers. We then score these for significance at the transition between Sham and TAC and between TAC and Cx3cr1-specific Brd4 deletion as follows: at each transition we compute the TSS normalized number of reads for each cell in that region. We then use a one-tailed Wilcoxon rank-sum test in each direction to compute the significance of the change in accessibility across cells between each pair of conditions. We called two sets of dynamic SEs, ones that increase significantly (Wilcoxon p-value < 1e−5 in all cases) with TAC and decrease with Cx3cr1-specific Brd4 deletion, and ones that decrease with TAC and increase with the deletion.
Chromatin accessibility trends in individual Il1b super enhancer peaks
To generate chromatin accessibility trends for individual peaks, we intersected the 500bp bins generated by ArchR with the region for each peak. Then, for each peak and condition, we calculated the average number of reads across the overlapping bins for each cell belonging to that condition. Finally, we fit a linear model to a cubic spline with two degrees of freedom for each peak across the 3 conditions to the cells belonging to each condition.
Western blotting
dBET1 (MedChem Express, HY-101838) was dissolved in a 40% captisol solution (vehicle) and injected at 50 mg/kg in BRD4 FLAG/FLAG mice. An equal volume of vehicle was injected in mice of the same genotype as controls. Animals were sacrificed 8 hours after injection and liver tissue was harvested to generate nuclear protein lysates that were subjected to Western blotting with anti-FLAG (Sigma Aldrich, F3165) and anti-beta-Actin (LICOR, 926-42212) antibodies.
Assessment of BRD4 chromatin occupancy by CUT&RUN in CX3CR1Pos sorted cells
Whole hearts were obtained from Brd4flag/flag animals that underwent Sham or TAC surgeries and were subjected to Langendorff perfusion to obtain suspensions of cardiac cells. The non-CM population was purified by serial differential centrifugation and size-exclusion filtering steps (see relevant section on the Methods) followed by CX3CR1 antibody staining and sorting by flow cytometry (see dedicated section on flow cytometry for details). CX3CR1Pos cells were subjected to CUT&RUN like we previously described45 using the CUTANA™ ChIC/CUT&RUN kit (Epicypher) using an anti-FLAG antibody (Sigma M2 #1804, 0.5ug per reaction, 1:100 dilution) following manufacturer instructions with included positive and negative controls. Purified fragmented DNA was quantified using a Qubit 2.0 fluorometer (ThermoFisher Scientific) using the dsDNA HS Assay Kit. Paired-end Illumina sequencing libraries were prepared from CUT&RUN enriched DNA using the NEBNext Ultra™ II DNA Library Prep Kit (New England Biolabs) and sequenced on a NextSeq 500 (Illumina). The nf-core/cutandrun (v2.4.2 https://doi.org/10.5281/zenodo.5653535) pipelines were used to perform primary analysis within the Nextflow bioinformatics workflow manager (v21.10.6) in conjunction with Singularity (v2.6.0) using the following command: `nextflow run nf-core/cutandrun --genome GRCm38 --input design_matrix.csv -profile singularity`. The pipelines perform adapter trimming, read alignment, and filtering, normalized coverage track generation, peak calling and annotation relative to gene features, consensus peak set creation, and quality control and version reporting. All data were processed relative to the mouse (GCRm38 - mm10) annotation.
Calculating BRD4 enrichment
For each SE (super enhancer) we calculated whether it had an increase or decrease in BRD4 binding. In order to score based on creation of new binding rather than just increase in overall binding, we compute the log-fold change (with a pseudocount of 1) in the total sum of the widths of detected BRD4 peaks in the two conditions. To calculate the log-fold change in coverage for genes we used a similar approach using the entire gene body extended 5kb upstream and downstream as the region of interest. In order to conduct genome-wide scoring of changes in BRD4 binding we used the “csaw” package for R to bin the entire genome into 500bp windows and fit a model using the standard procedure and default parameters. This gave us a normalized p-value and log-fold change in binding for every 500bp window.
ChIP-seq experiment and analysis
For chromatin immuno-precipation (ChIP) sequencing experiments, 106 human induced pluripotent stem cell derived cardiac fibroblasts (iPSC-FBs) were pelleted in unstimulated condition and resuspended in 10ml FibroGRO™ Basal Medium, cross-linked in 1% formalin solution (Thermo Fisher Scientific) by rocking in room temperature for 10 minutes and finally glycine (final concentration 0.125M) was added to quench the cross-link for 5 minutes. Samples were centrifuged at 1000 rcf for 5 minutes at 4C. Cells were washed twice with 10 ml of cold 1x PBS supplemented with proteinase inhibitors and phosphatase inhibitors (Roche # 4693132001) and the pellets were snap frozen in liquid nitrogen. All samples were stored at −80C until use. When ready, cell pellets were incubated in cell lysis buffer (20 mM Tris-HCl, pH 8, 85 mM KCl, 0.5% NP-40 and protease inhibitors) for 10 min on a rotator at 4C. Nuclei were isolated by centrifugation (2,500 x g, 5 min, 4C), resuspended in 1mL nuclear lysis buffer (50 mM Tris-HCl, pH 8, 10 mM EDTA, pH 8, 1% SDS, protease inhibitors) and incubated on a rotator for 30 min at 4C. Chromatin was sheared using a Covaris S2 sonicator (Covaris Inc) for 20 min (60 s cycles, 20% duty cycle, 200 cycles/burst, intensity = 5) for preparing DNA in the 200–700 base-pair range. Chromatin was diluted 3-fold in ChIP dilution buffer (0.01% SDS, 1.1% Triton X-100, 1.2mMEDTA, 16.7mMTris-HCl, pH 8, 167 mM NaCl, protease inhibitors) for a total volume of 3ml. 30uL of chromatin (representing 1%) was taken as input DNA. High-salt buffer (250mM Tris-HCl, pH 7.5, 32.5 mM EDTA, pH 8, 1.25M NaCl) and Proteinase K (New England Biolabs Inc (NEB)) were added and crosslinks were reversed overnight at 65C. Inputs were treated with RNase A, and DNA was purified with AMPure XP beads (Beckman Coulter cat #A63881). DNA concentration was measured with Qubit (ThermoFisher) to work out the original concentration of the sonicated chromatin. All ChIPs were performed in 1000ul of final volume. For anti-p65/RELA antibody (Bethyl Laboratories #A301-824A), 15ug of chromatin was incubated with 4ug of anti-p65/RELA antibody (1ug/uL, final dilution 1:250). For the anti-H3K27ac antibody (Abcam #4729), 3ug of chromatin was incubated with 2ul of anti-H3K27ac (1ug/uL, final dilution 1:1000). All incubations were overnight at 4C under rotation. Antibody-protein complexes were immunoprecipitated using Pierce Protein A/G magnetic beads at 4C for 2 h under rotation. Beads were washed five times (2-min/wash under rotation) with cold RIPA buffer (50 mM HEPES-KOH, pH 7.5, 500 mM LiCl, 1 mM EDTA, 1% NP-40, 0.7% Na-deoxycholate), followed by one wash in cold final wash buffer (1xTE, 50 mM NaCl). Immunoprecipitated chromatin was eluted at 65C with agitation for 30 min in the elution buffer (50mMTris-HCl pH 8.0, 10mMEDTA, 1% SDS). The immunoprecipitated chromatin was then reverse-crosslinked and purified as described above for the inputs. For subsequent sequencing, fragmented ChIP and input DNA were end-repaired, 5’-phosphorylated and dA-tailed with NEBNext Ultra II DNA Library Prep Kit for Illumina (NEB, E7645). Samples were ligated to adaptor oligos for multiplex sequencing (NEB, E7335), PCR amplified, and sequenced on a NextSeq 500 (Illumina, software 4.0.2) at the Gladstone Institutes.
The nf-core/ChIP-seq pipeline (v1.2.2; https://doi.org/10.5281/zenodo.4711243) was used to perform primary analysis of the samples within the Nextflow bioinformatics workflow manager (v21.10.6) in conjunction with Singularity (v2.6.0) using the following command: `nextflow run nf-core/chipseq --max_memory 80.GB --single_end --narrow_peak --skipBiotypeQC --skipTrimming --genome GRCh38/GRCm38 --input design_matrix.csv -profile singularity`. The pipeline performs adapter trimming, read alignment, and filtering, normalized coverage track generation, peak calling and annotation relative to gene features, consensus peak set creation, differential binding analysis, and quality control and version reporting. All data were processed relative to the human (GCRh38 - hg38) annotation.
Calculating RELA/p65 binding
To determine RELA/p65 binding for the 748 SEs we calculated the mean read-normalized coverage of ChIP-seq data in bone marrow-derived macrophages (BMDMs) for p65/RELA across the specified region. To calculate RELA/p65 binding for genes we used a similar approach using the entire gene body extended 5kb upstream and downstream as the region of interest.
Lipopolysaccharide (LPS) stimulation of Raw 264-7 macrophages
The Raw 264-7 mouse macrophage cell line was obtained from the American Type Culture Collection (ATCC) and cultured in high-glucose Dulbecco’s Modified Eagle’s Medium (DMEM) containing 10% fetal bovine serum (FBS; Gibco), 100U/ml penicillin (Gibco), 100ug/ml streptomycin (Gibco), 1X non-essential amino acid solution (Gibco), 1mM sodium pyruvate (Gibco) at 37°C in a humidified incubator with 5% CO2. Approximately 2x10⁵ cells were seeded on 6-well plates in the late afternoon and cultured overnight. The following day, the culture medium was removed and replaced with fresh medium containing 0.1ng/ml, 1ng/ml, or 10ng/ml LPS (Sigma Aldrich). After 3-, 6-, or 24-hours following stimulation, cells were washed with 1X PBS and lysed in 1ml of Trizol LS reagent (Invitrogen) and processed for total RNA extraction.
Generation of Il1b enhancer peak deletions in Raw 264-7 macrophages
We used CRISPR/Cas9-mediated genome editing to generate individual Raw 264-7 cell lines containing deletions of each of the 7 peaks identified from our scATAC-seq analysis. Chemically modified synthetic single guide RNAs (sgRNAs) flanking the region to be deleted (Synthego) were reconstituted in nuclease-free water at 100 uM. The paired ribonucleoprotein (RNP) complexes for each peak to be deleted were prepared individually by mixing 120 pmol of sgRNA with 20 pmol of Cas9 protein (QB3 MacroLab, University of California, Berkeley) in 5 ul of P3 primary cell nucleofection buffer (Lonza) and incubated at room temperature for 15 minutes. Prior to nucleofection, the paired RNPs were combined and nucleofected into 4x10⁵ Raw 264-7 cells suspended in 10 ul of nucleofection buffer (Lonza) using the program DS-136 in a 4D Nucleofector X Unit (Lonza). After nucleofection, 100 ul of warm culture medium was added to the cuvette and incubated at 37°C for 15 minutes. Nucleofected cells were equally divided to 4 wells of 96-well plate and cultured for 48 hours at 37°C. Cells from each of these 4 wells were dissociated and divided into 2 portions–one portion was used to collect genomic DNA using QuickExtract DNA Extraction solution (Lucigen) while 500 cells from the other portion was suspended in 25 ml of culture medium and 100 ul was seeded into each well of two 96-well plates for further culture. The extracted genomic DNA was subject to PCR to detect deletion of the desired regions and the products were visualized using agarose gel electrophoresis. The well with the highest density product was chosen for subsequent screening from the corresponding 96-well plates. In the 96-well plates, those wells observed to have single cells on the day after seeding were marked and maintained in culture for 7-10 days with medium changes every 2 days. When cells were 50% confluent, they were split into two wells in separate plates at different densities. The plate seeded at the higher density was harvested on the day after seeding and processed for genomic DNA extraction and PCR genotyping for detection of the targeted deletion. PCR products with smaller sizes than wild type band were verified by Sanger sequencing (Quintara Bio). Upon confirmation of the appropriate enhancer deletion, the corresponding lower density wells were expanded. The sequences of the sgRNAs used for individual peak deletions and the primers used to detect these deletions by PCR are outlined in the relevant “Tables” section.
Analysis of publicly available human scATAC-seq data
After the human scATAC-seq data30 was processed and clustered by ArchR, we called marker genes for each cluster using getMarkerFeatures with Gene Scores with the wilcoxon test for each cluster at FDR<0.15 and a minimum log2-fold change in score of 0.5. To generate coverage tracks for the IL1B locus we selected all cells in Cluster 3 (n=632, the cluster with high accessibility for both CX3CR1 and IL1B genes) and then calculated the mean TSS normalized coverage (as described previously) for cells derived from control patients and myocardial infarction (MI) patients. We plotted the coverage for the IL1B human locus (Hg38 chr2:112,798,605-112,843,614) obtained by lifting over the Il1b mouse locus (Mm10 chr2:129,318,595-129,389,491). To control for the large variance that can result from deriving coverage from a small number of cells, we only considered signal in regions in which at least two different samples had at least one read, and set a minimum threshold of 4e−6 for detectability of coverage
Human induced pluripotent stem cell derived cardiac fibroblasts (iPSC-FBs)
Human induced pluripotent stem cell derived cardiac fibroblasts46 (iPSC-FBs) were cultured in FibroGRO Complete Medium (SCMF001; Millipore Sigma) with 2% FBS at 37°C in a humidified incubator with 5% CO2. When stimulating stress in iPSC-CFs, the cells were cultured with 0.5% FBS in FibroGRO Complete Medium without supplements, with addition of either TGFB (5ng/ml; Peprotech), IL1B (10ng/ml; Sigma Aldrich), or TGFB+IL1B (10ng/ml and 5ng/ml, respectively). For in vitro experiments, JQ1 was dissolved in DMSO and administered to cells at 500nM final concentration using an equal volume of DMSO as control. For luciferase experiments, HeLa cells were obtained from ATCC and cultured in high-glucose Dulbecco’s Modified Eagle’s Medium (DMEM) containing 10% FBS (Gibco), 100U/ml penicillin (Gibco), and 100ug/ml streptomycin (Gibco) at 37°C in a humidified incubator with 5% CO2.
RNA extraction, RT-PCR, and real-time PCR analysis
Total RNA was extracted from human iPSC-FBs and mouse Raw 264-7 cells using the Direct-Zol RNA kit (Zymo Research) according to manufacturer instructions. 500 ng of RNA was converted to cDNA using iScript cDNA synthesis kit (BioRad). For Taqman real-time PCR analysis, 1/50 cDNA was used for quantitative PCR with Taqman Universal PCR master mix (Life Technologies) and the QuantStudio 5 Real-Time PCR System (ThermoFisher Scientific). The Taqman probes and SYBR primers are outlined in the relevant “Tables” section.
Luciferase reporter assays
The human MEOX1 enhancer syntenic to the mouse Meox1 peak9/10 enhancer4 fragment along with the mouse Il1b peak5 and peak6 fragments were PCR amplified and cloned into the XhoI and HindIII sites in the Firefly luciferase plasmid pGL4.23 (Promega) using the Cold Fusion kit (System Biosciences Inc) according to manufacturer instructions. These enhancer-containing plasmids along with pcDNA 3.1-empty vector, pCDNA3.1-Brd4-HA47, GFP-RelA (Plasmid #23255, Addgene), and a Renilla luciferase control plasmid were prepared using the HiSpeed Plasmid Maxi kit (Qiagen). Luciferase assays were conducted using the Dual-Luciferase Reporter Assay System (Promega). HeLa cells were seeded at 70,000 cells per well of a 24-well plate approximately 24 hours prior to transfection. All enhancer plasmids (200 ng) were co-transfected with Renilla control plasmid (20 ng) and either a GFP-RelA (400ng), pCDNA3.1-Brd4-HA (400ng), GFP-RelA (200ng) and pCDNA3.1-Brd4-HA (200ng), or empty vector control (400ng) with 2.4 ul Fugene HD (Promega, E2311) in 43 ul Opti-MEM media (Gibco). Each construct was transfected in three technical replicates and at least 3 biological replicates were performed. Luciferase assays were performed 36 hours after transfection according to manufacturer instructions. Measurements were taken using SpectraMax MiniMax 300 imaging cytometer with SoftMax Pro6, Version 6.4 (Molecular Devices). Firefly luciferase activity was normalized with Renilla luciferase activity.
siRNA transfection of iPSC-FBs
Approximately 8x10⁴ iPSC-CFs were seeded in a 6-well plate the day prior to transfection. Wells that were to be simultaneously stimulated with TGFB/IL1B on the day of transfection were switched to FibroGRO™ Basal Medium with 0.5% FBS while the unstimulated wells were switched to FibroGRO™ Basal Medium with 2% FBS. Cells were transfected with a final concentration of 15 nM siRNA (Sigma, see details in relevant “Tables” section) using 7ul of Lipofectamine™ RNAiMAX transfection reagent (ThermoFisher Scientific) for each well according to the manufacturer instructions. 24 hours after transfection, appropriate wells were treated with TGFB, IL1B, or TGFB+IL1B. Cells were harvested 48-72 hours after stimulation. For RAW 264.7 cells, 8x10⁴ were seeded in 6-well plates the day prior to transfection. Cells were transfected with either 15 nM mouse siRNA (ThermoFisher Scientific) or 15 nM siRNA Control using 7 ul of Lipofectamine™ RNAiMAX transfection reagent (ThermoFisher Scientific) for each well according to the manufacturer instructions. Approximately 24 hours after transfection, LPS stimulation was performed and cells were harvested 6 hours after treatment.
Isolation and culture of mouse bone marrow-derived macrophages (BMDM)
BMDM were isolated from 8-10 week-old male and female heterozygous Cx3cr1GFP knock-in mice (B6.129P2(Cg)-Cx3cr1tm1Litt/J, Jackson Labs #005582) as previously described48. Briefly, animals were anesthetized with isoflurane inhalation to effect. Tibias and femurs were removed, cannulated with a 25g needle, and flushed with sterile DMEM (Fisher Scientific # SH30022FS) containing 10% bovine growth serum (BGS; Fisher Scientific #SH3054103) and 1% penicillin–streptomycin (P/S; VWR #10220-718) to isolate whole bone marrow cells. 4x10⁵ cells were plated and cultured on a 10 cm uncoated Petri plate in DMEM containing 10% bovine growth serum, 1% penicillin–streptomycin, and 50 ng/mL macrophage colony stimulating factor (MCSF; ProSpecBio #CYT-439). A 50% media refresh was performed after 3 days and cells were then split onto assay plates after reaching 70% confluency (days 7-8 post-plating).
LPS stimulation BMDM for conditioned media experiments and gene expression analysis
Passage #1 BMDM grown and differentiated as above were plated overnight on 6-well plates at 0.5x10⁶ cells per well in DMEM containing 10% BGS, 1% P/S and 50 ng/mL MCSF. Cells were then equilibrated for 4 hrs by changing media to low-serum DMEM containing 1% BGS, 1% P/S and no MCSF. BMDM were then treated for 24 hrs with 100 ng/mL lipopolysaccharide (LPS; Invivogen #tlrl-3pelps), followed by addition of 2mM ATP along with 10 ng/mL of either anti-mouse/rat IL-1β neutralizing antibody (Invivomab #BE0246, Lot #745620M2) or IgG control antibody (Invivomab #BE0091, Lot #765821F1) for an additional 2 hrs. Media was then collected, centrifuged at 500xg for 10 min. at 4°C to remove cell debris, and flash-frozen at −80°C. To assess transcriptional upregulation of Il1b following LPS stimulation in BMDM, passage #1 BMDMs were treated with 100 ng/mL LPS as above. Cells were lysed in 500 uL of TRIzol (Thermo Scientific #15596018 and RNA was extracted via phase separation with bromo-chloro-propane. cDNA was synthesized using a Verso cDNA Synthesis Kit (Thermo Scientific #AB1453B) and semi-quantitative RT-PCR was performed using SYBR Green (Thermo Scientific #A46012) on an Applied Biosystems StepOne Plus thermocycler.
Collagen gel contraction assay
Compressible collagen matrices were prepared in 24-well plates using PureCol EZ Gel Solution (Advanced BioMatrix #5074) by incubating at 37°C for 1.5 hrs. Induced pluripotent stem cell-derived cardiac fibroblasts (iPSC-CFs) suspended in serum-supplemented growth serum (FibroGRO™ Basal Medium [Millipore #SCMF-BM] with 2% Hyclone™ Fetal Bovine Serum [FBS; Fisher #SH30071.02]) were seeded (25,000 cells/gel) on the collagen gels for 24 hrs. Cells were either transferred to low-serum media (FibroGRO™ with 0.5% FBS) and stimulated with 5 ng/mL Transforming Growth Factor-β (TGFB; Fisher #50-725-143) and 10 ng/mL Interleukin-1β (IL1B), or alternatively, treated with undiluted BMDM conditioned media described above. Alternatively, for collagen contraction experiments in which cells were transfected with siRNAs, iPSC-CFs were seeded (50,000 cells/gel) on collagen gels for 24 hrs, transfected with siRNAs targeting MEOX1 or IL1R1 (or scrambled control) in low-serum media using Lipofectamine™ RNAiMAX transfection reagent as described above overnight, followed by media replacement and stimulation with TGFB and IL1B. Collagen gels were released from the walls of the well, and images were acquired every 24 hrs for up to 120 hrs. Gel area for each well was determined using ImageJ software and data are reported as percent contraction.
Immunofluorescence Staining
iPSC-CF were seeded in 12-well plates containing glass coverslips at a density of 36,000 cells/well for 24 hrs in FibroGRO™ with 2% FBS. Cells were serum-starved in FibroGRO™ with 0.5% FBS and simultaneously stimulated with 5 ng/mL TGFB and 10ng/mL IL1B for 72 hrs. Cells were fixed in 3.7% EM-grade PFA in PBS for 10 mins. Fixed cells were permeabilized in 0.25% Triton-X100 and blocked in PBS containing 0.1% Tween-20, 1% bovine serum albumin (BSA; Akron #AK8905) and 22.52 mg/mL glycine for 30 mins. Cells were incubated with a primary antibodies directed against smooth muscle α-actin (Abcam #ab7817, 1:100) overnight at 4C. Cells were washed and incubated with Alexa Fluor-conjugated secondary antibodies (ThermoFisher) for 1 hr in the dark with 300nM 4’,6-diamidino-2-phenylindole (DAPI). Coverslips were mounted using ProLong™ Diamond Antifade Mountant and allowed to cure overnight prior to imaging on a Keyence BZ-X710 fluorescence microscope.
Bulk RNA sequencing on iPSC-CFs
Total RNA from iPSC-CFs was quantified with a Nanodrop (Thermo scientific). After RNA quality control was determined using an Agilent 2100 bioanalyzer (Agilent Technologies), samples were sent to Novogene Co for sequencing. Samples were sequenced with PE150 on a NovaSeq instrument (Illumina). Bulk RNA-seq raw reads were aligned to the GRCm37 (hg19) genome using the Rsubread aligner49. Rsubread featureCounts was used to quantify the number of reads per feature of Ensembl hg19 gene annotation file. For differential gene expression analysis, genes with <2 counts per million (CPM) in less than 50% of samples were removed. For analyses using all genes, no cpm filter was applied. EdgeR50 calcNormFactors was used to calculate library size normalization factors. The Limma51 “voom” function was used to log2 transform and quantile normalize the CPM matrix. Gene count data was processed to log2 counts per million using the Bioconductor package edgeR (v3.32.1), differential Gene Expression analysis was performed using Limma (v3.46.0)
In vivo antibody-mediated neutralization of IL1B
C57BL/6J mice (Jackson Laboratory, Stock No: 000664) were used to perform TAC and treated with either 500ug of polyclonal Armenian hamster IgG isotype control (Invivomab #BE0091, Lot #765821F1) or anti-IL1B antibody (Invivomab #BE0246, Lot #745620M2) injected intraperitoneally every 3 days for 30 days (500ug for each intraperitoneal injection), starting from the day of the TAC surgeries. At day 30 post-TAC the hearts were isolated and Langendorff perfusion performed. Non-CM cells from both cardiac ventricles were processed for subsequent scRNA-seq.
Statistics and reproducibility
Standard statistical analyses were performed using GraphPad Prism 9. In all figures, the exact p-value is indicated if the p-value is higher than 0.0001. For values lower than 0.001 we indicate P<0.0001. Figure legends include the information of which specific statistical test has been run to calculate significance. In all panels related to cardiac function, gene expression by RT-qPCR, collagen contraction, and aSMA quantification, the means ± SEM are reported in the figures and the number of replicates is indicated as data points in the graphs.
Tables
CRISPR rRNA and HDR template to generate Brd4flag/flag mouse
| gRNA | Sequence | HDR template |
|---|---|---|
| Brd4_crRNA-16 | GTGCCTGGTGAAGAATGTGA | GGGACTTTTTTCTTTCTGTTTAGAGTGCCTGGTGAAGAATGTGATGAGATCACTAGCATGGACTACAAAGACCATGACGGTGATTATAAAGATCATGATATCGATTACAAGGATGACGATGACAAGGGTGGTGGTGGTTCTTCTACGGAGAGCGGCCCTGGGACAAGATTGAGAAATCTGCCAGTAATGGGGGATGGACT |
| Brd4_crRNA+5 | ACTAGCATGTCT ACGGAGAG | (same as above) |
CRISPR guide RNAs to generate Il1b enhancer KO clones
| gRNA name | Location in the peak | Guide RNAs |
|---|---|---|
| Il1b Peak 1 up | Upstream | CTCACCCAAAATTCACGTGTTGG |
| Il1b Peak 1 ds | Downstream | ATTGTCCTTGATTAGCTGACTGG |
| Il1b Peak 2 up | Upstream | CATGGCGGCTGCGACAGTTGGGG |
| Il1b Peak 2 ds | Downstream | ATTACGGGACTATGCGTCTGTGG |
| Il1b Peak 3 up | Upstream | TCCGTCTAGAGTTTCCCCTCTGG |
| Il1b Peak 3 ds | Downstream | CCCAGGAGTTCTACTAGCCTAGGG |
| Il1b Peak 4 up | Upstream | GACTTTTCGAGATTATGTAATGG |
| Il1b Peak 4 ds | Downstream | CCTGTGACAAGCAATCCCTCGGG |
| Il1b Peak 5 up | Upstream | CCCAGACAACCACTCCTCTCAGG |
| Il1b Peak 5 ds | Downstream | GACATCTCATTCCTCCAAGATGG |
| Il1b Peak 6 up | Upstream | CATCAACCAGGATTGGACGTGGG |
| Il1b Peak 6 ds | Downstream | TGAAATTAACAACGTCCTAGAGG |
| Il1b Peak 7 up | Upstream | ACTGGGCTAGTCCATCTGATTGG |
| Il1b Peak 7 ds | Downstream | ACAACTCAAGGGTCCCCATAGGG |
PCR primers to genotype Il1b enhancer KO clones
| Primers | Forward sequence | Reverse sequence |
|---|---|---|
| Il1b Peakl KO | CCTCATGAGTGTCTCTGTCAGCA | GGGATGGGTCTTCCCACATCAAT |
| Il1b Peak2 KO | GAAAGCAGTGTGAAGCACAACAG | CCCAAAACACCAGGAAAAGTCCAG |
| Il1b Peak3 KO | CCAGGGCATTTTCTGGAGTACTG | GACCCACGTGGTGTGAAGGAG |
| Il1b Peak4 KO | GGCCCCAGGGAGTTTAGAGGT | GCCTGGAAGGAAGAAAGGCCT |
| Il1b Peak5 KO | TTCACAGGGTCCACATTTCA | AAGGCCTGTGCTAAGTCGTC |
| Il1b Peak6 KO | CCTTTTTGGCAGAGTCATCC | TGGACCTGATCAAGACACCA |
| Il1b Peak7 KO | CCCCAATCCCAACACCTGGTT | CGCCATAGTCAAACATCAGGT |
| Il1b gene promoter | GCTTGATATGGCCAAGAGACTTGGT | CCATAGCTGCTTCAGACACCTGT |
qPCR SYBR probes
| Primers | Forward sequence | Reverse sequence |
|---|---|---|
| Brd4 | CCTCATGAGTGTCTCTGTCAGCA | GGGATGGGTCTTCCCACATCAAT |
| Il1b | TTGACGGACCCCAAAAGAT | AGCTGGATGCTCTCATCAGG |
qPCR TaqMan probes
| Gene | Ref# (Applied Biosystems) |
|---|---|
| GAPDH | Hs02786624 |
| p65/RELA | Hs01042014 |
| MEOX1 | Hs00244943 |
| Il1b | Mm00434228_m1 |
siRNAs
| Target gene | Sigma # |
|---|---|
| Negative control | 4390844 |
| p65/RELA | SASI_HS01_00171092 |
| II1R1 | SASI_Hs01_00038965 |
| MEOX1 | SASI_Hs01_00080295 |
Extended Data
Extended Data Fig. 1: Single-cell RNA-seq in heart failure with BET inhibition identifies a highly dynamic Cx3cr1-expressing monocyte/macrophage subpopulation.

A. scRNA-seq expression Feature Plots of cell population markers in non-CM cells. B. Expression Dot Plot of the 24 most positively-correlated genes with LV ejection fraction in Sham, TAC, and TAC JQ1. C,D. UMAP plots of myeloid cells colored by cluster (C) and sample identity (D). E. Expression Feature Plots monocyte-derived and resident macrophages in myeloid cells. F. Sample distribution within clusters in myeloid cells. G. Sample distribution of resident macrophages (defined as clusters 0,2,3,4,6) and Ccr2-positive cells (defined as clusters 1 and 5). H,I. Flow cytometry strategy (H) and number of immune cells, monocytes and macrophages (I) obtained from the ventricular tissues of TAC and TAC JQ1 at day 7 post-surgery. I, Data are mean ± s.d. Two-tailed Mann-Whitney U test.
Extended Data Fig. 2: BRD4 in infiltrated but not resident Cx3cr1-expressing cells contributes to heart failure pathogenesis.
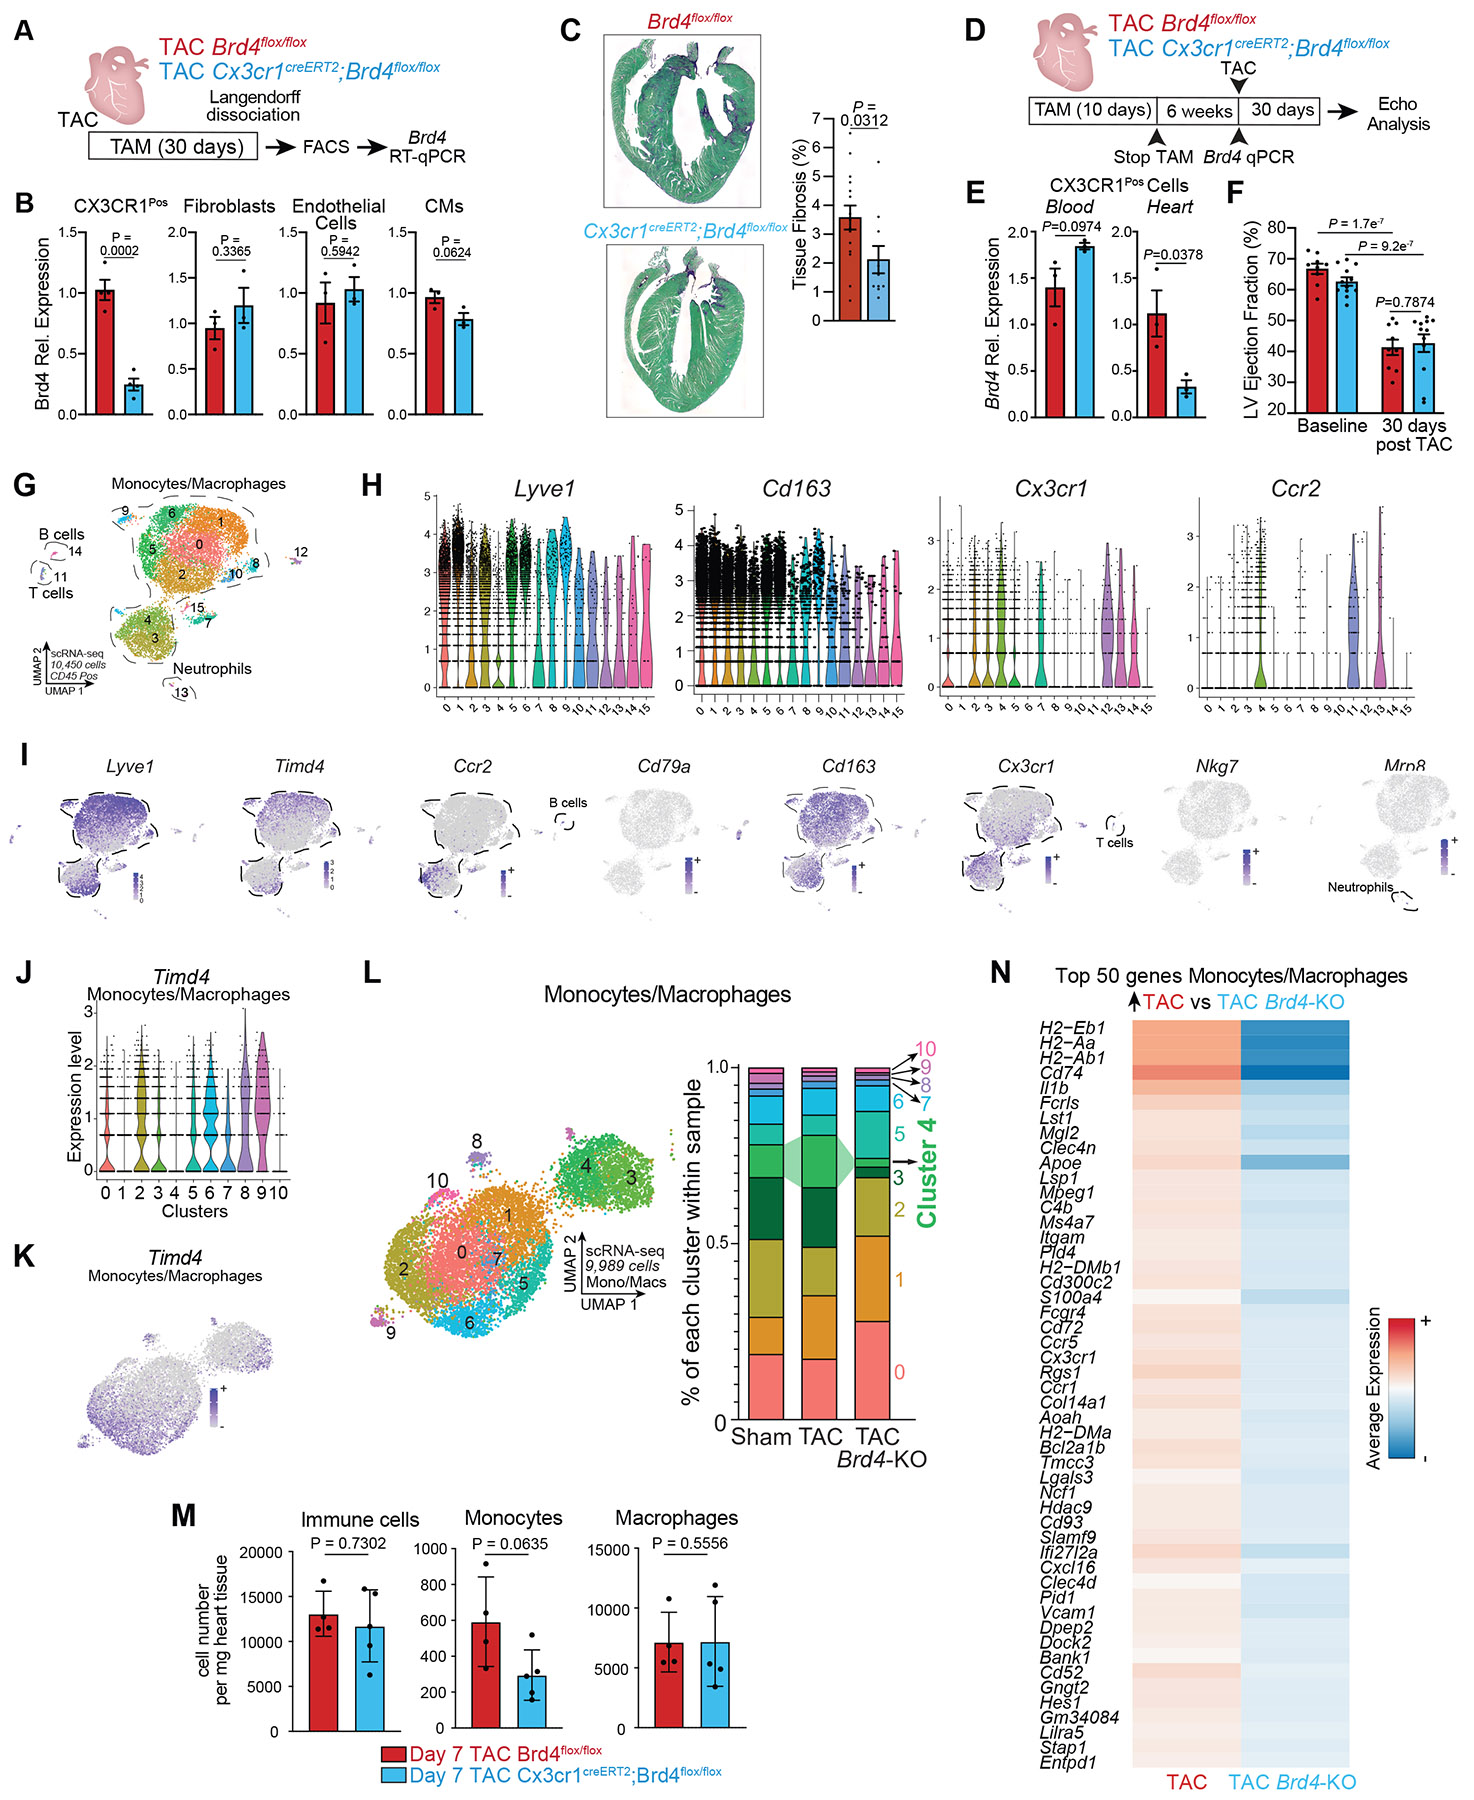
A,B. Schematic of experimental settings of Brd4 deletion in Cx3cr1+ cells with continuous tamoxifen treatment (A), and Brd4 expression measured by qPCR in sorted CX3CR1+, fibroblasts (mEF-SK4+, CD45−, CD31−), endothelial cells (mEF-SK4−, CD45−, CD31+) and in unsorted CMs (B). C. Representative images of Sirius green staining (top) and fibrosis quantification (bottom) between TAC (red) and TAC Brd4-KO (blue). D,E. Schematic of experimental settings of pulsatile tamoxifen (TAM) treatment, which allows for Brd4 deletion specifically in Cx3cr1+ cardiac resident macrophages (D) and Brd4 expression measured by qPCR in blood and cardiac sorted CX3CR1+ cells (E). F. LV ejection fraction quantified by echocardiography in Brd4flox/flox and Cx3cr1CreERT2;Brd4flox/flox littermates. Only Cx3cr1+ resident macrophages have downregulation of Brd4 in this experiment. G. UMAP plot of CD45+ cells colored by cluster identity. H. Expression Violin Plots of monocyte/macrophage markers in CD45+ cells. I. Expression Feature Plots of immune cell markers in CD45+ cells. J,K. Expression of Timd4 by clusters (J) and in UMAP plot (K) in monocytes/macrophages. L. UMAP plot of monocytes/macrophages colored by cluster (left) and cluster composition within samples (right). Changes in cluster 4 are highlighted. M. Flow cytometry analysis of immune cells, monocytes and macrophages obtained from the ventricular tissues of Brd4flox/flox and Cx3cr1CreERT2;Brd4flox/flox littermates. N. Heatmap of expression depicting the top 50 genes upregulated in TAC versus TAC Brd4-KO in the monocyte/macrophage population.
Data are mean ± s.e.m (B,C,E,F) and ± s.d. (M). Unpaired, two-tailed Student’s t-test (B,C,E), one-way ANOVA followed by Tukey post hoc test (F). Two-tailed Mann-Whitney U test (M).
Extended Data Fig. 3: Decreased profibrotic signature in fibroblasts with Brd4 deletion in Cx3cr1-expressing monocytes/macrophages.

A. Expression Feature Plots of cell population markers in nuclei from cardiac tissue. B. Expression of Brd4 in TAC and TAC Brd4-KO across all clusters. C. UMAP plot of fibroblasts colored by cluster sample identity. D. Expression Feature Plot of Brd4 in fibroblasts. E. UMAP plot of fibroblasts colored by cluster identity. F. Expression Violin Plots of profibrotic markers across clusters in fibroblasts. G. Expression Feature Plots of profibrotic markers in fibroblasts. H. Sample distribution within fibroblast clusters. I. Heatmap of expression depicting the top 50 genes upregulated in TAC versus TAC Brd4-KO in fibroblasts. J. Heatmap indicating significance (−log10(p–val)) for indicated GO terms in genes upregulated in TAC vs TAC Brd4-KO (left, in red) or upregulated in TAC Brd4-KO vs TAC (right, in blue) in fibroblasts. K. Venn diagram comparing the genes upregulated in fibroblasts in TAC versus TAC+JQ1 (from Fig. 1 analysis) and those upregulated in TAC vs TAC Brd4-KO (from Fig. 2 analysis).
Extended Data Fig. 4: Changes in fibroblast chromatin accessibility with Brd4 deletion in Cx3cr1-expressing monocytes/macrophages.
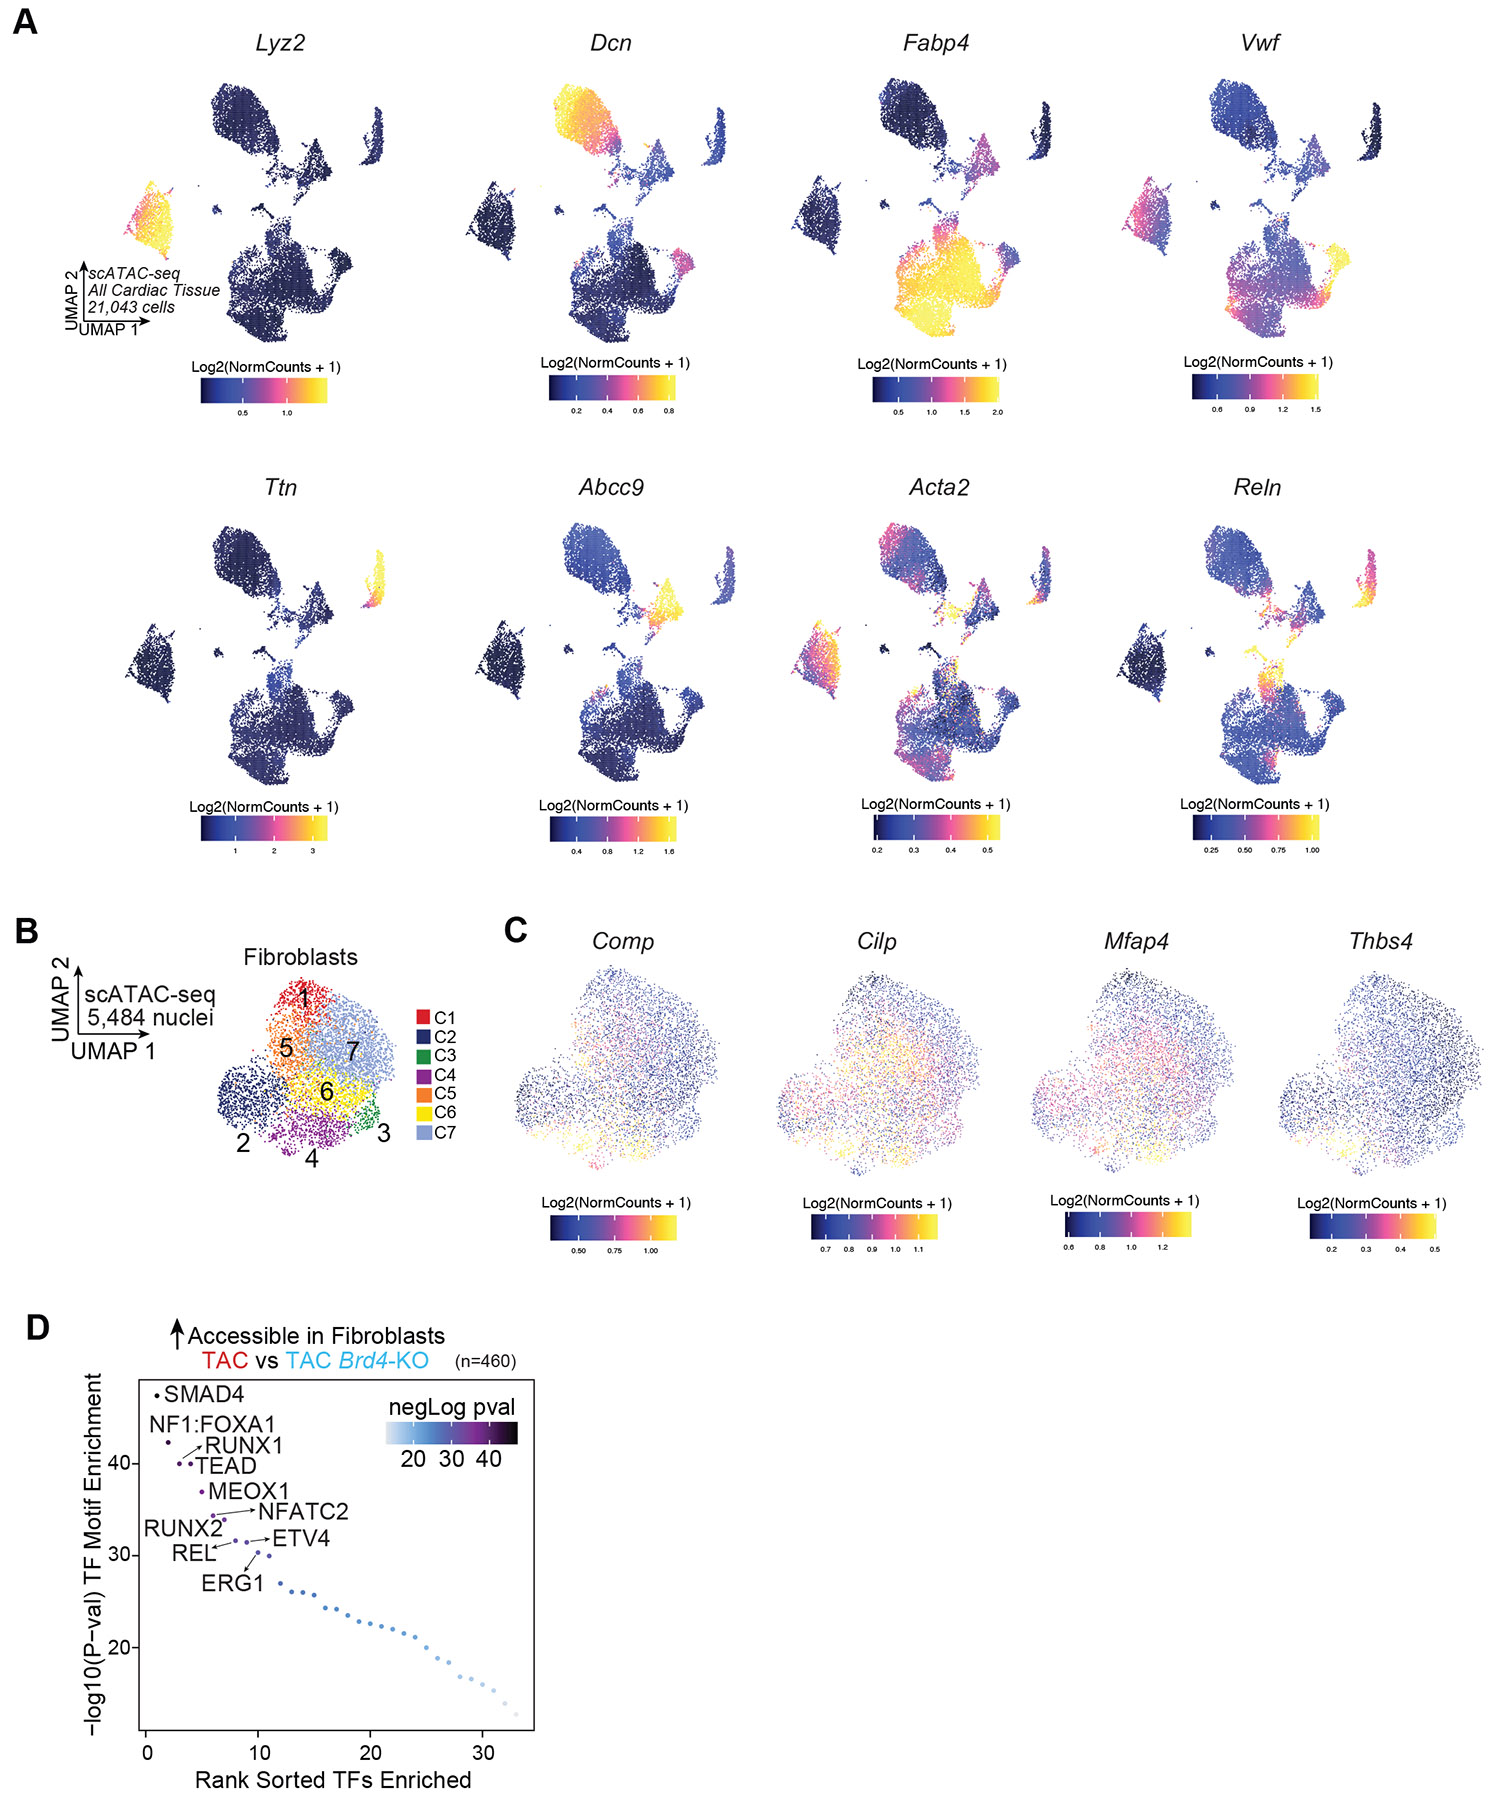
A. Chromatin accessibility gene score of cell population markers across nuclei from cardiac tissue. B. UMAP plot (scATAC-seq) of fibroblasts colored by cluster identity. C. Chromatin accessibility gene score of Comp, Cilp, Mfap4 and Thbs4 in fibroblasts. D. TF motif enrichment of fibroblast chromatin regions more accessible in TAC versus TAC Brd4-KO. Top 10 motifs are highlighted. A hypergeometric test was used to calculate p-values.
Extended Data Fig. 5: Identification of monocyte/macrophage population with single-cell ATAC-seq.

A. UMAP plot (scATAC-seq) of CD45+ cells colored by cluster, the clusters encompassing the monocyte/macrophage populations are highlighted. B. Chromatin accessibility gene score of monocyte/macrophage markers in CD45+ cells. C. UMAP plot (scATAC-seq) of monocytes/macrophages colored by cluster identity. D. Monocyte/macrophage cluster distribution within samples.
Extended Data Fig. 6: Chromatin accessibility and BRD4 occupancy in Cx3cr1-expressing cells identifies set of highly dynamic monocyte/macrophage distal elements in heart failure.

A. Distribution of accessibility in monocytes/macrophages in the TAC state identifies a class of distal regions (super-enhancers (SE)) for which the accessibility falls over the inflection point of the curve. B. Volcano plot depicting p65/RELA binding in all differentially expressed genes between TAC and TAC Brd4-KO (Log2FC>0.125 or Log2FC<−0.125; FDR<0.05) in monocytes/macrophages. C. Schematic of the targeting strategy to generate the Brd4 3xFlag mouse. D. Western blot showing WT and 3xFLAG knock-in bands in WT and Brd4flag/+ animals. E. Liver tissue western blot showing expression of endogenous long and short BRD4 isoforms treated with vehicle or with the small-molecule BET protein degrader dBET152. F. Coverage from anti-FLAG Cut&Run in Sham and TAC identifies regions enriched with BRD4 in stress (left) or at baseline (right). G. Genes that are upregulated in TAC Brd4-KO vs TAC in monocytes/macrophages (from Figure 2 analysis) categorized by BRD4 binding in TAC. H. Examples of BRD4-dependent genes that display dynamic BRD4 recruitment in TAC in sorted Cx3cr1-positive cells. I. LogFC of BRD4 binding by CUT&RUN in TAC vs Sham at the super enhancers identified in the monocyte/macrophage population. J. Coverage from anti-FLAG CUT&RUN in Sham and TAC in selected ten super enhancer regions.
Extended Data Fig. 7: BRD4-dependent regulation of the Il1b super enhancer in heart failure.

A. Schematic of the Il1b super enhancer locus displaying the 7 distal regions (Peak1 to Peak7) called as accessible peaks in scATAC-seq in monocytes/macrophages. B. Chromatin accessibility trend between samples (mean and 95% confidence interval) in all identified Il1b super-enhancer peaks. C. Schematic of the Il1b locus displaying the location of the gRNAs used to delete the 7 distal regions (Peak1 to Peak7). D,E. Agarose gel electrophoresis to assess distal peak deletions in Il1b locus (D) and unaffected region around Il1b promoter (E) (1813bp) in WT and KO clones.
Extended Data Fig. 8: Chromatin accessibility in human myeloid cells.

A. Chromatin accessibility gene score of TIMD4, LYVE1 and CCR2 in human cardiac myeloid cells30. B. Dot Plot indicating significance (−log10(p–val)) for indicated GO terms across human myeloid cell clusters.
Extended Data Fig. 9: IL1B synergizes with TGFB to drive profibrotic function of human induced pluripotent stem cell (iPSC) derived cardiac fibroblast.

A. UMAP plot (snRNA-seq) of nuclei from cardiac tissue colored by cluster identity. B. Expression Feature Plot of Il1r1 in nuclei from cardiac tissue. Fibroblasts are highlighted. C. Protocol to generate human induced pluripotent cardiac fibroblasts (iPSC-CFs). D. Immunofluorescence staining of αSMA (left) in Unstimulated iPSC-CFs or treated with IL1B, TG-B or TGFB+IL1B. Nuclei are marked by Hoechst. Scale bars, 200 μm. Right, quantification of αSMA staining. E. Images (left) and quantification (right) of iPSC-CFs seeded on compressible collagen gel matrices in unstimulated or with IL1B, TGFB or TGFB+IL1B treatments. F. IL1R1 expression by qPCR in Unstimulated human iPSC-CFs with control or IL1R1-targeting siRNAs. G-J. Representative images (G) and quantification of human iPSC-CFs seeded on compressible collagen gel matrices comparing unstimulated cells with IL1B-treated (H), TGFB-treated (I) or TGFB+IL1B-treated (J) using a control or IL1R1-targeting siRNAs. K. Il1b expression by qPCR in Unstimulated and LPS treated RAW264-7 macrophages. L. MEOX1 expression by qPCR in Unstimulated human iPSC-CFs with control or MEOX1-targeting siRNAs. M,N,O. Representative images (M) and quantification of human iPSC-CFs seeded on compressible collagen gel matrices comparing unstimulated cells with L1B-treated (N) and TGFB-treated (O) using a control or MEOX1-targeting siRNAs. P. Human MEOX1 locus showing H3K27Ac in unstimulated iPS-CFs. The syntenic region of the mouse Meox1 Peak9/10 regulatory element4 is highlighted and the six p65/RELA motifs within the region indicated. Q. MEOX1 expression by qPCR in Unstimulated iPSC-CFs or treated with IL1B, TGFB, or TGFB+IL1B with vehicle or JQ1. R. p65/RELA expression by qPCR in Unstimulated iPSC-CFs or treated with IL1B, TGFB or TGFB+IL1B with control or p65/RELA-targeting siRNAs. D-F,H-L,N,O,Q,R. Data are mean ± s.e.m. One-way (D,Q,R) and Two-way (E,H-J,N,O) ANOVA followed by Tukey post hoc test. Unpaired, two-tailed Student’s t-test (F,K,L).
Extended Data Fig. 10: In vivo antibody-mediated IL1B neutralization decreases tissue fibrosis and profibrotic gene expression in fibroblasts.

A. Representative images of Sirius green staining (left) and fibrosis quantification (right) between IgG Ab (red) and Anti-IL1B Ab (blue). B. UMAP plot of non-cardiomyocyte cells colored by cluster. C. Expression Feature Plots of cell population markers in non-cardiomyocyte cell population. D. Expression Feature Plots of Comp, Cilp, Mfap4 and Thbs4 in fibroblasts. E. Expression Violin Plots of Comp, Cilp, Mfap4 and Thbs4 across clusters in fibroblasts. F. Heatmap indicating significance (−log10(p–val)) of top GO terms for each fibroblast cluster. G. Expression Violin Plots of Comp, Cilp, Mfap4 and Thbs4 across samples in fibroblasts. H. Heatmap of expression of the top 50 genes upregulated in TAC IgG Ab versus TAC Anti-IL1B Ab in fibroblasts. I. Heatmap indicating significance (−log10(p–val)) for indicated GO terms in genes upregulated in IgG vs Anti-IL1B (red) or upregulated in Anti-IL1B vs IgG (blue) in fibroblasts. J. Heatmap indicating significance (−log10(p–val)) for indicated GO in genes upregulated or downregulated in fibroblasts clusters 3&5 vs all other clusters. A, Data are mean ± s.e.m. Unpaired, two-tailed Student’s t-test.
Extended Data Fig. 11: Decreased profibrotic signature in fibroblasts with Il1b deletion in Cx3cr1-expressing myeloid cells.

A. Schematic of experimental settings for scRNA-seq from sorted cardiac fibroblasts at day 10 post TAC of Il1bflox/flox (TAC) and Cx3cr1CreERT2;Il1bflox/flox (TAC Il1b-KO) littermates (left). Il1b expression measured by qPCR in cardiac sorted CX3CR1+ cells (right). B. UMAP plot of fibroblast, endothelial, pericytes and smooth muscle cell markers in sorted fibroblasts at day 10 post TAC. C. Expression Violin Plots of profibrotic markers across clusters in sorted fibroblasts. D. Heatmap indicating significance (−log10(p−val)) of top GO terms for each fibroblast cluster. E. Expression Feature Plots of profibrotic markers in sorted fibroblasts. F. Expression Violin Plots profibrotic markers across samples in sorted fibroblasts. G. Heatmap of expression of the top 50 genes upregulated in TAC versus TAC Il1b-KO in sorted fibroblasts. H. Heatmap indicating significance (−log10(p–val)) for indicated GO terms in genes upregulated in TAC vs TAC Il1b-KO (red) or upregulated in TAC Il1b-KO vs TAC (blue) in sorted fibroblasts. A, Data are mean ± s.e.m. Unpaired, two-tailed Student’s t-test.
Extended Data Fig. 12: Comparison of cardiac fibroblast transcription with systemic IL1B inhibition and Il1b deletion in Cx3cr1-expressing cells after TAC.

A,B. UMAP plot generated by merging the fibroblasts from TAC IgG/TAC-Anti IL1B and TAC/TAC Il1b-KO datasets displaying clusters (A) and sample composition (B). C. Sample distribution within clusters in fibroblasts. D,E. Expression Feature plot (D) and violin plot across clusters (E ) of Postn and Meox1 expression. F. Heatmap indicating significance (−log10(p–val)) of top GO terms for each fibroblast cluster. G. Sample distribution of fibroblasts categorized as transcriptionally positive or negative for Postn and Meox1.
Acknowledgments
We thank the Srivastava and the Alexanian laboratories for critical discussions; Rudi Micheletti, Michael G. Rosenfeld, Karin Pelka, Gaia Andreoletti, and Anthony Wong for helpful feedback; we thank Kathryn N. Ivey and Jin Yang at Tenaya Therapeutics for critical discussions and feedback; Jun Qi, Deyao Li and Logan Sigua for kindly providing the JQ1 molecule; we thank Jane Srivastava and all the Gladstone Flow Cytometry Core; we thank the Gladstone Animal Facility for support with mouse colony maintenance and Emanuel Pinteaux for kindly providing the Il1b conditional allele; we thank Kathryn Claiborn and Francoise Chanut for editorial guidance and Ana Catarina Silva for help with figure editing and design.
Sources of Funding
M.A. was supported by the Swiss National Science Foundation (P400PM_186704), Longevity Impetus Grant, and is the Dario and Irina Sattui Investigator at Gladstone. A.P. was supported by the Tobacco-Related Disease Research Program (578649), A.P. Giannini Foundation (P0527061), Michael Antonov Charitable Foundation Inc., Sarnoff Cardiovascular Research Foundation, Frank. A. Campini Foundation, and National Institutes of Health/NHLBI (K08 HL157700). T.N. was supported by the Japan Society for the Promotion of Science Overseas Research Fellowship. R.J. was supported by the Burroughs Wellcome Fund and by National Institutes of Health/NHLBI (R35HL166663). BGT was supported by the American Heart Association Postdoctoral Fellowship (18POST34080175) and American Heart Association/Children’s Heart Foundation Fellowship (818798). R.J.V. was supported by NIH R01 HL169578. T.A.M. and J.G.T. were supported by the American Heart Association (16SFRN31400013). T.A.M. was supported by NIH R01 HL116848, NIH R01 HL147558, NIH R01 DK119594 and NIH R01 HL150225. J.G.T. was supported by the National Institutes of Health/NHLBI (K99 HL166708). P.F.P and K.S.P. were supported by National Institutes of Health P01 HL098707, U01 HL098179, Gladstone Institutes, and the San Simeon Fund. D.S. was supported by the National Institutes of Health/NHLBI (P01 HL146366, R01 HL057181, R01 HL015100, R01 HL127240), Roddenberry Foundation, L.K. Whittier Foundation, Dario and Irina Sattui, Younger Family Fund, and Additional Ventures. D.S. and T.A.M. are supported by the National Institutes of Health R01 HL127240.
Footnotes
Disclosures
D.S. is scientific co-founder, shareholder and director of Tenaya Therapeutics. S.M.H. is an executive, officer, and shareholder of Amgen, Inc. and is a scientific co-founder and shareholder of Tenaya Therapeutics. T.A.M. received funding from Italfarmaco for an unrelated project. K.S.P. is a shareholder of Tenaya Therapeutics.
Data availability
All source data, including sequencing reads and single-cell expression matrices have been deposited in the NCBI’s Gene Expression Omnibus under accession number GSE221699.
References
- 1.Badeaux AI & Shi Y Emerging roles for chromatin as a signal integration and storage platform. Nat. Rev. Mol. Cell Biol 14, 211–224 (2013). [DOI] [PMC free article] [PubMed] [Google Scholar]
- 2.Buechler MB et al. Cross-tissue organization of the fibroblast lineage. Nature 593, 575–579 (2021). [DOI] [PubMed] [Google Scholar]
- 3.Wang N, Wu R, Tang D & Kang R The BET family in immunity and disease. Signal Transduct Target Ther 6, 23 (2021). [DOI] [PMC free article] [PubMed] [Google Scholar]
- 4.Alexanian M. et al. A transcriptional switch governs fibroblast activation in heart disease. Nature vol. 595 438–443 Preprint at 10.1038/s41586-021-03674-1 (2021). [DOI] [PMC free article] [PubMed] [Google Scholar]
- 5.Filippakopoulos P. et al. Selective inhibition of BET bromodomains. Nature 468, 1067–1073 (2010). [DOI] [PMC free article] [PubMed] [Google Scholar]
- 6.Anand P. et al. BET bromodomains mediate transcriptional pause release in heart failure. Cell 154, 569–582 (2013). [DOI] [PMC free article] [PubMed] [Google Scholar]
- 7.Spiltoir JI et al. BET acetyl-lysine binding proteins control pathological cardiac hypertrophy. J. Mol. Cell. Cardiol 63, 175–179 (2013). [DOI] [PMC free article] [PubMed] [Google Scholar]
- 8.Duan Q. et al. BET bromodomain inhibition suppresses innate inflammatory and profibrotic transcriptional networks in heart failure. Science Translational Medicine vol. 9 Preprint at 10.1126/scitranslmed.aah5084 (2017). [DOI] [PMC free article] [PubMed] [Google Scholar]
- 9.Antolic A. et al. BET bromodomain proteins regulate transcriptional reprogramming in genetic dilated cardiomyopathy. JCI Insight 5, (2020). [DOI] [PMC free article] [PubMed] [Google Scholar]
- 10.Auguste G. et al. BET bromodomain inhibition attenuates cardiac phenotype in myocyte-specific lamin A/C-deficient mice. J. Clin. Invest 130, 4740–4758 (2020). [DOI] [PMC free article] [PubMed] [Google Scholar]
- 11.Padmanabhan A. et al. BRD4 (Bromodomain-Containing Protein 4) Interacts with GATA4 (GATA Binding Protein 4) to Govern Mitochondrial Homeostasis in Adult Cardiomyocytes. Circulation 142, 2338–2355 (2020). [DOI] [PMC free article] [PubMed] [Google Scholar]
- 12.Korf-Klingebiel M. et al. Myeloid-Derived Growth Factor Protects Against Pressure Overload–Induced Heart Failure by Preserving Sarco/Endoplasmic Reticulum Ca 2 -ATPase Expression in Cardiomyocytes. Circulation vol. 144 1227–1240 Preprint at 10.1161/circulationaha.120.053365 (2021). [DOI] [PubMed] [Google Scholar]
- 13.Reboll MR et al. EMC10 (Endoplasmic Reticulum Membrane Protein Complex Subunit 10) Is a Bone Marrow–Derived Angiogenic Growth Factor Promoting Tissue Repair After Myocardial Infarction. Circulation vol. 136 1809–1823 Preprint at 10.1161/circulationaha.117.029980 (2017). [DOI] [PubMed] [Google Scholar]
- 14.Dobaczewski M, Xia Y, Bujak M, Gonzalez-Quesada C & Frangogiannis NG CCR5 signaling suppresses inflammation and reduces adverse remodeling of the infarcted heart, mediating recruitment of regulatory T cells. Am. J. Pathol 176, 2177–2187 (2010). [DOI] [PMC free article] [PubMed] [Google Scholar]
- 15.Dick SA et al. Self-renewing resident cardiac macrophages limit adverse remodeling following myocardial infarction. Nat. Immunol 20, 29–39 (2019). [DOI] [PMC free article] [PubMed] [Google Scholar]
- 16.Dick SA et al. Three tissue resident macrophage subsets coexist across organs with conserved origins and life cycles. Sci Immunol 7, eabf7777 (2022). [DOI] [PubMed] [Google Scholar]
- 17.Nahrendorf M. et al. The healing myocardium sequentially mobilizes two monocyte subsets with divergent and complementary functions. J. Exp. Med 204, 3037–3047 (2007). [DOI] [PMC free article] [PubMed] [Google Scholar]
- 18.Epelman S. et al. Embryonic and adult-derived resident cardiac macrophages are maintained through distinct mechanisms at steady state and during inflammation. Immunity 40, 91–104 (2014). [DOI] [PMC free article] [PubMed] [Google Scholar]
- 19.Bajpai G. et al. Tissue Resident CCR2- and CCR2+ Cardiac Macrophages Differentially Orchestrate Monocyte Recruitment and Fate Specification Following Myocardial Injury. Circ. Res 124, 263–278 (2019). [DOI] [PMC free article] [PubMed] [Google Scholar]
- 20.Yona S. et al. Fate mapping reveals origins and dynamics of monocytes and tissue macrophages under homeostasis. Immunity 38, 79–91 (2013). [DOI] [PMC free article] [PubMed] [Google Scholar]
- 21.Pinto AR et al. An abundant tissue macrophage population in the adult murine heart with a distinct alternatively-activated macrophage profile. PLoS One 7, e36814 (2012). [DOI] [PMC free article] [PubMed] [Google Scholar]
- 22.Lee M, Lee Y, Song J, Lee J & Chang S-Y Tissue-specific Role of CX3CR1 Expressing Immune Cells and Their Relationships with Human Disease. Immune Netw. 18, e5 (2018). [DOI] [PMC free article] [PubMed] [Google Scholar]
- 23.Patel B. et al. CCR2+ monocyte-derived infiltrating macrophages are required for adverse cardiac remodeling during pressure overload. JACC Basic Transl. Sci 3, 230–244 (2018). [DOI] [PMC free article] [PubMed] [Google Scholar]
- 24.Revelo XS et al. Cardiac Resident Macrophages Prevent Fibrosis and Stimulate Angiogenesis. Circ. Res 129, 1086–1101 (2021). [DOI] [PMC free article] [PubMed] [Google Scholar]
- 25.Stratton MS et al. Dynamic Chromatin Targeting of BRD4 Stimulates Cardiac Fibroblast Activation. Circ. Res 125, 662–677 (2019). [DOI] [PMC free article] [PubMed] [Google Scholar]
- 26.Heidt T. et al. Differential contribution of monocytes to heart macrophages in steady-state and after myocardial infarction. Circ. Res 115, 284–295 (2014). [DOI] [PMC free article] [PubMed] [Google Scholar]
- 27.Hanna A, Humeres C & Frangogiannis NG The role of Smad signaling cascades in cardiac fibrosis. Cell. Signal 77, 109826 (2021). [DOI] [PMC free article] [PubMed] [Google Scholar]
- 28.Whyte WA et al. Master transcription factors and mediator establish super-enhancers at key cell identity genes. Cell 153, 307–319 (2013). [DOI] [PMC free article] [PubMed] [Google Scholar]
- 29.Link VM et al. Analysis of Genetically Diverse Macrophages Reveals Local and Domain-wide Mechanisms that Control Transcription Factor Binding and Function. Cell 173, 1796–1809.e17 (2018). [DOI] [PMC free article] [PubMed] [Google Scholar]
- 30.Kuppe C. et al. Spatial multi-omic map of human myocardial infarction. Nature 608, 766–777 (2022). [DOI] [PMC free article] [PubMed] [Google Scholar]
- 31.Liu T, Zhang L, Joo D & Sun S-C NF-κB signaling in inflammation. Signal transduction and targeted therapy 2, 1–9 (2017). [DOI] [PMC free article] [PubMed] [Google Scholar]
- 32.Lighthouse JK et al. Exercise promotes a cardioprotective gene program in resident cardiac fibroblasts. JCI Insight 4, (2019). [DOI] [PMC free article] [PubMed] [Google Scholar]
- 33.Pinteaux E. et al. Cell-specific conditional deletion of interleukin-1 (IL-1) ligands and its receptors: a new toolbox to study the role of IL-1 in health and disease. J. Mol. Med 98, 923–930 (2020). [DOI] [PMC free article] [PubMed] [Google Scholar]
- 34.Frangogiannis NG Transforming growth factor-β in myocardial disease. Nat. Rev. Cardiol 19, 435–455 (2022). [DOI] [PubMed] [Google Scholar]
- 35.Amrute JM et al. Targeting the immune-fibrosis axis in myocardial infarction and heart failure. bioRxiv (2022) doi: 10.1101/2022.10.17.512579. [DOI] [Google Scholar]
- 36.Ridker PM et al. Antiinflammatory Therapy with Canakinumab for Atherosclerotic Disease. New England Journal of Medicine vol. 377 1119–1131 Preprint at 10.1056/nejmoa1707914 (2017). [DOI] [PubMed] [Google Scholar]
- 37.Everett BM et al. Anti-Inflammatory Therapy With Canakinumab for the Prevention of Hospitalization for Heart Failure. Circulation 139, 1289–1299 (2019). [DOI] [PubMed] [Google Scholar]
- 38.Rhee AJ & Lavine KJ New Approaches to Target Inflammation in Heart Failure: Harnessing Insights from Studies of Immune Cell Diversity. Annu. Rev. Physiol 82, 1–20 (2020). [DOI] [PMC free article] [PubMed] [Google Scholar]
- 39.Yona S. et al. Fate mapping reveals origins and dynamics of monocytes and tissue macrophages under homeostasis. Immunity 38, 1073–1079 (2013). [DOI] [PMC free article] [PubMed] [Google Scholar]
- 40.Li D, Wu J, Bai Y, Zhao X & Liu L Isolation and culture of adult mouse cardiomyocytes for cell signaling and in vitro cardiac hypertrophy. J. Vis. Exp (2014) doi: 10.3791/51357. [DOI] [PMC free article] [PubMed] [Google Scholar]
- 41.Bhattacharyya S, Sathe AA, Bhakta M, Xing C & Munshi NV PAN-INTACT enables direct isolation of lineage-specific nuclei from fibrous tissues. PLoS One 14, e0214677 (2019). [DOI] [PMC free article] [PubMed] [Google Scholar]
- 42.Xie Z. et al. Gene Set Knowledge Discovery with Enrichr. Curr Protoc 1, e90 (2021). [DOI] [PMC free article] [PubMed] [Google Scholar]
- 43.Granja JM et al. ArchR is a scalable software package for integrative single-cell chromatin accessibility analysis. Nat. Genet 53, 403–411 (2021). [DOI] [PMC free article] [PubMed] [Google Scholar]
- 44.Heinz S. et al. Simple combinations of lineage-determining transcription factors prime cis-regulatory elements required for macrophage and B cell identities. Mol. Cell 38, 576–589 (2010). [DOI] [PMC free article] [PubMed] [Google Scholar]
- 45.Padmanabhan A. et al. A genome-wide CRISPR screen identifies BRD4 as a regulator of cardiomyocyte differentiation. Nat. Cardiovasc. Res 3, 317–331 (2024). [DOI] [PMC free article] [PubMed] [Google Scholar]
- 46.Zhang J. et al. Functional cardiac fibroblasts derived from human pluripotent stem cells via second heart field progenitors. Nat. Commun 10, 2238 (2019). [DOI] [PMC free article] [PubMed] [Google Scholar]
- 47.Gonzalez-Teran B. et al. Transcription factor protein interactomes reveal genetic determinants in heart disease. Cell 185, 794–814.e30 (2022). [DOI] [PMC free article] [PubMed] [Google Scholar]
- 48.Vagnozzi RJ et al. An acute immune response underlies the benefit of cardiac stem cell therapy. Nature 577, 405–409 (2020). [DOI] [PMC free article] [PubMed] [Google Scholar]
- 49.Liao Y, Smyth GK & Shi W The R package Rsubread is easier, faster, cheaper and better for alignment and quantification of RNA sequencing reads. Nucleic Acids Res. 47, e47 (2019). [DOI] [PMC free article] [PubMed] [Google Scholar]
- 50.Robinson MD, McCarthy DJ & Smyth GK edgeR: a Bioconductor package for differential expression analysis of digital gene expression data. Bioinformatics vol. 26 139–140 Preprint at 10.1093/bioinformatics/btp616 (2010). [DOI] [PMC free article] [PubMed] [Google Scholar]
- 51.Ritchie ME et al. limma powers differential expression analyses for RNA-sequencing and microarray studies. Nucleic Acids Res. 43, e47 (2015). [DOI] [PMC free article] [PubMed] [Google Scholar]
- 52.Winter GE et al. DRUG DEVELOPMENT. Phthalimide conjugation as a strategy for in vivo target protein degradation. Science 348, 1376–1381 (2015). [DOI] [PMC free article] [PubMed] [Google Scholar]
Associated Data
This section collects any data citations, data availability statements, or supplementary materials included in this article.
Data Availability Statement
All source data, including sequencing reads and single-cell expression matrices have been deposited in the NCBI’s Gene Expression Omnibus under accession number GSE221699.