Abstract
Background
When analyzing protein sequences using sequence similarity searches, orthologous sequences (that diverged by speciation) are more reliable predictors of a new protein's function than paralogous sequences (that diverged by gene duplication). The utility of phylogenetic information in high-throughput genome annotation ("phylogenomics") is widely recognized, but existing approaches are either manual or not explicitly based on phylogenetic trees.
Results
Here we present RIO (Resampled Inference of Orthologs), a procedure for automated phylogenomics using explicit phylogenetic inference. RIO analyses are performed over bootstrap resampled phylogenetic trees to estimate the reliability of orthology assignments. We also introduce supplementary concepts that are helpful for functional inference. RIO has been implemented as Perl pipeline connecting several C and Java programs. It is available at http://www.genetics.wustl.edu/eddy/forester/. A web server is at http://www.rio.wustl.edu/. RIO was tested on the Arabidopsis thaliana and Caenorhabditis elegans proteomes.
Conclusion
The RIO procedure is particularly useful for the automated detection of first representatives of novel protein subfamilies. We also describe how some orthologies can be misleading for functional inference.
Background
Accurate computational protein function analysis is an important way of extracting value from primary sequence data. Due to the large amount of data, automated systems seem unavoidable (at least for initial, prioritizing steps). Such efforts are complicated, for a variety of reasons. Many proteins belong to large families, as suggested by Dayhoff [1]. Such families are often composed of subfamilies related to each other by gene duplication events. For example, Ingram [2] showed that human α, β, and γ chains of hemoglobins are related to each other by gene duplications. Gene duplication allows one copy to assume a new biological role through mutation, while the other copy preserves the original functionality [3,4]. Hence, subfamilies often differ in their biological functionality yet still exhibit a high degree of sequence similarity.
Other complications in functional analysis include: ignoring the multi-domain organization of proteins; error propagation caused by transfer of information from previously erroneously annotated sequences; insufficient masking of low complexity regions; and alternative splicing [5].
Typically, automated sequence function analysis relies on pairwise sequence similarity and programs such as BLAST [6] or FASTA [7]. Annotating a sequence by transferring annotation from its most similar sequence(s) tends to produce overly specific annotation. In contrast, analyses using profile search algorithms such as HMMER http://hmmer.wustl.edu/ and Pfam [8] classify sequences too generally. They recognize that a query sequence belongs to a certain family (or, to be more precise, indicate which domain(s) the query is likely to contain), but do not subclassify the sequence.
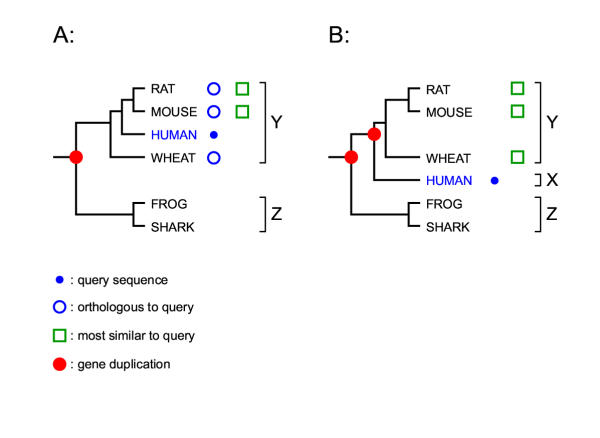
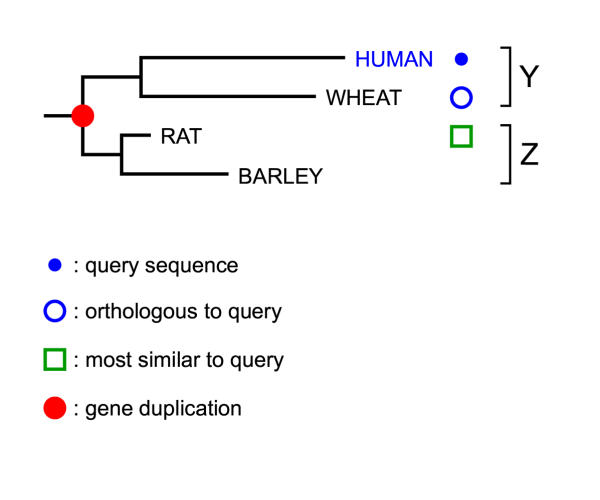
At least two scenarios can cause misleading predictions when using pairwise sequence similarity alone for annotation: (i) not having a known annotated representative of the correct subfamily because incomplete sequence databases and/or gene loss (Figure 1), and (ii) unequal rates of evolution (Figure 2). The case of trying to annotate the first (or only) representative of a novel subfamily is of particular interest. Pairwise similarity based methods alone cannot recognize that a new sequence does not belong in any currently known subfamily (e.g. "orphan" G-protein coupled receptors), because every sequence is most similar to something. In contrast, when constructing a phylogenetic tree, this case is easy to observe (as illustrated in Figure 1). A human annotator can use phylogenetic tree analysis to place a new sequence in the subfamily structure of a gene tree of known sequences. This approach was called "phylogenomics" by Eisen [9]. It would be desirable to automate this procedure, but the best automated methods for subfamily annotation, such as the COGs database [10], are clustering methods that do not directly use phylogenetic analysis.
Figure 1.
Over annotation due to database bias or gene loss under equal rates of evolution Species harboring the sequences are indicated. Two cases are depicted. In A, the query sequence belongs to the "Y" subfamily which can be correctly inferred by both sequence similarity and phylogenetic tree based methods (in situation A, the query is most similar to "Y" of rat and mouse). In short, in situation A, orthology and "most similar" do (partially) overlap. In B, a situation is depicted where the query is actually a member of a third subfamily "X" but this can only be inferred by considering the evolutionary history of this sequence family. Sequence similarity based methods would misleadingly indicate that this query belongs to "Y" since it is most similar to "Y" in rat, mouse and wheat. In short, in situation B, orthology and "most similar" do not correspond. Observe that if there would have been already members of "X" in the database (no gene loss and complete sampling) the query in B could have been correctly determined to belong to a "X" subfamily (under equal rates of evolution).
Figure 2.
Over annotation due to unequal rates of evolution Sequence similarity based methods would indicate that the query is a member of the "Z" subfamily. Phylogenetic tree based methods correctly identify it as a member of subfamily "Y".
It is infeasible to completely automate functional analysis, because it is impossible to precisely define what protein "function" means. However, a principle of phylogenomics is that orthologous sequences (that diverged by speciation) are more likely to conserve protein function than paralogous sequences (that diverged by gene duplication). Orthology and paralogy are well defined and can be inferred from gene and species trees. One useful and automatable phylogenomics approach would be as follows: if a novel sequence has orthologs, annotation can be transferred from them (as in best BLAST analysis); if there are no orthologs, the sequence is classified as just a family member (as in Pfam/InterPro analysis) and flagged as possibly the first representative of a novel subfamily. At the core of such approaches stands therefore the distinction between orthologs and paralogs, and hence the ability to discriminate between duplication and speciation events on a gene tree. Various efficient algorithms to infer gene duplications on a gene tree by comparing it to a species tree have been described (for example: by Eulenstein [11], and by Zhang [12]). We developed a simple algorithm (named SDI for Speciation Duplication Inference) that appears to solve this problem even more efficiently on realistic data sets, though it has an asymptotic worst-case running time that is less favorable [13].
In practice, phylogenetic trees are unreliable. Errors in trees will produce spurious inferred duplications. This is obviously problematic if duplications are to be used as indicators of potential functional changes. Therefore, instead of determining the orthologs of a query sequence on just one gene tree, inference could be performed over bootstrap resampled gene trees [14,15] to estimate of the reliability of the assignments. Here we describe and test a procedure – RIO (for Resampled Inference of Orthologs) – which allows to perform such analyses in an automated fashion. We present results of using RIO to analyze a plant (A. thaliana[16]) and an animal (the nematode C. elegans[17]) proteome.
Algorithm
Definitions
Orthologs are defined as two genes that diverged by a speciation event. Paralogs are defined as two genes that diverged by a duplication event [18]. Other concepts derived from gene trees can be useful for functional prediction. We introduce and justify three such concepts ("super-orthologs", "ultra-paralogs", and "subtree-neighbors"):
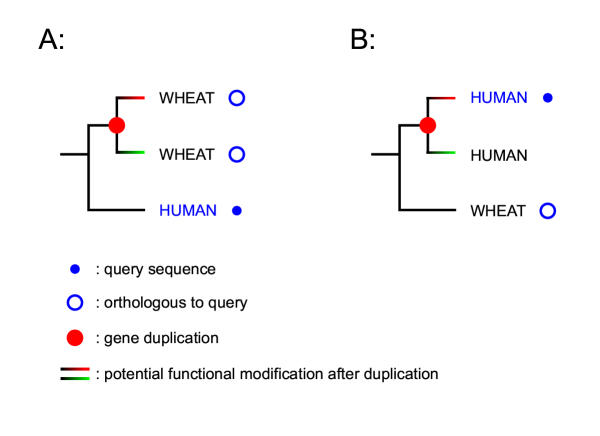
Careless use of orthology relationships without examining the tree itself can lead to incorrect annotations. In the example shown in Figure 3A, the human query sequence has two orthologous sequences in wheat. These two wheat sequences are related to each other by a gene duplication and one (or even both) of them might have undergone functional modification after their divergence. Given a procedure that gave a list of orthologues for the human gene query, such situations should be revealed by only partial (or complete absence of) agreement between the annotations of the wheat orthologs. Now consider the situation in Figure 3B. This is trickier, since in this case only one ortholog will be reported for the query sequence, but it will be just as dangerous to transfer annotation. We do not attempt to solve this problem (the solution is careful manual analysis of the gene tree) but an automated procedure can warn that this situation might be present. For this purpose we introduce the concept of "super-orthologs":
Figure 3.
The reasons for introducing super-orthologs Examples of how inferring the biological role of a query sequence by simply transferring functional annotation from a orthologous sequence might lead to inaccuracies. These potential pitfalls lead us to introduce the concept of super-orthologs (Definition 1).
Definition 1. Given a rooted gene tree with duplication or speciation assigned to each of its internal nodes, two sequences are super-orthologous if and only if each internal node on their connecting path represents a speciation event.
Hence, the query sequences in Figure 3 have no super-orthologs. In contrast, the rat, mouse, and wheat sequences in Figure 1A are super-orthologs pf the human query sequence. By definition, the super-orthologs of a given sequence are a subset of its orthologs.
Certain sequences underwent multiple recent duplications, resulting in large species specific sequence families, such as the C. elegans seven-transmembrane proteins acting as odorant and chemosensory receptors [19,20]. For query sequences belonging to such sequence families, orthologs (if present) are less effective for predicting specific information. In these cases, paralogs of the same (sub) family might be more informative for functional prediction (as long as the duplications indeed happened "late" in evolutionary times). To formalize this, we introduce the concept of "ultra-paralogs":
Definition 2. Given a rooted gene tree with duplication or speciation assigned to each of its internal nodes, two sequences are ultra-paralogous if and only if the smallest subtree containing them both contains only internal nodes representing duplications.
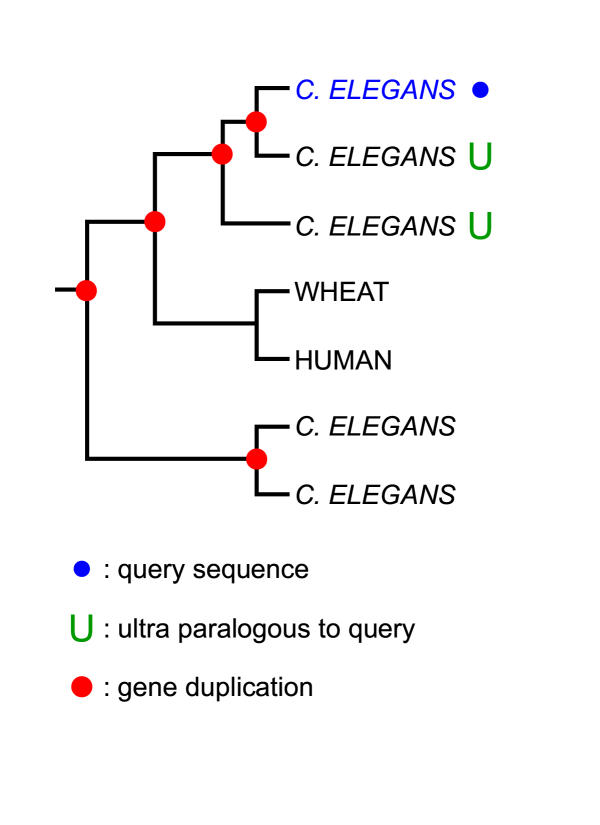
Figure 4 illustrates the concept of ultra-paralogs. It follows from definition 2 that two ultra-paralogous sequences must occur in the same species.
Figure 4.
An example of ultra-paralogous sequences
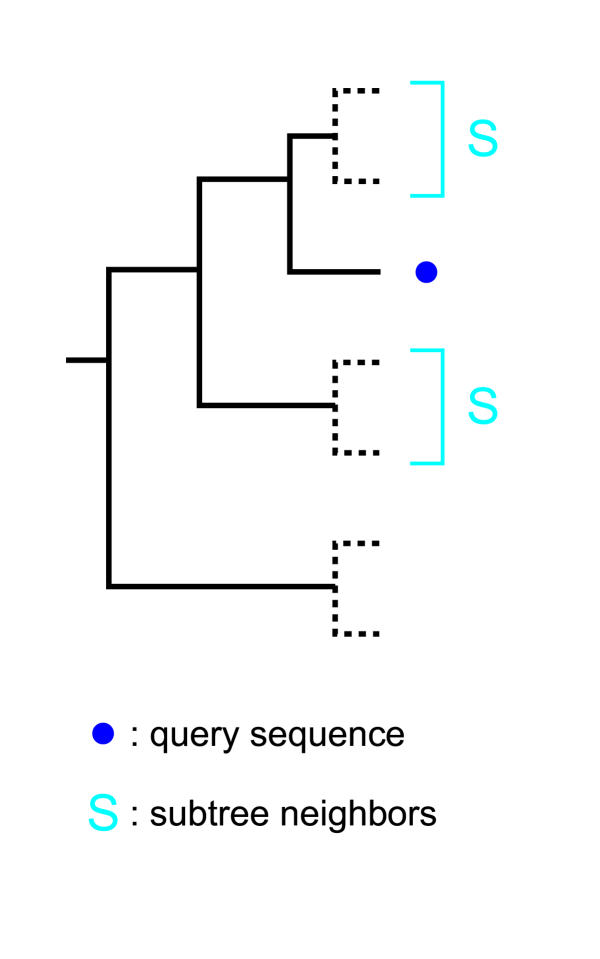
Often, researchers construct a gene tree and then informally use "subtrees" (clades) to make inferences about sequences (without regard to duplications and speciations). We introduce this concept into our procedure as well, formalized as "subtree-neighbors" (illustrated in Figure 5):
Figure 5.
An illustration of subtree-neighbors The dotted subtrees could either be just one external node or a subtree of arbitrary size and topology. Species information is of no consequence for the concept of subtree-neighbors. The subtree-neighbors depicted here are for the default of k = 2.
Definition 3. Given a completely binary and rooted gene tree, the k-subtree-neighbors of a sequence q are defined as all sequences derived from the k-level parent node of q, except q itself (the level of q itself is 0, q's parent is 1, and so forth).
Subtree-neighbors can be useful if there is (partial) agreement among their annotations (for example: if the subtree-neighbors of a query are NAD+-dependent isocitrate dehydrogenase and NADP+-dependent isocitrate dehydrogenase we can suppose that the query is likely to be a isocitrate dehydrogenase, but it is not possible to determine whether it is dependent on NAD+ or NADP+). If the subtree-neighbors lack any agreement in their annotations a useful inference is not possible (see [9] for a more detailed discussion). Furthermore, orthologs that are not also subtree-neighbors can be misleading (for a more detailed discussion of this, see below, and see Figures 10 and 11 for examples).
Figure 10.
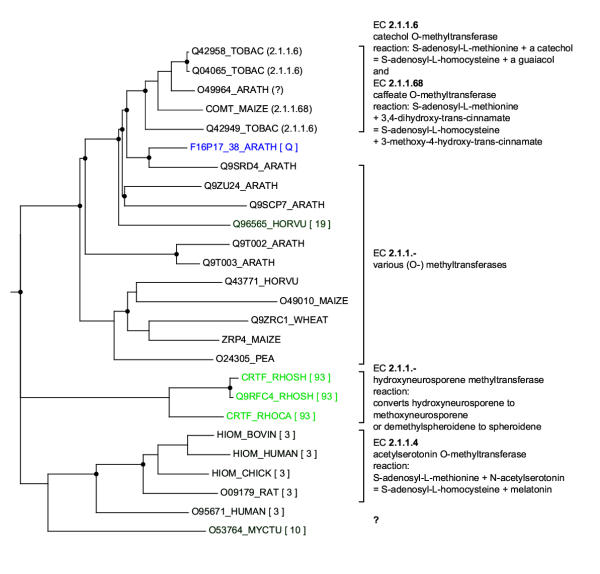
A phylogenetic tree for O-methyltransferases produced by RIO This tree is based on the Pfam alignment Methyltransf_2 (PF00891). It has been constructed in the same manner as the tree in Figure 8. (TOBAC: Nicotiana tabacum, ARATH: Arabidopsis thaliana, MAIZE: Zea mays, HORVU: Hordeum vulgare, WHEAT: Triticum aestivum, PEA: Pisum sativum, RHOSH: Rhodobacter sphaeroides, RHOCA: Rhodobacter capsulatus, BOVIN: Bos taurus, CHICK: Gallus gallus, RAT: Rattus norvegicus, MYCTU: Mycobacterium tuberculosis.). The A. thaliana query sequence F16P17_38 is labeled with Q. The bootstrap orthology values for potential orthologs are indicated in brackets (the brightness of the green color is proportional to this value). The apparent trifurcation at the root is caused by a branch length of 0.0 (the bacterial hydroxyneurosporene methyltransferases subtree and the plant O-methyltransferases subtree are connected by a speciation event). Inferred gene duplication are indicated by circles. According to this tree, F16P17_38 has orthologs only in bacteria.
Figure 11.
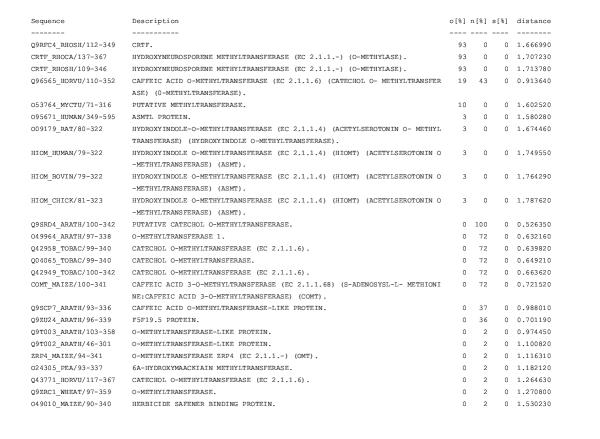
RIO output for the A. thaliana protein F16P17_38 analyzed against the Pfam Methyltransf_2 domain alignment (PF00891) For an explanation of the output see Figure 7. The output is sorted by orthology values. According to this RIO analysis the orthologs of F16P17_38 are bacterial hydroxyneurosporene methyltransferases. These contrast with the subtree-neighbors of F16P17_38 which are all plant O-methyltransferases.
The RIO procedure
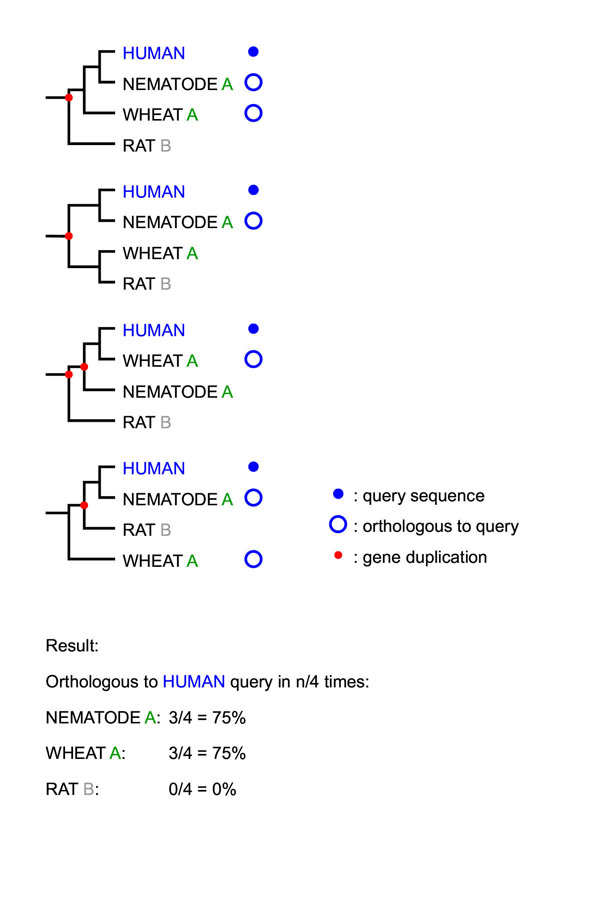
This basic RIO procedure is as follows. For a simple example with only four bootstrap resamples, see Figure 6.
Figure 6.
A simple example of the RIO procedure Four bootstrap resampled gene trees are shown. Letters represent sequence names/"functions". "A" (nematode and wheat) are true orthologs of the human query sequence, whereas "B" (rat) is a true paralog of the query (i.e. the first tree happens to be the real one). In 3 out of 4 trees nematode "A" appears orthologous to the query, in 3 out of 4 trees wheat "A" appears orthologous to the query. Rat "B" never appears to be orthologous. For an example of actual RIO output see Figure 7.
We use the Pfam protein family database [8] as a source of high quality curated multiple sequence alignments and profile HMMs (Hidden Markov Models, see [21] for a review), as well as programs from the HMMER package http://hmmer.wustl.edu/. RIO can easily be adapted to work with different sources of alignments and different alignment programs. For tree reconstruction, the neighbor joining (NJ) algorithm [22] is used, since it is reasonably fast, can handle alignments of large numbers of sequences, and does not assume a molecular clock. NJ recreates the correct additive tree as long as the input distances are additive [23], and is effective even if additivity is only approximated [24].
Input: A query protein sequence Q with unknown function.
A curated multiple alignment A from the Pfam database for the protein family that Q belongs to (as determined by hmmpfam from the HMMER package).
A profile HMM H for the protein family that Q belongs to.
Output: A list (as in Figure 7) of proteins orthologous to Q, sorted according to a bootstrap confidence value (based on orthology, super-orthology, or subtree-neighborings).
Figure 7.
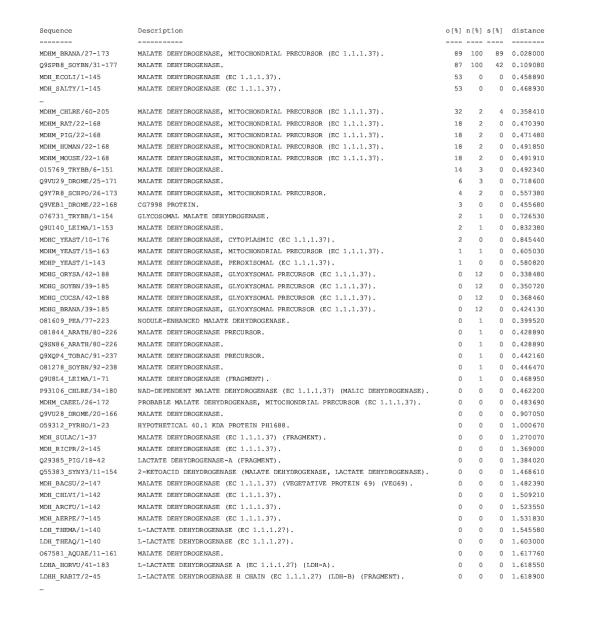
RIO output for the A. thaliana protein F12M16_14 analyzed against the Pfam ldh domain alignment (PF00056) The "Sequence" column identifies sequences in the Pfam alignment either by their SWISS-PROT "ID" or their TrEMBL "AC" [36] with added species information (the numbers after the dash are the Pfam domain boundaries added by HMMER). "Description" is the "DE" information either from SWISS-PROT or TrEMBL. The number of observed orthologies ("o"), subtree-neighborings ("n"), and super-orthologies ("s") to the query in the 100 bootstrapped trees are indicated (in %) for the sequences in the Pfam alignment. Furthermore the evolutionary distances (average number of amino acid replacements per residue calculated by maximum likelihood based on the BLOSUM 62 matrix) between the query and the sequences in the Pfam alignment are shown. For space reasons some lines of the output are not shown ("...") (the complete output is available at http://www.genetics.wustl.edu/eddy/forester/rio_analyses/RIO_paper/AT_LDH_MDH/). The output is sorted by orthology values. According to this RIO analysis the query sequence is likely to be orthologous and a subtree-neighbor to the plant sequences MDHM_BRANA and Q9SPB8_SOYBN. In addition, the query is likely to be super-orthologous to MDHM_BRANA. The bacterial sequences MDH_ECOLI and MDH_SALTY are also possibly orthologs but no subtree-neighbors. Hence, F12M16_14 is very likely to be a malate dehydrogenase and possibly mitochondrial.
Optional: A gene tree based on the multiple alignment A and the query Q annotated with orthology bootstrap confidence values for the query Q.
Procedure:
1. Query sequence Q is aligned to the existing alignment A (using hmmalign from the HMMER package and the Pfam profile HMM H).
2. The alignment is bootstrap resampled x times (usually, x = 100).
3. Maximum likelihood pairwise distance matrices are calculated for each of the x multiple alignments using a model of amino acid substitution (for example, BLOSUM [25] or Dayhoff PAM [26]).
4. An unrooted phylogenetic tree is inferred for each of the x multiple alignments by neighbor joining [22], resulting in x gene trees. Each tree is rooted by a modified version of our SDI algorithm [13] that minimized the number of duplications postulated (this is discussed in more detail later).
5. For each of the x rooted gene trees: For each node it is inferred whether it represents a duplication or a speciation event by comparing the gene tree to a trusted species tree.
6. For each sequence s in the gene tree (except Q): Count the number of gene trees where s is orthologous to Q (see Figure 6 for an illustration of steps 5. and 6.). Bootstrap confidence values for super-orthologies, ultra-paralogies and subtree-neighbors are calculated analogously.
Precalculation of pairwise distances for increased time efficiency
The most time consuming step in the procedure described above is the calculation of pairwise distances. [The time complexity is O(xLN2), N being the number of sequences, L being their length, and x being the number of bootstrap resamples. On an average Intel processor the wall clock time for 100 bootstrapped datasets of a typical Pfam multiple alignment is in the range of hours.]
Since the query sequence is aligned to stable Pfam alignments, it is possible to precalculate the pairwise distances for each alignment and store the results. Then, when RIO is being used to analyze a query sequence, only the distances of the query to each sequence in the Pfam alignment have to be calculated. This step becomes thus O(xLN) instead of O(xLN2).
To do this correctly, the aligned query sequence has to be bootstrap resampled in exactly the same way as was used for precalculating the pairwise distances of the Pfam alignment. For this purpose, bootstrap positions (e.g. which aligned columns from the Pfam alignment were chosen in a particular bootstrap sample) are saved to a file. With this file it is possible to bootstrap the new alignment of N+1 sequences (Pfam alignment plus query sequence) in precisely the same manner, so the NxN precalculated distances are valid for the (N+1)x(N+1) distance matrix. The alignment method must also guarantee that the original Pfam multiple alignment remains unchanged when the query sequence is aligned to it. This requires specially prepared Pfam full alignments and profile HMMs that are created with the HMMER software as follows:
Input: Original Pfam full alignment A.
Output: "aln" file containing RIO-ready full alignment
"hmm" file containing a RIO-ready profile HMM
"nbd" file containing pairwise distances
"bsp" file bootstrap positions file
"pwd" file containing pairwise distances for bootstrap resampled alignment
1. Remove sequences from species not in RIO's master species tree from alignment A. If A does not contain enough sequences (<6), abort.
2. Run hmmbuild -o A' on A, using the same options as were used to build the original Pfam HMM for A, resulting in alignment A'. (HMMER's construction procedure slightly modifies the input alignment in ways that are usually unimportant, but which matter to bootstrapping in RIO.) Keep A' as the "aln" file.
3. Run hmmbuild with "--hand" option on A', resulting in HMM H' (using the same options as were used to build the original HMM for A). Calibrate H' with hmmcalibrate and keep as "hmm" file.
4. Remove non-consensus (insert) columns from A' (these are annotated by HMMER), resulting in alignment A".
5. Calculate pairwise distances for A", resulting in the "nbd" file (non-bootstrapped distances).
6. Bootstrap resample the columns of A", resulting in the "bsp" file (bootstrap positions file).
7. Calculate pairwise distances for bootstrapped A", resulting in the "pwd" file.
Rooting of gene trees
The concept of speciation and duplication is only meaningful on rooted gene trees, but the neighbor joining algorithm infers unrooted trees. We use a simple parsimony criterion for rooting. Gene trees are rooted on each branch, resulting in 2N-3 differently rooted trees for a gene tree of N sequences. For each of these, the number of inferred duplications is determined. From the trees with a minimal number of duplications (if there is more than one) the tree with the shortest total height is chosen as the rooted tree. Empirical studies on gene trees based on 1750 Pfam alignments show that about 60% of trees rooted in such a way have their root in the same position that direct midpoint rooting [27] would place it.
Naively performing a full duplication/speciation analysis on each of 2N-3 differently rooted trees results in a overall time complexity of O(N2) or worse, but this can be avoided. For the purpose of the following discussion it is assumed that our SDI algorithm for speciation/duplication inference is employed, but the idea applies to all algorithms based on a mapping function M defined as follows [28]:
Definition 4. Let G be the set of nodes in a rooted binary gene tree and S the set of nodes in a rooted binary species tree. For any node g ∈ G, let γ (g) be the set of species in which occur the extant genes descendant from g. For any node s ∈ S, let σ (s) be the set of species in the external nodes descendant from s. For any g ∈ G, let M(g) ∈ S be the smallest (lowest) node in S satisfying γ (g) ⊆ σ (M(g)).
Duplications are then defined using M(g) as follows:
Definition 5. Let g1 and g2 be the two child nodes of an internal node g of a rooted binary gene tree G. Node g is a duplication if and only if M(g) = M(g1) or M(g) = M(g2).
The main task of most algorithms for duplication inference is the calculation of M. After M has been calculated for any rooted gene tree G it is possible to explore different root placements without having to recalculate M for every node of G. As long as the root is moved one node at the time, M has to be recalculated only for two nodes: the one node which was child 1 (if the new root is placed on a branch originating from child 1 of the previous root) or child 2 (otherwise) of the previous root, as well as for the new root itself. Hence, two postorder traversal steps (child 1 or 2 of the old root, then the new root) in the SDI algorithm are all that is needed. The new sum of duplications is determined by keeping track of the change in duplication/speciation status in the two recalculated nodes as well as in the previous root. Performing this over the whole gene tree (some nodes will be visited twice) it is possible to explore all possible root placements and calculate the resulting duplications in practically linear time. The pseudocode algorithm is as follows:
Algorithm for speciation duplication inference combined with rooting
Input : binary gene tree G, rooted binary species tree S.
Output:G with "duplication" or "speciation" assigned to each internal node and rooted in such a way that the sum of duplications is minimized.
SDIunrooted(G, S)
root gene tree G at the midpoint of any branch;
set B = getBranchesInOrder(G);
SDIse(G, S) (see [13]);
for each branch b in B:
set n1 = child 1 of root of G;
set n2 = child 2 of root of G;
root G at the midpoint of branch b;
updateM(n1, n2, G);
if (sum of duplications in G <dmin):
set dmin = d;
set Gdmin = G;
return Gdmin;
updateM(n1, n2, G)
set r = root of G;
if (child 1 of r == n1 || child 2 of r == n1):
calculateMforNode(n1);
else:
calculateMforNode(n2);
calculateMforNode(r);
calculateMforNode(n)
if (n != external):
set a = M(child 1 of n);
set b = M(child 2 of n);
while (a != b):
if (a >b):
set a = parent of a;
else:
set b = parent of b;
set M(n) = a;
if (M(n) == M(child 1 of n) || M(n) == M(child 2 of n):
n is duplication;
else:
n is speciation;
getBranchesInOrder(G)
set n = root of G;
set i = 0;
while !(n == root && indicator of n == 2):
if (n != external && indicator of n != 2):
if (indicator of n == 0):
set indicator of n = 1;
set n = child 1 of n;
else:
set indicator of n = 2;
set n = child 2 of n;
if (parent of n != root):
set B [i ] = branch connecting n and parent of n;
else:
set B [i ] = branch connecting child 1 of root and child 2 of root;
set i = i + 1;
else:
if (parent of n != root &&n != external):
set B [i ] = branch connecting n and parent of n;
set i = i + 1;
set n = parent of n;
return B;
Master species tree
Duplication inference requires a species tree. For this purpose, a single completely binary master species tree was compiled manually, containing 249 of the most commonly encountered species in Pfam (spanning Archaea, Bacteria, and Eukaryotes). This tree is based mainly on information from Maddison's "Tree of Life" project http://tolweb.org/tree/phylogeny.html, NCBI's taxonomy database http://www.ncbi.nlm.nih.gov/Taxonomy/taxonomyhome.html, the "Deep Green" project http://ucjeps.berkeley.edu/bryolab/greenplantpage.html, and [29-32]. This master tree groups nematodes and arthropods into a clade of ecdysozoans (molting animals) as proposed by Aguinaldo [29], a classification which is still controversial. The tree is available in NHX format [33] at http://www.genetics.wustl.edu/eddy/forester/tree_of_life_bin_1-4.nhx.
Implementation
RIO is implemented in a Perl pipeline of several software programs as follows. Alignment of the query sequence is done programs from the HMMER package http://hmmer.wustl.edu/. Bootstrapping is performed by a bespoke C program. Maximum likelihood pairwise distances are calculated using BLOSUM matrices [25] by a modified version of TREE-PUZZLE [34]. Neighbor joining trees are calculated by a modified version of NEIGHBOR from the PHYLIP package [35]http://evolution.genetics.washington.edu/phylip.html. Rooting and duplication inference are accomplished by "SDIunrooted" – a Java implementation of our SDI algorithm which incorporates various methods for rooting (see above). The actual counting of orthologs is performed by methods of the Java class "RIO". These programs, with the exception of HMMER, are part of the FORESTER package and are available under the GNU license at http://www.genetics.wustl.edu/eddy/forester/.
In order to run RIO locally, the following packages and databases need to be present: HMMER, the Pfam database [8], the SWISS-PROT and TrEMBL databases [36].
RIO is also available as an analysis webserver at http://www.rio.wustl.edu/. The pairwise distance and tree calculations are parallelized in this version (currently, ten 1.26 GHz Pentium III processors are being used).
Results and Discussion
Precalculation of pairwise distances
Pairwise distances to be used in RIO analyses were calculated using the "full" alignments (as opposed to the smaller curated "seed" alignments) from Pfam 6.6 (August 2001, 3071 families, [8]). Sequences from species not present in the master species tree were removed from the alignments. For computational efficiency reasons, alignments that still contained more than 600 sequences were further pruned; sequences not originating from SWISS-PROT were discarded, and sequences from certain mammals were excluded (mouse, rabbit, hamsters, goat, all primates except human), since mammals are likely to be oversampled in most Pfam families. For some extremely large families [immunoglobulin domain (PF00047), protein kinase domain (PF00069), collagen triple helix repeat (PF01391), and rhodopsin-type 7 transmembrane receptor (PF00001)], all mammalian sequences except those from human and rat were excluded.
Alignments of average length <30 amino acids (<40 for zinc finger domains) or with <6 sequences were not analyzed, because of lack of phylogenetic signal. For all other families, pairwise distances for 100 bootstrap samples were prepared. Following the above rules, pairwise distances were precalculated for 2384 alignments from a total of 3071 in Pfam 6.6 (75 alignments were too short and 612 alignments contained less than six sequences from species in the master species tree).
Phylogenomic analyses of the A. thaliana and C. elegans proteomes
In order to get an estimate of the effectiveness of this implementation of automated phylogenomics, we used the RIO procedure to analyze the A. thaliana [16] and C. elegans [17] proteomes.
The input for RIO consists of a query protein sequence together with a Pfam alignment for a protein family that the query belongs to. Before RIO could be applied we therefore had to determine the matching domains for each protein in the A. thaliana and C. elegans proteomes. For proteins composed of different domains, a RIO analysis is performed for each domain individually.
The source for protein sequences were: ATH1.pep.03202001, a flatfile database of 25,579 A. thaliana amino acid sequences (hypothetical, predicted and experimentally verified) that have been identified as part of the Arabidopsis Genome Initiative (AGI) http://www.arabidopsis.org/info/agi.html, and wormpep 43, a flatfile database of 19,730 C. elegans amino acid sequences http://www.sanger.ac.uk/Projects/C_elegans/wormpep/.
The program hmmpfam (version 2.2 g) from the HMMER package was used to search each protein sequence in ATH1.pep.03202001 and wormpep 43 against Pfam 6.6. Only domains with a score above the so-called Pfam gathering cutoff were reported ("cut_ga" option) in order to include only confident domain assignments.
The sum of domains assigned to the 25,579 A. thaliana protein sequences was 17,847 (counting multiple copies of the same domain in one protein as one). 12,431 sequences matched one domain (containing possibly multiple copies of this one domain). 1,982 sequences matched two different domains (containing possibly multiple copies of both). 453 sequences matched three or more different domains (containing possibly multiple copies of each). Therefore, a total of 14,866 (58%) sequences from ATH1.pep.03202001 could be assigned to one or more Pfam families.
Similarly, a sum of 12,314 domains was assigned to the 19,769 C. elegans protein sequences. 7,698 sequences matched one domain, 1,632 matched two different domains, and 388 matched three or more different domains. Thus, 9,718 (49%) sequences from wormpep 43 could be assigned to one or more Pfam families.
RIO was then used to analyze each protein sequence matching one or more Pfam families. The results from these analyses can be found at http://www.genetics.wustl.edu/eddy/forester/rio_analyses/. The approximate time requirement was between two and three weeks, performed on eight Pentium III 800 Mhz processors.
How many sequences can be analyzed with RIO?
The first question we asked was simply how many sequences can be analyzed with RIO. For an overview, see Table 1. From the 17,847 A. thaliana domain sequences matching a Pfam family, 14,905 (84%) could be analyzed with RIO using the precalculated distances. 2859 (16%) domain sequences were not analyzed because the corresponding Pfam alignments were either too short or did not contain enough sequences (as described above). 83 (0.5%) domain sequences were not analyzed because the E-value for the match to their profile HMM was below the threshold of 0.01. This represents a second filtering step for preventing analyzing false domain assignments (besides only analyzing domain sequences which score above the gathering cutoff in the domain analysis). (RIO performs a preprocessing step before aligning the query sequence to a Pfam alignment, in which the program hmmsearch is used to trim the query sequence by searching it with the appropriate profile HMM. If the resulting E-value was below 0.01 no analysis was performed.) Multiple copies of the same domain in certain sequences result in a sum of individual analyses larger then the number of analyzed domain sequences. In case of A. thaliana this number was 17,940.
Table 1.
Number of domains which can be analyzed with RIO
| Protein sequences in proteome | Sum of domains assigned to proteome | Domain sequences analyzed with RIO | Sum of individual RIO analyses | |
|---|---|---|---|---|
| A. thaliana | 25,579 | 17,847 | 14,905 | 17,940 |
| C. elegans | 19,769 | 12,314 | 11,287 | 14,740 |
Correspondingly, from the 12,314 C. elegans domain sequences matching a Pfam family, 11,287 (92%) could be analyzed with RIO using the precalculated distances. 901 (7%) domain sequences were not analyzed because the corresponding Pfam alignments were either too short or did not contain enough sequences. 53 (0.4%) domain sequences were not analyzed because the E-value for the match to their profile HMM was below the threshold of 0.01. In addition, we did not analyze the 73 C. elegans sequences matching the immunoglobulin family (PF00047), because we considered the phylogenetic signal in this alignment to be questionable. Furthermore, most of the 73 sequences contain multiple copies of the immunoglobulin domain (for example, CE08028 contains 48 immunoglobulin domains) and we therefore worried that the results from this family might skew our overall results. The sum of RIO analyses was 14,740.
Thus, a little less than half of each proteome can be analyzed by RIO. The most important factor is whether a protein sequence has a match to a Pfam domain family.
RIO analysis of lactate/malate dehydrogenase family members
In order to test whether RIO performs well on an "easy" case, RIO was used to analyze lactate/malate dehydrogenase family members both in A. thaliana and C. elegans. L-Lactate and malate dehydrogenases are members of the same protein family (represented in Pfam as ldh for the NAD-binding domain and ldh_C for the alpha/beta C-terminal domain), yet they catalyze different reactions. L-lactate dehydrogenase (EC 1.1.1.27) catalyzes the following reaction: (S)-lactate + NAD+ = pyruvate + NADH [37]. Malate dehydrogenase (NAD) (EC 1.1.1.37) catalyzes: (S)-malate + NAD+ = oxaloacetate + NADH [38]. NADP-dependent malate dehydrogenase (EC 1.1.1.82) utilizes NADP+ as cofactor instead of NAD+[39,40]. According to the Pfam domain analysis described above, the A. thaliana proteome contains ten lactate/malate dehydrogenase family members, whereas the C. elegans proteome contains three. (In addition, C. elegans also contains two putative members of a second lactate/malate dehydrogenase family [41], ldh_2, which are not discussed here.) The RIO output for the A. thaliana protein F12M16_14 analyzed against the ldh domain alignment is shown as an example in Figure 7. The results are summarized in Tables 2 and 3. Complete RIO output files (as well as NHX [33] tree files) are avaliable, here for A. thaliana and at here for c.elegans. In all cases, distinction between malate dehydrogenase (NAD) and lactate dehydrogenase is unquestionable and in accordance with existing annotations and BLAST results irrespective which domain (ldh or ldh_C) was used for the RIO analysis (which implies that no domain swapping occurred over long evolutionary times). Furthermore, the same results are achieved whether only the top 1 sequence (the one with the highest orthology value, shown in Tables 2 and 3) or the top 10 sequences are used to transfer annotation from. The only likely NADP-dependent malate dehydrogenase is the A. thaliana sequence MCK7_20. For some query sequences, the top orthology values are low. Yet, all subtree-neighborings above 50% exhibit consensus at distinguishing between malate and lactate dehydrogenase. In contrast, a finer distinction (e.g. between mitochondrial and cytoplasmic malate dehydrogenase) proves more problematic. While there is no case of actual conflict between the existing annotation and the RIO results, in many cases there is no compelling evidence in the RIO results to confirm the finer distinctions in the existing annotations. Obviously, the resolution power of RIO is limited by the given annotations and by the number (or even presence) of sequences for each sub(sub)family.
Table 2.
RIO analysis of A. thaliana lactate/malate dehydrogenase family members
| Sequence ID | Annotation | RIO top 1 hit (highest orthology value) | |
|---|---|---|---|
| Domain used for analysis: | |||
| ldh (PF00056) | Ldh_C (PF02866) | ||
| dl4665w | LDH (LDH1) | L-LDH (o = 91%, n = 3%) | L-LDH (o = 94%, n = 12%) |
| F19P19_13 | putative MDH | MDH (o = 2%, n = 98%) | cytoplasmic MDH (o = 40%, n = 78%) |
| F12M16_14 | mitochondrial NAD-dependent MDH | mitochondrial MDH (o = 89%, n = 100%) | mitochondrial MDH (o = 94%, n = 66%) |
| T30L20.4 | putative glyoxysomal MDH precursor | MDH (o = 55%, n = 0%) | glyoxysomal MDH (o = 95%, n = 37%) |
| K15M2_16 | mitochondrial NAD-dependent MDH, putative | MDH (o = 89%, n = 100%) | mitochondrial MDH (o = 84%, n = 80%) |
| F1P2_70 | Chloroplast NAD-dependent MDH | MDH (o = 87%, n = 21%) | MDH (o = 85%, n = 6%) |
| F17I14_150 | microbody NAD-dependent MDH | glyoxysomal MDH (o = 100%, n = 100%) | glyoxysomal MDH (o = 80%, n = 97%) |
| MWF20_2 | cytoplasmic MDH | MDH (o = 2%, n = 100%) | MDH (o = 38%, n = 75%) |
| MIK19_17 | cytoplasmic MDH | cytoplasmic MDH (o = 5%, n = 99%) | MDH (o = 31%, n = 84%) |
| MCK7_20 | NADP-dependent MDH | MDH (o = 60%, n = 30%) | chloroplast NADP-MDH (EC 1.1.1.82) (o = 68%, n = 82%) |
Annotations are from ATH1.pep.03202001 (Arabidopsis Genome Initiative http://www.arabidopsis.org/info/agi.html). "o=" and "n=" are orthology and subtree-neighboring values for the sequence in the Pfam alignment (ldh or ldh_C) with the highest orthology value towards the respective query sequence. LDH stands for L-lactate dehydrogenase. MDH stands for malate dehydrogenase.
Table 3.
RIO analysis of C. elegans lactate/malate dehydrogenase family members
| Sequence ID | Annotation | RIO top 1 hit (highest orthology value) | |
|---|---|---|---|
| Domain used for analysis: | |||
| ldh (PF00056) | ldh_C (PF02866) | ||
| F13D12.2 (CE02181) | LDH (predicted) | L-LDH (o = 75%, n = 61%) | L-LDH (B chain) (o = 66%, n = 23%) |
| F20H11.3 (CE09512) | Member of the MDH protein family (predicted) | MDH (o = 42%, n = 16%) | MDH (o = 53%, n = 34%) |
| F46E10.10 (CE20820) | Putative MDH, possible ortholog of H. sapiens Hs.75375 gene product (cytoplasmic MDH) (predicted) | cytoplasmic MDH (o = 13%, n = 95%) | MDH (o = 76%, n = 52%) |
Annotations are from WormPD™ [49] (12/31/2001) http://www.proteome.com/databases/index.html. For more explanations see Table 2.
Sequences with no orthologs in the current databases
Next, we determined the distribution of the top orthology bootstrap values. The sequence with the top orthology bootstrap value is the one that is most likely to be the true ortholog of the query. If the top orthology bootstrap value is low, then the query sequence is likely to have no ortholog in the Pfam alignment. These results are summarized in Table 4. For example, for 2252 A. thaliana query sequences, at least one sequence was orthologous in at least 95 out of 100 resampled trees. In contrast, for 930 A. thaliana query sequences, no sequence was orthologous in more than five out of 100 bootstrapped trees. For query sequences with more than one copy of the same domain, each copy had to meet the conditions individually in order for the whole query sequence being counted to be below or above the threshold.
Table 4.
Top orthology bootstrap values of RIO analyses
| Top orthology bootstrap values [%] | A. thaliana (total: 14,905) | C. elegans (total: 11,287) |
|---|---|---|
| ≥ 95 | 2252 | 922 |
| ≥ 90 | 2982 | 1224 |
| ≥ 80 | 4185 | 1858 |
| ≥ 70 | 5198 | 2393 |
| ≥ 50 | 7493 | 3459 |
| ≤ 20 | 2680 | 4751 |
| ≤ 10 | 1360 | 3171 |
| ≤ 5 | 930 | 2452 |
We do not think it is possible at this stage to determine reliable threshold values for "true orthologs" or "absence of orthologs". Such thresholds are very likely to be different for different Pfam families since families vary in the phylogenetic signal their alignment contains. Some sequences that are very likely to be true orthologs nonetheless exhibit marginal orthology bootstrap values (in the range of 70% or even lower).
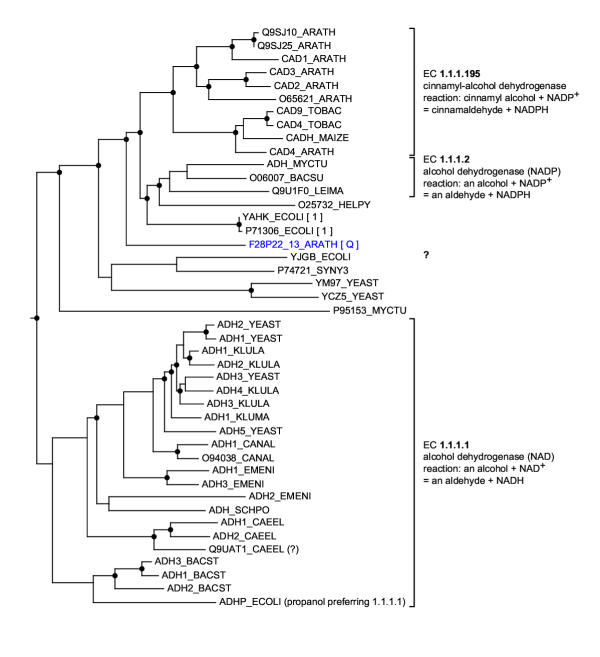
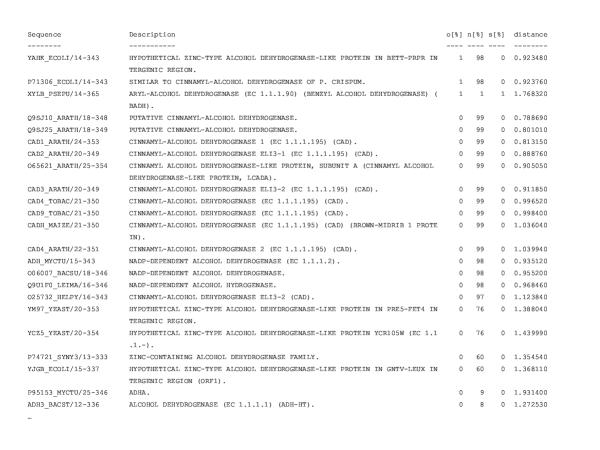
We focused on sequences that appeared to have no orthologs (<5% bootstrap), since these would be cases where a RIO analysis might be most able to correct overly specific annotations that might be transferred based solely on sequence similarity (as illustrated in Figure 1). An example for this is the A. thaliana sequence F28P22_13. (Files related to this analysis are avaliable, here.) This sequence is a zinc-binding dehydrogenase (Pfam: adh_zinc, PF00107). F28P22_13 has been annotated in ATH1.pep.03202001 "as putative cinnamyl-alcohol dehydrogenase", based on sequence similarity (its top 10 BLAST matches are all cinnamyl-alcohol dehydrogenases with E-values in the range of 10-94 if analyzed against all non-redundant GenBank CDS translations+PDB+SwissProt+PIR+PRF on Jan 2, 2002). Cinnamyl-alcohol dehydrogenase (EC 1.1.1.195) catalyzes the following reaction: cinnamyl alcohol + NADP+ = cinnamaldehyde + NADPH (but it can also act on coniferyl alcohol, sinapyl alcohol and 4-coumaryl alcohol) in the flavonoid, stilbene and lignin biosynthesis pathways [40,42]. According to the RIO analysis, F28P22_13 has no orthologs (see Figure 8 for the corresponding tree and Figure 9 for the RIO output). Furthermore its subtree-neighbors above 90%, cinnamyl-alcohol dehydrogenases and NADP-dependent alcohol dehydrogenases (EC 1.1.1.2), exhibit only partial annotation agreement (namely that of some type of NADP-dependent alcohol dehydrogenase, but not EC 1.1.1.2 or EC 1.1.1.195). Hence, F28P22_13 is likely to be a (possibly novel) type of NADP-dependent alcohol dehydrogenase (other than EC 1.1.1.2), possibly a novel type of cinnamyl-alcohol dehydrogenase.
Figure 8.
A phylogenetic tree for zinc-binding dehydrogenases produced by RIO This tree is based on the Pfam alignment adh_zinc (PF00107) and is a subtree of a larger tree. It has been calculated by the neighbor joining method using maximum likelihood pairwise distances [34] based on the BLOSUM 62 matrix [25]. Gene duplication are indicated by circles (inferred by our SDI algorithm [13]). The tree was rooted by minimizing the sum of duplications. The tree image was produced by ATV [33]. Species are represented by their SWISS-PROT abbreviations (ARATH: Arabidopsis thaliana, TOBAC: Nicotiana tabacum, MAIZE: Zea mays, MYCTU: Mycobacterium tuberculosis, BACSU: Bacillus subtilis, LEIMA: Leishmania major, HELPY: Helicobacter pylori, SYNY3: Synechocystis sp. strain PCC 6803, YEAST: Saccharomyces cerevisiae, KLULA: Kluyveromyces lactis, KLUMA: Kluyveromyces marxianus, CANAL: Candida albicans, EMENI: Emericella nidulans, SCHPO: Schizosaccharomyces pombe, CAEEL: Caenorhabditis elegans, BACST: Bacillus stearothermophilus). The A. thaliana query sequence F28P22_13 is labeled with Q. The bootstrap orthology values for potential orthologs are indicated in brackets. According to this tree, F28P22_13 has no orthologs.
Figure 9.
RIO output for the A. thaliana protein F28P22_13 analyzed against the Pfam adh_zinc domain alignment (PF00107) For an explanation of the output see Figure 7. For space reasons some lines of the output are not shown ("...") (the complete output is available at http://www.genetics.wustl.edu/eddy/forester/rio_analyses/RIO_paper/F28P22_13/). The output is sorted by orthology values. According to this RIO analysis the query sequence is likely to have no orthologs in this alignment. In contrast, the query probably has subtree-neighbors which are cinnamyl-alcohol dehydrogenases (EC 1.1.1.195), NADP-dependent alcohol dehydrogenases (EC 1.1.1.2), as well as other zinc-containing alcohol dehydrogenases.
One might expect that each query sequence that appears to have no orthologs is connected with scenario similar to the one described above for F28P22_13. Yet, this is clearly not the case, for the following reasons: (i) Gene duplications might not be followed by functional modification (many Pfam families are composed of sequences which have all the same function, at least at the resolution of the current annotation). (ii) Some Pfam families are composed solely of sequences originating from closely related (or the same) species (such as PF02362, the B3 DNA binding domain of higher plants). For such families, query sequences from the same species group are expected to have low orthology values. In such cases the concept of subtree-neighbors and ultra-paralogs is more useful than orthologs. (iii) Erroneous RIO results caused by an insufficient phylogenetic signal (due to short sequences, for example) can lead to low orthology values. For this reason, RIO also outputs the average bootstrap value for the consensus tree to give the user a hint about the amount of phylogenetic signal in the alignment used.
Inconsistency between orthology bootstrap values and sequence similarity
We were next interested in the number of sequences in the two proteomes for which the orthology bootstrap values do not correspond to sequence similarity (Table 5). Such disagreements could be caused by the situation illustrated in Figure 2. To determine these numbers, we used the following rules. Two thresholds for orthology bootstrap values were chosen: O, the minimum for being an ortholog (e.g. 90%) and N, the maximum for not being an ortholog (e.g. 10%). Furthermore, a maximal ratio R for the distance of the query to non-orthologs to the distance of the query to orthologs was chosen (e.g. 0.5). In order for being counted as exhibiting disagreement between the orthology bootstrap values and sequence similarity a query sequence had to fulfill the following two conditions: (i) it must have a least one ortholog with bootstrap orthology value above or equal to O, and (ii) all sequences in the alignment with bootstrap orthology values above N, must have distance ratios smaller or equal to R for at least one sequence with bootstrap orthology lower or equal to N. Sequences from the following species were ignored in this analysis (since they were the species of the query sequence or related to it): A. thaliana proteome: Rosidae (A. thaliana, Pisum sativum, Glycine max, Cucurbita maxima, Cucumis sativus, Brassica campestris, Brassica napus, Citrus unshiu, Citrus sinensis, Theobroma cacao, Gossypium hirsutum); C. elegans proteome: nematodes (C. elegans, Caenorhabditis briggsae, Haemonchus contortus, Ascaris suum).
Table 5.
The numbers of sequences for which the orthology bootstrap values do not correspond to sequence similarity
| Thresholds | Number of query sequences | |||
|---|---|---|---|---|
| O | N | R | A. thaliana | C. elegans |
| 90% | 10% | 0.5 | 128 | 19 |
| 90% | 10% | 0.8 | 328 | 102 |
| 80% | 20% | 0.5 | 254 | 45 |
Manual inspection of the RIO output leads to the following, somewhat unexpected, conclusion. In many cases a discrepancy between orthology bootstrap values and sequence similarity is caused by orthologs in only phylogenetically distant (relatively to the query sequence) species. This can lead to errors if functional annotation is blindly transferred from these orthologs to the query. As an example of this, the results of analyzing the A. thaliana O-methyltransferase F16P17_38 are shown in Figures 10 and 11. (Complete files are at here.) Even though the F16P17_38 sequence is orthologous to the bacterial hydroxyneurosporene methyltransferases (EC 2.1.1.-) [43] it would be dangerous to annotate it as such. A more reasonable annotation for this query would be to annotate it based on subtree-neighbors and hence call it a plant O-methyltransferase. An indication of this problem (besides a discrepancy between orthology bootstrap values and sequence similarity) is the meeting of the following three conditions: A query sequence has (i) likely orthologs and (ii) likely subtree-neighbors in other species than the query itself, yet (iii) there is no significant overlap between the orthologs and the subtree-neighbors.
We were unable to find convincing examples in the C. elegans and A. thaliana proteomes where wrong sequence similarity based annotations might be caused by unequal rates of evolution (as illustrated in Figure 2). This is not to say that such cases do not exist in those two proteomes, but they are likely to be quite rare. Similarly to the issues described in the previous section, the detection of such examples is complicated by the fact that for many cases in which a discrepancy between orthology bootstrap values and sequence similarity exists, all sequences in the Pfam alignment appear to have to same function, the Pfam family is lineage specific, or the annotations are too poor/confusing to make any kind of inference.
Conclusions
RIO is a procedure for automated phylogenomics. The RIO procedure appears to be particularly useful for the detection of first representatives of novel protein subfamilies. Sequence similarity based methods can be misleading in these cases since every query is always "most similar to something", whereas RIO can detect the absence of orthologs.
Storm, Sonnhammer, and colleagues have recently developed similar ideas and procedures in a program called ORTHOSTRAPPER [44,45]. One distinction between the two approaches is that ORTHOSTRAPPER's orthology determination procedure does not employ a species tree for duplication inference; it uses a heuristic based on sequence similarity rather than a formally correct phylogenetic means of inferring orthology. Another distinction is that ORTHOSTRAPPER uses uncorrected observed mismatches as a sequence distance measure, rather than estimating evolutionary distances. In general, RIO brings more of the power of known phylogenetic inference algorithms to bear on the problem of proteomic annotation.
Super-orthology is a very stringent criterion. If a query sequence is likely to have super-orthologs, they represent an excellent source to transfer functional annotation from. In contrast, the absence of super-orthologs does not imply that a function for a query sequence cannot be inferred (in the two proteomes analyzed in this work, most sequences appear to have no super-orthologs in Pfam 6.6).
Ultra-paralogs are sequences in the same species as the query and are likely to be the result of recent duplications and therefore might not have yet undergone much functional divergence. Operationally, splice variants can also be thought of as ultra-paralogs (at least as long as protein sequences are considered).
Subtree-neighbors have two uses: (i) If the subtree-neighbors of the query sequence exhibit (partial) agreement in their functional annotations, the elements in which they agree might be used to infer a (partial) function for the query. This is useful for query sequences that are appear to have no orthologs in the current databases. (ii) For query sequences that do have orthologs, absence of overlap between the sequences considered orthologous and those which appear to be subtree-neighbors raises a red flag, indicating that the orthologs are in phylogenetically distant species relative to the query. Transferring annotation from such orthologs is risky. In this case, subtree-neighbors are a more reliable source to transfer annotation from.
RIO outputs warnings if the distance of the query sequence to other sequences is unusually short or long, relative to other branch lengths on the tree. The usefulness of this was not investigated in this work.
A RIO procedure based on Pfam alignments analyzes each protein domain individually since Pfam is protein family database based on individual domains [8]. In some respects, it would be preferable to analyze whole protein sequences, but well curated databases of complete protein alignments are not available (to our knowledge). However, domain-by-domain analysis is not necessarily disadvantageous. Due to domain shuffling many proteins are mosaic proteins, composed of domains with different evolutionary histories [46,47]. For such proteins it makes much sense to analyze each domain individually. Furthermore, mosaic proteins from sufficiently distant species might be impossible to be aligned over more than one domain at the time, since they are unlikely to exhibit the same domain organization. The same is true for multiple copies of the same domain in protein: Each of them is analyzed individually (such proteins often differ in their number of domain copies and could therefore not be aligned from end to end for the whole family).
In general, the concept of "annotation consensus" is very important in this work (for example consensus between subtree-neighbors, or between subtree-neighbors and orthologs). We have employed this notion loosely. A useful future extension would be to incorporate automated annotation consensus detection into RIO. This would include annotation of internal nodes of a gene tree with a "biological function". Automated consensus detection is trivial for a highly formalized notation system, such as EC numbers (the consensus of EC 1.1.1.3 and EC 1.1.1.23 is EC 1.1.1, a oxidoreductase acting on the CH-OH group of donors with NAD+ or NADP+ as acceptor [40]). Obviously, it is much more difficult to analyze natural language annotations in the same manner. Perhaps this could be accomplished by utilizing the set of structured vocabularies of the Gene Ontology (GO) project [48]http://www.geneontology.org/.
Contributor Information
Christian M Zmasek, Email: zmasek@genetics.wustl.edu.
Sean R Eddy, Email: eddy@genetics.wustl.edu.
Acknowledgements
This work was supported primarily by a grant from Monsanto Company, and also by the Howard Hughes Medical Institute and grant HG01363 from the NIH National Human Genome Research Institute.
References
- Dayhoff MO. The origin and evolution of protein superfamilies. Fed Proc. 1976;35:2132–2138. [PubMed] [Google Scholar]
- Ingram VM. Gene evolution and the haemoglobins. Nature. 1961;189:704–708. doi: 10.1038/189704a0. [DOI] [PubMed] [Google Scholar]
- Haldane JBS. The causes of evolution. New York and London: Harper & Brothers Publishers; 1932.
- Ohno S. Evolution by gene duplication. New York: Springer-Verlag; 1970.
- Galperin MY, Koonin EV. Sources of systematic error in functional annotation of genomes: domain rearrangement, non-orthologous gene displacement and operon disruption. In Silico Biol. 1998;1:55–67. [PubMed] [Google Scholar]
- Altschul SF, Gish W, Miller W, Myers EW, Lipman DJ. Basic local alignment search tool. J Mol Biol. 1990;215:403–410. doi: 10.1006/jmbi.1990.9999. [DOI] [PubMed] [Google Scholar]
- Pearson WR. Rapid and sensitive sequence comparison with FASTP and FASTA. Methods Enzymol. 1990;183:63–98. doi: 10.1016/0076-6879(90)83007-v. [DOI] [PubMed] [Google Scholar]
- Bateman A, Birney E, Durbin R, Eddy SR, Howe KL, Sonnhammer EL. The Pfam protein families database. Nucleic Acids Res. 2000;28:263–266. doi: 10.1093/nar/28.1.263. [DOI] [PMC free article] [PubMed] [Google Scholar]
- Eisen JA. Phylogenomics: improving functional predictions for uncharacterized genes by evolutionary analysis. Genome Res. 1998;8:163–167. doi: 10.1101/gr.8.3.163. [DOI] [PubMed] [Google Scholar]
- Tatusov RL, Natale DA, Garkavtsev IV, Tatusova TA, Shankavaram UT, Rao BS, Kiryutin B, Galperin MY, Fedorova ND, Koonin EV. The COG database: new developments in phylogenetic classification of proteins from complete genomes. Nucleic Acids Res. 2001;29:22–28. doi: 10.1093/nar/29.1.22. [DOI] [PMC free article] [PubMed] [Google Scholar]
- Eulenstein O. Vorhersage von Genduplikationen und deren Entwicklung in der Evolution. GMD Research Series. 1998;20 [Google Scholar]
- Zhang L. On a Mirkin-Muchnik-Smith conjecture for comparing molecular phylogenies. J Comput Biol. 1997;4:177–187. doi: 10.1089/cmb.1997.4.177. [DOI] [PubMed] [Google Scholar]
- Zmasek CM, Eddy SR. A simple algorithm to infer gene duplication and speciation events on a gene tree. Bioinformatics. 2001;17:821–828. doi: 10.1093/bioinformatics/17.9.821. [DOI] [PubMed] [Google Scholar]
- Mueller LD, Ayala FJ. Estimation and interpretation of genetic distance in empirical studies. Genet Res. 1982;40:127–137. doi: 10.1017/s0016672300019005. [DOI] [PubMed] [Google Scholar]
- Felsenstein J. Confidence limits on phylogenies: An approach using the bootstrap. Evolution. 1985;39:783–791. doi: 10.1111/j.1558-5646.1985.tb00420.x. [DOI] [PubMed] [Google Scholar]
- Arabidopsis-Initiative. Analysis of the genome sequence of the flowering plant Arabidopsis thaliana. Nature. 2000;408:796–815. doi: 10.1038/35048692. [DOI] [PubMed] [Google Scholar]
- C. elegans-Sequencing-Consortium. Genome sequence of the nematode C. elegans: a platform for investigating biology. Science. 1998;282:2012–2018. doi: 10.1126/science.282.5396.2012. [DOI] [PubMed] [Google Scholar]
- Fitch WM. Distinguishing homologous from analogous proteins. Syst Zool. 1970;19:99–113. [PubMed] [Google Scholar]
- Mombaerts P. Seven-transmembrane proteins as odorant and chemosensory receptors. Science. 1999;286:707–711. doi: 10.1002/(SICI)1097-010X(20000601)286:7<707::AID-JEZ5>3.0.CO;2-P. [DOI] [PubMed] [Google Scholar]
- Troemel ER. Chemosensory signaling in C. elegans. Bioessays. 1999;21:1011–1020. doi: 10.1002/(SICI)1521-1878(199912)22:1<1011::AID-BIES5>3.0.CO;2-V. [DOI] [PubMed] [Google Scholar]
- Eddy SR. Profile hidden Markov models. Bioinformatics. 1998;14:755–763. doi: 10.1093/bioinformatics/14.9.755. [DOI] [PubMed] [Google Scholar]
- Saitou N, Nei M. The neighbor-joining method: a new method for reconstructing phylogenetic trees. Mol Biol Evol. 1987;4:406–425. doi: 10.1093/oxfordjournals.molbev.a040454. [DOI] [PubMed] [Google Scholar]
- Studier JA, Keppler KJ. A note on the neighbor-joining algorithm of Saitou and Nei. Mol Biol Evol. 1988;5:729–731. doi: 10.1093/oxfordjournals.molbev.a040527. [DOI] [PubMed] [Google Scholar]
- Atteson K. In: Mathematical Hierarchies and Biology. Mirkin B, McMorris F, Roberts F, Rzhetsky A, editor. American Mathematical Society; 1997. The performance of the neighbor-joining method of phylogeny reconstruction. pp. 133–148. [Google Scholar]
- Henikoff S, Henikoff JG. Amino acid substitution matrices from protein blocks. Proc Natl Acad Sci U S A. 1992;89:10915–10919. doi: 10.1073/pnas.89.22.10915. [DOI] [PMC free article] [PubMed] [Google Scholar]
- Dayhoff MO, Schwartz RM, Orcutt BC. In: Atlas of Protein Sequence and Structure. Silver Springs, MD, editor. Vol. 5. Natl Biomed Res Found; 1978. A model of evolutionary change in proteins. pp. 345–352. [Google Scholar]
- Swofford DL, Olsen GJ, Waddell PJ, Hillis DM. In: Molecular systematics. Hillis DM, Moritz C, Mable BK. Sunderland, MA, editor. Sinauer Associates; 1996. Phylogenetic Inference. [Google Scholar]
- Goodman M, Czelusniak J, Moore GW, Romero-Herrera AE, Matsuda G. Fitting the gene lineage into its species lineage, a parsimony strategy illustrated by cladograms constructed from globin sequences. Syst Zool. 1979;28:132–168. [Google Scholar]
- Aguinaldo AM, Turbeville JM, Linford LS, Rivera MC, Garey JR, Raff RA, Lake JA. Evidence for a clade of nematodes, arthropods and other moulting animals. Nature. 1997;387:489–493. doi: 10.1038/387489a0. [DOI] [PubMed] [Google Scholar]
- Barns SM, Delwiche CF, Palmer JD, Pace NR. Perspectives on archaeal diversity, thermophily and monophyly from environmental rRNA sequences. Proc Natl Acad Sci U S A. 1996;93:9188–9193. doi: 10.1073/pnas.93.17.9188. [DOI] [PMC free article] [PubMed] [Google Scholar]
- Morris SC. Metazoan phylogenies: falling into place or falling to pieces? A palaeontological perspective. Curr Opin Genet Dev. 1998;8:662–667. doi: 10.1016/S0959-437X(98)80034-8. [DOI] [PubMed] [Google Scholar]
- de Rosa R, Grenier JK, Andreeva T, Cook CE, Adoutte A, Akam M, Carroll SB, Balavoine G. Hox genes in brachiopods and priapulids and protostome evolution. Nature. 1999;399:772–776. doi: 10.1038/21631. [DOI] [PubMed] [Google Scholar]
- Zmasek CM, Eddy SR. ATV: display and manipulation of annotated phylogenetic trees. Bioinformatics. 2001;17:383–384. doi: 10.1093/bioinformatics/17.4.383. [DOI] [PubMed] [Google Scholar]
- Strimmer K, von Haeseler A. Quartet puzzling: A quartet maximum likelihood method for reconstructing tree topologies. Mol Biol Evol. 1996;13:964–969. [Google Scholar]
- Felsenstein J. PHYLIP – Phylogeny Inference Package. Cladistics. 1989;5:164–166. [Google Scholar]
- Bairoch A, Apweiler R. The SWISS-PROT protein sequence database and its supplement TrEMBL in 2000. Nucleic Acids Res. 2000;28:45–48. doi: 10.1093/nar/28.1.45. [DOI] [PMC free article] [PubMed] [Google Scholar]
- Dennis D, Kaplan NO. D and L-lactic acid dehydrogenase in Lactobacillus plantarum. J. 1960;235:810–818. [PubMed] [Google Scholar]
- Banaszak LJ, Bradshaw RA. In: The Enzymes. Boyer PD, editor. Vol. 11. New York: Academic Press; 1975. Malate dehydrogenase. pp. 369–396. [Google Scholar]
- Johnson HS. NADP-malate dehydrogenase: photoactivation in leaves of plants with Calvin cycle photosynthesis. Biochem. 1971;43:703–709. doi: 10.1016/0006-291x(71)90672-3. [DOI] [PubMed] [Google Scholar]
- Webb EC. Enzyme nomenclature. San Diego: Academic Press; 1992. [Google Scholar]
- Jendrossek D, Kratzin HD, Steinbuchel A. The Alcaligenes eutrophus ldh structural gene encodes a novel type of lactate dehydrogenase. FEMS Microbiol Lett. 1993;112:229–235. doi: 10.1016/0378-1097(93)90169-3. [DOI] [PubMed] [Google Scholar]
- Wyrambik D, Grisebach H. Enzymic synthesis of lignin precursors. Further studies on cinnamyl-alcohol dehydrogenase from soybean-cell-suspension cultures. Eur. 1979;97:503–509. doi: 10.1111/j.1432-1033.1979.tb13138.x. [DOI] [PubMed] [Google Scholar]
- Armstrong GA, Alberti M, Leach F, Hearst JE. Nucleotide sequence, organization, and nature of the protein products of the carotenoid biosynthesis gene cluster of Rhodobacter capsulatus. Mol Gen Genet. 1989;216:254–268. doi: 10.1007/BF00334364. [DOI] [PubMed] [Google Scholar]
- Storm CE, Sonnhammer ELL. Automated ortholog inference from phylogenetic trees and calculation of orthology reliability. Bioinformatics. 2002;18:92–99. doi: 10.1093/bioinformatics/18.1.92. [DOI] [PubMed] [Google Scholar]
- Remm M, Storm CE, Sonnhammer ELL. Automatic clustering of orthologs and in-paralogs from pairwise species comparisons. J Mol Biol. 2001;314:1041–1052. doi: 10.1006/jmbi.2000.5197. [DOI] [PubMed] [Google Scholar]
- Patthy L. Evolution of the proteases of blood coagulation and fibrinolysis by assembly from modules. Cell. 1985;41:657–663. doi: 10.1016/s0092-8674(85)80046-5. [DOI] [PubMed] [Google Scholar]
- Doolittle RF. The genealogy of some recently evolved vertebrate proteins. Trends Biochem Sci. 1985;10:233–237. doi: 10.1016/0968-0004(85)90140-9. [DOI] [Google Scholar]
- Gene Ontology Consortium. Creating the gene ontology resource: design and implementation. Genome Res. 2001;11:1425–1433. doi: 10.1101/gr.180801. [DOI] [PMC free article] [PubMed] [Google Scholar]
- Costanzo MC, Crawford ME, Hirschman JE, Kranz JE, Olsen P, Robertson LS, Skrzypek MS, Braun BR, Hopkins KL, Kondu P, Lengieza C, Lew-Smith JE, Tillberg M, Garrels JI. YPD, PombePD and WormPD: model organism volumes of the BioKnowledge library, an integrated resource for protein information. Nucleic Acids Res. 2001;29:75–79. doi: 10.1093/nar/29.1.75. [DOI] [PMC free article] [PubMed] [Google Scholar]


