Abstract
To enhance sustainability and resilience against climate change in infrastructure, a quantitative evaluation of both environmental impact and cost is important within a life cycle framework. Climate change effects can lead performance deterioration in bridge components during their operational phase, highlighting the necessity for a risk-based evaluation process aligned with maintenance strategies. This study employs a two-phase life cycle assessments (LCA) framework. First, risk assessments are conducted to evaluate the impact of climate change on steel plate girder bridges and prestressed concrete (PSC) girder bridges under identical structural conditions. The reduction in flexural strength of steel plate girders and PSC girders due to changes in environmental variables such as temperature and relative humidity, induced by various climate change scenarios, was evaluated analytically. Subsequently, life cycle environmental impact and cost assessments were performed, including maintenance outcomes derived from risk assessments. The findings revealed that the environmental impact and cost could increase by approximately 12.4% when climate change is considered, compared to scenarios where it is not taken into account. Sensitivity analyses were performed to identify the key factors influencing environmental impact and cost. The analysis determined that the frequency of preventive maintenance, the recycling rate, and environmental cost coefficient weight in the life cycle assessment significantly affected the results.
Supplementary Information
The online version contains supplementary material available at 10.1038/s41598-024-82568-4.
Keywords: Life cycle assessment, Environmental impact, Life cycle cost, Climate change, Risk assessment, Bridge deterioration
Subject terms: Climate-change impacts, Civil engineering
Introduction
In the context of global climate change, the relationship between the infrastructure industry and its environmental impact has been a focal point of discussions, addressing key concerns such as energy consumption and greenhouse gas emissions1. The crux of mitigating the environmental impact within the infrastructure industry lies in the engineer’s commitment to sustainable decisions in conceptual design and maintenance strategies. Life cycle assessment (LCA) serves as a robust method to evaluate the environmental impact of infrastructure over its entire lifespan2. Through LCA, infrastructure designers and decision-makers can assess the environmental and economic feasibility of their projects in the concept design phase3, fostering more sustainable approaches to maintenance and material selection.
Infrastructures inevitably experience structural performance deterioration over time due to their long design lives, and this deterioration is significantly influenced by both the environmental conditions encountered and ongoing climate changes4. Climate change further complicates the life cycle management of infrastructure, as structures are subject to accelerated deterioration under evolving environmental conditions5. High temperatures, increased relative humidity, and intensified chloride exposure can significantly degrade construction materials, posing long-term risks to infrastructure performance6,7. Given the longevity of infrastructure, these environmental variables heighten the need for a robust maintenance plan integrating climate-adaptive management strategies8. Without maintenance plans considering climate change effects, infrastructure could experience reduced structural integrity, leading to increased repairs that, paradoxically, generate further emissions and exacerbate climate impacts.
This study explores the influence of climate change and material selection on the environmental sustainability of bridge infrastructure. The life cycle environmental impact and cost of two bridge design alternatives are quantified utilizing different primary construction materials, namely, a prestressed concrete (PSC) bridge and a steel plate bridge, under identical site conditions. The PSC girder bridge represents a highway bridge currently under construction in South Korea, while the steel plate girder bridge serves as an alternative design that meets the same code requirements. Corrosion was a mainly focus of the analysis, given its strong correlation with climate change9,10 and its common role as a major degradation factor for both bridge types in this study. A two-phase LCA framework was applied: First, a time-variant risk assessment was conducted, accounting for the deterioration of structural components caused by corrosion considering climate change effects. The influence of corrosive environments on life cycle management was explored under four distinct climate change scenarios. Second, integrating maintenance action data from the risk assessment into the LCA allowed for the quantification of environmental impacts and economic feasibility. The LCA results provide insights into the significance of integrated maintenance strategies, material recycling, and the potential future environmental impacts. Additionally, the proposed bridge LCA framework can support infrastructure designers to extend analysis to other limit states, such as shear and fatigue, and additional performance degradation models.
Literature review
Extensive studies have compared the LCA of various building and infrastructure designs. Gervásio and da Silva11 were early researchers who applied the LCA approach to compare the environmental impact and life cycle cost (LCC) of two alternative solutions: steel composite structures and concrete structures. The comparative analysis revealed that while the concrete solution could be cheaper, the environmental life-cycle analysis favored the steel solution, which achieved a slightly better global score. Du et al.12 provided a guide on using LCA to support bridge procurement decisions by comparing the environmental impact, cumulative energy demand, and atmospheric emission for five different bridge designs. Their sensitivity analysis on monetary weighting systems and input uncertainties showed significant volatility in the outcomes. The results emphasize that clear specifications of key variables are necessary before selecting the most LCA-feasible proposal. Nouri et al.13 found that the design of structures that are more resistant to environmental load can increase initial costs compared to those that are not, but contribute to reducing structural damage, reducing long-term damage costs and reducing total life cycle costs. Desai and Bheemrao14 raised questions about the criteria for material selection in the construction industry and highlighted the importance of LCA-based sustainable construction material selection by comparing the environmental impact of two-story concrete residential buildings using steel or timber reinforcement. Katebi et al.15 performed LCA for roof systems using eight different types of materials to identify a design that minimizes the environmental impact and pinpoint the main sources of pollution. They revealed that the suitability of environmental impact and economic feasibility does not always accompany them. Huang et al.16 used LCA to analyze the comprehensive environmental performance of expressway construction and developed an environmental price model. Their study revealed that material selection is a crucial factor in infrastructure construction.
Moreover, numerous studies have reported that changes in environmental factors (e.g., temperature, relative humidity, chloride, etc.) due to the climate crisis can accelerate the corrosive deterioration of materials in infrastructure. Lin and Wang17 confirmed through accelerated corrosion experiments on carbon steel that a temperature change of 10 ℃ can lead to a weight loss of about 32% due to corrosion. Konovalova18 found that a temperature increase of 10 ℃, based on accelerated corrosion experiments on iron-carbon alloys, increases the corrosion rate by 2.3 times. Stewart et al.6 analyzed that, based on CO2 emission scenarios, the loss of reinforcing steel rebar in concrete structures due to chloride-induced corrosion could be as high as 9.5%. Xie et al.19 found that, under global warming scenarios, the amount of chloride ions on the surface of reinforcing steel rebar could increase by 6–15%. Consequently, attention must be given to maintenance to ensure the preservation of infrastructure performance throughout its lifetime during the climate crisis. Increased maintenance actions following this attention could lead to higher emissions, potentially exacerbating climate change. Qiao et al.20 emphasized the need for maintenance strategies to be transformed with climate change for optimization of LCC. Cadenazzi et al.21 and Han et al.22 reported that notable differences can emerge in the environmental impact and cost throughout the life cycle if technical actions such as member replacement or reinforcement are integrated into the maintenance strategies. However, thorough investigations into maintenance strategies that respond to the effects of climate change are still lacking.
This study addresses a crucial gap in sustainable infrastructure management by examining the combined impact of climate change and material selection on the life cycle environmental impact of bridge designs. While previous studies have assessed bridge life cycles, they often overlook how climate-adaptive maintenance strategies and material choices intersect to influence long-term environmental outcomes. Employing a proposed two-phase LCA framework, this research quantifies the effects of climate-driven corrosion on material degradation and integrates these into a cost-benefit analysis of maintenance actions. This approach offers a more comprehensive view of how adaptive management and optimized material selection can improve environmental impacts and economic feasibility under varying climate scenarios.
Risk assessment considering climate change effects
Limit state function
In this study, the risk-based LCA framework was presented with a focus on the flexural capacity for the limit state Strength I according to the AASHTO LRFD bridge design specification23. The bending failure of the girder, caused by the combined effects of dead load and traffic load, is the most representative limit state considered in bridge design and risk assessment. Numerous previous studies on bridge reliability and risk assessment have primarily focused on evaluating the bending strength limit state of the girder24,25. Risk assessments were conducted on the flexural strength of the maximum positive moment section under the AASHTO design truck load, extending up to the target service life of 100 years. The limit state function for the flexural capacity of the bridge superstructure, varying with time t, is defined as follows:
 |
1 |
where,  is the resistance factor.
  is the time-variant nominal flexural resistance.
  is the load factor for a permanent load.
  represents the nominal bending moments due to permanent load.
  is the nominal bending moments due to live load. The failure probability
  defined as the probability that
  will be less than zero and was calculated using Monte Carlo simulations (MCS). The number of MCS samples was set to 500,000, as determined by a convergence check.
Deterioration modeling
As deterioration progresses over time,  in Eq. (1) gradually decreases, and the failure probability of the bending member increases. This section explains the mechanisms that contribute to the declining strength of PSC girder bridges and steel plate girder bridges.
PSC girder bridge
The primary sources of deterioration in PSC girder bridges are (1) the cross-section loss of reinforcement steel (including steel rebar and prestressing steel) due to corrosion, and (2) the long-term stress loss of prestressing steel. In practice, most composite PSC girders have their neutral axes within the slab when subjected to flexural limits. Consequently, the  , nominal flexural resistance of PSC girder for time
  , considering area loss of reinforcement steel due to corrosion and long-term stress loss of prestressing steel can be defined as Eq. (2), which is a modification of the design equation from AASHTO23.
 |
2 |
where,  ,
,  and
and  are area, tensile stress and distance from extreme compression fiber to the centroid of i-th prestressing steel, respectively.
  and
and  are area and distance from extreme compression fiber to the centroid of j-th steel rebar, respectively.
  is tensile stress of steel rebar and
  is the depth of the equivalent stress block.
  with long-term stress loss of prestressing steel can be calculated according to AASHTO LRFD bridge design specification23.
The most severe corrosion category of reinforcement steel is primarily caused by chloride penetration26. Therefore, reinforcement steel under chloride-induced corrosion is accounted for herein. Corrosion of prestressing steel and steel rebars under the concrete cover occurs when the chloride concentration at the steel surface exceeds a threshold of chloride concentration,  . The chloride concentration in depth x at t,
  , is given empirically by Fick’s second law of diffusion as follows27:
 |
3 |
where  is the chloride ion concentration on the surface of concrete.
  is the Gauss error function, and
  is the diffusion coefficient of chloride ion for inland or marine environment. The chloride transfer in concrete is closely related to environmental conditions and ambient temperature, and these factors can be accelerated by climate change19. The corrected chloride concentration, accounting for temperature and relative humidity, is proposed in de Medeiros-Junior et al.28 as shown in Eq. (4). This was achieved by applying the modified diffusion coefficient proposed in Saetta et al.29.
 |
4 |
where,  is the correction factor representing the influence of temperature (T) according to Arrhenius’ law, as shown in Eq. (5).
  is the correction factor representing the influence of the equivalent maturation time, as shown in Eq. (6).
  is the correction factor representing the influence of relative humidity (RH), as shown in Eq. (7).
 |
5 |
 |
6 |
 |
7 |
where,  is the reference temperature (= 296 K).
  is the activation energy of diffusion (= 44.6 kJ/mol)30,31.
  is the universal gas constant gas constant (= 8.314 J/mol·K).
  is the coefficient defined as the ratio between the diffusion coefficient for
  , which varies from 0 to 1. According to Oh and Jang32, the effect of the time dependence of chloride diffusion for well-cured concrete is not significant. Therefore, constant value 1 is used for
  herein.
  is the actual time of exposure to chloride (days).
  is the humidity at which
  drops halfway between its maximum and minimum value (= 0.75)33.
  increases exponentially as
  increases.
  increases with
  and converges to 1 when
  becomes 1. The mean, coefficient of variation (COV), and distribution type of parameters related to chloride-induced corrosion are shown in Table 1.
Table 1.
Parameters associated with the chloride-induced corrosion.
| Parameter | Mean | COV | Distribution type | Reference |
|---|---|---|---|---|

|
3.35 kg/m3 | 0.375 | Truncated normal (at 0.35 kg/m3) | Val and Stewart63 |
 (marine) (marine) |
2.95 kg/m3 | 0.7 | Lognormal | Val and Stewart63 |
 (inland) (inland) |
1.15 kg/m3 | 0.5 | Lognormal | Val and Stewart63 |
 (marine) (marine) |
212.9 mm2/year | 1.62 | Lognormal | Soliman et al.64 |
 (inland) (inland) |
76.9 mm2/year | 1.22 | Lognormal | Soliman et al.64 |
It is assumed that corrosion of steel reinforcement starts when the  at the level of each steel reinforcement reaches a
  .
.  was determined using the non-uniform loss model of steel reinforcement affected by pitting corrosion34. This model is also applicable to the calculation of
  24. The corrosion pit depth
  and remaining area of the corroded steel reinforcement can be estimated as follows:
 |
8 |
 |
9 |
 |
10 |
 |
11 |
 |
12 |
 |
13 |
where,  is time of corrosion initiation when
  exceeds
  ,
,  is corrosion current density estimated as proposed by Vu and Stewart35, as shown in Eq. (9).
  is coefficient representing ratio between maximum and average corrosion penetration in the range of 4 to 8. w/c is a water/cement ratio (= 0.5).
  is initial diameter of reinforcement steel.
Steel plate girder bridge
The time-variant nominal flexural resistance of steel plate girder bridge  regarding strength degradation is defined based on AASHTO23 as follows:
 |
14 |
where,  is a time-variant plastic moment,
  is a distance from the top of the concrete deck to the neutral axis of the composite section at the plastic moment calculated every time step, and
  is total depth of the composite section. The detail equations of
  according to the location of the neutral axis of the composite section are included in AASHTO23. In this paper, it is assumed that
  gradually decreases with time due to cross-sectional loss due to corrosion. The thickness of the web and bottom plate, which are the main corrosion locations of the steel plate girders36, decreases with corrosion progress. In addition, to account for painting loss during the corrosion process, the coating degradation model for steel plates proposed by Kere and Huang37 was applied. By using this model in conjunction with the corrosion depth over time, the equivalent corrosion depth resulting from painting loss can be calculated. Time-variant corrosion depth of steel member,
  , can be modeled by power law relationship as follows38:
 |
15 |
where,  is time after corrosion initiation, p and q are corrosion parameters determined from the regression analysis of experimental data, which have three corrosive environmental conditions, namely, rural, urban, and marine environments38.
The actual environmental corrosive conditions for field-exposed materials are dynamic and influenced by multiple environmental factors. According to Cai et al.9, RH and T were identified as the most influential factors for steel corrosion. Therefore, this study focuses on correcting the effects of T and RH on steel corrosion. A revised corrosion model that accounts for the integrated effects of the dynamic corrosive environment is presented as follows9:
 |
16 |
 |
17 |
 |
18 |
where,  is accelerating factor for T and RH, which increases exponentially as T and RH increase39.
  is the probability density functions (PDF) of T.
  is the conditional PDF of RH given T.
  is constant (= 0.1141) estimated from experimental data of Huang et al.40.
  is a reference relative humidity, which is also the average relative humidity.
  is the activation energy of corrosion (= 50.4 kJ/mol) according to Konovalova18.
  is a reference temperature and also the average temperature.
Climate change scenarios
Four representative scenarios were selected based on the AR6 Synthesis Report41: scenario 0 (Without climate change); scenario 1 (Low/SSP1-2.6/RCP2.6); scenario 2 (Intermediate/SSP2-4.5/RCP4.5); scenario 3 (Very high/SSP5-8.5/RCP8.5). scenarios 1 to 3 predict climate change based on different trajectories of greenhouse gas emissions: achieving net zero emissions by 2070, maintaining the current level by 2050, and doubling the current level by 2050, respectively. Based on the predicted trends in average temperature changes for each climate change scenario in the report, future temperature data for the next 100 years were generated by adjusting the annual average temperature with constant COV. In addition, relative humidity has been found to exhibit a clear cointegration with temperature42. Therefore, in this study, the probability distribution and correlation between environmental variables were derived using atmospheric data collected by the Korea Meteorological Administration43 over 10 years from 2014 to 2023. The probability distribution of temperature in South Korea was investigated to follow a normal distribution44. Moreover, the probability distribution of relative humidity, when averaged over time and space, also approaches a normal distribution, with the bimodality diminishing45. Table 2 shows the mean, standard deviation, and correlation coefficient of the collected environmental variable data. As previously mentioned, due to the strong correlation between temperature and relative humidity, future relative humidity data for the next 100 years were sampled using multivariate Gaussian distributions to account for the interdependence with generated future temperature data. Based on the generated environmental variable data, the correction factors for chloride penetration and steel corrosion were derived. Figure 1 shows the changes in the mean values of generated future temperature and relative humidity data over 100 years.
Table 2.
Environment variables in South Korea (2014–2024).
| Statistic | T (℃) | RH (%) |
|---|---|---|
| Mean | 13.3 | 68.3 |
| COV | 0.71 | 0.19 |
| Correlation coefficient for T | 1 | 0.574 |
Fig. 1.
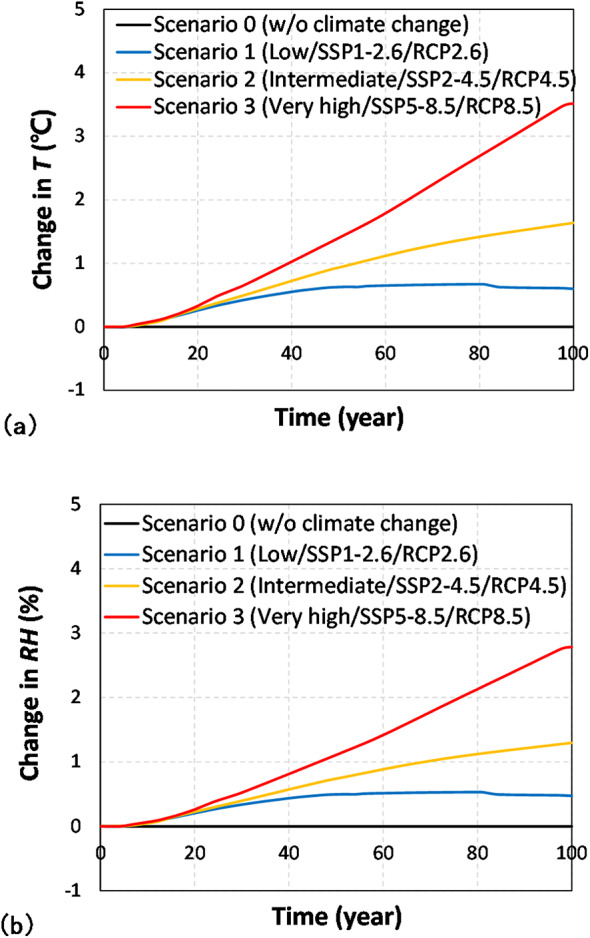
Change in the future environmental variable. (a) temperature. (b) relative humidity.
Maintenance strategy
Throughout the use stage, the maintenance strategies for the bridge were broadly categorized into preventive maintenance (PM), such as patching and repainting, and essential maintenance (EM), such as girder replacement and reconstruction46. The demands for maintenance action according to environmental conditions and climate change scenarios were estimated based on the risk assessment results. Since the PM interval ( ) may vary depending on the rules or budgets of the bridge operators, LCA was performed by changing
  to 5, 10, and 15 for the parameter study. EM of girder replacement was set to occur when the failure probability (
 ) reached the target failure probability (
 ) of 0.6% according to AASHTO MBE47. The corrosion rate can be initialized by PM, and the corrosion damage is initialized by EM. By performing risk assessment while changing the climate change scenario and
  , the number of PM and EM occurrences in the use stage was calculated probabilistically. This increase in the number of maintenance cycles directly led to an increase in environmental impact and cost.
Life cycle assessment
The bridge LCA was carried out following ISO 14040 48, 14044 49, and 21930 50. The system boundary was defined as cradle-to-cradle, including the potential benefits and loads of a circular economy. The production and construction stage (stage A) were calculated based on the bridge design bill of quantities (BOQ). Stage A includes the production of construction materials, but excludes material transport to the construction site and the operation of construction equipment. The use stage (stage B) was determined according to the number of maintenance actions (i.e., PM and EM) obtained from the risk assessment results. Stage B covers the production of maintenance materials anticipated over the life cycle but does not include transport to the site or maintenance equipment operation. The end-of-life stage (stage C) is calculated from the amount of waste generated, excluding the portion that is recycled, from the combined total of the amounts from stage A and stage B. Stage C includes equipment operation for bridge demolition and waste landfilling. For the assessment of the circular economy (stage D), adherence to ISO 20915 51 is crucial for accurately evaluating industry-specific data and the losses and benefits associated with recycling processes.
Cost assessment
The bridge LCC includes material purchase cost, construction cost, maintenance action cost, deconstruction cost, disposal cost, recycling cost. For the realistic assessment of the bridge LCC in South Korea, the material price database52, annual maintenance cost model, and deconstruction, disposal, and recycling costs53 were applied. The annual maintenance cost model covers all costs associated with actions taken throughout the entire lifetime of the bridge, addressing issues such as crack, efflorescence, peeling, corrosion, painting, and other maintenance actions occurring in the superstructure (slab and girder) and the substructure (abutment and pier). Due to the high uncertainty of bridge maintenance costs, which are influenced by factors like location, damage condition, and maintenance period, maintenance costs in LCC at the design phase was simply assessed using generalized statistical data. The superstructure replacement cost is estimated to be 133% of the initial superstructure construction cost22,54. Labor costs for construction workers were calculated at 33% of the total project budget55. Table 3 shows the surveyed unit price of the bridge LCC.
Table 3.
Unit price of bridge LCC.
| Bridge type | Category | Unit price |
|---|---|---|
| PSC girder bridge | Superstructure maintenance | 137 KRW/m2/year |
| Deconstruction, disposal, and recycling | 759,373 KRW/m2/m | |
| Steel plate girder bridge | Superstructure maintenance | 44 KRW/m2/year |
| Deconstruction, disposal, and recycling | 943,190 KRW/m2/m | |
| Common | Substructure maintenance | 66,030 KRW/# of substructure/year |
Environmental impact assessment
The OpenLCA56, utilizing the ecoinvent database (DB)57, was employed for the environmental impact assessment. In cases where the product information was absent in the ecoinvent DB, the industrial environmental product declaration (EPD) DB registered in PASS58, the LCA software developed by Korea Environmental Industry and Technology Institute (KEITI), was utilized. Environmental data related to all included materials throughout the bridges’ lifetimes were gathered and characterized using the ReCiPe 2016 Midpoint (E) method59, yielding results for the six environmental impact categories:
Global warming potential (GWP): It primarily relates to the emission of greenhouse gases such as carbon dioxide, methane, and nitrous oxide, contributing to the rise in Earth’s temperatures.
Abiotic depletion potential (ADP): It assesses the extent to which the production of a substance uses up Earth’s non-living resources (such as metals and fossil fuels) and the risk of depleting these resources.
Ozone depletion potential (ODP): It measures the ability of a chemical substance to degrade the Earth’s ozone layer. Substances like chlorofluorocarbons (CFCs) belong to this category.
Acidification potential (AP): It measures the ability of emissions to form acid rain when released into the atmosphere. Sulfur oxides (SOx) and nitrogen oxides (NOx) are primarily responsible.
Photochemical ozone creation potential (POCP): It measures the capacity of certain chemicals to form ground-level ozone through photochemical reactions in the atmosphere. Ground-level ozone is a major component of smog, harmful to human respiratory health, and can damage crops and materials.
Eutrophication potential (EP): This indicator quantifies the degree to which a substance can increase nutrient levels (particularly nitrogen and phosphorus) in aquatic environments, excessively promoting algae growth and eventually leading to oxygen depletion in water bodies.
Environmental impacts, considering loss and benefits from the recycling of steel, were determined based on data provided by Korean industries and environmental reports60. The recycling rate of steel was commonly applied as 40.2%, reflecting the proportion of steel scrap used in crude steel production in South Korea in 202161.
Additionally, a monetary valuation was conducted to provide an intuitive understanding of the environmental impact. Amadei et al.62 collected monetary valuation coefficients (MVCs) for environmental impacts. Table 4 shows the reference units, maximum, minimum, and average values of MVCs according to the six impact categories.
Table 4.
MVCs per reference unit for impact categories62.
| Impact category | Reference unit | Max. value (€) | Min. value (€) | Average value (€) |
|---|---|---|---|---|
| GWP | ton CO2 eq. | 685 | 29.5 | 272 |
| ADP | 10 kg Cu eq. | 109.44 | 0.022 | 18.36 |
| ODP | kg CFC-11 eq. | 115 | 31.6 | 55.5 |
| AP | kg SO2 eq. | 15.9 | 0.215 | 4.07 |
| POCP | kg NOx eq. | 4.03 | 0.000667 | 1.02 |
| EP | kg PO43− eq. | 76.6 | 0.645 | 10.08 |
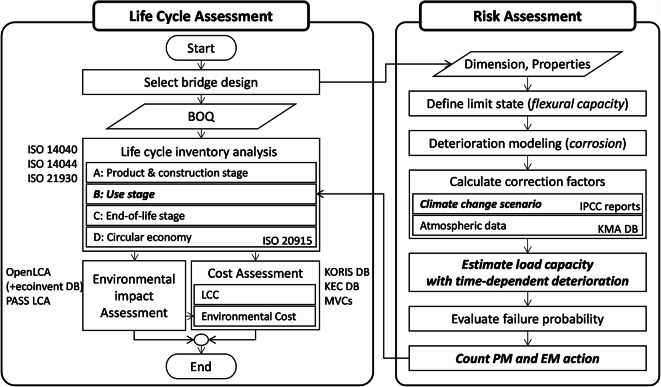
Figure 2 illustrates the proposed framework of the risk-based bridge LCA method considering the climate change effect. The initial quantities based on the BOQ are calculated from the design that meets the target performance of the bridge. From the initial quantities, the cost and environmental impact during the stage A can be determined. Next, based on environmental conditions and climate change scenarios, a risk assessment is performed to account for the deterioration of member strength over time. Using the results of the risk assessment, the life cycle PM and EM action demands are estimated, leading to costs and environmental impacts during the stage B. In the stage C, the environmental impact and cost of treating residual waste, excluding recycling, are calculated. Finally, in the stage D, the potential benefits in terms of environmental impact and cost, based on the material recycling rate, are determined. All results from stages A to D are combined to calculate the total environmental impact and LCC over the bridge’s lifespan.
Fig. 2.
Conceptual procedure of the proposed risk-based LCA considering climate change.
Case study
Designed bridges
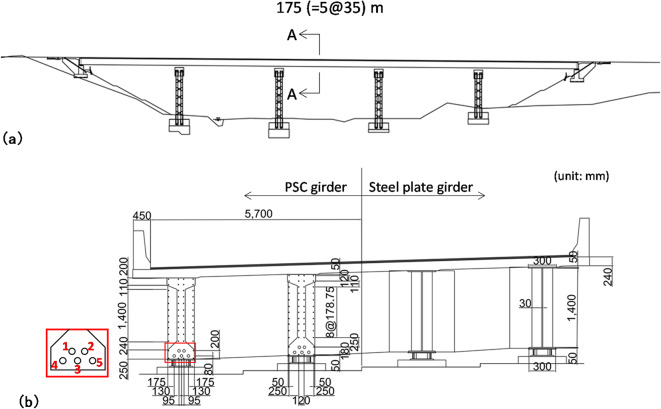
Case studies were conducted to verify the feasibility of the proposed framework in this study. The target bridges are the PSC girder bridge currently under construction in South Korea and the steel plate girder bridge, which was considered as a design alternative. Figure 3 shows the side view and cross-sections of girders to be evaluated. The target bridge for design consists of four girders with a total width of 12.3 m and a total length of 175 m (5 spans at 35 m each). The BOQ of the two bridge design alternatives is attached in Supplementary Material.
Fig. 3.
Target bridge. (a) side view. (b) cross-sections.
Properties for calculating  are as follows:
  = 893 MPa, 871 MPa, 852 MPa, 830 MPa, 807 MPa for the i-th prestressing steel, respectively. Each PSC tendon consists of 12 strands with a diameter of 12.9 mm.
  = 15.9 mm.
  = 300 MPa. The numbers for the i-th prestressing steel are indicated in the red box in Fig. 3b. HSB380, bridge structural steel, was applied to the main member of the steel plate girder bridge.
Risk assessment
The maximum load effect including permanent load and live load acting on the flexural member calculated according to the bridge property and AASHTO design truck is 10,203 kN·m and 7,273 kN·m on the PSC girder bridge and steel plate girder bridge, respectively. The environmental condition in the risk assessment is assumed as marine where the most vulnerable condition for deterioration of chloride penetration and steel corrosion.
Figure 4 shows the correction factors for concrete chloride penetration for each climate change scenario over time. The correction factors proportionally accelerate the corrosive deterioration according to the severity of climate change. Compared to scenario 0, climate change scenario 3 may increase the comprehensive correction factor  by 29%, 15%, and 48%, respectively.
Fig. 4.
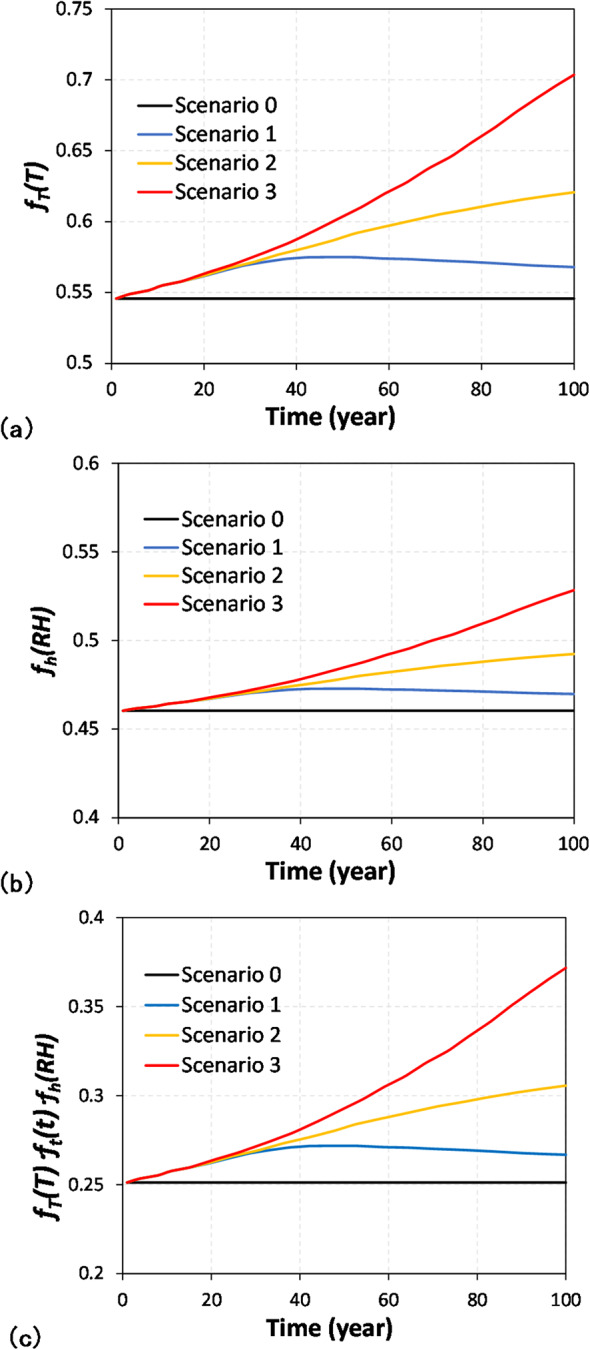
Correction factors for concrete chloride penetration. (a) fT(T). (b) fh(RH). (c) fT(T)·ft(t)·fh(RH).
Figure 5 shows the results of time-varying risk assessments and the corresponding variation of chloride concentration in the PSC girder bridge with a  of 10 years. As shown in Fig. 5a, compared to scenario 0, chloride concentration increased by up to 8%, 25%, and 61% for each respective climate change scenario. The failure probability also increased by up to 50% (from 0.2 to 0.3%) over 100 years, depending on the severity of climate change, as shown in Fig. 5b. However, the impact of climate change on the increase in the failure probability was not significant enough to necessitate additional EM demand. Therefore, the final life cycle EM demand was evaluated as zero.
Fig. 5.
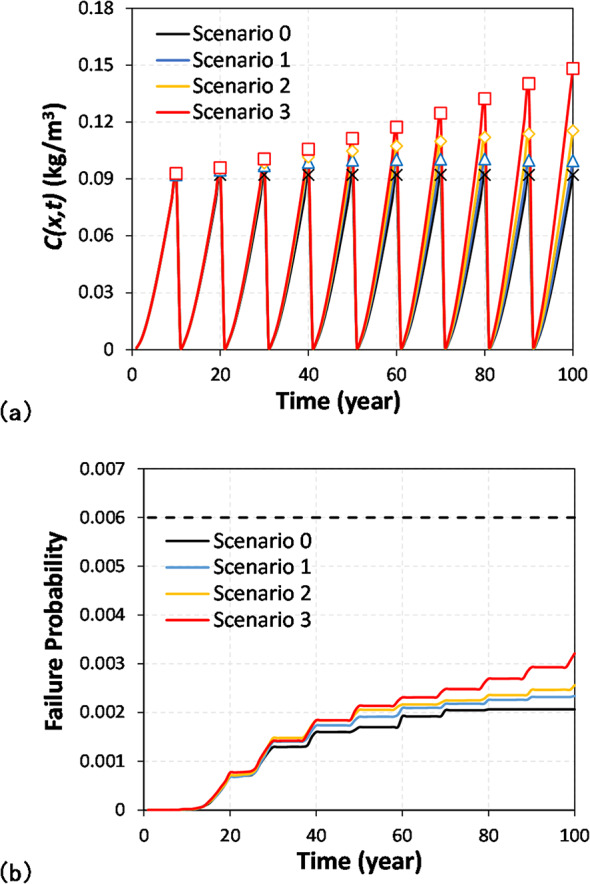
Times-varied risk assessment results of the PSC girder bridge with  of 10 years. (a) C(x, t). (b) failure probability.
Figure 6 shows the correction factor  by climate change scenarios.
  changed sensitively to the severity of climate change compared to other correction factors due to the influence of high correlation between T and RH.
  increased in climate change scenario 3 by 32% compared to scenario 0, which directly means a 32% increase in corrosion depth.
Fig. 6.
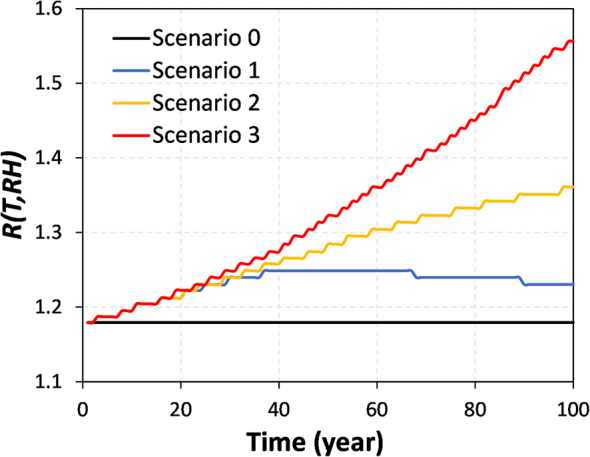
Correction factors for steel corrosion R(T, RH).
Figure 7 shows the results of the time-varied risk assessment for the steel girder bridge with a  of 10 years. As shown in Fig. 7a, the corrosion growth rate could accelerate according to climate change scenarios due to the correction factor. Figure 7b illustrates the failure probability of each climate change scenario. The failure probability increases according to the severity of the climate change scenarios. Since failure probability exceeded the
  during the target life in scenarios 1 to 3, the number of EM requirements was added once as shown in Fig. 7b.
Fig. 7.
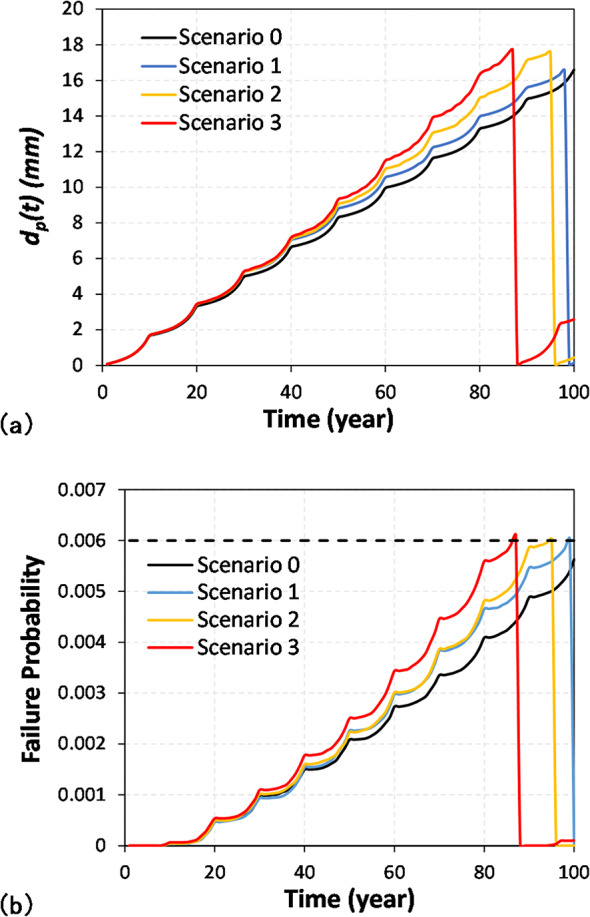
Times-varied risk assessment results of steel girder bridge with  of 10 years. (a) dp(t). (b) failure probability.
Environmental impact
Figure 8 showcases the environmental impact during the life cycle of the PSC bridge with a  of 10 years, considering the PM and EM determined by risk assessment. Since the number of maintenance actions is identical across all scenarios, with zero EM and nine PMs, the evaluation results for environmental impact remain consistent. The environmental impact during the stage B arises from these nine PM actions and constitutes under 3% of the total depending on the category. This is a very low value compared to stage A, which accounts for 85 to 99%, or stage D, which accounts for up to 32%.
Fig. 8.
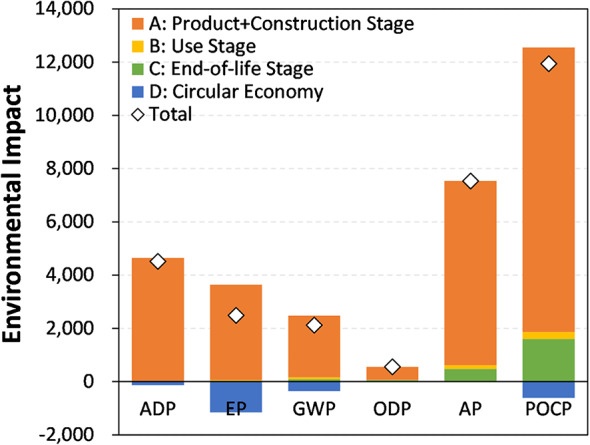
Environmental impact of PSC girder bridge (scenario 0–3).
Figure 9 shows the life cycle environmental impact of the steel plate girder bridge assessed based on the number of PM and EM demands with a  of 10 years. When only PM such as repainting was considered, the stage B accounted for a very small proportion of less than 1% of the total environmental impact, as shown in Fig. 9a. However, the demand for additional EM due to the effects of climate change significantly increased the environmental impact of stage B, and accounted for a proportion of 8–11% of the total depending on the category, as shown in Fig. 9b.
Fig. 9.
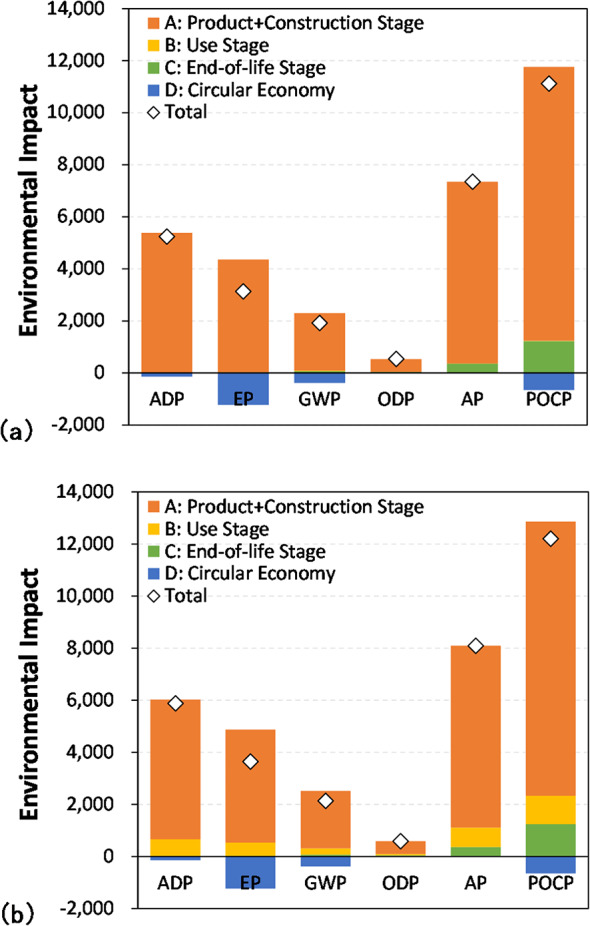
Environmental impact of steel girder bridge. (a) scenario 0. (b) scenario 1–3.
Figure 10 compares the life cycle environmental impacts of scenarios 0 and 3 of the two bridge designs. When comparing the environmental impact of each material during the stage A, the steel components showed a dominant contribution to ADP and EP, with steel accounting for around 90% of these impacts. As a result, the steel plate girder bridge exhibited higher ADP and EP values compared to the PSC girder bridge across all scenarios. On the other hand, the PSC girder bridge had higher environmental impact scores in the remaining four categories, mainly due to the significant proportion of the environmental impact attributed to concrete, which ranged between 20 and 40%. In Scenario 3, however, due to the requirement for EM on the steel girder bridge throughout its life cycle, the steel girder bridge was evaluated to have higher environmental impacts in all categories. This increase was driven by the additional steel demands necessitated by girder replacement, significantly raising the overall environmental impact of the steel bridge by approximately 8–10%. Therefore, considering the impact of climate change in stage B is crucial, as it is directly correlated with the environmental conditions that accelerate structural deterioration and increase the EM demand.
Fig. 10.
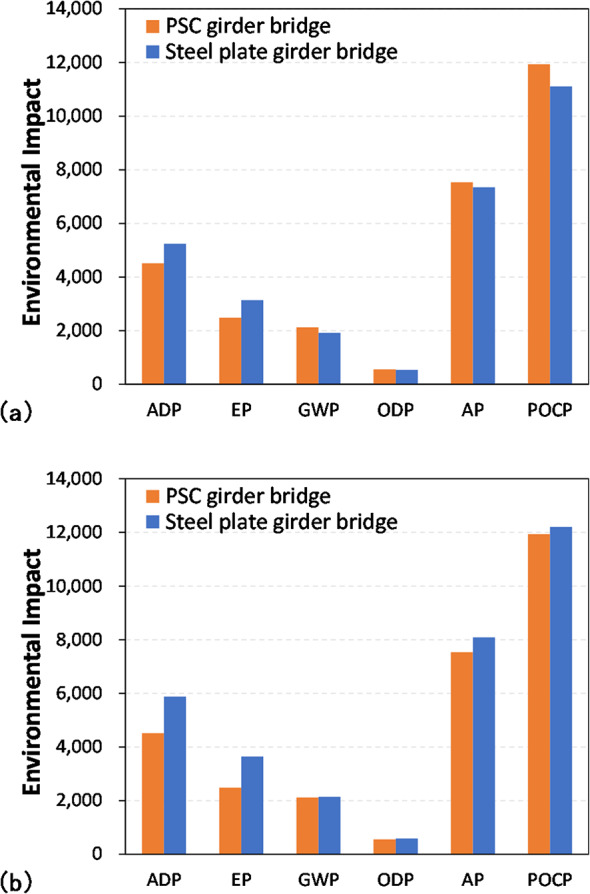
Comparison of Environmental Impacts. (a) scenario 0. (b) scenario 3.
The sensitivity analysis concerning the recycling rate was also performed for scenario 3 of the two bridge designs. We investigated the influence of potential benefits from recycling on the environmental impact of bridges by changing the recycling rate of steel from 0 to 100%, as depicted in Fig. 11. The analysis shows that the EP varies up to 4.8 times, and GWP 1.6 times depending on the recycling rate. Specifically, in GWP, the comparative results could reverse based on the recycling rate. These fluctuations highlight the substantial environmental benefits of recycling. In addition, the higher quantity of steel in the steel plate girder bridge leads to a larger fluctuation in environmental impacts relative to the PSC girder bridge, dependent on the recycling rate. This variability confirmed that the recycling rate could significantly influence the LCA, underscoring the importance of applying an appropriate recycling rate.
Fig. 11.
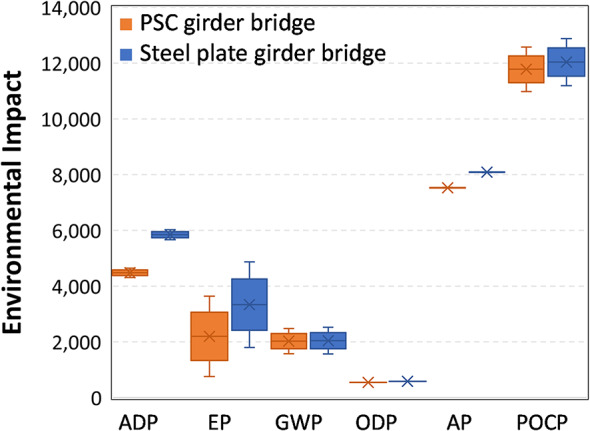
Sensitivity analysis result for recycling rate (scenario 3).
Economic feasibility
Table 5 displays the LCC calculation results for scenarios 0 and 3 of the two bridge designs. The change in the number of EM requirements leads to a reversal in the total LCC for the two bridges. Similar to environmental impacts, considering climate change effects at the stage B is a significant variable in design. Table 6 illustrates the conversion of the environmental impacts in Fig. 10 into environmental costs using the MVCs from Table 4. As with LCC, the change in the number of EM, due to consideration of the impact of climate change, results in a reversal of the environmental costs of the two bridges. Figure 12 compares LCC and the maximum environmental cost. Compared to LCC, the environmental cost can be evaluated up to 71%, and its proportion is expected to increase significantly in the future if the importance of environmental impact increases from the present.
Table 5.
Summary of LCC.
| Cost (unit: 108 KRW) | PSC bridge scenario 0–3 |
Steel bridge scenario 0 |
Steel bridge scenario 3 |
|---|---|---|---|
| Construction material | 27.6 | 28.4 | 28.4 |
| Labor | 13.8 | 14.2 | 14.2 |
| Maintenance | 0.4 | 0.3 | 5.3 |
| Deconstruction, disposal, and recycling | 9.6 | 7.1 | 8.9 |
| Total | 51.4 | 50.0 | 56.8 |
Table 6.
Summary of environmental costs.
| PSC bridge scenario 0–3 | Steel bridge scenario 0 |
Steel bridge scenario 3 |
|
|---|---|---|---|
| Max (108 KRW) | 35.6 | 35.3 | 39.6 |
| Min (108 KRW) | 1.25 | 1.16 | 1.29 |
| Average (108 KRW) | 11.4 | 10.8 | 12.1 |
Fig. 12.
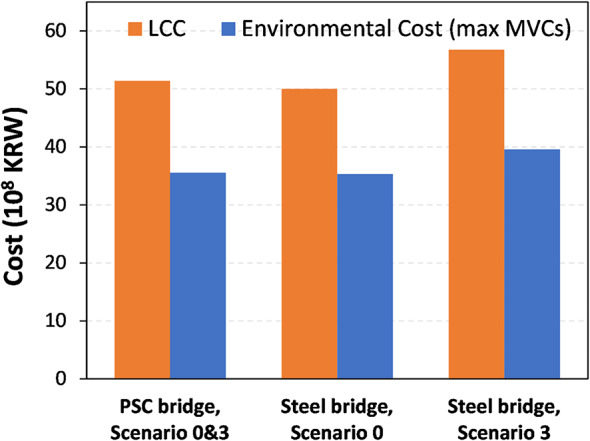
Comparison of LCC and environmental cost.
Effect of PM interval
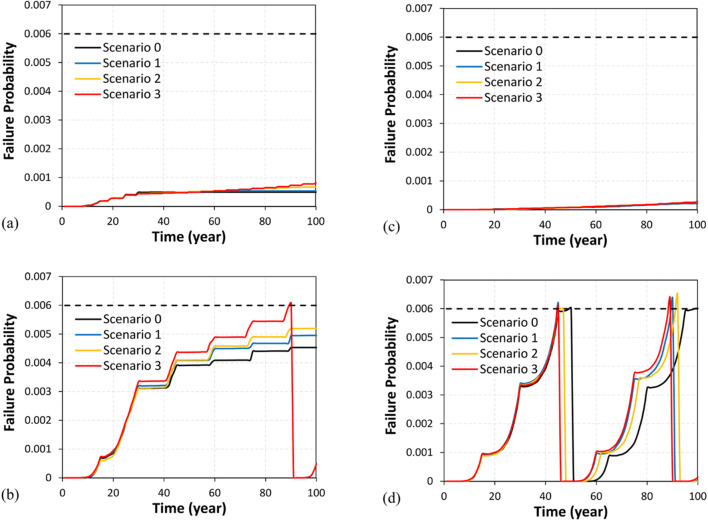
Changes in the frequency of PM according to maintenance strategies can profoundly influence the failure probability of the bridges. Additional risk assessments were performed with  of 5 years and 15 years (i.e., 10 years
  50%). In the LCC, PM costs were calculated in proportion to the change in the number of PMs according to
  for each case. Figure 13 illustrates the failure probability evaluated based on the change in
  for each bridge design. For the PSC girder bridge, the failure probability did not exceed the
  , even when the
  was reduced to 5 years. However, when the
  was increased to 15 years, the failure probability exceeded
  once in scenario 3, resulting in the occurrence of EM demand.
Fig. 13.
Risk assessment results according to PM interval. (a) PSC girder bridge ( = 5 years). (b) PSC girder bridge (
 = 15 years). (c) steel plate girder bridge (
 = 5 years). (d) steel plate girder bridge (
 = 15 years).
For the steel plate girder bridge, with an initially assumed  of 10 years, the failure probability exceeded
  twice in climate change scenarios 1 to 3. However, when the
  was reduced to 5 years, it did not exceed
  in any climate change scenario. Conversely, increasing
  to 15 years resulted in the failure probability exceeding
  in scenarios 0 and 1 to 3 once or twice, respectively, necessitating additional EM demand.
Figure 14 shows the environmental cost including life cycle PM and EM demands, as well as the total cost combined with LCC based on change in  . In scenario 0, the shorter the
  the more economical the steel plate girder bridge becomes compared to the PSC girder bridge. This is because, in the absence of EM demands, the steel plate girder bridge is evaluated to have lower LCC and environmental costs than the PSC girder bridge. From the results of the steel plate girder bridge in scenario 0 and the PSC girder bridge in scenario 3, the total cost was found to be lowest when
  is 10 years, characterized by a low number of PMs and no EM being induced. Furthermore, in both scenarios 0 and 3, the total cost of the two bridge types is reversed depending on the change in
  . This highlights that identifying the optimal point to reduce the number of PMs without inducing EM can significantly improve the environmental impact and LCC of the bridge.
Fig. 14.
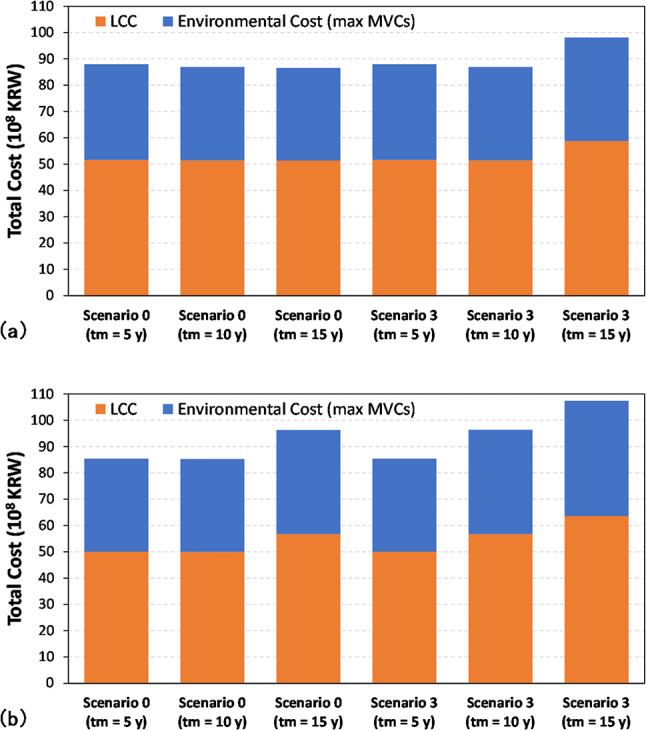
Total Cost according to PM interval. (a) PSC girder bridge. (b) steel plate girder bridge.
Conclusion
This study systematically evaluated the life cycle environmental and economic impacts of two bridge designs-PSC girder and steel plated girder bridges-under varying climate change scenarios. Correction factors for concrete chloride penetration and steel corrosion, derived from weather statistics in South Korea and IPCC climate change scenarios, were integrated into the risk assessment to assess the climate change effect. In both bridge design cases, the failure probability increased with the severity of the climate change scenario. The risk assessment results suggest that climate change may impact the failure probabilities and maintenance demands. Moreover, the analysis underscored the critical role of the recycling rate in determining the environmental impacts. Based on the proposed framework, an optimized maintenance strategy can be established during the climate crisis, taking into account both cost and environmental impact. The BOQ, material, and construction unit prices used in this study were based on data from South Korea. As the LCA results may change with future improvements in the database or modifications to the manufacturing process, it is advisable to focus more on trends rather than specific figures. The key findings include:
In the case of steel plate girder bridges with a PM interval of 10 years, the failure probability, exacerbated by steel corrosion correction for climate change effects, exceeded the target failure probability of 0.6% over the lifetime. This increased failure probability necessitated a demand for life cycle EM to address these risks. On the other hand, for PSC bridges under the same conditions, the expected change in failure probability due to climate change was relatively insignificant, and the need for EM remained unchanged.
A sensitivity analysis of the life cycle environmental impact relative to the recycling rate was performed. In the environmental impacts of EP and GWP, fluctuations of up to 4.8 times and 1.6 times, respectively, were observed. In particular, in GWP, the environmental impact of the two bridge designs could be reversed depending on the recycling rate. This result quantitatively suggests that the outcomes of LCA can be significantly improved by increasing the recycling rate.
The environmental impact of PM during the use stage (stage B) is less than 3% for the PSC girder bridge and less than 1% for the steel girder bridge, representing a very small portion of the overall environmental impact categories. However, the environmental impacts and costs associated with EM can significantly influence the overall LCA results. Therefore, it is crucial to predict and incorporate the potential demand for EM, in addition to PM, by employing a risk-based LCA that considers the climate change effect during the design phase.
When the maximum MVCs were applied, environmental costs were evaluated at up to 71% of LCC. If the weight for environmental impacts increases in the future, environmental costs may become a more important evaluation index than LCC as the relative proportion of LCC increases.
Changes in the PM interval is directly related to the failure probability of the bridge. Decreasing the PM interval increases PM demand but decreases EM demand while increasing the PM interval has the opposite effect. Regardless of the climate change scenario, the total cost of the PSC girder bridge and the steel girder bridge is observed to reverse depending on changes in the PM interval. However, a shorter PM interval does not always guarantee better LCC and environmental outcomes. From the results of the steel plate girder bridge in Scenario 0 and the PSC girder bridge in Scenario 3, the total cost was found to be lowest when the PM interval was set to 10 years. This interval is characterized by a low number of PM activities and the absence of EM demands. Therefore, it is crucial to optimize the bridge life cycle maintenance demand based on risk evaluation. This optimization can significantly improve the life cycle environmental impact and LCC assessment results.
This study is limited to examining the effects of corrosion and flexural performance deterioration due to climate change. Given that the proposed bridge LCA framework has proven applicable, future research should expand to include limit states such as shear and fatigue, as well as other deterioration phenomena, such as shrinkage, frost damage, and etc. Also, additional life cycle environmental impact and cost assessments should be conducted incorporating material transport, construction equipment operation, and maintenance measures based on real-world industrial data.
Electronic supplementary material
Below is the link to the electronic supplementary material.
Acknowledgements
This work is supported by POSCO and the Korea Agency for Infrastructure Technology Advancement (KAIA) grant funded by the Ministry of Land, Infrastructure and Transport (Grant RS-2023-00250727) through the Korea Floating Infrastructure Research Center at Seoul National University.
Author contributions
All authors contributed to the conception and design of the study. Material preparation, data collection, and analysis were performed by Sang Hyeon Lee and Lee-Sak An. Sang Hyeon Lee wrote the first draft of the manuscript, and Lee-Sak An and Ho-Kyung Kim revised it. Ho-Kyung Kim supervised the project. All authors read and approved the final manuscript.
Data availability
Additional data can be made available at request to the corresponding author, with exception of confidential data from LCA model applied in this study.
Declarations
Competing interests
The authors declare no competing interests.
Footnotes
Publisher’s note
Springer Nature remains neutral with regard to jurisdictional claims in published maps and institutional affiliations.
Contributor Information
Lee-Sak An, Email: peacefulan@snu.ac.kr.
Ho-Kyung Kim, Email: hokyungk@snu.ac.kr.
References
- 1.Barbhuiya, S. & Das, B. B. Life Cycle Assessment of construction materials: Methodologies, applications and future directions for sustainable decision-making. Case Stud. Constr. Mater., e02326 (2023). 10.1016/j.cscm.2023.e02326
- 2.França, W. T. et al. Integrating life cycle assessment and life cycle cost: A review of environmental-economic studies. Int. J. Life Cycle Assess.26, 244–274. 10.1007/s11367-020-01857-y (2021). [Google Scholar]
- 3.Kanyilmaz, A., Dang, V. H. & Kondratenko, A. How does conceptual design impact the cost and carbon footprint of structures? Struct58, 105102 (2023). [Google Scholar]
- 4.Biondini, F. & Frangopol, D. M. Life-cycle performance of deteriorating structural systems under uncertainty. J. Struct. Eng.142, F4016001. 10.1061/(asce)st.1943-541x.0001544 (2016). https://doi.org/https://doi.org/ [Google Scholar]
- 5.Kasraei, A. et al. Climate change impacts assessment on railway infrastructure in urban environments. Sustain. Cities Soc.101, 105084 (2024). [Google Scholar]
- 6.Stewart, M. G., Wang, X. & Nguyen, M. N. Climate change impact and risks of concrete infrastructure deterioration. Eng. Struct.33, 1326–1337. 10.1016/j.engstruct.2011.01.010 (2011). [Google Scholar]
- 7.Wang, X., Stewart, M. G. & Nguyen, M. Impact of climate change on corrosion and damage to concrete infrastructure in Australia. Clim. Change. 110, 941–957 (2012). [Google Scholar]
- 8.Shehadeh, A., Alshboul, O. & Tamimi, M. Integrating climate change predictions into infrastructure degradation modelling using advanced markovian frameworks to enhanced resilience. J. Environ. Manag. 368, 122234 (2024). [DOI] [PubMed] [Google Scholar]
- 9.Cai, Y., Zhao, Y., Ma, X., Zhou, K. & Chen, Y. Influence of environmental factors on atmospheric corrosion in dynamic environment. Corros. Sci.137, 163–175. 10.1016/j.corsci.2018.03.042 (2018). [Google Scholar]
- 10.Nguyen, M., Wang, X. & Leicester, R. An assessment of climate change effects on atmospheric corrosion rates of steel structures. Corros. Eng. Sci. Technol.48, 359–369 (2013). [Google Scholar]
- 11.Gervásio, H. & da Silva, L. S. e. Comparative life-cycle analysis of steel-concrete composite bridges. Struct. Infrastruct. Eng. 4, 251–269 (2008). 10.3390/ma14154218
- 12.Du, G., Safi, M., Pettersson, L. & Karoumi, R. Life cycle assessment as a decision support tool for bridge procurement: Environmental impact comparison among five bridge designs. Int. J. Life Cycle Assess.19, 1948–1964. 10.1007/s11367-014-0797-z (2014). [Google Scholar]
- 13.Nouri, A., Asadi, P. & Taheriyoun, M. Life-cycle cost analysis of seismic designed RC frames including environmental and social costs. J. Earthq. Eng.26, 5958–5977 (2022). [Google Scholar]
- 14.Desai, A. & Bheemrao, N. Life cycle assessment of construction materials and its environmental impacts for sustainable development. Mater. Today: Proc.65, 3866–3873. 10.1016/j.matpr.2022.07.171 (2022). [Google Scholar]
- 15.Katebi, A., Tushmanlo, H. S. & Asadollahfardi, G. Environmental life cycle assessment and economic comparison of different roof systems. J. Build. Eng.76, 107316. 10.1016/j.jobe.2023.107316 (2023). [Google Scholar]
- 16.Huang, Y. et al. Environmental economic profiles of expressway construction via life cycle assessment. Environ. Impact Assess. Rev.104, 107359. 10.1016/j.eiar.2023.107359 (2024). https://doi.org/https://doi.org/ [Google Scholar]
- 17.Lin, C. C. & Wang, C. X. Correlation between accelerated corrosion tests and atmospheric corrosion tests on steel. J. Appl. Electrochem.35, 837–843. 10.1016/0010-938x(89)90066-8 (2005). [Google Scholar]
- 18.Konovalova, V. The effect of temperature on the corrosion rate of iron-carbon alloys. Mater. Today: Proc.38, 1326–1329. 10.1016/j.matpr.2020.08.094 (2021). [Google Scholar]
- 19.Xie, H. B., Wang, Y. F., Gong, J., Liu, M. H. & Yang, X. Y. Effect of global warming on chloride ion erosion risks for offshore RC bridges in China. KSCE J. Civ. Eng.22, 3600–3606. 10.1007/s12205-018-1547-8 (2018). [Google Scholar]
- 20.Qiao, Y., Dawson, A. R., Parry, T. & Flintsch, G. W. Evaluating the effects of climate change on road maintenance intervention strategies and life-cycle costs. Transp. Res. Part. D: Transp. Environ.41, 492–503 (2015). [Google Scholar]
- 21.Cadenazzi, T., Dotelli, G., Rossini, M., Nolan, S. & Nanni, A. Cost and environmental analyses of reinforcement alternatives for a concrete bridge. Struct. Infrastruct. Eng.16, 787–802. 10.1080/15732479.2019.1662066 (2020). [Google Scholar]
- 22.Han, X., Yang, D. Y. & Frangopol, D. M. Optimum maintenance of deteriorated steel bridges using corrosion resistant steel based on system reliability and life-cycle cost. Eng. Struct.243, 112633. 10.1016/j.engstruct.2021.112633 (2021). [Google Scholar]
- 23.AASHTO. AASHTO LRFD Bridge Design Specification (American Association of State Highway and Transportation Officials (AASHTO), 2020).
- 24.Al-Mosawe, D., Neves, L. & Owen, J. Reliability analysis of deteriorated post-tensioned concrete bridges: The case study of Ynys-y-Gwas bridge in UK. Struct41, 242–259. 10.1016/j.istruc.2022.04.094 (2022). [Google Scholar]
- 25.Han, X., Yang, D. Y. & Frangopol, D. M. Risk-based life-cycle optimization of deteriorating steel bridges: investigation on the use of novel corrosion resistant steel. Adv. Struct. Eng.24, 1668–1686. 10.1177/1369433220980529 (2021). [Google Scholar]
- 26.Gonzalez, J., Andrade, C., Alonso, C. & Feliu, S. Comparison of rates of general corrosion and maximum pitting penetration on concrete embedded steel reinforcement. Cem. Concr Res.25, 257–264. 10.1016/0008-8846(95)00006-2 (1995). [Google Scholar]
- 27.Crank, J. The Mathematics of Diffusion (Oxford University Press, 1979).
- 28.de Medeiros-Junior, R. A., de Lima, M. G. & de Medeiros, M. H. Service life of concrete structures considering the effects of temperature and relative humidity on chloride transport. Environ. Dev. Sustain.17, 1103–1119. 10.1007/s10668-014-9592-z (2015). [Google Scholar]
- 29.Saetta, A. V., Scotta, R. V. & Vitaliani, R. V. Analysis of chloride diffusion into partially saturated concrete. Mater. J.90, 441–451. 10.14359/3874 (1993). [Google Scholar]
- 30.Page, C., Short, N. & El Tarras, A. Diffusion of chloride ions in hardened cement pastes. Cem. Concr Res.11, 395–406. 10.1016/0008-8846(81)90111-3 (1981). [Google Scholar]
- 31.Goto, S. & Roy, D. M. Diffusion of ions through hardened cement pastes. Cem. Concr Res.11, 751–757. 10.1016/0008-8846(81)90033-8 (1981). [Google Scholar]
- 32.Oh, B. H. & Jang, S. Y. Effects of material and environmental parameters on chloride penetration profiles in concrete structures. Cem. Concr Res.37, 47–53. 10.1016/j.cemconres.2006.09.005 (2007). [Google Scholar]
- 33.Bažant, Z. P. & Najjar, L. Drying of concrete as a nonlinear diffusion problem. Cem. Concr Res.1, 461–473. 10.1016/0008-8846(71)90054-8 (1971). [Google Scholar]
- 34.Val, D. V. & Melchers, R. E. Reliability of deteriorating RC slab bridges. J. Struct. Eng. 123, 1638–1644 https://doi.org/https://doi.org/ (1997). 10.1061/(asce)0733-9445(1997)123:12(1638).
- 35.Vu, K. A. T. & Stewart, M. G. Structural reliability of concrete bridges including improved chloride-induced corrosion models. Struct. Saf.22, 313–333. 10.1016/s0167-4730(00)00018-7 (2000). [Google Scholar]
- 36.Kayser, J. R. The Effects of Corrosion on the Reliability of Steel Girder Bridges (University of Michigan, 1988).
- 37.Kere, K. J. & Huang, Q. Life-cycle cost comparison of corrosion management strategies for steel bridges. J. Bridge Eng.24, 04019007. 10.1061/(asce)be.1943-5592.0001361 (2019). https://doi.org/https://doi.org/ [Google Scholar]
- 38.Albrecht, P. & Naeemi, A. H. Performance of weathering steel in bridges. NCHRP Rep. (1984).
- 39.Cai, Y., Xu, Y., Zhao, Y. & Ma, X. Atmospheric corrosion prediction: A review. Corros. Rev.38, 299–321. 10.1515/corrrev-2019-0100 (2020). [Google Scholar]
- 40.Huang, C., Su, X., Song, Q. & Wang, X. Effects of temperature on acceleration and simulation of indoor corrosion test of Q235 carbon steel. Anti-Corros Methods Mater.68, 564–570. 10.1108/acmm-01-2021-2426 (2021). [Google Scholar]
- 41.IPCC. AR6 Synthesis Report: Climate Change 2023. (Intergovernmental Panel on Climate Change (IPCC). (2023).
- 42.Guo, J., Zhang, L. & Guo, R. Relative humidity prediction with covariates and error correction based on SARIMA-EG-ECM model. Model. Earth Syst. Environ.9, 4493–4505. 10.1007/s40808-023-01738-x (2023). [DOI] [PMC free article] [PubMed] [Google Scholar]
- 43.KMA. Open MET Data Portal, Korera Meteorological Administration (KMA), (2024). https://data.kma.go.kr/resources/html/en/aowdp.html
- 44.Suh, M. S. et al. Projections of high resolution climate changes for South Korea using multiple-regional climate models based on four RCP scenarios. Part 1: Surface air temperature. Asia-Pacific J. Atmos. Sci.52, 151–169. 10.1007/s13143-016-0017-9 (2016). [Google Scholar]
- 45.Zhang, C., Mapes, B. E. & Soden, B. J. Bimodality in tropical water vapour. Q. J. Royal Meteorological Society: J. Atmospheric Sci. Appl. Meteorol. Phys. Oceanogr.129, 2847–2866. 10.1256/003590003769682075 (2003). [Google Scholar]
- 46.Kong, J. S. & Frangopol, D. M. Life-cycle reliability-based maintenance cost optimization of deteriorating structures with emphasis on bridges. J. Struct. Eng.129, 818–828. 10.1061/(asce)0733-9445(2003)129:6(818) (2003). [Google Scholar]
- 47.AASHTO. AASHTO the Manual for Bridge Evaluation (American Association of State Highway and Transportation Officials (AASHTO), 2018).
- 48.ISO. ISO 14040 International Standard (International Organisation for Standardization (ISO), 2006).
- 49.ISO. ISO 14044 International Standard (International Organisation for Standardization (ISO), 2006).
- 50.ISO. ISO 21930 International Standard (International Organisation for Standardization (ISO), 2017).
- 51.ISO. ISO 20915 International Standard (International Organisation for Standardization (ISO), 2018).
- 52.KORIS. Circulation Price Database, Korea Institute of Applied Statistics (KORIS), (2024). https://www.koris.or.kr/
- 53.KEC. Prediction Model for Long-term Maintenance Costs of Highway Bridges (Korea Expressway Corporation (KEC), 2015).
- 54.Estes, A. C. & Frangopol, D. M. Repair optimization of highway bridges using system reliability approach. J. Struct. Eng.125, 766–775. 10.1061/(asce)0733-9445(1999)125:7(766) (1999). https://doi.org/https://doi.org/ [Google Scholar]
- 55.Hanna, A. S. Quantifying the impact of change orders on electrical and mechanical labor productivity. Research Rep 3, 158 – 111 (2001).
- 56.OpenLCA Nexus v. 2.0. GreenDelta, GreenDelta GmbH, (2023).
- 57.Ecoinvent database v. 3.3. Ecoinvent Centre, Zurich, Switzerland, (2016).
- 58.PASS v. 4.1.1 (KEITI (Korea Environmental Industry and Technology Institute, 2023).
- 59.Dekker, E., Zijp, M. C., van de Kamp, M. E., Temme, E. H. & van Zelm, R. A taste of the new ReCiPe for life cycle assessment: Consequences of the updated impact assessment method on food product LCAs. Int. J. Life Cycle Assess.25, 2315–2324 (2020). [Google Scholar]
- 60.ME. Guidelines for Environmental Product Declaration by Product Category (Ministry of Environment (ME), 2023).
- 61.BIR & WORLD STEEL RECYCLING IN Figs. 2017–2021: Steel Scrap – a Raw Material for Green Steelmaking (Bureau of International Recycling (BIR), 2022).
- 62.Amadei, A. M., De Laurentiis, V. & Sala, S. A review of monetary valuation in life cycle assessment: State of the art and future needs. J. Clean. Prod.329, 129668. 10.1016/j.jclepro.2021.129668 (2021). [Google Scholar]
- 63.Val, D. V. & Stewart, M. G. Life-cycle cost analysis of reinforced concrete structures in marine environments. Struct. Saf.25, 343–362. 10.1016/s0167-4730(03)00014-6 (2003). [Google Scholar]
- 64.Soliman, M., Ahmed, S. & Shen, L. A Comprehensive Framework for Life-Cycle Cost Assessment of Reinforced Concrete Bridge Decks (Transportation Consortium of South-Central States, 2019).
Associated Data
This section collects any data citations, data availability statements, or supplementary materials included in this article.
Supplementary Materials
Data Availability Statement
Additional data can be made available at request to the corresponding author, with exception of confidential data from LCA model applied in this study.


