Abstract
Background
Transferrin receptor (TFRC) uptakes iron-loaded transferrin (TF) to acquire iron and regulates tumor development. Nonetheless, the clinical values and the precise functions of TF-TFRC axis in the development of oral squamous cell carcinoma (OSCC) were still undiscovered, especially the impacts of their regional heterogeneous expression.
Methods
Immunohistochemistry (IHC) was used to analyze the expression of TFRC in 106 OSCC patients. Then the prognostic value of TFRC was compared between high and low worst pattern of invasion (WPOI) patients. OSCC cells with low or high expression of TFRC were constructed, and functional experiments were performed to elucidate the effects of TFRC on the migration and proliferation of OSCC cells. Multi-immunofluorescence was applied to stain TF and tumor-associated neutrophils (TANs). The stimulating effects of TF were compared between normal and high TFRC cells in vitro and across different OSCC patients’ subgroups in our sample bank and TCGA database.
Results
Higher TFRC was expressed at invasive tumor front (ITF) in OSCC and correlated with WPOI. Only at ITF in patients with WPOI 4–5, TFRC was a prognostic factor. High TFRC promoted migration and proliferation of cancer cells. Additionally, TANs secreted TF outside. Exogenous TF promoted migration and proliferation of cells with high expression of TFRC. Compared to the TANslowTFRClow OSCC patients, TANshighTFRChigh OSCC patients had poorer clinical outcomes.
Conclusions
Higher expression of TFRC at ITF and TANs-TF-TFRC axis promoted OSCC invasion at ITF by facilitating cell migration and proliferation, which may result from increased cellular iron uptake through regulating iron metabolism.
Supplementary Information
The online version contains supplementary material available at 10.1007/s00262-024-03894-0.
Keywords: Transferrin receptor, Tumor-associated neutrophils, Worst pattern of invasion, Oral squamous cell carcinoma, Prognosis
Introduction
Oral squamous cell carcinoma (OSCC) is the eleventh most common malignant tumor in the world [1] and the incidence is increasing every year [2, 3]. Current treatment strategies for OSCC are surgery, radiotherapy, chemotherapy and photodynamic therapy [4]. Despite improving treatments, the clinical outcomes of OSCC patients did not improve significantly and the survival rate is still less than 50% [5]. Localized regional recurrence and distant metastasis are main reasons for poor prognosis of OSCC [6]. Therefore, identification the promising molecular predictors and exploration the underlying mechanisms are important to ameliorate survival rates of OSCC.
The binding of iron-loaded transferrin (TF) with transferrin receptor (TFRC) which is then endocytosed into cells is a major pathway of iron uptake. TFRC was found to be highly expressed in nonsmall cell lung cancer, pancreatic cancer, colorectal cancer and OSCC etc. [7–10] Multiple studies have confirmed that enhanced TF-TFRC mediated iron uptake in tumor to promote tumorigenesis, proliferation, metastasis and drug resistance [11–16] as iron is central to many proteins involved in DNA synthesis, ATP production and redox cycle, etc. And OSCC patients with high expression of TFRC were found to have poor clinical outcomes [10]. However, how high TFRC expression leading worse clinical outcomes remained elusive.
It is well known that tumor is a heterogeneous disease with morphologically and topographically distinct tumor foci [17, 18]. The heterogeneity leads diverse distribution of genetically distinct tumor subpopulations and varied tumor microenvironments. Previous studies have confirmed the heterogeneity provides fuel for tumor invasion [19]. Analyzing different proteins expression and cellular component between tumor center (TC) and the invasive tumor front (ITF) is one-way to study tumor heterogeneity that promotes tumor invasion as ITF is a boundary between the tumor and the stroma and has a greater capacity for invasion [20–22]. Usually depending on the worst pattern of invasion (WPOI) at ITF and the clinical prognostic outcome, it could be further divided into two subclasses WPOI 1–3 and WPOI 4–5. WPOI 4–5 were more aggressive and had a worse prognosis than WPOI 1–3 and drew more attention in the study of ITF [23]. Epithelial-to-mesenchymal transition (EMT) transition is one important feature of WPOI 4–5 [19, 24]. Intriguingly, some studies found that EMT is accompanied by increased iron uptake [25, 26]. Therefore, we wondered whether more TFRC expression at ITF and promoted OSCC invasion leading poor prognosis of OSCC patients. Moreover, the effects of TF/TFRC axis in OSCC invasion was still a mystery.
In this study, we showed that high TFRC expression at ITF was associated with WPOI 4-5 and predicted worse clinical outcomes. In vitro experiments confirmed that TFRC promoted OSCC cells migration and proliferation. TANs at ITF were found to secret TF which further increased OSCC migration and proliferation rates, suggesting TANs at ITF supply iron to meet high demands of tumor cell in the formation of WPOI 4–5.
Materials and methods
Patients and samples
The 106 samples used for immunohistochemistry (IHC) staining of TFRC were obtained from primary OSCC patients who received surgery from 2015 to 2019 in Nanjing Stomatological Hospital. And the 97 samples used for IHC staining of CD15 were part of the previous 106 samples. The inclusion criteria included: (1) primary oral squamous carcinoma diagnosed by pathologic examination; (2) patients with no previous history of radiotherapy chemotherapy or immunotherapy; (3) Pathologic specimens are well preserved; (4) complete clinical data and follow-up information. The exclusion criteria include: (1) Clinical and pathological examination confirmed the diagnosis of oral lesions that are not primary lesions; (2) Postoperative patients who died due to other reasons or other diseases other than recurrent metastasis of oral cancer; (3) Incomplete pathologic specimens or incomplete clinical data. The patients were followed up for 2–84 months, and the median was 60 months. All samples were obtained from the biospecimen bank and informed consent was obtained from the patients. The study was approved by the Medical Ethics Committee of Nanjing Stomatology Hospital (JX-2023-NL28) and followed the tenets the World Medical Association’s Declaration of Helsinki.
Immunohistochemistry (IHC) and quantification
IHC staining of CD15 (ab135377, 1:100 dilution, Abcam) and TFRC (HPA028598, 1:750 dilution, Sigma) was performed according to standard protocols. Tumor tissue slides in this study were electronically scanned using the 3DHISTECH slice scanner [PANNORAMIC MIDI]. Three image fields were selected for the TC and ITF. Protein expression was assessed based on the density and percentage of staining of positive cells in sections. The staining intensity and percentage of positive cells were scored as our previous studies. Then, multiplying the two scores and the final score was the average of the scores of the three image fields. For TANs, they were counted at 40 × field of view with ImageJ and the final cell count was the average of the counts of the three image fields. Two experienced pathologists without knowledge of the patients’ clinical characteristics or outcome were invited to score the IHC results separately using Case Viewer software [version 2.4] at 10 × and 40 × field of view. The expressions of TANs and TFRC were defined as “low” when it was lower than the median level and as “high” when it was equal to or greater than the median.
Cell culture and reagents
The human OSCC cell lines CAL-33, CAL-27, HSC-3, HSC-2, HN6, SCC-4, SCC-9, OSCC3, human oral keratinocytes (HOK) and human immortal keratinocyte line (HACAT) were cultured in the Dulbecco’s Modified Eagle Medium (DMEM basic) (C11995500BT, gibco, USA) supplemented with 10% fetal bovine serum (BC-SE-FBS07, Bio-Channel, China) and 1% penicillin streptomycin (15140-122, gibco, USA). Using Short Tandem Repeat (STR) analysis to authenticate all cell lines and cultured them at 37 °C in a standard humidified atmosphere of 5% CO2.
RNA extraction and real-time PCR analysis
RNA was extracted and reversed following the product manuals. Gene expression was determined by AceQ® qPCR SYBR® Green Master Mix (R323-01, Vazyme Biotech Co., Ltd, China). The primer sequences used were as follows: forward primer 5-ACCATTGTCATATACCCGGTTCA-3 and reverse primer 5-CAATAGCCCAAGTAGCCAATCAT-3 for human TFRC (NM_003234); forward primer 5-GGAGCGAGATCCCTCCAAAAT-3 and reverse primer 5-GGCTGTTGTCATACTTCTCATGG-3 for human GAPDH. Gene expression was normalized to GAPDH and calculated using 2 − ∆∆CT method.
Western blot (WB)
Proteins were separated by sodium dodecyl sulfate polyacrylamide gel electrophoresis (SDS-PAGE) (P0015, Beo Tianmei, China). After incubation overnight with a primary antibody against TFRC (HPA028598, 1:2000 dilution, Sigma) or Phospho-mTOR (p-mTOR, AP0115, 1:1000 dilution, ABclonal) or Phospho-Akt (p-Akt, AP1208, 1:1000 dilution, ABclonal) or Pan-Akt (A18675, 1:2000 dilution, ABclonal) or mTOR (2983S, 1:2000 dilution, Cell Signaling Technology) and HRP-conjugated β-actin (AC028, 1:4000, ABclonal) or HRP-conjugated GADPH (AC035, 1:10,000, ABclonal) at 4 °C, then incubated goat anti-rabbit IgG(H + L) secondary antibody (31460, Invitrogen, USA) for 1 h, protein bands were exposed (E412, Vazyme Biotech Co., Ltd, China) and detected using the Tanon-5200 Chemiluminescent Imaging System (Tanon5200).
Multiplex immunofluorescence staining
After deparaffinization and dehydration, the sections were immersed in Tris–EDTA antigen recovery buffer for heat-induced antigen recovery and closed with 3% H2O2 and 3% BSA. The sections were then sequentially incubated with anti-CK (ab9377, 1:300 dilution, Abcam) at 37 °C for 1 h, anti-α-SMA (19245, 1:1200 dilution, CST) at 4 °C overnight, anti-CD15(ab17080, 1:900 dilution, Abcam) and anti-transferrin antibodies (ab277635, 1:1200 dilution, Abcam) at 37 °C for 1 h. A TSA kit (Servicebio, China) was used for signal detection, and the nuclei were counterstained with DAPI. The sections were scanned by a slice scanner (Pannoramic MIDI: 3Dhistech, Hungary), at Nanjing Freethinking Biotechnology Co., Ltd. (China).
Luminescent cell viability assays
Seeded 5000 (TFRC knockdown and overexpression experiments) or 3000 (external stimulation experiments) or 6000 (tumor cells and granulocytes co-culture experiments, control, 3000 HSC-3 cells and control + TANs, 3000 tumor cells and 3000 granulocytes) cells in each well of 96-well plates, added 100 μl DMEM with 10% FBS for TFRC knockdown or overexpression experiments and tumor cells and granulocytes co-culture experiments, or 100 μl DMEM with 1% FBS with or without transferrin (0.3 mg/ml) (T0665, Sigma) for external stimulation experiments, aspirated 50 μl DMEM and added cell-counting lite 50 μl per well, shook gently and waited 3 min, then measured the luminescent cell viability (DD1101-01, Vazyme Biotech Co., Ltd, China) at different time points. Images were taken by Nikon Ts2-FL and NIS-Elements F 4.60.00.
3D spheroid formation assays
Seeded 10,000 cells to each well of Ultra-Low Adherent Plates, then added 200 μl DMEM with 10% FBS for TFRC knockdown and overexpression experiments or 200 μl DMEM with 5% FBS with or without transferrin (0.3 mg/ml) for external stimulation experiments. Images were taken by Nikon Ts2-FL and NIS-Elements F 4.60.00.
Trans-well assays
After 12 h of starvation, seeded 200 μl FBS-free DMEM containing 50,000 cells to the upper chamber, then added 600 μl DMEM medium with 10% FBS for TFRC knockdown and overexpression experiments or 600 μl DMEM with 5% FBS with or without transferrin (0.3 mg/ml) for external stimulation experiments to the lower chamber, or 600 μl DMEM with 5% FBS with or without TANs for tumor cells and granulocytes co-culture experiments. After 24 or 48 h, the wells were fixed with 4% paraformaldehyde (BL539A, biosharp, China) and stained with crystal violet (C0121, Beyotime, China).
Flow assays
When the transfected cells filled the large dishes, added 0.25% Trypsin (15050-065, gibco, USA) to digest, then used Annexin V-APC/PI Apoptosis Detection Kit (A214-01, Vazyme Biotech Co., Ltd, China) and BD FACSCalibur, and the results were processed with FlowJo (10.8.1).
Peripheral blood neutrophil extraction
Blood samples were obtained from OSCC patients in Nanjing Stomatological Hospital, and the procedure was described in the Human Neutrophil Separation Kit (LZS11131, TBD).
Survival analyses and gene set enrichment analyses (GSEA)
For TCGA patients’ data analysis, RNA-seq data were downloaded from cBioPortal (https://www.cbioportal.org/). Survival differences among groups were evaluated using the Kaplan–Meier method, and the p-value was determined using the log-rank test.
Gene Set Enrichment Analysis (GSEA) was carried out on the groups between high and low TFRC expression and TANs infiltration to investigate the differential expression of gene sets. These gene sets were obtained from the hallmark gene set collection of The Molecular Signatures Database (MSigDB).
Statistical analysis
SPSS 26.0 (IBM Corp, Armonk, NY, USA) and GraphPad Prism 9.0 (Dotmatics, Boston, MA, USA) were used for data analysis and graphical processing. The unpaired t-test, Wilcoxon test and Mann–Whitney U test were used to compare the two groups. Kruskal–Wallis test, ANOVA were used to compare more than two groups. Pearson’s chi-square test, Fisher’s exact test, and the chi-square test were used to compare clinicopathological features and ratios. Survival analysis included overall survival (OS), recurrence-free survival (RFS), metastasis-free survival (MFS), and disease-free survival (DFS), which were evaluated using Kaplan Meier and log-rank tests. Univariate multivariate analyses were performed using Cox proportional hazards regression models to identify independent risk factors, adjusted hazard ratio (HR) and 95% confidence interval (CI) for OSCC. All statistical tests were two-sided, and p < 0.05 was considered to be significant.
Results
TFRC was highly expressed in OSCC tumor tissues especially at ITF component
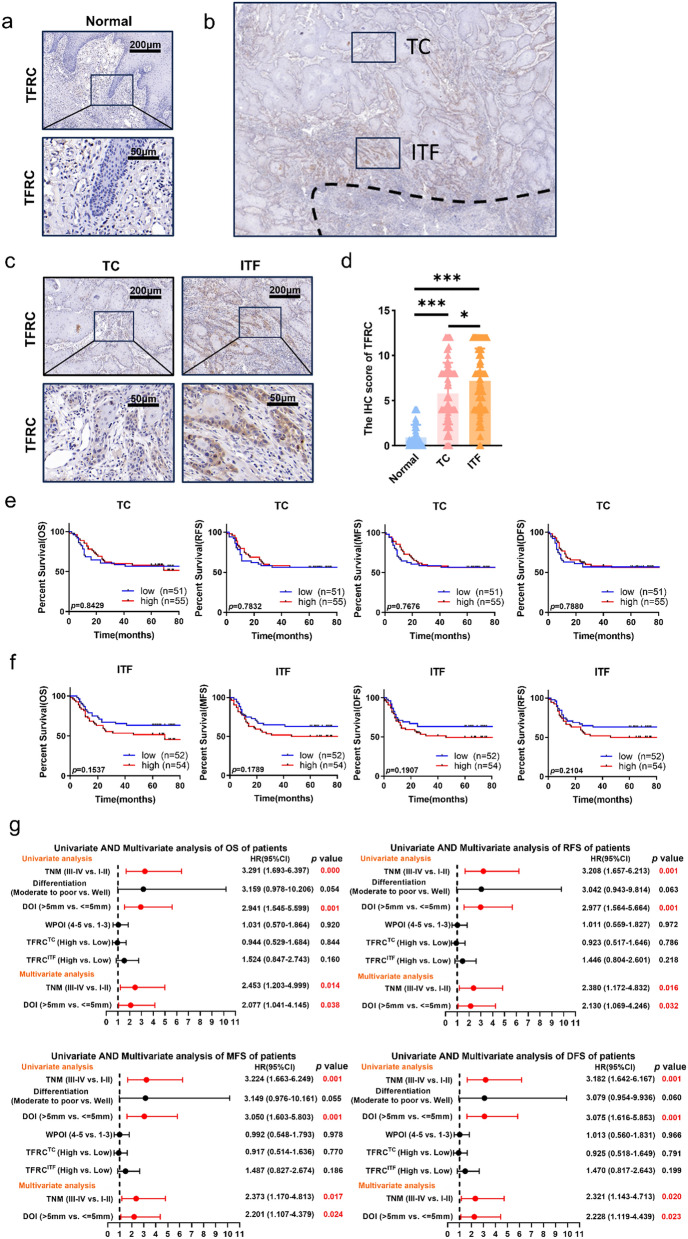
To clarify the distribution of TFRC, we performed IHC and analyzed TFRC expression in OSCC and adjacent nontumor counterparts in 106 patients. Results showed that TFRC expression in the tumor tissue was significantly higher than in the adjacent tissue (Fig. 1a, d). More importantly, TFRC was not evenly distributed in OSCC. TFRC expressed higher at ITF than at TC component (Fig. 1b–d). In addition, higher TFRC expression at ITF was related to advanced depth of invasion (DOI) and WPOI (Table 1), while TFRC expression at TC had no significant correlation with any clinicopathological parameters (Table 2). To identify the prognostic values of TFRC, the Kaplan–Meier survival analyses were applied to compare the 5-year OS, RFS, MFS and DFS rates between TFRC high and low OSCC patients. TFRC expression at TC had no significant correlation with clinical outcomes (Fig. 1e). However, higher TFRC expression at ITF tended to predict worse clinical outcomes in spite of no significant differences (Fig. 1f). Furthermore, univariate and multivariate Cox regression analyses were used to analyze the independent prognostic values of TFRC at TC and at ITF. However, we found that TFRC at TC or ITF were not the prognostic predictors for OS, DFS, RFS and MFS in OSCC (Fig. 1g). But our results here displayed that TFRC expression only at ITF component was associated with advanced DOI and WPOI of OSCC patients, highlighting its importance at ITF.
Fig. 1.
TFRC was highly expressed in OSCC tumor tissues especially at the ITF component. a Typical IHC staining of TFRC in normal epithelial area (n = 106). b Typical schematic of TC component and ITF component. c Typical IHC staining of TFRC in tumor area, including TC (n = 106) and ITF (n = 106) in OSCC. d Graphical summary of TFRC in normal epithelial area (n = 106), TC (n = 106) and ITF (n = 106) of OSCC patients, P = Kruskal–Wallis test. e Kaplan–Meier curves of OS, RFS, MFS and DFS between TFRC high (n = 55) and low (n = 51) expression patients at TC, P = Log-rank (Mantel–Cox) test. f Kaplan–Meier curves of OS, RFS, MFS and DFS between TFRC high (n = 54) and low (n = 52) expression patients at ITF, P = Log-rank (Mantel–Cox) test. g Univariate and multivariate Cox analyses of OS, RFS, MFS and DFS based on TFRC expression and clinicopathological factors of all patients. p values less than 0.05 are shown in red. HR, hazard ratio; CI, confidence interval. * and *** represented differences were considered statistically significant with p < 0.05 and p < 0.001, respectively
Table 1.
Correlation between clinicopathology of OSCC patients and TFRC expression at ITF
| Clinical variable | Invasive tumor front | x2 | p value | |||||||
|---|---|---|---|---|---|---|---|---|---|---|
| Total n (%) | low n (%) | high n (%) | ||||||||
| All cases | 106(100%) | |||||||||
| Gender | ||||||||||
| Female | 51(48.1%) | 29(56.9%) | 22(43.1%) | 2.397 | 0.122 | |||||
| Male | 55(51.9%) | 23(41.8%) | 32(58.2%) | |||||||
| Age | ||||||||||
| < = 60 | 52(49.1%) | 24(46.2%) | 28(53.8%) | 0.344 | 0.557 | |||||
| > 60 | 54(50.9%) | 28(51.9%) | 26(48.1%) | |||||||
| Smoking | ||||||||||
| No | 73(68.9%) | 38(52.1%) | 35(47.9%) | 0.843 | 0.358 | |||||
| Yes | 33(31.1%) | 14(42.4%) | 19(57.6%) | |||||||
| T stage | ||||||||||
| I–II | 67(63.2%) | 34(50.7%) | 33(49.3%) | 0.208 | 0.648 | |||||
| III–IV | 39(36.8%) | 18(46.2%) | 21(53.8%) | |||||||
| Lymph node metastasis | ||||||||||
| No | 59(55.7%) | 32(54.2%) | 27(45.8%) | 1.226 | 0.268 | |||||
| Yes | 47(44.3%) | 20(46.2%) | 27(57.4%) | |||||||
| Difference | ||||||||||
| Well | 15(14.2%) | 10(66.7%) | 5(33.3%) | 2.168 | 0.141 | |||||
| Moderate to poor | 91(85.8%) | 42(46.2%) | 49(53.8%) | |||||||
| TNM stage | ||||||||||
| I–II | 48(45.3%) | 26(54.2%) | 22(45.8%) | 0.917 | 0.338 | |||||
| III–IV | 58(54.7%) | 26(44.8%) | 32(55.2%) | |||||||
| DOI | ||||||||||
| < = 5 mm | 50(47.2%) | 32(64.0%) | 18(36.0%) | 8.457 | 0.004 | |||||
| > 5 mm | 56(52.8%) | 20(35.7%) | 36(64.3%) | |||||||
| WPOI | ||||||||||
| 1–3 | 42(39.6%) | 26(61.9%) | 16(38.1%) | 4.595 | 0.032 | |||||
| 4–5 | 64(60.4%) | 26(40.6%) | 38(59.4%) | |||||||
p values less than 0.05 are shown in bold
Table 2.
Correlation between clinicopathology of OSCC patients and TFRC expression at TC
| Clinical variable | Tumor center | x2 | p value | |||||||
|---|---|---|---|---|---|---|---|---|---|---|
| Total n (%) | low n (%) | high n (%) | ||||||||
| All cases | 106(100%) | |||||||||
| Gender | ||||||||||
| Female | 51(48.1%) | 29(56.9%) | 22(43.1%) | 3.014 | 0.083 | |||||
| Male | 55(51.9%) | 22(40.0%) | 33(60.0%) | |||||||
| Age | ||||||||||
| < = 60 | 52(49.1%) | 27(51.9%) | 25(48.1%) | 0.593 | 0.441 | |||||
| > 60 | 54(50.9%) | 24(44.4%) | 30(55.6%) | |||||||
| Smoking | ||||||||||
| No | 73(68.9%) | 37(50.7%) | 36(49.3%) | 0.621 | 0.431 | |||||
| Yes | 33(31.1%) | 14(42.4%) | 19(57.6%) | |||||||
| T stage | ||||||||||
| I–II | 67(63.2%) | 31(46.3%) | 36(53.7%) | 0.248 | 0.618 | |||||
| III–IV | 39(36.8%) | 20(51.3%) | 19(48.7%) | |||||||
| Lymph node metastasis | ||||||||||
| No | 59(55.7%) | 28(47.5%) | 31(52.5%) | 0.023 | 0.88 | |||||
| Yes | 47(44.3%) | 23(48.9%) | 24(51.1%) | |||||||
| Difference | ||||||||||
| Well | 15(14.2%) | 9(60.0%) | 6(40.0%) | 0.989 | 0.32 | |||||
| Moderate to poor | 91(85.8%) | 42(46.2%) | 49(53.8%) | |||||||
| TNM stage | ||||||||||
| I–II | 48(45.3%) | 23(47.9%) | 25(52.1%) | 0.001 | 0.971 | |||||
| III–IV | 58(54.7%) | 28(48.3%) | 30(51.7%) | |||||||
| DOI | ||||||||||
| < = 5 mm | 50(47.2%) | 29(58.0%) | 21(42.0%) | 3.706 | 0.054 | |||||
| > 5 mm | 56(52.8%) | 22(39.3%) | 34(60.7%) | |||||||
| WPOI | ||||||||||
| 1–3 | 42(39.6%) | 23(54.8%) | 19(45.2%) | 1.232 | 0.267 | |||||
| 4–5 | 64(60.4%) | 28(43.8%) | 36(56.3%) | |||||||
p values less than 0.05 are shown in bold
Higher TFRC expression at ITF component was a poorer prognosis in WPOI4−5 patients but not in WPOI1−3 patients
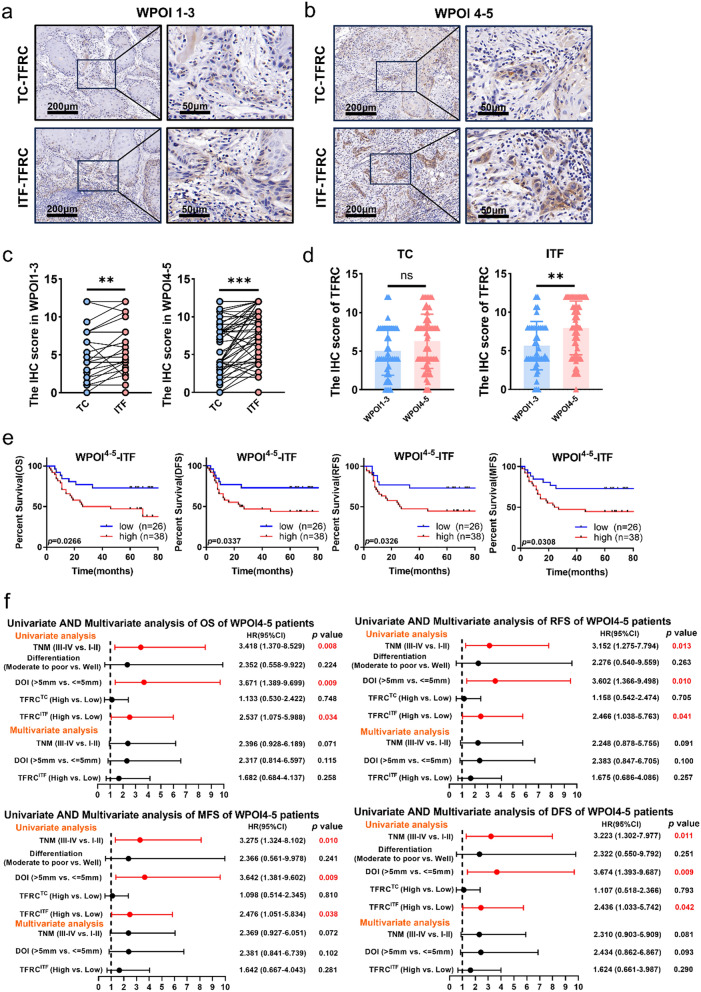
Since TFRC expression at ITF component was positively correlated with WPOI, we compared TFRC expression between WPOI1−3 and WPOI4−5 patients. Consistent with our above results, TFRC expression at the ITF components were significantly higher than that at the TC components in both WPOI1−3 and WPOI4−5 patients (Fig. 2a–c). However, WPOI4−5 patients had higher TFRC expression than WPOI1−3 patients only at ITF but no in TC components (Fig. 2d).
Fig. 2.
Higher TFRC expression at ITF had poorer prognosis in WPOI4−5 patients rather than WPOI1−3 patients. a, b Typical IHC staining of TFRC at TC and ITF in WPOI1−3 and WPOI4−5 OSCC. c Graphical summary of TFRC at TC and ITF in WPOI1−3 and WPOI4−5 OSCC, P = Wilcoxon test. d Graphical summary of TFRC at TC (left) and ITF (right) between WPOI1−3 and WPOI4−5 OSCC, P = Mann–Whitney U test. e Kaplan–Meier curves of OS, RFS, MFS and DFS between TFRC high and low expression patients at ITF in WPOI4−5 OSCC, P = Log-rank (Mantel–Cox) test. f Univariate and multivariate Cox analyses of OS, RFS, MFS and DFS based on TFRC expression and clinicopathological factors of patients in WPOI4−5 OSCC. p values less than 0.05 are shown in red. HR, hazard ratio; CI, confidence interval. *, ** and *** represented differences were considered statistically significant with p < 0.05, p < 0.01 and p < 0.001, respectively
Then the prognostic values of TFRC expression in WPOI4−5 patients were performed. Noteworthy, K–M analysis showed that WPOI4−5 patients with higher TFRC at ITF predicted poorer prognosis (Fig. 2e), while WPOI4−5 patients with higher TFRC in TC had no prognostic value (supplementary Fig. 1c). In addition, TFRC expression in WPOI1−3 patients had no any significant prognosis values whether at TC or ITF components (supplementary Fig. 1a, b). Accordingly, univariate and multivariate Cox regression analyses displayed that TFRC at ITF in WPOI4−5 OSCC was a valuable prognostic factor (HR:2.537, 95% CI 1.075–5.988 for OS; and HR:2.466, 95% CI 1.038–5.763 for RFS; and HR:2.476, 95% CI 1.051–5.834 for MFS, and HR:2.436, 95% CI 1.033–5.742 for DFS). However, TFRC was not an independent risk factor for OS, DFS, RFS and MFS in OSCC in multivariate analyses (Fig. 2f). These results indicated TFRC engaged in the formation of WPOI.
TFRC promoted migration and proliferation of OSCC cells
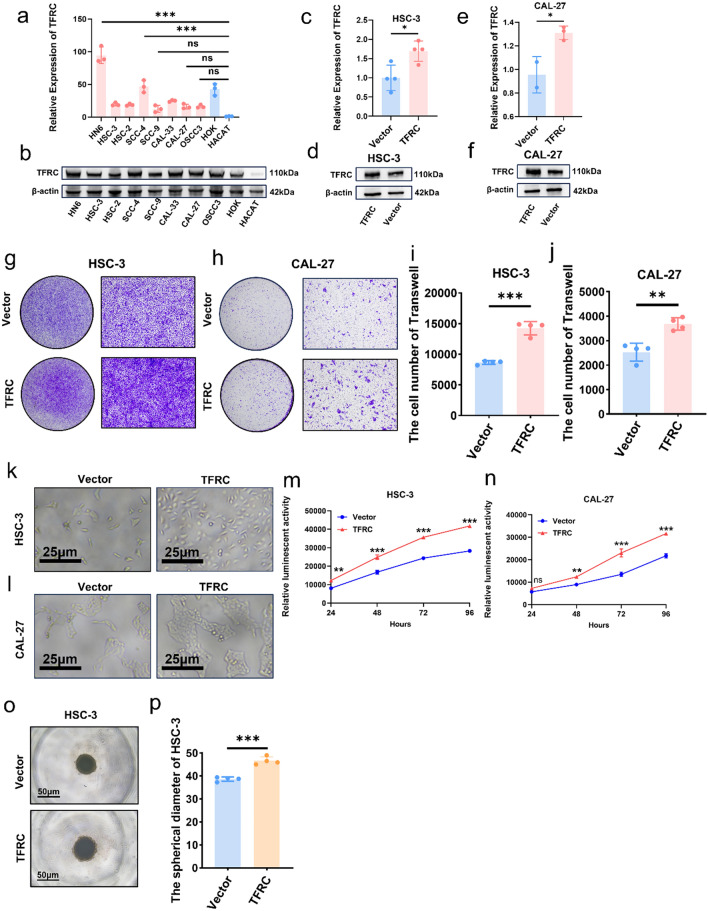
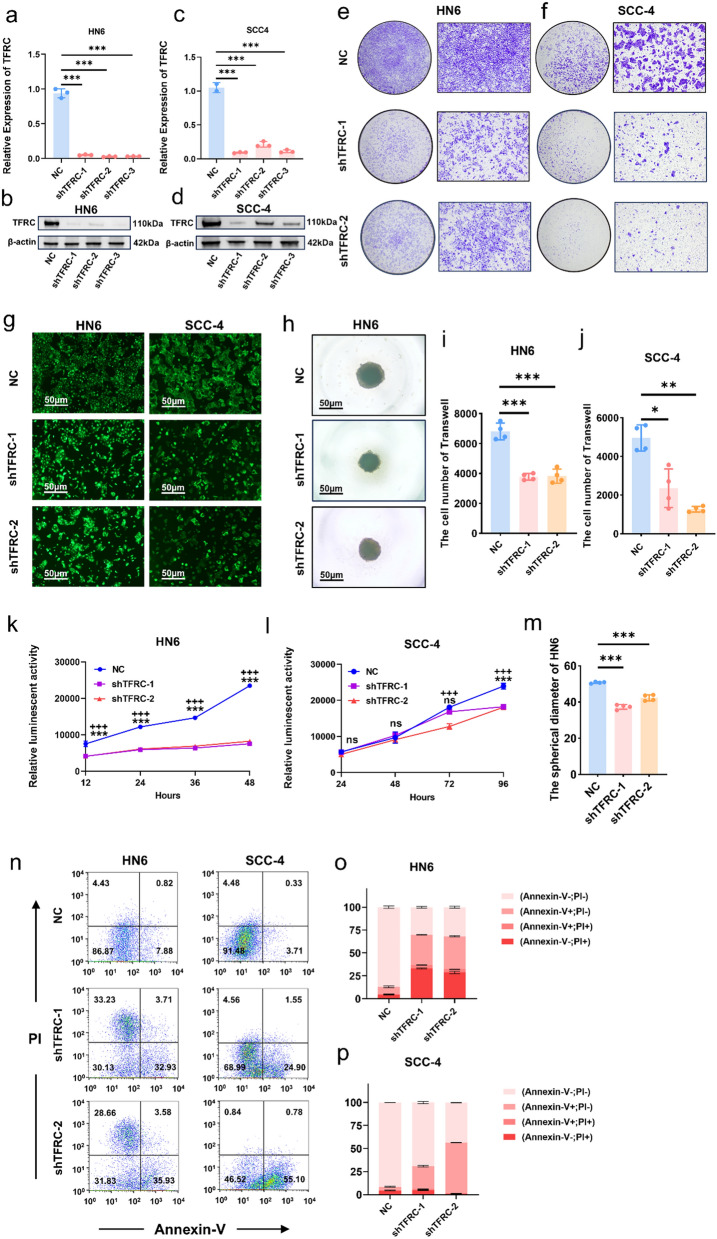
To explore the functions of higher TFRC expression in OSCC, TFRC expressions in 8 OSCC cells and 2 normal epithelial cells were performed by qPCR and WB. TFRC expression in all tumor cells were higher than in HACAT (Fig. 3a, b). Then HSC-3 and CAL-27 were chosen for further research because of their lower TFRC expression (Fig. 3a, b). Overexpression of TFRC in HSC-3 and CAL-27 was confirmed by qPCR (Fig. 3c, e) and WB (Fig. 3d, f). Trans-well assays demonstrated that upregulation of TFRC increased OSCC cells migration abilities (Fig. 3g–j). In addition, upregulation of TFRC in HSC-3 and CAL-27 greatly increased their proliferation rates (Fig. 3k–p). To confirm the pro-migration and proliferation capacity of TFRC, we further knockdown TFRC in HN6 and SCC-4, respectively (Fig. 4a–d). Consistently, silencing TFRC expression in HN6 and SCC-4 cells also inhibited their migration (Fig. 4e, f and i, j). Moreover, both luminescent cell viability assays and 3D spheroid formation assays displayed that downregulating TFRC in HN6 and SCC-4 cells significantly inhibited their proliferation (Fig. 4g, h and k–m). Besides, we also performed annexin-V/PI analysis and found that down regulating TFRC expression in HN6 and SCC-4 cells promoted more apoptosis and necroptosis (Fig. 4n–p). All these results proved that TFRC promoted migration and proliferation of OSCC cells indicating TFRC’s indispensable function for OSCC progression.
Fig. 3.
Overexpressed TFRC promoted migration and proliferation of OSCC cells. a, b mRNA levels (a) and protein levels (b) of TFRC in 8 OSCC cell lines and 2 normal cells, P = Ordinary one-way ANOVA. c, d mRNA levels (c) and protein levels (d) of TFRC between HSC-3 and HSC-3-TFRC, P = unpaired t-test. e, f mRNA levels (e) and protein levels (f) of TFRC between CAL-27 and CAL-27-TFRC, P = unpaired t-test. g, h Representative images of HSC-3 (g) and CAL-27 (h) invading to the bottom of wells in low (left) and high (right) magnification with or without overexpressing TFRC. i, j Graphical summary of HSC-3 (i) and CAL-27 (j) invading to the bottom of wells with or without overexpressing TFRC, P = unpaired t-test. k, l Representative images of HSC-3 (k) and CAL-27 (l) with or without overexpressing TFRC four days post cell seeding. m, n Luminescence between HSC-3 (m) and CAL-27 (n) with or without overexpressing TFRC after cell seeding in four days, P = Two-way ANOVA (Multiple comparisons). o Representative images of 3D spheroid of HSC-3 and HSC-3-TFRC. p Graphical summary 3D spheroid of HSC-3 and HSC-3-TFRC, P = unpaired t-test. *, ** and *** represented differences were considered statistically significant with p < 0.05, p < 0.01and p < 0.001, respectively
Fig. 4.
Knockdown TFRC inhibited migration and proliferation of OSCC cells. a, b mRNA levels (a) and protein levels (b) of TFRC between HN6 cells and HN6-shTFRC cells, P = Ordinary one-way ANOVA. c, d mRNA levels (c) and protein levels (d) of TFRC between SCC4 cells and SCC4-shTFRC cells, P = Ordinary one-way ANOVA. e, f Representative images of HN6 (e) and SCC-4 (f) invading to the bottom of wells in low (left) and high (right) magnification with or without silencing TFRC. g Representative fluorescent images of HN6 (left) and SCC-4 (right) with or without knockdown TFRC. h Representative images of 3D spheroid of HN6 and HN6-shTFRC. i, j Graphical summary of HN6 (i) and SCC-4 (j) invading to the bottom of wells with or without silencing TFRC, P = Ordinary one-way ANOVA (HN6) and Welch ANOVA (SCC-4). k, l Relative luminescence of HN6 (k) and SCC-4 (l) with or without knockdown TFRC, P = Two-way ANOVA (Multiple comparisons). m Graphical summary 3D spheroid of HN6 and HN6-shTFRC, P = Ordinary one-way ANOVA. n Representative images of flow cytometry analysis of HN6 (left) and SCC-4 (right) before and after silencing TFRC. o, p Graphical summary of early and late apoptosis of HN6 (o) and SCC-4 (p) before and after silencing TFRC. *, ** and *** represented differences were considered statistically significant with p < 0.05, p < 0.01 and p < 0.001 between HN6-shTFRC1 or SCC4-shTFRC1 and corresponding controls, respectively. + , + + and + + + represented differences were considered statistically significant with p < 0.05, p < 0.01 and p < 0.001 between HN6-shTFRC2 or SCC4-shTFRC2 and corresponding controls, respectively
More TANs located at ITF component of WPOI4−5 patients and secreted more TF
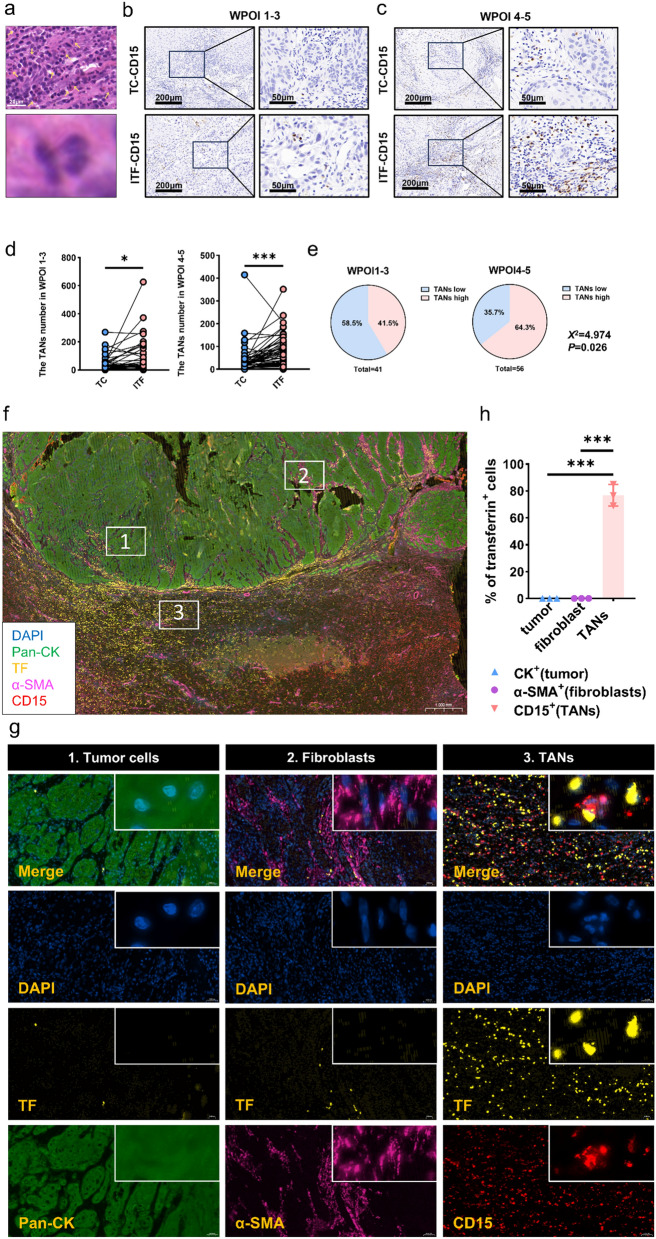
Upregulated TFRC expression indicates increased demands for iron [27, 28], but where iron comes from is unclear. Therefore, we analyzed the status of tumor infiltrating immune cells in OSCC, and we found tumor infiltrating immune cells were especially highly accumulated at ITF component (Fig. 5a upper). Furtherly, we also found many of these infiltrating immune cells were lobulated multinucleated nuclei, consistent with neutrophils characteristic (Fig. 5a lower). Then we conducted IHC analysis of CD15, a marker of tumor-associated neutrophils (TANs) in 97 OSCC patients. Results showed TANs accumulated at ITF, especially in WPOI4−5 patients (n = 56) (Fig. 5b–d). Moreover, WPOI4−5 patients harbored more TANs than WPOI1−3 patients (Fig. 5e).
Fig. 5.
More TANs located at ITF component of WPOI4−5 patients and secreted more TF. a Typical HE staining of neutrophils. b, c Typical IHC staining of TANs at TC and ITF in WPOI1−3 and WPOI4−5 OSCC. d Graphical summary of TANs at TC and ITF in WPOI1−3 and WPOI4−5 OSCC, P = Wilcoxon test. e Proportion of TANs distribution at ITF in WPOI1−3 and WPOI4−5 OSCC, P = Chi-square test. f, g Representative immunofluorescence images of OSCC tissues. h Graphical summary of TF positive cells in tumor cell, fibroblasts and TANs, P = Ordinary one-way ANOVA. * and *** represented differences were considered statistically significant with p < 0.05 and p < 0.001, respectively
The similar expression patterns of TFRC and TANs arouse our attention and we wondered whether there was iron crosstalk between TFRChigh OSCC cells and TANs. Wei Liang et al. [29] previously proved that TANs was one source of iron, which secreted transferrin (TF) to TFRC. To confirm it, we applied multiplex immunofluorescence staining to analyze the expression of TF, which is the ligand of TFRC, in tumor cell, fibroblasts and TANs. Consistent with our above IHC results, TANs were mainly located at ITF, where TF was also highly expressed. Specifically, hardly any tumor cells and fibroblasts co-expressed TF and a major proportion of TANs co-expressed TF (Fig. 5f–h). We then performed IF analyses on 10 more OSCC patients, which confirmed a significant association between high TANs accumulation and TF (supplementary Fig. 2a). Moreover, our findings revealed high levels of both TANs and TF in patients with advanced WPOI (supplementary Fig. 2b, c). By combining these results with our previous observations that TF is predominantly derived from TANs, we established the relationship between TANs-TF and WPOI progression. Furthermore, we compared the proportion of TANs and TFRC in OSCC patients across different stages of WPOI (WPOI 1-3 vs. WPOI 4-5). Our analysis showed that patients with high levels of both TANs and TFRC tended to have advanced WPOI, reinforcing TANs-regulated WPOI via TFRC expression (supplementary Fig. 2d). More importantly, we conducted an in vitro experiment, where neutrophils were extracted from the peripheral blood of OSCC patients and co-cultured with OSCC cells. Both luminescent and trans-well assays indicated that neutrophils from OSCC patients promoted the proliferation and migration of OSCC cells (supplementary Fig. 2e–h).
The enhanced pro-tumor effects of TF in TFRC high expression cells
Since WPOI4−5 OSCC patients, whose TFRC were highly expressed, harbored higher TANs, then we explored TF-TFRC axis’s function in OSCC and investigated exogenous TF’s effects on OSCC cells with high TFRC expression.
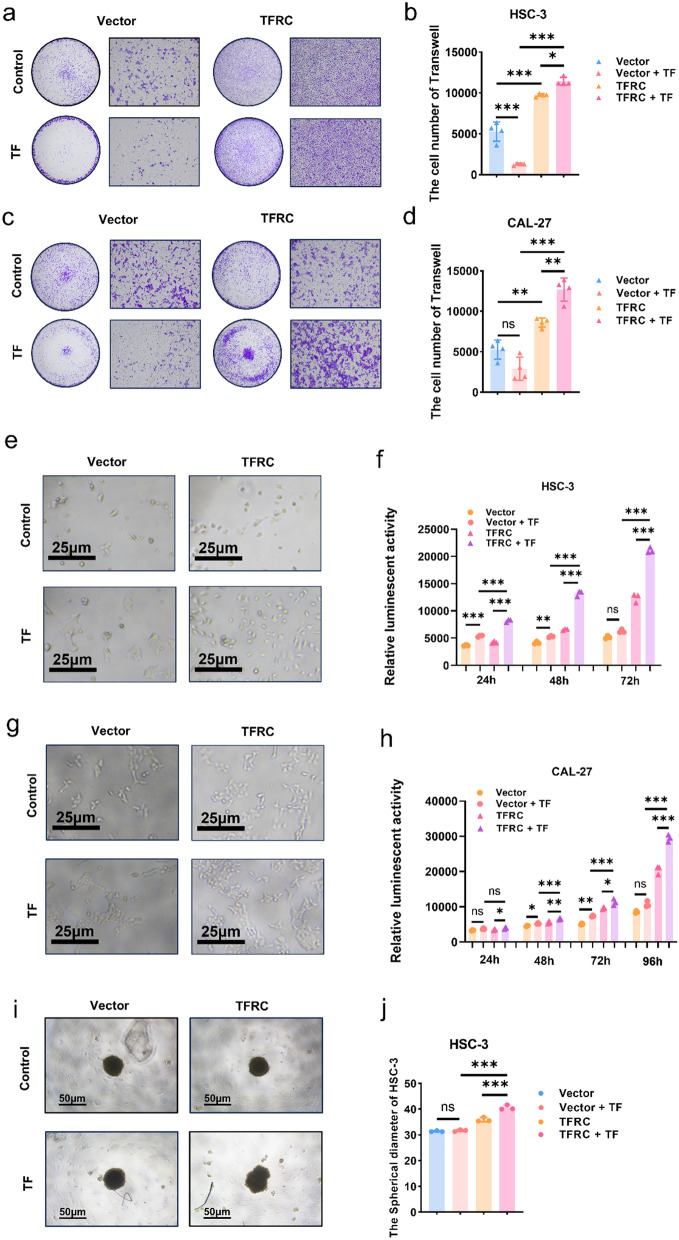
For migration assays, the roles of TF greatly depended on TFRC expression. In both CAL27 and HSC-3, TF only promoted cell migration in OSCC cells with enhanced expression of TFRC. For control cells, the addition of TF impaired cell migration (Fig. 6a–d). Besides, TF promoted OSCC proliferation with high expression of TFRC (Fig. 6e–j). The proliferation rates were the highest in OSCC with high TFRC expression and addition of TF (Fig. 6e–h), which was also proved by 3D spheroid formation assays (Fig. 6i, j). However, differences between control cells with or without TF addition was minor. The above results proved that OSCC with high expression of TFRC and exogenous TF displayed the enhanced migration and proliferation rates, indicated that TANs-TF-TFRC axis promoted OSCC progression.
Fig. 6.
The enhanced pro-tumor effects of TF in TFRC high expression cells. a Representative images of HSC-3 and HSC-3-TFRC invading to the bottom of wells with or without addition of TF. b Graphical summary of HSC-3 and HSC-3-TFRC invading to the bottom of wells with or without addition of TF, P = Ordinary one-way ANOVA. c Representative images of CAL-27 and CAL-27-TFRC invading to the bottom of wells with or without addition of TF. d Graphical summary of CAL-27 and CAL-27-TFRC invading to the bottom of wells with or without addition of TF, P = Ordinary one-way ANOVA. e Representative images of HSC-3 and HSC-3-TFRC three days with or without addition of TF post cell seeding. f Luminescence between HSC-3 and HSC-3-TFRC with or without addition of TF three days following cell seeding, P = Ordinary one-way ANOVA. g Representative images of CAL-27 and CAL-27-TFRC four days with or without addition of TF post cell seeding. h Luminescence between CAL-27 and CAL-27-TFRC with or without addition of TF four days following cell seeding, P = Ordinary one-way ANOVA. i Representative images of 3D spheroid of HSC-3 and HSC-3-TFRC with or without addition of TF. j Graphical summary 3D spheroid of HSC-3 and HSC-3-TFRC with or without addition of TF, P = Ordinary one-way ANOVA. *, ** and *** represented differences were considered statistically significant with p < 0.05, p < 0.01 and p < 0.001, respectively
OSCC patients with TANshighTFRChigh predicted worse clinical outcomes
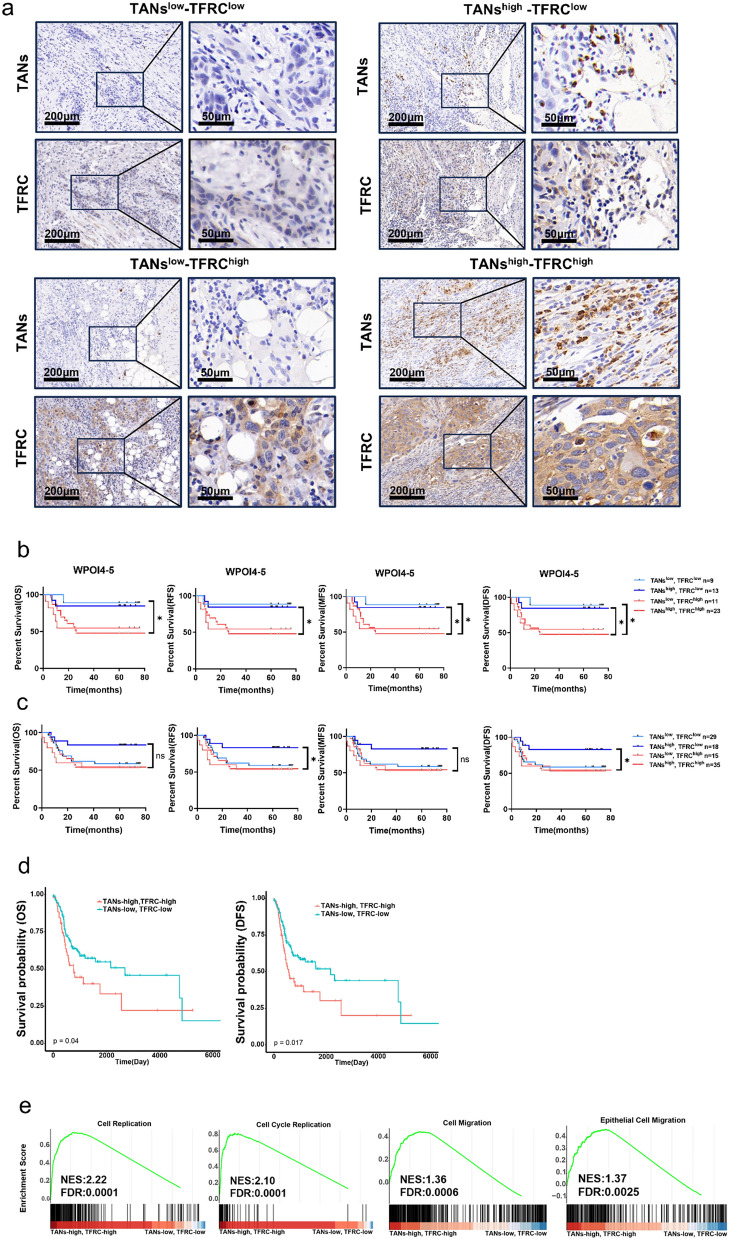
Since the above results suggested that TANs-TF-TFRC axis promoted OSCC development, we tested whether TANs-TFRC combination could predict a more accurate clinical outcome. As shown in Fig. 7a, patients could be categorized into 4 groups according to different expression of TANs and TFRC, TANslowTFRClow, TANshighTFRClow, TANslowTFRChigh and TANshighTFRChigh. We further compared the clinical outcomes of patients in both WPOI4−5 OSCC patients and total OSCC patients.
Fig. 7.
OSCC patients with TANshighTFRChigh predicted worse clinical outcomes. a Typical IHC staining of patients with different TANs and TFRC expression at ITF in OSCC. b Kaplan–Meier curves of OS, RFS, MFS and DFS between four subcategories of patients (type 1, TANslow-TFRClow, n = 9, type 2, TANslow-TFRChigh, n = 13, type 3, TANshigh-TFRClow, n = 11, type 4, TANshigh-TFRChigh, n = 23) at ITF in WPOI4−5 OSCC, P = Log-rank (Mantel–Cox) test. c Kaplan–Meier curves of OS, RFS, MFS and DFS between four subcategories of OSCC patients (type 1, TANslow-TFRClow, n = 29, type 2, TANslow-TFRChigh, n = 18, type 3, TANshigh-TFRClow, n = 35, type 4, TANshigh-TFRChigh, n = 15), P = Log-rank (Mantel–Cox) test. d Kaplan–Meier curves of OS and DFS between two subcategories of HNSCC patients (type 1, TANslow-TFRClow; type 2, TANshigh-TFRChigh), P = Log-rank (Mantel–Cox) test. e Gene set enrichment analysis (GSEA) of indicated gene sets in TANslow-TFRClow vs. TANshigh-TFRChigh HNSCC patients. FDR, false discovery rate q value; NES, normalized enrichment score
TANshighTFRChigh OSCC patients tended to display the worst prognosis in WPOI4−5 OSCC. However, due to small number of patients enrolled in each category, there were no significant differences between TANshighTFRChigh and TANslowTFRChigh patients (Fig. 7b). And TANshighTFRClow had prolonged RFS and DFS in all OSCC patients (Fig. 7c). This may due to the small number of patients. Then we resorted to the TCGA database, by stratifying head and neck squamous cell carcinoma (HNSCC) patients relied on TANs infiltration and TFRC expression status. After excluding the prognostic values of TFRC, we found that TANs-low/TFRC-low was associated with better OS and DFS (Fig. 7d, supplementary Fig. 1d). In addition, TANs-high/TFRC-high patients differentially induced genes relating to cell replication, cell cycle replication, cell migration and epithelial cell migration, further proving TANs-TF-TFRC axis promoted cell proliferation and migration, hence regulating WPOI 4–5 formation (Fig. 7e). As mTOR/AKT pathways were reported to be regulated by TFRC [30, 31], mTOR/AKT pathways were analyzed using WB. Both p-mTOR and p-AKT were elevated, indicating high TFRC promoted cell proliferation and migration via mTOR/AKT pathways (supplementary Fig. 2i).
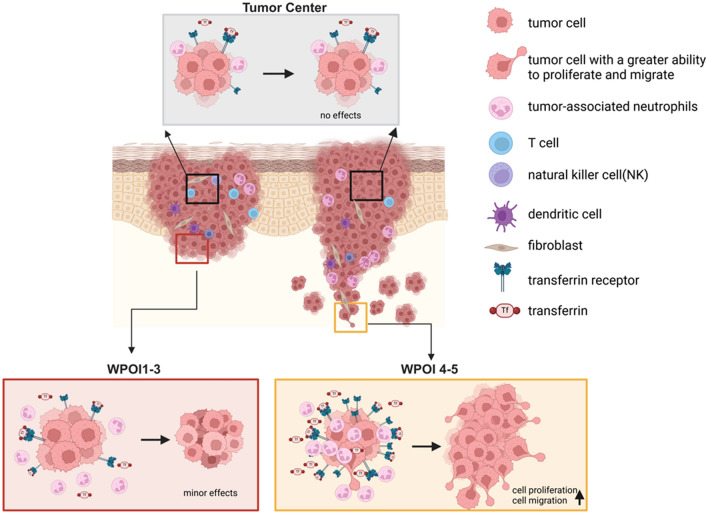
All these results showed that TANs at ITF secreted TF to meet the extra iron demands of TFRC high expression OSCC cells and promoted their proliferation and migration, thereby engaging in WPOI 4-5 formation (Fig. 8).
Fig. 8.
TANs-TF-TFRC axis promoted OSCC progression by cell migration and proliferation and engaging in WPOI shifts. Compared to the TANs and TFRC of tumor cell at ITF, the expressions of TANs and TFRC of tumor cell at TC were less, which had no effect on tumor progression. And TANs and TFRC of tumor cell expressed more at ITF, which promoted tumor progression. When TANs and TFRC of tumor cell expressed more highly, tumor cell would acquire a greater ability to migrate and promoted OSCC invasion patterns shift from WPOI 1-3 to WPOI 4-5. Created in BioRender.com
Discussion
In our study, we studied iron metabolism at ITF in OSCC, especially for WPOI4−5 patients. Cells maintain iron balance by coordinating proteins involved in iron uptake, storage, and efflux. Typically, cells uptake TF binding iron via TFRC. Though previous studies have called for the use of TFRC as a prognostic marker in OSCC, they all viewed TFRC in the tumor as a homogeneous whole to evaluate, validated only from in vitro experiments or according to the database [10]. Our study was the first to tie TFRC with OSCC invasion patterns. We observed more TFRC expression at ITF than at TC. And only at ITF, TFRC was higher in WPOI4−5 OSCC patients than WPOI1−3 OSCC patients, implying potential effects of iron metabolism in regulating OSCC invasion patterns. Interestingly, unlike the findings from Arora et al. [10], we utilized 106 OSCC patients in our sample bank to discover that TFRC was not relevant to patients prognosis. And we found that TFRC at ITF was more likely to affect patients’ prognosis than it at TC, and this result was clear when combined with WPOI. The inconsistency may partly due to the specimens in Arora’s study may were only part of OSCC and neglecting TC and ITF. Apart from TFRC, lipocalin-2 (LCN2)/SLC22A17, hyaluronate/cluster determinant 44 (CD44) and non–transferrin bound iron (NTBI) all have been found to be responsible for iron uptake [32–37]. Whether the regional differential expression of TFRC is the universal feature of all iron uptake proteins still needs to be investigated.
Cancer growth and progression as a spatial process of destruction of normal tissues, invasion and metastasis, which could form different WPOI, one of the clinicopathologic manifestations. Changes in WPOI in vitro experiments could be reflected by migration and proliferation [38]. Our study suggested that TFRC and TANs-secreted transferrin promoted the migration and proliferation of OSCC cells. Particularly, knockdown TFRC induced cell death with high expression of TFRC, indicating that iron metabolism is tightly controlled in OSCC cells. Mechanically, iron could affect tumor growth through WNT, STAT3, EGFR, ERK1/2 and AKT, HIF1α and HIF2α, Ferritin pathways, of which EGFR and HIF1α were able to affect TFRC expression [27]. Here we found high TFRC expression is accompanied with activated mTOR/AKT pathways. However, these evidences need to be strengthened in order to confirm TFRC promotes OSCC progression by activating the mTOR signaling pathway in an iron‑dependent manner. In conclusion, our study provides preliminary evidence that TFRC may regulate the mTOR/AKT pathways and promote cell proliferation and migration in OSCC. However, given the complexity of iron metabolism and its interplay with various signaling pathways, further investigation is required to fully understand the role of TFRC in OSCC progression.
Transferrin is mainly secreted by the liver and then transported to the plasma, and less research have been done on TANs-derived transferrin. Although previous studies found that macrophages and lymphocytes exhibit an iron release phenotype, the interplay between TANs and OSCC tumor was blank. Our study found that TANs were the major source of TF in the tumor environment and positively correlated with TF. Combing these results with both higher TANs and TF in WPOI4-5 OSCC patients, we clearly established the relationship between TANs-TF and WPOI progression. Although in vitro analysis proved that TANs promoted OSCC cell proliferation and migration, desferrioxamine was not incorporated into our experiments. Therefore, the experimental evidence was not strong enough, which needed to be further strengthened. Anyway, we found that TFRC was more expressed at ITF in OSCC, especially in WPOI 4–5, accompanied by high infiltration of TANs. TANs-TF-TFRC axis promoted OSCC cells migration and proliferation and was a potential mechanism affecting the shift in OSCC invasion patterns.
Supplementary Information
Below is the link to the electronic supplementary material.
Acknowledgements
None.
Author contributions
Conceptualization, Q.S. and Y.W.; methodology, W.L.; software, Z.L.; validation, Y.S.; formal analysis, S.C. and P.W.; investigation, Q.S. and Q.Y.; resources, S.X. and H.L.; data curation, Q.S. and Y.W.; writing—original draft, Q.S.; writing—review and editing, Q.S. and Y.W.; visualization, Q.S. and Y.J.; supervision, X.Z. and F.Z.; project administration, Y.N. and X.H.; funding acquisition, Y.N. and X.Z. All authors reviewed the manuscript.
Funding
This work was supported by the National Natural Science Foundation of China (Nos. 82173159, 82002865); Key Research and Development Projects in Jiangsu Province (No. BE2020628); Nanjing Medical Science and technology development Foundation, Nanjing Department of Health (Nos. YKK20151, YKK21286); Nanjing Medical Science and Technique Development Foundation (No. ZDX22001). “3456” Cultivation Program for Junior Talents of Nanjing Stomatological School, Medical School of Nanjing University (No. 0222R216).
Data availability
The datasets generated during and/or analyzed during the current study are available from the corresponding author on reasonable request. No datasets were generated or analyzed during the current study.
Declarations
Conflict of interest
The authors have no relevant financial or nonfinancial interests to disclose.
Ethics approval and consent to participate
The Ethics Committee of Nanjing Stomatology Hospital (JX-2023-NL28) conducted a thorough review and granted approval to the studies that included human participants. The research was conducted in compliance with the Declaration of Helsinki. Written informed consent was given by the patients to take part in this study.
Consent to publication
This manuscript contains no individual person’s data.
Footnotes
Publisher's Note
Springer Nature remains neutral with regard to jurisdictional claims in published maps and institutional affiliations.
Contributor Information
Feng Zhu, Email: drzf@nju.edu.cn.
Xiaoxin Zhang, Email: 693216371@qq.com.
Xiaofeng Huang, Email: hxf681008@sina.com.
Yanhong Ni, Email: Yanhong.Ni@nju.edu.cn.
References
- 1.D’Souza S, Addepalli V (2018) Preventive measures in oral cancer: an overview. Biomed Pharmacother 107:72–80 [DOI] [PubMed] [Google Scholar]
- 2.Sarode G et al (2020) Epidemiologic aspects of oral cancer. Dis Mon 66(12):100988 [DOI] [PubMed] [Google Scholar]
- 3.Sung H et al (2021) Global Cancer Statistics 2020: GLOBOCAN Estimates of Incidence and Mortality Worldwide for 36 Cancers in 185 Countries. CA Cancer J Clin 71(3):209–249 [DOI] [PubMed] [Google Scholar]
- 4.Gharat SA, Momin M, Bhavsar C (2016) Oral Squamous Cell Carcinoma: current treatment strategies and nanotechnology-based approaches for prevention and therapy. Crit Rev Ther Drug Carrier Syst 33(4):363–400 [DOI] [PubMed] [Google Scholar]
- 5.Chow LQM (2020) Head and neck cancer. N Engl J Med 382(1):60–72 [DOI] [PubMed] [Google Scholar]
- 6.Wang W et al (2021) Multiple tumour recurrence in oral, head and neck cancer: characterising the patient journey. J Oral Pathol Med 50(10):979–984 [DOI] [PubMed] [Google Scholar]
- 7.Kukulj S et al (2010) Altered iron metabolism, inflammation, transferrin receptors, and ferritin expression in non-small-cell lung cancer. Med Oncol 27(2):268–277 [DOI] [PubMed] [Google Scholar]
- 8.Yang C et al (2022) Role of TFRC as a novel prognostic biomarker and in immunotherapy for pancreatic carcinoma. Front Mol Biosci 9:756895 [DOI] [PMC free article] [PubMed] [Google Scholar]
- 9.Kim H et al (2023) Transferrin receptor-mediated iron uptake promotes colon tumorigenesis. Adv Sci (Weinh) 10(10):e2207693 [DOI] [PMC free article] [PubMed] [Google Scholar]
- 10.Arora R et al (2023) NCBP2 and TFRC are novel prognostic biomarkers in oral squamous cell carcinoma. Cancer Gene Ther 30(5):752–765 [DOI] [PMC free article] [PubMed] [Google Scholar]
- 11.Zhang Q et al (2024) Iron promotes ovarian cancer malignancy and advances platinum resistance by enhancing DNA repair via FTH1/FTL/POLQ/RAD51 axis. Cell Death Dis 15(5):329 [DOI] [PMC free article] [PubMed] [Google Scholar]
- 12.He XY et al (2023) LncRNA modulates Hippo-YAP signaling to reprogram iron metabolism. Nat Commun 14(1):2253 [DOI] [PMC free article] [PubMed] [Google Scholar]
- 13.Belvin BR, Lewis JP (2022) Ferroportin depletes iron needed for cell cycle progression in head and neck squamous cell carcinoma. Front Oncol 12:1025434 [DOI] [PMC free article] [PubMed] [Google Scholar]
- 14.Shirakihara T et al (2022) Transferrin receptor 1 promotes the fibroblast growth factor receptor-mediated oncogenic potential of diffused-type gastric cancer. Oncogene 41(18):2587–2596 [DOI] [PubMed] [Google Scholar]
- 15.Devin J et al (2022) Targeting cellular iron homeostasis with ironomycin in diffuse large b-cell lymphoma. Cancer Res 82(6):998–1012 [DOI] [PMC free article] [PubMed] [Google Scholar]
- 16.Li M et al (2022) Sphingosine-1-phosphate transporter spinster homolog 2 is essential for iron-regulated metastasis of hepatocellular carcinoma. Mol Ther 30(2):703–713 [DOI] [PMC free article] [PubMed] [Google Scholar]
- 17.Haffner MC et al (2021) Genomic and phenotypic heterogeneity in prostate cancer. Nat Rev Urol 18(2):79–92 [DOI] [PMC free article] [PubMed] [Google Scholar]
- 18.Dagogo-Jack I, Shaw AT (2018) Tumour heterogeneity and resistance to cancer therapies. Nat Rev Clin Oncol 15(2):81–94 [DOI] [PubMed] [Google Scholar]
- 19.Lugli A et al (2021) Tumour budding in solid cancers. Nat Rev Clin Oncol 18(2):101–115 [DOI] [PubMed] [Google Scholar]
- 20.Inagaki K et al (2021) Role of tumor-associated macrophages at the invasive front in human colorectal cancer progression. Cancer Sci 112(7):2692–2704 [DOI] [PMC free article] [PubMed] [Google Scholar]
- 21.Mamilos A et al (2023) Tumor immune microenvironment heterogeneity at the invasion front and tumor center in oral squamous cell carcinoma as a perspective of managing this cancer entity. J Clin Med 12(4). [DOI] [PMC free article] [PubMed]
- 22.Hu J et al (2023) Deciphering tumor ecosystems at super resolution from spatial transcriptomics with TESLA. Cell Syst 14(5):404–417 [DOI] [PMC free article] [PubMed] [Google Scholar]
- 23.Ding L et al (2022) OXTR(High) stroma fibroblasts control the invasion pattern of oral squamous cell carcinoma via ERK5 signaling. Nat Commun 13(1):5124 [DOI] [PMC free article] [PubMed] [Google Scholar]
- 24.Zhou B et al (2020) Interaction between laminin-5gamma2 and integrin beta1 promotes the tumor budding of colorectal cancer via the activation of Yes-associated proteins. Oncogene 39(7):1527–1542 [DOI] [PubMed] [Google Scholar]
- 25.Chang HY, Hang JF, Kuo YJ (2024) New histopathologic risk model for early T-stage oral squamous cell carcinoma: focusing on a modified worst pattern of invasion system and a new tumor budding score. Am J Surg Pathol 48(1):59–69 [DOI] [PubMed] [Google Scholar]
- 26.Mehta KJ, Sharp PA (2020) Iron elevates mesenchymal and metastatic biomarkers in HepG2 cells. Sci Rep 10(1):21926 [DOI] [PMC free article] [PubMed] [Google Scholar]
- 27.Torti SV, Torti FM (2020) Iron and cancer: 2020 vision. Cancer Res 80(24):5435–5448 [DOI] [PMC free article] [PubMed] [Google Scholar]
- 28.Vela D (2020) Iron in the tumor microenvironment. Adv Exp Med Biol 1259:39–51 [DOI] [PubMed] [Google Scholar]
- 29.Liang W, Li Q, Ferrara N (2018) Metastatic growth instructed by neutrophil-derived transferrin. Proc Natl Acad Sci U S A 115(43):11060–11065 [DOI] [PMC free article] [PubMed] [Google Scholar]
- 30.Feng G et al (2023) Knockdown of TFRC suppressed the progression of nasopharyngeal carcinoma by downregulating the PI3K/Akt/mTOR pathway. Cancer Cell Int 23(1):185 [DOI] [PMC free article] [PubMed] [Google Scholar]
- 31.Wang F et al (2024) Transferrin receptor 1 promotes hepatocellular carcinoma progression and metastasis by activating the mTOR signaling pathway. Hepatol Int 18(2):636–650 [DOI] [PubMed] [Google Scholar]
- 32.Nagai K et al (2014) Development of a complete human anti-human transferrin receptor C antibody as a novel marker of oral dysplasia and oral cancer. Cancer Med 3(4):1085–1099 [DOI] [PMC free article] [PubMed] [Google Scholar]
- 33.Devireddy LR et al (2005) A cell-surface receptor for lipocalin 24p3 selectively mediates apoptosis and iron uptake. Cell 123(7):1293–1305 [DOI] [PubMed] [Google Scholar]
- 34.Chi Y et al (2020) Cancer cells deploy lipocalin-2 to collect limiting iron in leptomeningeal metastasis. Science 369(6501):276–282 [DOI] [PMC free article] [PubMed] [Google Scholar]
- 35.Pinilla-Tenas JJ et al (2011) Zip14 is a complex broad-scope metal-ion transporter whose functional properties support roles in the cellular uptake of zinc and nontransferrin-bound iron. Am J Physiol Cell Physiol 301(4):C862–C871 [DOI] [PMC free article] [PubMed] [Google Scholar]
- 36.Coffey R, Knutson MD (2017) The plasma membrane metal-ion transporter ZIP14 contributes to nontransferrin-bound iron uptake by human beta-cells. Am J Physiol Cell Physiol 312(2):C169–C175 [DOI] [PMC free article] [PubMed] [Google Scholar]
- 37.Muller S et al (2020) CD44 regulates epigenetic plasticity by mediating iron endocytosis. Nat Chem 12(10):929–938 [DOI] [PMC free article] [PubMed] [Google Scholar]
- 38.Seferbekova Z et al (2023) Spatial biology of cancer evolution. Nat Rev Genet 24(5):295–313 [DOI] [PubMed] [Google Scholar]
Associated Data
This section collects any data citations, data availability statements, or supplementary materials included in this article.
Supplementary Materials
Data Availability Statement
The datasets generated during and/or analyzed during the current study are available from the corresponding author on reasonable request. No datasets were generated or analyzed during the current study.


