

Abstract
Background:
We evaluated the efficacy of structured individualized education combined with real-time continuous glucose monitoring (rt-CGM, Dexcom G6) in improving glycemic outcomes in insulin-treated adults with poorly controlled type 2 diabetes (T2D).
Methods:
This multicenter, 16-week, single-arm study included 66 adults with T2D (multiple daily insulin [MDI]: 33; basal insulin: 33) with a ≥7.8%. Each cohort comprised 15 participants aged ≥60 years. The participants attended four educational sessions. The primary outcome was a change in glycated hemoglobin (HbA1c) levels between baseline and week 16.
Results:
Sixty-four individuals were included in this study, with a mean age of 58.3 ± 12.4 years. The mean HbA1c levels decreased from 9.0% at baseline to 7.1% at 16 weeks in the MDI group (difference: −1.8%, 95% confidence interval [CI] = −2.3 to −1.3) and from 8.8% to 7.0% in the basal insulin group (difference: −1.8%, 95% CI = −2.1 to −1.4). In the total population, the mean time in range 70 to 180 mg/dL increased by 25.2% (6 hours 4 minutes, 95% CI = 20.6 to 29.8), whereas the time in tight range 70 to 140 mg/dL increased by 17.3% (4 hours 10 minutes, 95% CI = 14.0 to 20.7). Both groups maintained a target of <1% of the time below the range of <54 mg/dL. Improvements in HbA1c and CGM metrics were comparable between individuals aged ≥60 years and those aged <60 years (all P-values for interaction >.1).
Conclusions:
In adults with poorly controlled insulin-treated T2D, rt-CGM use with structured education significantly improved the HbA1c and CGM metrics, primarily by reducing hyperglycemia, regardless of age.
Keywords: education, glycated hemoglobin, insulin, older adults, real-time continuous glucose monitoring, type 2 diabetes
Introduction
Advanced technology can potentially improve glycemic control and reduce the risk of complications in individuals with insulin-treated type 2 diabetes (T2D). However, its use is less common in insulin-treated T2D than in type 1 diabetes (T1D), despite the similar individualized glycemic goals for both groups1,2 and the higher proportion of individuals with T2D requiring insulin therapy. 3 Furthermore, insulin-treated T2D has a two- to three-fold higher risk of macrovascular complications compared with noninsulin-treated T2D, 4 primarily due to uncontrolled hyperglycemia. 5 Thus, effective management strategies, including the use of technology, may be necessary in insulin-treated T2D.
Various studies have demonstrated the benefits of continuous glucose monitoring (CGM) in individuals with insulin-treated T2D.6-8 Combining CGM with structured education has been associated with even greater improvements in glycemic control.9-12 However, previous studies examining the effect of CGM combined with education in individuals with insulin-treated T2D have focused solely on intermittent scanning continuous glucose monitoring (is-CGM) rather than real-time continuous glucose monitoring (rt-CGM).9,11
Advanced age is a recognized barrier to various aspects of CGM use. 13 Consequently, few studies have included older adults when investigating the efficacy of CGM.13,14 However, as the majority of individuals with insulin-treated T2D are aged over 60 years, 3 this population should be included in studies to accurately reflect the real-world efficiency observed in clinical practice.
We expect that the combination of rt-CGM combined and structured education will significantly improve glycemic control. Therefore, we evaluated whether combining rt-CGM with structured individualized education could enhance the glycemic outcomes of adults with insulin-treated T2D, focusing on older individuals.
Methods
Study Design and Participants
The CRANE (Continuous Real-Time Glucose Monitoring and Naïve Subjects: An Evaluation on Expanded Access) study was conducted at three tertiary hospitals (Samsung Medical Center [SMC], Wonju Severance Christian Hospital, and Seoul National University Hospital) and one secondary hospital (Kyung Hee University at Gangdong). The participants were screened between January 2023 and June 2023. Adults aged ≥19 years with a clinical diagnosis of T2D for at least six months, who had been using multiple daily insulin (MDI) (two or more prandial insulin injections) or basal insulin for at least three months, and a glycated hemoglobin (HbA1c) level of >7.8% were eligible for the study. Each cohort comprised 15 participants aged ≥60 years. The participants were excluded if they met any of the following criteria: an estimated glomerular filtration rate of <30 mL/min/1.73 m2; use of rt-CGM within three months prior to screening (is-CGM users were not excluded); <70% sensor wear time during blinded CGM use in the baseline period; or any conditions affecting the stability of HbA1c measurements within three months prior to screening. Finally, 66 participants (MDI group: 33; basal insulin-only group: 33) were included. A flowchart of the participant selection process is presented in Supplementary Figure 1.
All participants provided written informed consent. The study was approved by the Institutional Review Board of all four tertiary hospitals (no. SMC2022−08-125, CR222013, KNHMC2022−08−042, and D-2209−019-1356) and was conducted in accordance with the ethical guidelines of the Declaration of Helsinki and Korean Good Clinical Practice. This study was registered in cris.nih.go.kr (KCT0009345).
Study Procedures
The study procedure is summarized in Supplementary Figure 2. The baseline CGM data of all participants were collected over a ten-day period using Dexcom G6 (Dexcom, Inc, San Diego, California) in blinded mode prior to education (visit 1). Following this, the participants used the unblinded personal Dexcom G6 for four months throughout the study (visits 2-6). After removing the blinded CGM, all eligible participants required to undergo a diabetes knowledge assessment (Supplementary Figures 3 and 4) and complete a Diabetes Treatment Satisfaction Questionnaire (DTSQ). The participants then received standardized education on device handling, sensor insertion, calibration measurements, alert setup, and interpretation of ambulatory glucose profile (AGP) reports, as previously described. 12 Structured education tailored to the insulin delivery method was provided once a month for four months (visits 2, 3, 4, and 5). The laboratory data, diabetes knowledge assessment scores, and DTSQ scores were reassessed at week 16 for both groups. The Diabetes Treatment Satisfaction Questionnaire change (DTSQc) scores were obtained at the end of the study.
Education
An overview of the educational content is provided in Supplementary Table 1. Four sessions of structured individualized education were delivered by a dietitian and one or two nurses experienced in diabetes care. The education covered several key topics, including the method of calculating, initiating, and adjusting basal insulin; using trend arrows to prevent glycemic variability; and interpreting AGP reports to modify behavior or make therapeutic decisions tailored specifically for rt-CGM. For the MDI group, sessions included instructions on prandial insulin dosing using carbohydrate estimation and correction dose. The education focused on estimation rather than precise counting of carbohydrate intake. The educational protocol for CGM was based on the guidelines of the Korean Diabetes Association. 15 Each session lasted 30 to 120 minutes, depending on participants’ prior knowledge and experience.
Diabetes Treatment Satisfaction Questionnaire Score
Changes in satisfaction with diabetes treatment from baseline were evaluated using the DTSQ. The DTSQ items were divided into three categories: (1) satisfaction, (2) hyperglycemia, and (3) hypoglycemia. The DTSQ satisfaction score was calculated by summing the scores of six questions rated on a scale ranging from 0 (very dissatisfied) to 6 (very satisfied). The DTSQ hyperglycemia and hypoglycemia scores each reflected a single question rated on a scale of 0 (none of the time) to 6 (most of the time).
Participants provided their DTSQc scores at the end of the study. The DTSQc is a questionnaire designed to assess changes in treatment satisfaction by allowing participants to compare their satisfaction levels before the study (baseline) and at the end of the study. Similar to the DTSQ, this assessment comprises three items; however, there are differences in the scoring method. The items on the DTSQc were scored from 3− (indicating “much less satisfied now”) to 3+ (indicating “much more satisfied now”), with a score of 0 (midpoint) representing no change.
Diabetes Knowledge Assessment Score
A knowledge test was administered to assess the participants’ baseline understanding of insulin treatment and lifestyle modifications while using CGM (Supplementary Figure 3, basal insulin group; Supplementary Figure 4, MDI group). The scores ranged from 0 to 14 for the basal insulin group and 0 to 20 for the MDI group.
Outcomes
The primary outcome was the change in HbA1c levels from baseline to week 16. The prespecified secondary outcomes were mean changes in CGM metrics from baseline (ten days of blinded CGM wear) to week 16 (90 days of CGM wear). These outcomes were as follows: percentages of time in range (TIR = 70-180 mg/dL), time in tight range (TIT = 70-140 mg/dL), time below range (TBR <54 mg/dL), TBR <70 mg/dL, time above range (TAR >180 mg/dL), and TAR >250 mg/dL; glycemic variability, expressed as the coefficient of variation; mean glucose; glucose management indicator; extended hypoglycemia (120 consecutive minutes with a sensor glucose value of <54 mg/dL); extended hyperglycemia (120 consecutive minutes with a sensor glucose value of >250 mg/dL); glycemia risk index; insulin doses; knowledge score; and DTSQ and DTSQc scores.
The reported adverse events were severe hyperglycemia, including diabetic ketoacidosis, hyperosmolar hyperglycemia, and severe hypoglycemia.
Statistical Analysis
The total sample size of 66 participants was determined to have 80% power to detect a change in mean HbA1c levels from baseline to week 16, assuming a difference of 0.4%, a standard deviation (SD) of 10%, and a dropout rate of 10%. Statistical analyses were performed using intention-to-treat analysis (full analysis set).
Continuous variables were expressed as mean (SD) and median (interquartile range) values, whereas categorical variables were expressed as percentages. Mean values of continuous variables were compared between the groups using independent two-sample t-test or Wilcoxon rank-sum test. The paired t-tests were used to analyze the mean changes in continuous variables with a normal distribution, whereas the Wilcoxon signed-rank test was employed to assess skewed outcomes.
Statistical analyses were performed using SAS (version 9.4, SAS Institute Inc, Cary, North Carolina) and SPSS (version 29.0, SPSS Inc, Chicago, Illinois). A two-tailed P-value of .05 was considered significant.
Results
Baseline Characteristics
Thirty-one participants in the MDI group and 33 in the basal insulin group completed the 16-week study period (Supplementary Figure 1). The two groups had similar baseline characteristics except for the use of glucose-lowering medications (Table 1). The participants’ mean age was 58.3 ± 12.4 years, the duration of diabetes was 16.7 ± 7.9 years, and 68.2% (n = 45) of the participants were men. The mean baseline HbA1c level was 8.9% ± 1.0%. Thirty-three participants aged ≥60 years were included in the study, with a mean baseline age of 68.0 ± 5.2 years.
Table 1.
Baseline Characteristics of Study Participants by Group.
| Total (N = 66) | MDI (N = 33) | Basal only (N = 33) | |
|---|---|---|---|
| Age, years | 58.3 (12.4) | 59.4 (12.6) | 57.1 (12.3) |
| <60 years (N =33) | 48.6 (9.6) | 49.0 (9.2) | 48 (10.2) |
| ≥60 years (N =33) | 68.0 (5.2) | 69.2 (5.2) | 66.7 (5.0) |
| Sex (male) | 45 [68.2] | 25 [75.8] | 20 [60.6] |
| Body weight, kg | 74.0 (15.3) | 76.3 (13.9) | 71.7 (16.5) |
| Body mass index, kg/m2 | 26.8 (4.7) | 27.4 (4.2) | 26.2 (5.2) |
| HbA1c, % | 8.9 (1.0) | 9.0 (1.1) | 8.8 (0.9) |
| HbA1c, mmol/mol | 74 (11) | 75 (12) | 73 (10) |
| Diabetes duration, years | 16.7 (7.9) | 17.2 (8.8) | 16.3 (7.1) |
| Insulin use duration, years | 7.3 (5.4) | 8.6 (5.4) | 6.1 (5.2) |
| Metformin | 58 [87.9] | 28 [84.8] | 30 [90.9] |
| SGLT2i | 27 [40.9] | 18 [54.5] | 9 [27.3] |
| DPP4i | 22 [33.3] | 16 [48.5] | 6 [18.2] |
| GLP-1 RA | 20 [30.3] | 1 [3] | 19 [57.6] |
| Sulfonylurea | 8 [12.1] | 2 [6.1] | 6 [18.2] |
Values are expressed as the mean (SD) or n [%].
Abbreviations: DPP4i, dipeptidyl peptidase 4 inhibitor; GLP-1-RA, glucagon-like peptide 1 receptor agonist; SGLT2i, sodium glucose cotransporter 2 inhibitor.
Primary Outcome (Glycated Hemoglobin Level Change at Week 16)
Both groups demonstrated similar results (Figure 1). In the MDI group, the HbA1c level decreased by −1.8 percentage points (95% confidence interval [CI]: −2.3 to −1.3, P < .001), from 9.0% at baseline to 7.1% at week 16. In the basal insulin group, the HbA1c level also decreased by −1.8 percentage points (95% CI = −2.1 to −1.4, P < .001), from 8.8% at baseline to 7.0% at week 16. The changes in HbA1c level were consistent in the full analysis and per-protocol subsets. The glycemic outcomes at each of the four investigated sites are shown in Supplementary Figure 5.
Figure 1.
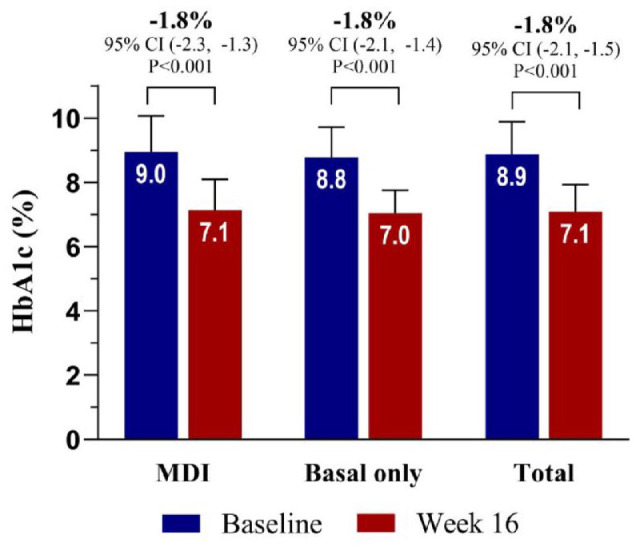
Primary outcome (change in HbA1c levels from baseline to week 16, full analyses).
*P < .001.
Abbreviation: HbA1c, glycated hemoglobin.
Changes in Continuous Glucose Monitoring Metrics and Insulin Use From Baseline to Weeks 4, 8, 12, and 16
Changes in glycemic outcomes, as measured by the CGM metrics, are summarized in Figure 2 and Tables 2 and 3. In the total population, TIR increased from 34.4% ± 19.9% to 59.4% ± 18.2% from baseline to week 16, with a significant increase of 25.2 percentage points (6 hours 4 minutes, 95% CI = 20.6 to 29.8, P < .001). The TIT increased with a mean difference of 17.3 percentage points (4 hours 10 minutes, 95% CI = 14.0 to 20.7, P < .001). The TAR >250 mg/dL decreased with a mean difference of 19.8 percentage points (4 hours 46 minutes, 95% CI = −24.2 to −15.4, P < .001). Changes in these three metrics were similar between the MDI and basal insulin groups. Throughout the study, both groups maintained a target of <1% with a TBR of <54 mg/dL. Details of the changes in CGM metrics from baseline to weeks 4, 8, 12, and 16 are summarized in Supplementary Tables 2 and 3.
Figure 2.

Secondary outcomes (changes in the time in target ranges).
Abbreviations: CV, coefficient of variation; GMI, glucose management indicator; TAR, time above range; TBR, time below range; TIR, time in range; TIT, time in tight range.
Table 2.
Glycemic Outcomes at Week 16.
| Variables | Total (n = 64) | |||
|---|---|---|---|---|
| Baseline a | Week 16 b | Difference (95% CI) | P | |
| Sensor wear time, % | 98.6 (94.9 to 99.3) | 96.3 (92.8 to 98.0) | −1.3 (−4.6 to 1.3) | .061 |
| Mean glucose, mg/dL | 222.9 (42.8) | 178.3 (31.1) | −44.6 (−53.4 to −35.7) | <.001 |
| Mean glucose, mmol/L | 12.4 (2.4) | 9.9 (1.7) | −2.5 (−3.0 to −2.0) | <.001 |
| GMI, % | 8.6 (1.0) | 7.6 (0.7) | −1.1 (−1.3 to −0.9) | <.001 |
| GMI, mmol/mol | 70 (11) | 60 (7) | −12 (−14 to −9) | <.001 |
| TIR 70-180 mg/dL, % (3.9-10.0 mmol/L) |
34.1 (19.9) | 59.4 (18.2) | 25.2 (20.6 to 29.8) | <.001 |
| TIT 70-140 mg/dL (3.9-7.8 mmol/L) |
14.6 (12.9) | 31.9 (14.0) | 17.3 (14.0 to 20.7) | <.001 |
| TAR >180 mg/dL (>10 mmol/L) |
65.7 (20.0) | 40.4 (18.2) | −25.4 (−30.0 to −20.8) | <.001 |
| TAR 181-250 mg/dL, % (10.1-13.9 mmol/L) |
32.5 (9.2) | 27.0 (6.9) | −5.6 (−8.2 to −3.0) | <.001 |
| TAR >250 mg/dL, % (>13.9 mmol/L) |
29.1 (18.3 to 47.7) | 7.9 (4.4 to 16.2) | −19.8 (−24.2 to −15.4) | <.001 |
| TBR <70 mg/dL (<3.9 mmol/L) |
0.0 (0.0 to 0.0) | 0.2 (0.1 to 0.4) | 0.1 (0.1 to 0.2) | <.001 |
| TBR 54-69 mg/dL, % (3.0-3.8 mmol/L) |
0.0 (0.0 to 0.0) | 0.1 (0.0 to 0.3) | 0.1 (0.0 to 0.2) | <.001 |
| TBR <54 mg/dL, % (<3.0 mmol/L) |
0.0 (0.0 to 0.0) | 0.0 (0.0 to 0.1) | 0.0 (0.0 to 0.0) | .007 |
| GRI | 73.3 (23.2) | 43.1 (24.0) | −30.2 (−36.0 to −24.4) | <.001 |
| CV, % | 29.5 (5.2) | 30.7 (4.0) | 1.2 (0.0 to 2.4) | .040 |
| Extended hypoglycemia event rate <70 mg/dL (<3.9 mmol/L) c | 0.0 (0.2) | 0.1 (0.3) | 0.0 (0.0 to 0.1) | .375 |
| Extended hyperglycemic event rate >250 mg/dL (>13.9 mmol/L) d | 14.3 (8.5) | 11.9 (13.0) | −2.4 (−5.6 to 0.8) | .138 |
Blinded CGM data were obtained at baseline.
At week 16, the CGM metrics were analyzed using data from the preceding 90 days.
Number of events with sensor glucose <70 mg/dL (<3·9 mmol/L) lasting at least 120 minutes; event ends when glucose returns to ≥70 mg/dL (≥3·9 mmol/L) for ≥15 minutes.
Number of events with sensor glucose >250 mg/dL (>13·9 mmol/L) lasting at least 120 minutes; event ends when glucose returns to ≤180 mg/dL (≤10·0 mmol/L) for ≥15 minutes.
Abbreviations: CGM, continuous glucose monitoring; CV, coefficient of variation; GMI, glucose management indicator; GRI, glycemic risk index, HbA1c, glycated hemoglobin; TAR, time above range; TBR, time below range; TIR, time in range; TIT, time in tight range.
Table 3.
Glycemic Outcomes in the MDI and Basal Insulin Only Groups at Week 16.
| Variables | MDI (n = 31) | Basal only (n = 33) | ||||||
|---|---|---|---|---|---|---|---|---|
| Baseline a | Week 16 b | Difference (95% CI) | P | Baseline a | Week 16 b | Difference (95% CI) | P | |
| Sensor wear time, % | 98.0 (93.8 to 99.3) | 96.7 (94.7 to 98.3) | −0.6 (−2.8 to 2.0) | .044 | 98.6 (96.4 to 99.5) | 95.6 (92.2 to 97.5) | −1.7 (−5.1 to 0.9) | .049 |
| Mean glucose, mg/dL | 225.1 (44.9) | 180.1 (35.4) | −45.0 (−59.2 to −30.8) | <.001 | 220.7 (41.3) | 176.6 (26.7) | −44.2 (−55.7 to −32.6) | <.001 |
| Mean glucose, mmol/L | 12.5 (2.5) | 10.0 (2.0) | −2.5 (−3.3 to −1.7) | <.001 | 12.3 (2.3) | 9.8 (1.5) | −2.5 (−3.1 to −1.8) | <.001 |
| GMI, % | 8.7 (1.1) | 7.6 (0.8) | −1.1 (−1.4 to −0.7) | <.001 | 8.6 (1.0) | 7.5 (0.6) | −1.1 (−1.3 to −0.8) | <.001 |
| GMI, mmol/mol | 72 (12) | 60 (8) | −12 (−15 to −8) | <.001 | 70 (11) | 58 (6) | −12 (−15 to −9) | <.001 |
| TIR 70-180 mg/dL, % (3.9-10.0 mmol/L) |
33.8 (20.9) | 58.9 (19.8) | 25.1 (17.8 to 32.4) | <.001 | 34.4 (19.2) | 59.8 (16.7) | 25.4 (19.4 to 31.4) | <.001 |
| TIT 70-140 mg/dL (3.9-7.8 mmol/L) |
14.5 (13.8) | 31.0 (14.1) | 16.5 (11.3 to 21.7) | <.001 | 14.7 (12.1) | 32.8 (14.1) | 18.1 (13.6 to 22.6) | <.001 |
| TAR >180 mg/dL (>10 mmol/L) |
66.1 (21.1) | 40.8 (19.9) | −25.3 (−32.6 to −17.9) | <.001 | 65.4 (19.3) | 39.9 (16.6) | −25.5 (−31.5 to −19.5) | <.001 |
| TAR 181-250 mg/dL, % (10.1-13.9 mmol/L) |
31.7 (9.6) | 26.5 (6.4) | −5.2 (−9.1 to −1.3) | .010 | 33.4 (8.9) | 27.4 (7.5) | −5.9 (−9.7 to −2.2) | .003 |
| TAR >250 mg/dL, % (>13.9 mmol/L) |
29.8 (18.2 to 50.6) | 6.9 (3.7 to 17.6) | −20.1 (−27.0 to −13.1) | <.001 | 27.1 (19.5 to 44.6) | 10.1 (5.2 to 13.3) | −19.6 (−25.3 to −13.8) | <.001 |
| TBR <70 mg/dL (<3.9 mmol/L) |
0.0 (0.0 to 0.0) | 0.2 (0.1 to 0.4) | 0.2 (0.0 to 0.3) | <.001 | 0.0 (0.0 to 0.1) | 0.2 (0.0 to 0.3) | 0.1 (0.0 to 0.3) | .006 |
| TBR 54-69 mg/dL, % (3.0-3.8 mmol/L) |
0.0 (0.0 to 0.0) | 0.1 (0.1 to 0.3) | 0.1 (0.0 to 0.3) | <.001 | 0.0 (0.0 to 0.1) | 0.1 (0.0 to 0.2) | 0.1 (0.0 to 0.3) | .002 |
| TBR <54 mg/dL, % (<3.0 mmol/L) |
0.0 (0.0 to 0.0) | 0.0 (0.0 to 0.1) | 0.0 (0.0 to 0.1) | .001 | 0.0 (0.0 to 0.0) | 0.0 (0.0 to 0.1) | 0.0 (−0.1 to 0.1) | .310 |
| CV, % | 29.4 (5.4) | 30.3 (3.9) | 0.9 (−0.8 to 2.5) | .289 | 29.5 (5.1) | 31.0 (4.2) | 1.5 (−0.2 to 3.2) | .079 |
| Extended hypoglycemia event rate <70 mg/dL (<3.9 mmol/L) c | 0.0 (0.0) | 0.1 (0.3) | 0.1 (0.0 to 0.2) | .500 | 0.1 (0.3) | 0.1 (0.4) | 0.0 (−0.1 to 0.1) | 1.000 |
| Extended hyperglycemic event rate >250 mg/dL (>13.9 mmol/L) d | 15.5 (9.3) | 12.8 (13.3) | −2.7 (−7.5 to 2.1) | .258 | 13.1 (7.5) | 11.0 (12.8) | −2.1 (−6.6 to 2.4) | .347 |
| GRI | 74.0 (24.3) | 43.6 (25.7) | −30.4 (−39.4 to −21.4) | <.001 | 72.7 (22.5) | 42.6 (22.6) | −30.1 (−37.9 to −22.2) | <.001 |
| Total insulin dose/day, U | 52.4 (34.5) | 66.3 (58.0) | 15.0 (4.2 to 25.9) | <.001 | ||||
| Basal insulin dose/day, U | 27.8 (17.3) | 31.8 (27.8) | 4.2 (−1.0 to 9.4) | .210 | 28.9 (15.1) | 29.9 (17.7) | 1.0 (−1.3 to 3.2) | .704 |
| Bolus insulin dose/day, U | 28.6 (21.9) | 38.4 (34.7) | 10.7 (2.1 to 19.3) | <.001 | ||||
Values are expressed as the mean (SD) or median (interquartile range).
Blinded CGM data were obtained at baseline.
At week 16, the CGM metrics were analyzed using data from the preceding 90 days.
Number of events with a sensor glucose of <70 mg/dL (<3.9 mmol/L) lasting at least 120 minutes; event ends when the glucose level returns to ≥70 mg/dL (≥3.9 mmol/L) for ≥15 minutes.
Number of events with a sensor glucose of >250 mg/dL (>13.9 mmol/L) lasting at least 120 minutes; event ends when the glucose level returns to ≤180 mg/dL (≤10.0 mmol/L) for ≥15 minutes.
Abbreviations: CV, coefficient of variation; GMI, glucose management indicator; GRI, glycemic risk index; TAR, time above range; TBR, time below range; TIR, time in range; TIT, time in tight range; U, unit.
The total insulin dose in the MDI group increased by 15.0 units (95% CI = 4.2 to 25.9, P < .001) due to an increase in bolus insulin dose (change of 10.7 units, 95% CI = 2.1 to 19.3, P < .001). No significant changes were observed in insulin dose in the basal insulin group (P = .704).
Differences in Glycemic Outcomes According to Subgroup
Glycemic outcomes were compared across subgroups based on age (≥60 years vs <60 years) HbA1c levels (≥8.5% vs <8.5%) and diabetes duration (≥10 years vs <10 years) (Figure 3). The HbA1c levels and all CGM metrics improved across all age groups (all P for interaction >.1). 16 In the group aged ≥60 years, the HbA1c levels decreased from 8.7% to 7.2%, with a mean change of 1.6 percentage points (95% CI = −20.8 to −13.1). In the HbA1c ≥8.5% group, the HbA1c levels decreased by 2.4 percentage points (95% CI = −30.6 to −21.9, P < .001) (all P for interaction > .1).
Figure 3.

Glycemic outcomes stratified by subgroup.
Values are expressed as the mean (SD) or median (interquartile range).
* P < .001. ** P < .05.
Abbreviations: HbA1c, glycated hemoglobin; TAR, time above range; TBR, time below range; TIR, time in range.
Diabetes Treatment Satisfaction Questionnaire and Diabetes Knowledge Assessment Scores
The DTSQ and DTSQc scores are summarized in Table 4. The DTSQ satisfaction score improved significantly in the total population (P < .001). The mean DTSQc score for satisfaction was 16.1 ± 2.5, indicating higher satisfaction after the structured education. Neither group showed improvement in the DTSQ hyperglycemia score, and the DTSQ hypoglycemia score slightly worsened (0.9, 95% CI = 0.3 to 1.4, P = .001). Supplementary Table 4 shows that the knowledge scores in both the MDI and basal insulin groups significantly increased (P < .001 for both).
Table 4.
Changes in DTSQ Scores at Week 16.
| DTSQs | DTSQc a | ||||
|---|---|---|---|---|---|
| Baseline | Week 16 | Difference (95% CI) | P | Week 16 | |
| Total (n = 64) | |||||
| DTSQ satisfaction score b | 26.3 (6.8) | 31.8 (4.5) | 5.4 (3.5 to 7.4) | <.001 | 16.1 (2.5) |
| DTSQ hyperglycemia score c | 3.2 (1.6) | 3.0 (1.8) | −0.2 (−0.7 to 0.3) | .473 | 0.8 (1.8) |
| DTSQ hypoglycemia score c | 1.5 (1.6) | 2.4 (1.8) | 0.9 (0.3 to 1.4) | .001 | 0.5 (1.8) |
| MDI (n = 31) | |||||
| DTSQ satisfaction score b | 26.8 (7.0) | 32.3 (4.5) | 5.5 (2.6 to 8.5) | <.001 | 16.3 (2.7) |
| DTSQ hyperglycemia score c | 3.3 (1.7) | 3.0 (1.6) | −0.3 (−1.0 to 0.3) | .325 | 0.7 (1.8) |
| DTSQ hypoglycemia score c | 1.8 (1.7) | 2.3 (1.5) | 0.5 (−0.2 to 1.1) | .146 | 0.5 (1.8) |
| Basal only (n = 33) | |||||
| DTSQ satisfaction score b | 25.9 (6.8) | 31.3 (4.5) | 5.4 (2.7 to 8.1) | <.001 | 16.0 (2.4) |
| DTSQ hyperglycemia score c | 3.2 (1.6) | 3.1 (1.9) | 0.1 (−0.9 to 0.9) | .882 | 1.0 (1.9) |
| DTSQ hypoglycemia score c | 1.2 (1.5) | 2.5 (2.1) | 1.2 (0.4 to 2.0) | .004 | 0.5 (1.8) |
Values are expressed at the mean (SD).
The DTSQ change score is calculated as the sum of the scores of eight questionnaire items, same as DTSQs. It is rated by patients on a scale from 3− (eg, “much less satisfied now”) to 3+ (eg, “Much more satisfied now”), with 0 (midpoint) representing no change.
The DTSQ satisfaction score is calculated as the sum of the scores of six questionnaire items (satisfaction with current treatment, flexibility, convenience, understanding of diabetes, recommend treatment to others, and willingness to continue). Each item is rated by patients on a scale from 0 (eg, “very dissatisfied” or “very inconvenient”) to 6 (eg, “very satisfied” or “very convenient”).
The DTSQ hyperglycemia and hypoglycemia scores each reflect only one question rate on a scale from 0 (none of the time) to 6 (most of the time).
Abbreviations: DTSQc, Diabetes Treatment Satisfaction Questionnaire change version; DTSQ, Diabetes Treatment Satisfaction Questionnaire, MDI, multiple daily insulin injection.
Safety Outcome
No severe adverse events were reported in either of the groups during the study.
Discussion
In this study, participants using rt-CGM and receiving structured educational sessions over a four-month period achieved significant and clinically meaningful reductions in HbA1c levels, regardless of whether they were using MDI or basal insulin to manage their poorly controlled T2D. Participants also experienced significant and meaningful improvements in CGM-based glycemic control metrics while avoiding hypoglycemia. Notably, these improvements in CGM metrics were consistent across age groups (≥60 years and <60 years).
Our study showed a numerically larger improvement in HbA1c and TIR levels compared with other studies. The inclusion of structured education in this study may have contributed to the outcome differences. In a previous randomized controlled trial (RCT) that evaluated the effect of rt-CGM without structured education in people with T2D receiving MDI, the HbA1c level decreased from 8.5% at baseline to 7.7%, whereas the TIR increased from 55.5% to 61.1%. 6 Conversely, our study showed a 1.8 percentage point improvement in HbA1c levels and a larger 25.1 percentage point improvement in TIR in the MDI group. In a separate RCT evaluating the effect of rt-CGM without education in individuals with T2D treated with basal insulin, a 1.1 percentage point decrease in HbA1c levels and a 19 percentage point improvement in TIR were observed. 7 Similarly, the glycemic improvement in our study was greater than that in the basal insulin group. However, a study of 237 adults with poorly controlled T2D observed a 2.4 percentage point HbA1c reduction in the absence of structured education, emphasizing the difficulty of comparing studies with different protocols and baseline characteristics. 17
Notably, the MDI group experienced a significant increase in bolus insulin doses throughout the study period. After receiving education, they appeared to be empowered to appropriately adjust their bolus doses, resulting in improved hyperglycemic control without increasing the risk of hypoglycemic events. Before receiving the education offered in this study, individuals may have been reluctant to intensify their insulin treatment due to fear of hypoglycemia, resulting in suboptimal glycemic outcomes.18,19 In the basal insulin group, glycemic outcomes improved without increasing the basal insulin doses. This result is consistent with those from the MOBILE study, suggesting that the positive results are attributed to lifestyle modifications based on CGM use in basal insulin group. 7
Our results differ from those of a previous study that evaluated the efficacy of education using is-CGM in individuals with insulin-treated T2D.11,20 The changes in HbA1c levels in our study were larger than those reported by Yaron et al (−1.8% vs −0.8%) and Rama Chandran et al (−0.6%). Several factors may explain this discrepancy. First, rt-CGM was more effective than is-CGM. 21 We previously evaluated the effects of is-CGM and education with similar content in individuals using the MDI for T2D. 10 We found an HbA1c reduction of 1.0% in individuals with a baseline HbA1c level of 8.4%. A comparison of two studies confirmed the superiority of rt-CGM over is-CGM. 10 Second, the differences in the educational content between studies, particularly our comprehensive approach to educating CGM users, likely contributed to the different outcomes. Finally, the high baseline HbA1c level (9.0%) in our study may have affected the observed significant improvements. However, among individuals with an HbA1c level of <8.5%, we observed a 1.0% reduction in HbA1c levels, which exceeded the 0.6% reduction reported by Chandran et al for a group with the same baseline HbA1c level of 8.0%.
Another important finding was that HbA1c levels and all CGM metrics consistently improved, regardless of age. Older age is a well-known barrier to various aspects of CGM use, 13 because they may have heterogeneous conditions, including cognitive dysfunction or functional limitations. Despite these barriers, various studies have demonstrated the benefits of CGM in insulin-treated older adults with T1D 22 and T2D.14,23 A subset analysis of the MOBILE study revealed that rt-CGM alone resulted in a 1.3 percentage point HbA1c reduction in older adults with basal-insulin-treated T2D. 14 Similarly, a study on is-CGM in older adults with insulin-treated T2D showed reduced hypoglycemia risk but no increase in TIR. 23 In our subgroup analyses, we observed an even greater improvement in older adults, with a 1.6% HbA1c reduction, surpassing the results previously reported for rt-CGM alone.
This study on T2D demonstrated better outcomes compared with our previous study on T1D, 12 which reported a 1.2% reduction in HbA1c levels. Although both studies employed similar educational content, the greater effect observed in T2D individuals suggests that they may benefit more from education than those with T1D. Conversely, the differences in study design may also have influenced the results. In this study, we increased the number of education sessions from three to four and extended the education period until the end of the study. This adjustment aligns with previous research demonstrating the importance of ongoing education, as glycemic control often deteriorates after educational interventions conclude. In addition, we used blinded CGM devices at baseline to accurately assess the impact of CGM combined with education. Furthermore, the sample size increased from 45 to 66 participants.
Following the education, both groups experienced improvements in the DTSQ satisfaction and diabetes knowledge assessment scores. Structured education enhances patients’ knowledge, enabling them to adjust their insulin doses and implement lifestyle modifications, ultimately leading to greater satisfaction. Although the DTSQ hypoglycemia score worsened in the basal insulin group, the DTSQc hypoglycemia score, which assesses individuals’ perceptions of hypoglycemia following education, showed improvement. This outcome may be attributed to our insufficient guidance on participants to compare their responses at the final DTSQ survey with their experiences at the beginning of the study. In addition, by the time of the final survey, it is likely that participants became more aware of the risks associated with hypoglycemia exposure due to the education provided, which may have influenced their responses.
This study is the first to investigate the effect of combining rt-CGM with structured education in individuals with insulin-treated T2D, including a predefined subgroup aged ≥60 years. Previous studies have evaluated the effect of CGM and education concurrently, using either is-CGM in insulin-treated people with T2D or rt-CGM in those with T1D. In addition, we provided one-on-one personalized in-person education tailored to each participant’s understanding. Finally, this study was conducted across multiple centers rather than a single site. Our findings are significant, as we demonstrated that structured education can be effectively implemented in various clinical settings throughout Korea, including those not specialized in T1D, such as the SMC.
This study has several limitations. This was not an RCT, as we did not include a control group, making it uncertain whether the significant improvement in glycemic control was solely due to the structured education. However, the substantial improvement in glycemic control compared with similar studies supports the benefits of structured education. In addition, our sample size was relatively small; however, similar outcomes have been reported in studies with comparable sample sizes, despite variations in CGM type or population.12,24
Conclusions
This study showed improved glycemic outcomes and increased treatment satisfaction, with the successful maintenance of hypoglycemic targets among adults with insulin-treated T2D who received both rt-CGM and structured one-on-one individualized education, regardless of age.
Supplemental Material
Supplemental material, sj-docx-1-dst-10.1177_19322968241306136 for Improved Glycemic Control in Insulin-Treated Individuals With Poorly Controlled Type 2 Diabetes Through Combined Structured Education With Real-Time Continuous Glucose Monitoring by Jee Hee Yoo, Ji Eun Jun, Soo Heon Kwak and Jae Hyeon Kim in Journal of Diabetes Science and Technology
Acknowledgments
The authors acknowledge Dexcom for providing the rt-CGM devices and for their technical support regarding device-related issues. The authors also express their gratitude to the statistician at Synex.
Footnotes
Abbreviations: AGP, ambulatory glucose profile; CGM, continuous glucose monitoring; CV, coefficient of variation; DTSQ, Diabetes Treatment Satisfaction Questionnaire; GMI, glucose management indicator; GRI, glycemia risk index; is-CGM, intermittent scanning continuous glucose monitoring; MDI, multiple daily injections; RCT, randomized controlled trial; rt-CGM, real-time continuous glucose monitoring; T1D, type 1 diabetes; T2D, type 2 diabetes; TAR, time above range; TBR, time below range; TIR, time in range; TIT, time in tight range.
Author Contributions: JHK and JHY conceived the study and contributed to its design. JHY conducted the data collection and analysis. JHY and JHK interpreted the data. JHY wrote the initial draft of the manuscript, which was subsequently revised by JEJ, SHK, and JHK. The final manuscript was approved by all authors. JHK ensures the integrity of the work.
The author(s) declared no potential conflicts of interest with respect to the research, authorship, and/or publication of this article.
Funding: The author(s) disclosed receipt of the following financial support for the research, authorship, and/or publication of this article: This study was supported by a grant from Dexcom Inc (OUS-2022−018).
ORCID iD: Jee Hee Yoo  https://orcid.org/0000-0002-2536-6274
Jae Hyeon Kim
https://orcid.org/0000-0001-5001-963X
Data Availability: All relevant data are available in this article and its supplementary files.
Supplemental Material: Supplemental material for this article is available online.
References
- 1. American Diabetes Association Professional Practice Committee. 6. Glycemic goals and hypoglycemia: standards of care in diabetes-2024. Diabetes Care. 2024;47(suppl 1):S111-S125. doi: 10.2337/dc24-S006. [DOI] [PMC free article] [PubMed] [Google Scholar]
- 2. Yoo JH, Kim JH. Time in range from continuous glucose monitoring: a novel metric for glycemic control. Diabetes Metab J. 2020;44(6):828-839. doi: 10.4093/dmj.2020.0257. [DOI] [PMC free article] [PubMed] [Google Scholar]
- 3. Park J, Kim G, Kim BS, et al. Insulin fact sheet in type 1 and 2 diabetes mellitus and trends of antidiabetic medication use in insulin users with type 2 diabetes mellitus: 2002 to 2019. Diabetes Metab J. 2023;47(2):211-219. doi: 10.4093/dmj.2022.0346. [DOI] [PMC free article] [PubMed] [Google Scholar]
- 4. Lee YB, Han K, Kim B, et al. Risk of early mortality and cardiovascular disease according to the presence of recently diagnosed diabetes and requirement for insulin treatment: a nationwide study. J Diabetes Investig. 2021;12(10):1855-1863. doi: 10.1111/jdi.13539. [DOI] [PMC free article] [PubMed] [Google Scholar]
- 5. Jeon JY, Kim DJ, Ko SH, et al. Current status of glycemic control of patients with diabetes in Korea: the fifth Korea national health and nutrition examination survey. Diabetes Metab J. 2014;38(3):197-203. doi: 10.4093/dmj.2014.38.3.197. [DOI] [PMC free article] [PubMed] [Google Scholar]
- 6. Beck RW, Riddlesworth TD, Ruedy K, et al. Continuous glucose monitoring versus usual care in patients with type 2 diabetes receiving multiple daily insulin injections: a randomized trial. Ann Intern Med. 2017;167(6):365-374. doi: 10.7326/M16-2855. [DOI] [PubMed] [Google Scholar]
- 7. Martens T, Beck RW, Bailey R, et al. Effect of continuous glucose monitoring on glycemic control in patients with type 2 diabetes treated with basal insulin: a randomized clinical trial. JAMA. 2021;325(22):2262-2272. doi: 10.1001/jama.2021.7444. [DOI] [PMC free article] [PubMed] [Google Scholar]
- 8. Aleppo G, Beck RW, Bailey R, et al. The effect of discontinuing continuous glucose monitoring in adults with type 2 diabetes treated with basal insulin. Diabetes Care. 2021;44(12):2729-2737. doi: 10.2337/dc21-1304. [DOI] [PMC free article] [PubMed] [Google Scholar]
- 9. Hermanns N, Ehrmann D, Schipfer M, Kröger J, Haak T, Kulzer B. The impact of a structured education and treatment programme (FLASH) for people with diabetes using a flash sensor-based glucose monitoring system: results of a randomized controlled trial. Diabetes Res Clin Pract. 2019;150:111-121. doi: 10.1016/j.diabres.2019.03.003. [DOI] [PubMed] [Google Scholar]
- 10. Kim JY, Jin SM, Sim KH, et al. Continuous glucose monitoring with structured education in adults with type 2 diabetes managed by multiple daily insulin injections: a multicentre randomised controlled trial. Diabetologia. 2024;67(7):1223-1234. doi: 10.1007/s00125-024-06152-1. [DOI] [PubMed] [Google Scholar]
- 11. Yaron M, Roitman E, Aharon-Hananel G, et al. Effect of flash glucose monitoring technology on glycemic control and treatment satisfaction in patients with type 2 diabetes. Diabetes Care. 2019;42(7):1178-1184. doi: 10.2337/dc18-0166. [DOI] [PubMed] [Google Scholar]
- 12. Yoo JH, Kim G, Lee HJ, Sim KH, Jin SM, Kim JH. Effect of structured individualized education on continuous glucose monitoring use in poorly controlled patients with type 1 diabetes: a randomized controlled trial. Diabetes Res Clin Pract. 2022;184:109209. doi: 10.1016/j.diabres.2022.109209. [DOI] [PubMed] [Google Scholar]
- 13. Munshi MN. Continuous glucose monitoring use in older adults for optimal diabetes management. Diabetes Technol Ther. 2023;25(S3):S56-S64. doi: 10.1089/dia.2023.0111. [DOI] [PubMed] [Google Scholar]
- 14. Bao S, Bailey R, Calhoun P, Beck RW. Effectiveness of continuous glucose monitoring in older adults with type 2 diabetes treated with basal insulin. Diabetes Technol Ther. 2022;24(5):299-306. doi: 10.1089/dia.2021.0494. [DOI] [PMC free article] [PubMed] [Google Scholar]
- 15. Committee for Patient Advocacy K. Guidance for Blood Glucose Control Using Continuous Glucose Monitoring System. Seoul, Republic of Korea: Korean Diabetes Association; 2021. [Google Scholar]
- 16. Greenfield M, Stuber D, Stegman-Barber D, et al. Diabetes education and support tele-visit needs differ in duration, content, and satisfaction in older versus younger adults. Telemed Rep. 2022;3(1):107-116. doi: 10.1089/tmr.2022.0007. [DOI] [PMC free article] [PubMed] [Google Scholar]
- 17. Grace T, Layne J, Hicks C, Crawford M, Welsh J, Walker T. Six-month A1C benefits of CGM among patients with type 2 diabetes in a primary care setting. Diabetes Technol Ther. 2024;24(S1):A-227. [Google Scholar]
- 18. Merchant HJ, McNeilly AD. Hypoglycaemia: still the main drawback of insulin 100 years on: “from man to mouse.” Diabet Med. 2021;38(12):e14721. doi: 10.1111/dme.14721. [DOI] [PubMed] [Google Scholar]
- 19. Ahola AJ, Groop PH. Barriers to self-management of diabetes. Diabet Med. 2013;30(4):413-420. doi: 10.1111/dme.12105. [DOI] [PubMed] [Google Scholar]
- 20. Rama Chandran S, Rahman N, Gandhi M, et al. Intermittently scanned continuous glucose monitoring provides no benefit over structured self-monitoring of blood glucose in type 2 diabetes not on prandial insulin, in the context of diabetes self-management education: GLucose monitoring programme SingaporE (GLiMPSE). Diabetes Res Clin Pract. 2024;211:111678. doi: 10.1016/j.diabres.2024.111678. [DOI] [PubMed] [Google Scholar]
- 21. Visser MM, Charleer S, Fieuws S, et al. Comparing real-time and intermittently scanned continuous glucose monitoring in adults with type 1 diabetes (ALERTT1): a 6-month, prospective, multicentre, randomised controlled trial. Lancet. 2021;397(10291):2275-2283. doi: 10.1016/S0140-6736(21)00789-3. [DOI] [PubMed] [Google Scholar]
- 22. Miller KM, Kanapka LG, Rickels MR, et al. Benefit of continuous glucose monitoring in reducing hypoglycemia is sustained through 12 months of use among older adults with type 1 diabetes. Diabetes Technol Ther. 2022;24(6):424-434. doi: 10.1089/dia.2021.0503. [DOI] [PMC free article] [PubMed] [Google Scholar]
- 23. Leite SAO, Silva MP, Lavalle ACR, et al. Use of continuous glucose monitoring in insulin-treated older adults with type 2 diabetes. Diabetol Metab Syndr. 2023;15(1):240. doi: 10.1186/s13098-023-01225-4. [DOI] [PMC free article] [PubMed] [Google Scholar]
- 24. Pemberton JS, Kershaw M, Dias R, et al. DYNAMIC: dynamic glucose management strategies delivered through a structured education program improves time in range in a socioeconomically deprived cohort of children and young people with type 1 diabetes with a history of hypoglycemia. Pediatr Diabetes. 2021;22(2):249-260. doi: 10.1111/pedi.13155. [DOI] [PubMed] [Google Scholar]
Associated Data
This section collects any data citations, data availability statements, or supplementary materials included in this article.
Supplementary Materials
Supplemental material, sj-docx-1-dst-10.1177_19322968241306136 for Improved Glycemic Control in Insulin-Treated Individuals With Poorly Controlled Type 2 Diabetes Through Combined Structured Education With Real-Time Continuous Glucose Monitoring by Jee Hee Yoo, Ji Eun Jun, Soo Heon Kwak and Jae Hyeon Kim in Journal of Diabetes Science and Technology