

Abstract
Background
Although anthracycline-related cardiotoxicity is widely studied, only a limited number of echocardiographic studies have assessed cardiac function in breast cancer survivors (BCSs) beyond ten years from anthracycline treatment, and the knowledge of long-term cardiorespiratory fitness (CRF) in this population is scarce. This study aimed to compare CRF assessed as peak oxygen uptake (V̇O2), cardiac morphology and function, and cardiovascular (CV) risk factors between long-term BCSs treated with anthracyclines and controls with no history of cancer.
Methods
The CAUSE (Cardiovascular Survivors Exercise) trial included 140 BCSs recruited through the Cancer Registry of Norway, who were diagnosed with breast cancer stage II to III between 2008 and 2012 and had received treatment with epirubicin, and 69 similarly aged activity level-matched controls. All the participants underwent blood sampling, blood pressure measurements, echocardiography and cardiopulmonary exercise testing from October 2020 to August 2022.
Results
BCSs were aged 59 ± 6 years and had received a cumulative dose of 357 (243 to 366) mg/m2 of epirubicin on average 11 ± 1 years before inclusion. There was no difference between BCSs and controls with respect to peak V̇O2 (27.6 ± 5.4 mL/kg/min vs. 27.1 ± 5.4 mL/kg/min, P = 0.25), 2D left ventricular ejection fraction (57 ± 3% vs. 57 ± 3%, P = 0.43), left ventricular global longitudinal strain (-20.5 ± 1.0% vs. -20.6 ± 1.0%, P = 0.46) or the proportion with N-terminal pro-brain natriuretic peptide ≥ 125 (22% vs. 20%, P = 0.93). The proportions with hypertension, dyslipidemia or diabetes did not differ between the groups.
Conclusion
We found that CRF, cardiac function, and CV risk profile in BCSs examined a decade after treatment with anthracyclines were similar to that in women with no history of cancer.
Trial registration
clinicaltrials.gov (NCT04307407) https://clinicaltrials.gov/ct2/show/NCT04307407.
Supplementary Information
The online version contains supplementary material available at 10.1186/s40959-024-00296-0.
Keywords: Cancer survivorship, Breast cancer, Cardiorespiratory fitness, Echocardiography, Cardiotoxicity
Introduction
Adjuvant systemic cancer treatments have significantly improved the survival of patients with breast cancer [1]. The mainstay of these treatments is anthracyclines, which entail a dose-dependent risk of irreversible myocardial injury and heart failure [2, 3]. With improved prognosis, long-term (i.e. beyond five years) treatment-related adverse effects are becoming increasingly important among breast cancer survivors (BCSs).
Prior studies have implied that anthracycline-related cardiotoxicity occurs mainly within the first two years after treatment [3], whereas some studies have suggested an anthracycline-related risk of heart failure even beyond five years [4]. A recent large cohort study observed a 10-year cumulative incidence of heart failure of 1.8% in BCSs treated with anthracyclines without trastuzumab compared with 0.9% in BCSs who had not received anthracyclines [5]. Echocardiographic studies on left ventricular (LV) function in BCSs have found a LV ejection fraction (EF) < 50% in 3 to 5% 10 years after treatment with anthracyclines [6, 7], but the number of echocardiographic studies with this long follow-up time after modern breast cancer treatment is limited [6–8].
Cardiorespiratory fitness (CRF) reflects the functional reserve of the organ systems involved in oxygen transport and is inversely related to cardiovascular (CV) events and all-cause mortality [9]. Previous studies have found impaired CRF in BCSs within five years after treatment compared with women without cancer [10–13]. But the knowledge on CRF in long-term BCSs is scarce and based on few studies that are either small [14, 15] or heterogeneous regarding cancer treatment or observation time [16].
Cohort studies have shown an increased long-term risk of CV death among BCSs compared with women without breast cancer [17]. This implies a link with anthracycline-related cardiotoxicity, but side effects of other cancer treatments may also contribute, along with conventional CV risk factors. Radiotherapy, especially to those with left-sided breast cancer, has been associated with an increased risk of cardiac disease, although this risk is substantially reduced with modern radiation techniques [18]. Endocrine therapy may interfere with the favourable CV effects of endogenous oestrogen, and aromatase inhibitors are shown to have an unfavourable impact on lipid profile and CV risk compared with tamoxifen [19]. Despite the potentially increased CV risk in this population, few studies have compared CV risk factors between long-term BCSs and women without a history of cancer.
This study aimed to compare CRF assessed as peak oxygen uptake (V̇O2), cardiac morphology and function, and CV risk factors between long-term BCSs treated with anthracyclines and controls with no history of cancer, by presenting baseline results from the CAUSE (Cardiovascular Survivors Exercise) trial [20].
Methods
Study design and participants
The CAUSE trial was an exercise intervention study including long-term BCSs and similarly aged, activity level-matched females with no history of cancer (controls) [20]. This sub-study compared baseline data in BCSs and controls, corresponding to a cross-sectional study using nonprobability sampling methods.
Inclusion criteria for the BCSs were breast cancer stage II to III diagnosed between 2008 and 2012, age ≤ 60 years at the time of diagnosis and prior epirubicin treatment. Exclusion criteria were > 90 min of exercise per week, treatment with trastuzumab, recurrence of breast cancer, other malignancies (except basal cell carcinoma), chronic atrial fibrillation, pacemaker therapy, previous major cardiac surgery, recent or uncontrolled CV disease, health conditions that, by self-evaluation, restricted adherence to study protocols, medical contraindication to exercise, or participation in other exercise trials. Inclusion criteria for the controls were no history of cancer and similar age-group as the BCSs, with the same exclusion criteria as for the BCSs.
BCSs diagnosed with breast cancer stage II to III between 2008 and 2012, aged ≤ 60 years at the time of diagnosis, from a predefined area of South-Eastern Norway surrounding Oslo, were identified from the Cancer Registry of Norway. Living candidates received an invitation letter followed by a phone call to clarify whether they wished to participate and fulfilled all the eligibility criteria. After the baseline assessments, BCSs were randomised to supervised aerobic exercise training or usual care. Those randomised to exercise training were then encouraged to recruit a similar-aged female friend or relative for the control group. Controls were also recruited through advertisements in news media and social media channels, searching for women similarly aged to the BCSs.
Clinical assessments
Medical history
Details on breast cancer diagnosis, treatments, comorbidities, and CV risk factors at the time of diagnosis were obtained from medical records. Information on comorbidities and current medications at baseline was obtained from case histories and supplemented by case records.
CV risk factors and biomarkers
Body mass index (BMI) was calculated from measured height and weight. Arterial blood pressures (BPs) was measured in supine position. Hypertension was defined as systolic BP ≥ 140 mmHg, diastolic BP ≥ 90 mmHg, and/or current use of antihypertensive treatment. Blood samples were obtained in a fasted state, details on biochemical analyses are described in the Supplementary Methods. Dyslipidaemia was defined as total cholesterol > 7.0 mmol/L, low-density lipoprotein cholesterol (LDL-C) > 5.0 mmol/L, high-density lipoprotein cholesterol (HDL-C) < 1.3 mmol/L, triglycerides > 1.70 mmol/L and/or current use of lipid-lowering medication [21]. Diabetes was defined as glycated haemoglobin (HbA1c) ≥ 48 mmol/mol and/or current use of glucose-lowering medication. Cut-off limits indicating a low probability of heart failure were N-terminal pro-brain natriuretic peptide (NT-proBNP) < 192 ng/L in women < 60 years and NT-proBNP < 285 ng/L in women ≥ 60 years [22]. The cardiac biomarkers were also categorised according to the established cut-off limits of NT-proBNP ≥ 125 ng/L and high-sensitivity troponin T ≥ 14 ng/L. Self-reported physical activity was assessed by a modified Godin-Shephard Leisure-Time Physical Activity Questionnaire [23] assessing the frequency and duration of mild, moderate and vigorous leisure-time physical activity during a typical week. The participants were dichotomised into meeting or not meeting the World Health Organization (WHO) recommendation of ≥ 150 min of moderate-intensity, ≥ 75 min of vigorous-intensity physical aerobic activity per week, or an equivalent weekly combination of moderate- and vigorous-intensity aerobic physical activity [24].
Resting echocardiography
A resting transthoracic echocardiography was performed before cardiopulmonary exercise testing (CPET) using Vivid E9 (GE Vingmed) by two different operators. Standard two-dimensional (2D) parasternal and apical views, including a right ventricular (RV)-focused apical four-chamber view, and LV three-dimensional (3D) images were acquired with the participants in the left lateral decubitus position.
Images were analysed offline by a single cardiologist using EchoPac version 202 (GE Vingmed) in accordance with the European Society of Cardiology recommendations [25]. LV mass was estimated from 2D LV dimensions using the Devereux formula [25]. LV 2D volumes and EF were measured by the modified Simpson’s method and left atrial volumes by the biplane disk summation technique [25]. LV global longitudinal strain (GLS) was measured by a semi-automatic speckle tracking method using 2D greyscale images from the three standard apical views. 3D LV volumes were obtained by stitching together four to six consecutive heart cycles. RV fractional area change and longitudinal strain were measured in the RV-focused view. RV longitudinal strain was measured by 2D speckle tracking and reported as RV four-chamber longitudinal strain (RV 4CLS), including both free wall and interventricular septum. Diastolic function was assessed by mitral peak early (E) and late (A) diastolic inflow velocity, deceleration time of the E-wave, and peak early diastolic tissue velocity (e’) at the septal and lateral portions of the mitral annulus.
Ventricular mass, dimensions, areas, chamber volumes, stroke volumes (SVs), and cardiac output (Q̇) were normalised to body surface area. Systolic dysfunction was defined as LV EF < 54% [25] and LV GLS > − 18% [26]. The proportion with LV EF < 50% was assessed to enable comparison with previous studies of anthracycline-related cardiotoxicity. LV diastolic dysfunction was defined as the presence of more than two of the following criteria: average E/e’ > 14, septal e’ < 7 cm/s or lateral e’ < 10 cm/s, tricuspid regurgitation velocity > 2.8 m/s and/or left atrial volume > 34 mL/m2 [27].
Cardiopulmonary exercise testing
The participants performed an incremental treadmill CPET until voluntary exhaustion despite encouragement, following a modified Balke protocol [28]. Gas exchange was measured breath-by-breath using a gas and volume-calibrated metabolic cart (Oxycon Pro, Jaeger GmbH). The electrocardiogram (ECG) was monitored continuously, peak BPs was measured by an automated sphygmomanometer as soon as possible after test termination, and blood lactate was measured one minute after test termination.
Peak V̇O2 was defined as the highest volume of oxygen consumed across a period of 30 s. Ventilatory threshold (VT) was determined by the ventilatory equivalent method [28]. Ventilatory efficiency was assessed by the regression slope of minute ventilation (V̇E) on carbon dioxide output (V̇CO2) (V̇E/V̇CO2-slope) estimated from the start to the respiratory compensation point. Maximal effort was defined as peak respiratory exchange ratio (RER) (V̇CO2/V̇O2) ≥ 1.10 and lactate ≥ 7.0 mmol/L in women aged 20 to 49 years, peak RER ≥ 1.05 and lactate ≥ 5.0 mmol/L in women aged 50 to 64 years, and peak RER ≥ 1.00 and lactate ≥ 3.5 mmol/L in women ≥ 65 years [29]. Peak heart rate (HR) was defined as the highest HR reached at the termination of the test.
The participants were laid in the left lateral decubitus position as soon as practically possible after the CPET, and pulsed-wave Doppler velocity spectra were obtained from the LV outflow tract in the apical-5-chamber view to estimate SV and Q̇. We measured the time from peak exercise to acquisition of measurable Doppler signals. Peripheral oxygen extraction was estimated by the ratio of peak V̇O2 to post-exercise Q̇.
Statistical analysis
The CAUSE trial was designed to demonstrate a change of 3.6 mL/kg/min in peak V̇O2 during the intervention period, assuming a standard deviation of 7.2 mL/kg/min at baseline. To achieve a power of 0.90 with an alpha of 0.05, 70 participants were required in each group, i.e. 140 BCSs and 70 controls, allowing for a drop-out rate of 10% [20].
Data were presented as mean ± SD, median (IQR) or numbers (%). For the present analyses, BCSs and controls were compared by linear regression analyses for continuous normally distributed variables and by logistic regression analyses, χ2-test or Fischer’s exact test for dichotomous variables. The linear model fit was assessed by residual analysis. A generalised linear regression model was used when this improved the model fit assessed by Akaike information criterion. A log-link function and gamma distribution were used to account for the right-skewed distribution of insulin and the cardiac biomarkers. Concentrations of cardiac biomarkers below the reporting limit were assigned a value corresponding to half the reporting limit [30].
Comparisons of continuous age-dependent CV risk factors were adjusted for age and current treatment of the respective risk factor. Comparisons of categorical CV risk factors, LV mass, ventricular volumes and areas, measures of longitudinal ventricular function [25, 31], mitral inflow velocities and cardiopulmonary exercise variables were adjusted for age [29, 32]. To account for the varying delay from the peak V̇O2 measurement to the post-exercise Doppler echocardiography, post-exercise Doppler-derived Q̇, SV and HR, and peripheral oxygen extraction were also adjusted for the measured delay.
Exploratory subgroup analyses of the effect of breast cancer treatment modalities on selected outcomes were performed by regression analyses restricted to BCSs, including the treatment modality as a dichotomous explanatory variable, adjusting for the same variables as in the intergroup comparisons.
Two-sided P-values < 0.05 were considered significant. No adjustments were made for multiple comparisons. Analyses were performed using StataSE 18 (StataCorp LLC, Texas, USA).
Results
Participants
A total of 698 BCSs were invited, 419 were reached by phone, 273 agreed to participate, of whom 140 met the eligibility criteria. Reasons for not participating are summarised in Fig. 1. One of the BCSs recruited a friend for the control group, 68 controls were recruited through advertisements. Inclusions and baseline study assessments were conducted from October 2020 to August 2022.
Fig. 1.
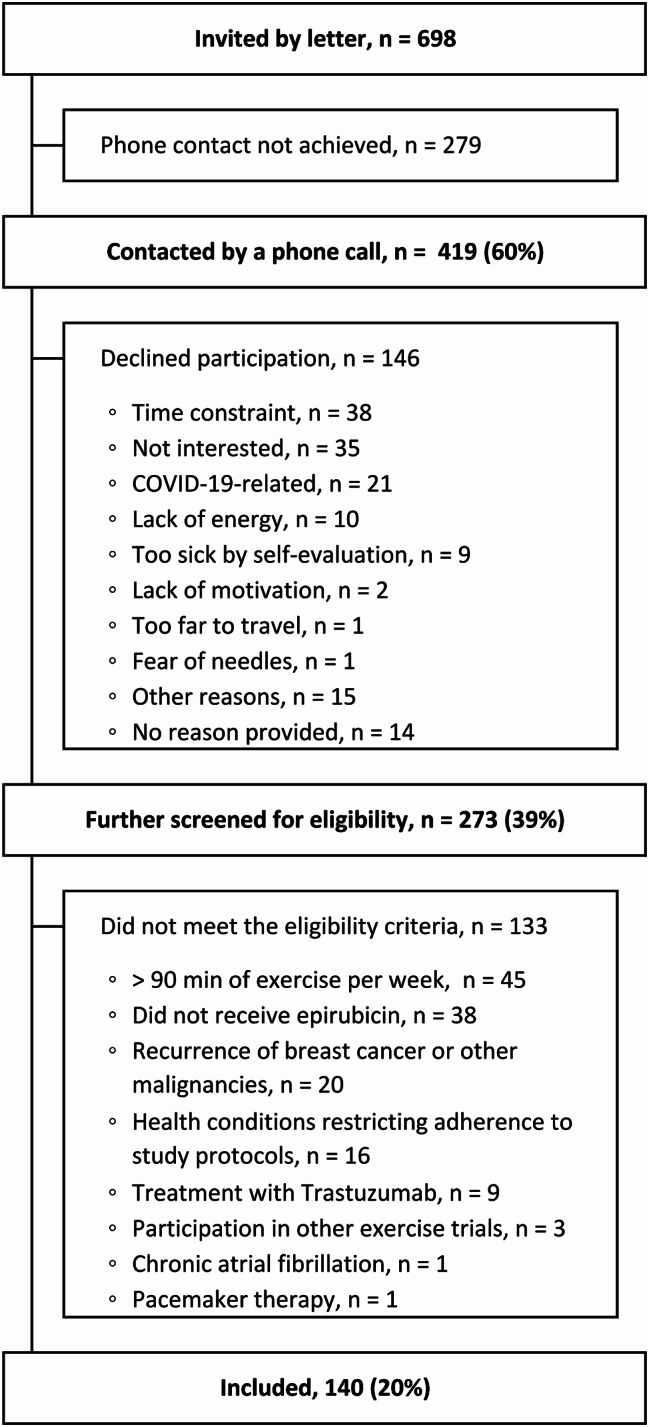
Flowchart of recruitment and inclusion of participants
Breast cancer characteristics and treatment exposures in BCSs are summarised in Table 1. The BCSs were aged 48 ± 6 years when diagnosed with breast cancer and had received a cumulative dose of 357 mg/m2 (243 to 366) of epirubicin 11 ± 1 years before the study assessments. 85% of the BCSs had received radiotherapy, with 51% receiving left-sided radiotherapy.
Table 1.
Breast cancer characteristics and treatment exposures in breast cancer survivors
| (n = 140) | |
|---|---|
| Age at diagnosis, years | 48 ± 6 |
| Time from epirubicin discontinuation to study assessments, years | 11 ± 1, range 8 to 14 |
| Hormone receptor-positive, n (%) | 109 (78) |
| Radiotherapy, n (%) | 119 (85) |
| Left-sided radiotherapy, n (%) | 72 (51) |
| Cumulative epirubicin dose a, b, mg/m2 | 357 (243 to 366), range 227 to 598 |
| Cumulative epirubicin dosea, b, n (%) | |
| < 310 mg/m2, n (%) | 49 (35) |
| 310 to < 500 mg/m2, n (%) | 88 (63) |
| ≥ 500 mg/m2, n (%) | 2 (1) |
| Taxane therapya, n (%) | 69 (50) |
| Endocrine therapy, n (%) | 110 (79) |
| Tamoxifen only, n (%) | 54 (39) |
| Aromatase inhibitor only, n (%) | 20 (14) |
| Tamoxifen and aromatase inhibitor, n (%) | 36 (26) |
Data are expressed as n (%) for categorical variables, mean ± SD for continuous normally distributed variables, and median (IQR) for continuous non-normally distributed variables
aDetails on chemotherapy regimen are missing from one participant
bAdministered in combination with 5-fluorouracil and cyclophosphamide
According to the European Society of Cardiology’s tool for assessing pre-treatment risk of anthracycline-related CV toxicity [33], 113 participants (81%) were classified as low risk, 26 participants (19%) as medium risk, and one participant as high risk at the time of diagnosis. This risk assessment relied on retrospectively obtained information from medical records on cardiovascular risk before initiation of epirubicin treatment. We acknowledge that incomplete data on pre-treatment LV function and the absence of information on cardiac biomarkers may have led to an underestimation of this risk (Supplementary Table S1).
Age at study assessments was 59 ± 6 years in BCSs and 58 ± 5 years in controls. 91% of the BCSs and 94% of the controls had > 10 years of education. The proportion that met the WHO recommendation for physical activity was 22% (30 out of 138) in BCSs and 17% (11 out of 66) in controls. One of the BCSs was previously diagnosed with ischemic heart failure, one with paroxysmal atrial fibrillation, and one with left bundle branch block. No controls reported these diagnoses.
Cardiovascular risk factors and biomarkers
CV risk factors and biomarkers are summarised in Table 2. BMI, resting BPs and the proportion with hypertension did not differ between BCSs and controls. HDL-C levels were marginally higher in BCSs compared with controls, but we found no differences between the groups regarding LDL-C, triglycerides, the proportion with dyslipidaemia, HbA1c, glucose, insulin, or the proportion with diabetes. Neither were there any intergroup differences in C-reactive protein, NT-proBNP or troponin T. The proportion of daily smokers did not differ between the groups.
Table 2.
Cardiovascular risk factors and biomarkers in breast cancer survivors and controls
| n | BCSs (n = 140) | n | Controls (n = 69) | Group comparisona (95% CI) | P-value | ||
|---|---|---|---|---|---|---|---|
| Body mass | |||||||
| BMI, kg/m2 | 140 | 26.9 ± 4.5 | 69 | 28.1 ± 5.0 | -1 | (-2.6 to 0.13) | 0.077 |
| BMI ≥ 25, n (%) | 140 | 88 (63) | 69 | 51 (74) | 0.60 | (0.316 to 1.13) | 0.11 |
| BMI ≥ 30, n (%) | 140 | 32 (23) | 70 | 18 (26) | 0.84 | (0.43 to 1.64) | 0.61 |
| Blood pressure | |||||||
| Systolic BPb, mmHg | 140 | 135 ± 18 | 69 | 138 ± 19 | -4 | (-9 to 1) | 0.15 |
| Diastolic BPb, mmHg | 140 | 82 ± 8 | 69 | 81 ± 8 | 1 | (-1 to 3) | 0.34 |
| Hypertensionc, d, n (%) | 140 | 54 (39) | 69 | 29 (42) | 0.76 | (0.41 to 1.40) | 0.38 |
| Antihypertensive medicationd, n (%) | 140 | 18 (13) | 69 | 12 (17) | 0.59 | (0.256 to 1.34) | 0.21 |
| High BPd, e, n (%) | 140 | 48 (34) | 69 | 28 (41) | 0.69 | (0.378 to 1.28) | 0.24 |
| Lipids | |||||||
| Total cholesterolf, mmol /L | 134 | 5.9 ± 0.9 | 68 | 5.6 ± 1.0 | 0.2 | (-0.0 to 0.5) | 0.10 |
| LDL-Cf, mmol/L | 134 | 3.9 ± 0.9 | 68 | 3.7 ± 1.1 | 0.1 | (-0.2 to 0.3) | 0.65 |
| HDL-Cf, mmol/L | 135 | 1.8 ± 0.4 | 68 | 1.7 ± 0.4 | 0.1 | (0.0 to 0.2) | 0.049* |
| Triglyceridesf, mmol/L | 134 | 1.28 ± 0.61 | 62 | 1.23 ± 0.51 | 0.06 | (-0.11 to 0.23) | 0.48 |
| Dyslipidaemiad, g, n (%) | 136 | 51 (38) | 68 | 25 (37) | 1.01 | (0.55 to 1.85) | 0.98 |
| Lipid-lowering medicationd, n (%) | 140 | 15 (11) | 69 | 9 (13) | 0.77 | (0.317 to 1.88) | 0.57 |
| Dyslipidaemia by blood testd, h, n (%) | 135 | 42 (31) | 68 | 19 (28) | 1.17 | (0.61 to 2.23) | 0.63 |
| Glucose metabolism | |||||||
| HbA1ci, mmol/mol | 132 | 38 (35 to 40) | 67 | 37 (33 to 40) | 0 | (-1 to 1) | 0.49 |
| Glucosei, mmol/L | 133 | 5.1 (4.8 to 5.4) | 63 | 5.1 (4.8 to 5.4) | -0.0 | (-0.2 to 0.2) | 0.78 |
| Insulini, j, pmol/L | 128 | 48 (33 to 71) | 61 | 48 (37 to 65) | 1.07 | (0.87 to 1.31) | 0.52 |
| Diabetesk, n (%) | 140 | 5 (4) | 69 | 3 (4) | 0.72m | ||
| Glucose-lowering medication, n (%) | 140 | 5 (4) | 69 | 2 (3) | 1.00m | ||
| Biomarkers | |||||||
| NT-proBNPd, j, ng/L | 134 | 70 (40 to 115) | 60 | 69 (39 to 110) | 1.15 | (0.87 to 1.50) | 0.33 |
| NT-proBNP above cut-off limitl, n (%) | 134 | 9 (7) | 60 | 4 (7) | 1.01 | (0.298 to 3.41) | 0.99 |
| NT-proBNP ≥ 125 ng/Ld, n (%) | 134 | 30 (22) | 60 | 12 (20) | 1.04 | (0.48 to 2.24) | 0.93 |
| Troponin Td, j, ng/L | 124 | 5 (4 to 6) | 67 | 5 (4 to 6) | 0.90 | (0.75 to 1.08) | 0.24 |
| Troponin T ≥ 14 ng/Ld, n (%) | 124 | 1 (1) | 67 | 2 (2) | 0.28m | ||
| C-reactive protein, mg/L | 134 | 1.1 (0.6 to 2.2) | 65 | 1.3 (0.6 to 3.2) | 0.25n | ||
| Haemoglobin, g/dL | 105 | 13.8 ± 0.8 | 68 | 13.8 ± 0.7 | -0.0 | (-0.3 to 0.2) | 0.93 |
| Creatinined, µmol/L | 97 | 63 ± 10 | 45 | 63 ± 10 | 0 | (-4 to 4) | 0.99 |
| Lifestyle | |||||||
| Daily smokers, n (%) | 138 | 6 (4) | 69 | 2 (3) | 0.72m | ||
Data are expressed as n (%) for categorical variables, mean ± SD for continuous normally distributed variables, and median (IQR) for continuous non-normally distributed variables. P-values are derived from linear regression analyses for continuous variables and logistic regression analyses for dichotomous variables, unless other specified. *Denotes a P-value < 0.05
aIntergroup mean difference for continuous normally distributed outcomes, odds ratio for dichotomous outcomes, and exponentated beta-coefficient representing the ratio of means for right skewed variables analysed by generalised linear models using a log-link function and gamma distribution
bAdjusted for age and antihypertensive medication administered in the morning at the day of study visit
cSystolic BP ≥ 140 mmHg, diastolic BP ≥ 90 mmHg, and/or current antihypertensive treatment
dAdjusted for age
eSystolic BP ≥ 140 mmHg and/or diastolic BP ≥ 90 mmHg
fAdjusted for age and lipid-lowering medication
gTotal cholesterol > 7.0 mmol/L, LDL-C > 5 mmol/L, HDL-C < 1.3 mmol/L, triglycerides > 1.70 mmol/L, and/or current lipid-lowering medication
hTotal cholesterol > 7.0 mmol/L, LDL-C > 5 mmol/L, HDL-C < 1.3 mmol/L, and/or triglycerides > 1.70 mmol/L
iAdjusted for age and glucose-lowering medication
jGeneralised linear regression analysis with a log-link function and gamma distribution
kHbA1c ≥ 48 mmol/mol and/or use of glucose-lowering medication
lNT-proBNP ≥ 192 ng/L in women < 60 years old, NT-proBNP ≥ 285 ng/L in women ≥ 60 years old
mUnadjusted P-values from Fisher’s exact test, due to few outcome events
nP-value from Willcoxon rank sum test, due to one right-censored observation
BCS, breast cancer survivor; BMI, body mass index; BP, arterial blood pressure; HbA1c, glycated haemoglobin; HDL-C, high-density lipoprotein cholesterol; LDL-C, low-density lipoprotein cholesterol; NT-proBNP, N-terminal pro-brain natriuretic peptide
In age-adjusted subgroup analyses of BCSs, neither treatment with tamoxifen nor aromatase inhibitors as the only endocrine therapy was associated with the odds of dyslipidaemia. There was no association between a cumulative epirubicin dose ≥ 310 mg/m2 or left-sided radiotherapy and the odds of NT-proBNP above the cut-off limit (Supplementary Table S2).
Resting cardiac morphology and function
Echocardiographic variables are summarised in Table 3. The image quality was feasible for 2D EF, 3D EF and GLS assessments in 97%, 83% and 89% of the participants, respectively. The frame rate of greyscale LV apical images was 67 ± 7 frames/s. Body surface area did not differ between the groups.
Table 3.
Resting cardiac morphology and function in breast cancer survivors and controls
| n | BCSs (n = 140) | n | Controls (n = 69) | Group comparisona (95% CI) | P-value | ||
|---|---|---|---|---|---|---|---|
| Morphology | |||||||
| Body surface area, m2 | 140 | 1.9 ± 0.2 | 69 | 1.9 ± 0.2 | -0.0 | (-0.1 to 0.0) | 0.17 |
| LV IVSd, mm | 140 | 9.7 ± 1.3 | 69 | 9.8 ± 1.3 | -0.2 | (-0.6 to 0.1) | 0.20 |
| LV IDd, mm/m2 | 140 | 25 ± 2 | 69 | 25 ± 2 | 0 | (-1 to 1) | 0.79 |
| LV PWd, mm | 140 | 7.5 ± 0.9 | 69 | 7.5 ± 0.8 | -0.0 | (-0.3 to 0.3) | 1.00 |
| LV mass, g/m2 | 140 | 73 ± 13 | 69 | 74 ± 13 | -2 | (-5 to 2) | 0.38 |
| 2D LV EDV, mL/m2 | 135 | 49 ± 5 | 68 | 49 ± 7 | 0 | (-1 to 2) | 0.73 |
| 2D LV ESV, mL/m2 | 135 | 21 ± 3 | 68 | 21 ± 3 | 0 | (-1 to 1) | 0.59 |
| 3D LV EDV, mL/m2 | 118 | 54 ± 7 | 55 | 52 ± 7 | 2 | (-0 to 4) | 0.067 |
| 3D LV ESV, mL/m2 | 118 | 23 ± 4 | 55 | 22 ± 4 | 1 | (0 to 3) | 0.027* |
| LA volume, mL/m2 | 136 | 26 ± 4 | 69 | 27 ± 5 | -1 | (-2 to 0) | 0.13 |
| RV end-diastolic area, cm2/m2 | 135 | 8.9 ± 1.2 | 68 | 8.5 ± 1.1 | 0.5 | (0.2 to 0.8) | 0.004* |
| RV end-systolic area, cm2/m2 | 134 | 4.5 ± 0.7 | 68 | 4.3 ± 0.6 | 0.2 | (0.0 to 0.4) | 0.035* |
| RA area, cm2/m2 | 137 | 7.5 ± 0.8 | 68 | 7.5 ± 0.9 | -0.0 | (-0.3 to 0.2) | 0.82 |
| Systolic function | |||||||
| 2D LV EF, % | 135 | 57 ± 3 | 68 | 57 ± 3 | -0 | (-1 to 1) | 0.43 |
| 3D LV EF < 54%, n (%) | 135 | 16 (12) | 68 | 4 (6) | 2.15 | (0.69 to 6.7) | 0.19 |
| 3D LV EF, % | 118 | 57 ± 3 | 55 | 58 ± 4 | -1 | (-2 to 0) | 0.17 |
| 3D LV EF < 54%, n (%) | 118 | 19 (16) | 55 | 8 (15) | 1.13 | (0.46 to 2.76) | 0.79 |
| LV GLS, % | 122 | -20.5 ± 1.1 | 63 | -20.6 ± 1.0 | 0.1 | (-0.2 to 0.4) | 0.46 |
| RV fractional area change, % | 134 | 49 ± 4 | 68 | 49 ± 3 | 0 | (-1 to 1) | 0.63 |
| RV 4CLS, % | 122 | -22.8 ± 2.1 | 64 | -23.0 ± 2.2 | 0.3 | (-0.4 to 0.9) | 0.41 |
| TAPSE, cm | 138 | 2.3 ± 0.3 | 69 | 2.3 ± 0.3 | -0.0 | (-0.1 to 0.1) | 0.97 |
| RV S’, cm/s | 138 | 12 ± 2 | 69 | 12 ± 1 | 0 | (-0 to 1) | 0.21 |
| Diastolic function | |||||||
| Mitral peak E velocity, cm/s | 140 | 61 ± 13 | 68 | 66 ± 14 | -5 | (-9 to -1) | 0.010* |
| Mitral peak A velocity, cm/s | 140 | 62 ± 12 | 68 | 62 ± 11 | -0 | (-4 to 3) | 0.83 |
| Mitral E/A | 140 | 1.0 ± 0.2 | 68 | 1.1 ± 0.3 | -0.1 | (-0.1 to -0.0) | 0.040* |
| E-wave deceleration time, ms | 140 | 180 ± 34 | 68 | 193 ± 36 | -14 | (-24 to -4) | 0.006* |
| E/e’ | 138 | 6.5 ± 1.4 | 66 | 7.0 ± 1.4 | -0.6 | (-1.0 to -0.2) | 0.004* |
| TR peak velocity, cm/s | 104 | 2.1 ± 0.3 | 55 | 2.1 ± 0.3 | 0.0 | (-0.1 to -0.1) | 0.92 |
| Resting cardiac output | |||||||
| Heart rate, beats/min | 139 | 63 ± 9 | 69 | 61 ± 7 | 2 | (-0 to 4) | 0.12 |
| Stroke volume, mL/m2 | 139 | 42 ± 5 | 69 | 41 ± 5 | 0 | (-1 to 2) | 0.72 |
| Cardiac output, mL/min/m2 | 139 | 2.6 ± 0.4 | 69 | 2.5 ± 0.3 | 0.1 | (-0.0 to 0.2) | 0.11 |
Data are expressed as n (%) for categorical variables and mean ± SD for continuous normally distributed variables. P-values are derived from linear regression analyses for continuous normally distributed variables, and logistic regression analyses for dichotomous variables. *Denotes a P-value < 0.05
aIntergroup mean difference for continuous normally distributed outcomes and odds ratio for dichotomous outcomes. Analyses were adjusted for age, except for BSA, LV IDd, LA volume, RA area, EF and fractional area change
A, peak late diastolic inflow velocity; BCS, breast cancer survivor; E, peak early diastolic inflow velocity; e’, peak early diastolic tissue velocity; end-diastolic volume; EDV, end-diastolic volume; EF, ejection fraction; ESV, end-systolic volume; GLS, global longitudinal strain; IDd, internal end-diastolic diameter; IVSd, end-diastolic septum thickness; LA, left atrium; LV, left ventricular; PWd, end-diastolic posterior wall thickness; RA, right atrium; RV, right ventricular; S’, peak annular systolic velocity; TAPSE, tricuspid annular plane systolic excursion; TR, tricuspid regurgitation; 2D, two-dimensional; 3D, three-dimensional; 4CLS, four-chamber longitudinal strain
LV 2D dimensions, mass or chamber sizes did not differ between BCSs and controls, neither did LV 3D end-diastolic volume, whereas LV 3D end-systolic volume was marginally larger in BCSs.
LV 2D EF, 3D EF and GLS was similar in both groups, as was the proportion with 2D and 3D EF < 54%. In BCSs, 2D LV EF < 50% was found in one of 135, 3D LV EF < 50% in three of 118 and LV GLS > -18% in three of 122 BCSs, whereas no controls fell into these categories (P > 0.5 in all). Resting HR, SV and Q̇ did not differ between the groups.
Mitral E, E/A and E/e’ was slightly lower, and E-wave deceleration time was shorter in BCSs compared with controls, but no participants met the criteria for LV diastolic dysfunction.
The image quality was feasible for assessment of fractional area change and RV strain in 97% and 89% of the participants, respectively. The frame rate of greyscale RV-focused images was 87 ± 10 frames/s. BCSs had slightly larger RV end-diastolic and end-systolic areas compared with controls. Right atrial area, RV fractional area change, or 4CLS did not differ between the groups.
There was a minor negative association between left-sided radiotherapy and tricuspid annular plane systolic excursion (β = − 0.1 cm, 95% CI -0.2 to 0.0) in BCSs. Otherwise, there were no associations between a cumulative epirubicin dose ≥ 310 mg/m2 or left-sided radiotherapy and the measures of systolic function (Supplementary Table S2).
Cardiopulmonary exercise variables
Cardiopulmonary exercise variables are summarised in Table 4. Peak V̇O2 did not differ between BCSs and controls, neither did the proportion with V̇O2 below age- and sex-specific reference ranges [32]. In both groups, a large proportion achieved maximal effort (93% of BSCs vs. 95% of controls) during the CPET. Among these, there was no intergroup difference in maximal V̇O2. Peak ECG-derived HR was modestly higher in BCSs. Peak pulmonary variables, peak oxygen-pulse, VT and V̇E /V̇CO2-slope did not differ between the groups. Peak BPs were notably higher in BSCs compared with controls, and this difference remained unchanged when adjusted for antihypertensive medication in addition to age. There was no intergroup difference in post-exercise Q̇, SV or HR, or in calculated peripheral oxygen extraction when adjusted for age and the measured delay from peak exercise to Doppler echo-cardiography.
Table 4.
Cardiopulmonary exercise variables in breast cancer survivors and controls
| n | BCSs (n = 140) | n | Controls (n = 69) | Group comparisona (95% CI) | P-value | ||
|---|---|---|---|---|---|---|---|
| Submaximal exercise | |||||||
| Ventilatory threshold, L/min | 138 | 1.70 ± 0.36 | 68 | 1.73 ± 0.36 | -0.00 | (-0.10 to 0.10) | 0.94 |
| VE/V̇CO2-slope | 139 | 26.9 ± 3.9 | 67 | 26.8 ± 3.7 | 0.0 | (-1.1 to 1.1) | 1.00 |
| VE/V̇CO2-slope > 34, n (%) | 139 | 4 (3) | 67 | 2 (3) | 1.00j | ||
| Peak exercise | |||||||
| V̇O2, L/min | 140 | 2.06 ± 0.37 | 69 | 2.10 ± 0.34 | -0.01 | (-0.10 to 0.09) | 0.89 |
| V̇O2, below reference limitb, n (%) | 140 | 6 (4) | 69 | 1 (1) | 0.43j | ||
| V̇O2c, mL/kg/min | 140 | 27.6 ± 5.4 | 69 | 27.1 ± 5.4 | 0.9 | (-0.6 to 2.4) | 0.25 |
| V̇O2, below reference limitd, n (%) | 140 | 16 (11) | 69 | 12 (17) | 0.61 | (0.272 to 1.38) | 0.24 |
| V̇O2e, L/m2/min | 140 | 1.11 ± 0.18 | 69 | 1.12 ± 0.17 | 0.01 | (-0.04 to 0.06) | 0.62 |
| Time to exhaustion, min | 140 | 8.5 ± 2.0 | 69 | 9.0 ± 2.0 | 0.0 | (-0.5 to 0.5) | 0.92 |
| SpO2, % | 121 | 94 ± 3 | 57 | 95 ± 2 | -0 | (-1 to 0) | 0.37 |
| Breathing rate, breaths/min | 140 | 41 ± 7 | 69 | 42 ± 8 | -1 | (-3 to 2) | 0.62 |
| V̇E, L/min | 140 | 77.3 ± 15.8 | 69 | 79.8 ± 14.6 | -0.9 | (-4.8 to 3.0) | 0.66 |
| Systolic BP, mmHg | 78 | 198 ± 21 | 54 | 187 ± 24 | 10 | (3 to 18) | 0.010* |
| Systolic BPf, mmHg | 10 | (2 to 18) | 0.012* | ||||
| Diastolic BP, mmHg | 78 | 78 ± 17 | 54 | 72 ± 15 | 6 | (0 to 12) | 0.033* |
| Diastolic BPf, mmHg | 6 | (0 to 11) | 0.038* | ||||
| Heart rate, beats/min | 139 | 174 ± 11 | 69 | 172 ± 10 | 4 | (1 to 6) | 0.016* |
| Beta-blocked | 140 | 5 (4) | 69 | 0 | |||
| O2-pulse, mL/beat | 139 | 11.8 ± 2.1 | 69 | 12.2 ± 1.9 | -0.3 | (-0.8 to 0.3) | 0.33 |
| RER | 140 | 1.20 ± 0.09 | 69 | 1.23 ± 0.08 | -0.02 | (-0.05 to 0.00) | 0.052 |
| Lactate, mmol/L | 127 | 8.8 ± 2.7 | 58 | 8.4 ± 2.2 | 0.6 | (-0.1 to 1.4) | 0.094 |
| Maximal exercise | |||||||
| Achieved maximal effortg, n (%) | 127 | 118 (93) | 58 | 55 (95) | 0.72 | (0.186 to 2.75) | 0.63 |
| V̇O2h, L/min | 118 | 2.09 ± 0.37 | 55 | 2.10 ± 0.35 | 0.02 | (-0.09 to 0.12) | 0.76 |
| V̇O2h, mL/kg/min | 118 | 28.1 ± 5.3 | 55 | 27.3 ± 5.7 | 1.1 | (-0.5 to 2.8) | 0.18 |
| Post-exercise | |||||||
| Time to Doppler echocardiography, s | 132 | 37 (30 to 46) | 68 | 45 (36 to 60) | < 0.001*k | ||
| range 12 to 130 | range 25 to 90 | ||||||
| Heart ratei, beats/min | 137 | 137 ± 16 | 63 | 132 ± 19 | 3 | (-2 to 7) | 0.26 |
| Stroke volumei, mL/min/m | 137 | 43 ± 6 | 68 | 42 ± 6 | 1 | (-1 to 2) | 0.51 |
| Cardiac outputi, mL/min/m | 137 | 5.9 ± 0.9 | 68 | 5.6 ± 1.0 | 0.2 | (-0.1 to 0.5) | 0.17 |
| Peripheral O2-extractioni, mL/dL | 137 | 19.2 ± 3.1 | 68 | 20.4 ± 3.5 | -0.7 | (-1.6 to 0.3) | 0.18 |
Data are expressed as n (%) for categorical variables, mean ± SD for continuous normally distributed variables, and median (IQR) for continuous non-normally distributed variables. P-values are derived from linear regession analyses for normally distributed variables, and logistic regression analyses for dichotomous variables. *Denotes a P-value < 0.05
aIntergroup mean difference for continuous normally distributed outcomes and odds ratio for dichotomous outcomes. All analyses were adjusted for age, except for V̇O2 below age- and sex-specific reference limits, the achievement of maximal effort and time to Doppler echocardiography
bV̇O2 (L/min) below age- and sexspecific reference limits
cNormalised to body mass
dV̇O2 (mL/kg/min) below age- and sex specific reference limits
eNormalised to body surface area
fAdjusted for age and antihypertensive medication administered in the morning at the day of study visit
gAchieved maximal effort: RER ≥ 1.10 and lactate ≥ 7.0 mmol/L in women aged 20 to 49 years, RER ≥ 1.05 and lactate ≥ 5.0 mmol/L in women aged 50 to 64 years, and RER ≥ 1.00 and lactate ≥ 3.5 mmol/L in women ≥ 65 years. Of the 24 participants that missed lactate measurements, 23 met the RER-criterium for maximal effort
hIncluded only participants that achieved maximal effort
iAdjusted for age and measured time to Doppler echocardiography
jUnadjusted P-values from X2-test, due to few outcome events
kP-value from from Willcoxon rank sum test
BCS, breast cancer survivor; BP, arterial blood pressure; O2, oxygen; RER, respiratory exchange ratio; V̇CO2, carbon dioxide output; V̇E, minute ventilation; V̇O2, oxygen uptake
There were no associations between a cumulative dose of epirubicin ≥ 310 mg/m2 or left-sided radiotherapy and peak V̇O2 in BCSs (Supplementary Table S2).
Discussion
In this study, investigating baseline data from an exercise intervention study, The CAUSE trial [20], we found no clinically meaningful differences when comparing CRF, cardiac morphology and function, and CV risk factors between long-term BCSs and non-cancer controls. Importantly, we assessed several aspects of CV health by partly complementary methods and found consistent results.
Cardiorespiratory fitness
In contrast to our expectation, peak V̇O2 was preserved in long-term BCSs compared with controls, and so were the determinants of peak V̇O2, measured as peak pulmonary variables, Doppler-derived post-exercise Q̇, SV and HR, and peripheral oxygen extraction derived from Fick’s principle.
Consistent with our results, Koelwyn et al. found no difference in peak V̇O2, SV or HR when comparing 30 BCSs treated with anthracyclines without trastuzumab on average seven years earlier with non-cancer controls. Lakosky et al. studied a diverse sample of 180 BCSs less than a year to 39 years after diagnosis and found no difference in CRF between BCSs and non-cancer controls, and no difference between BCSs assessed before and after five years from treatment [15]. In contrast, another study observed lower peak V̇O2 and Q̇ in nine elderly BSCs 10 years beyond anthracycline treatment compared with controls [14].
A prior metanalysis reported substantially impaired CRF in BCSs measured less than five years from cancer treatment compared with normative values for age-matched sedentary women [10]. Three studies, which included hemodynamic measurements, found impaired peak V̇O2, SV and Q̇ in BCSs within three years after anthracycline treatment compared with controls [11–13].Indirectly derived peak peripheral oxygen extraction did not differ [11–13], supporting a cardiac limitation of peak V̇O2.
CRF measured within a short interval from cancer treatment may reflect early and transient side effects, such as anaemia, asthenia and a temporary decline in physical activity, which may have less impact on CRF in the long term. Furthermore, many of the studies on CRF in BCSs have limited generalisability due to small sample sizes [12, 14], and a direct comparison of pooled CRF values to normative data [10] are challenging due to methodological variations, such as different exercise modalities, estimated vs. directly measured V̇O2 and considerable variations in exercise effort.
In our study, peak HR derived from ECG monitoring was higher in BSCs compared with controls, although the exercise effort was similar. This may to some extent be explained by the non-significant difference in BMI between the groups, as the difference in peak HR was attenuated in a post hoc analysis adjusted for both age and BMI (β = 3 beats/min, 95% CI -0 to 5). Correspondingly, a large cross-sectional population-based study showed that maximal HR is modestly lower in obese individuals compared with overweight and normal weight individuals [34].
The BSCs also had notably higher peak BPs than the controls. As systemic vascular resistance can be estimated as the ratio of mean BP to Q̇, higher peak BPs could either reflect higher peak Q̇ and V̇O2 [35] or higher peak systemic vascular resistance. Given the similar resting LV function, post-exercise Q̇, and peak V̇O2 between the groups, we performed a post-hoc analysis of peak systemic vascular resistance. We found no difference between the groups, either when comparing the ratio of peak mean BP to post-exercise Q̇, with adjustments for age and time to Doppler echocardiography (β = 89 dynes ∙ s ∙ m2/cm5, P = 0.18), or when comparing the ratio of peak mean BP to peak V̇O2 adjusted for age (β = 0.14 mmHg ∙ min ∙ kg/L, P = 0.48). The latter estimate is confounded by potential differences in peripheral O2-extraction. However, we consider peak V̇O2 to be a more robust measure than the Doppler-derived post-exercise Q̇.
Furthermore, the validity of the differences in peak BPs is compromised by a high proportion of missing data (44% in BCSs vs. 22% in controls) (Table 4). The higher proportion of missing values in BCSs compared with controls may reflect that many of the BCSs were assessed during the initial phase of the study. As the study progressed and personnel became more experienced, the proportion of missing measurements decreased. Previous studies have found that higher peak BPs are associated with higher resting BPs [36, 37], higher BMI [36, 37] and higher LV mass [37]. Resting BPs were higher in the controls with missing peak BPs measurements compared with those with complete measurements, whereas this pattern was not observed in BCSs (Supplementary Table S3).
A large cohort study has shown that a higher workload-indexed increase in systolic BP in response to exercise was predictive of all-cause mortality [35]. Regarding cardiotoxic cancer treatments, some previous studies have suggested that treatment with anthracyclines [38] and radiotherapy [39] is associated with impaired vascular function in the long term, whereas other studies have not found affection of vascular function in BCS one [40] and seven [14] years after anthracycline therapy.
Resting cardiac morphology and function
We found no differences in cardiac biventricular function between BCSs and controls. There were minor differences in mitral inflow pattern, but no participants met the criteria for diastolic dysfunction. RV areas were slightly larger in BCSs compared with controls, with no other differences in right-sided measures. These findings were supported by similar levels of the cardiac biomarkers NT-proBNP and troponin T in BCSs and controls.
In our study, 12% of the BCSs had a 2D LVEF < 54%, with 1% having a 2D LVEF < 50%. In comparison, a study of 350 BCSs from Boerman et al. reported a 2D LV EF < 54% in 15% of all BCSs, and in 16% of the 142 BCSs treated with anthracyclines, which was higher than found in non-cancer controls [6]. Also in that study, the proportion with a 2D LV EF < 50% was low and did not differ between the groups [6]. Consistent with our findings, the proportion with LV diastolic dysfunction or RV function measured by tricuspid annular plane systolic excursion and peak annular systolic velocity did not differ between BCSs and controls [6]. Data on RV function in long-term BSCs are scarce, and to our knowledge, our study is the first to do a broad assessment of the RV in this population.
Jacobse et al. observed a 2D LV EF < 54% in 10% of BCSs treated with anthracyclines in their study of 569 BCSs, and reported a higher proportion with 2D LV EF < 54% and LV GLS > -17% in BCSs who had received anthracyclines compared with those who had not [8]. Both that study and the study from Boerman et al. [6] are comparable to our study regarding age, cumulative anthracycline dose, and follow-up time, although a minor proportion of the BCSs in those studies had also received trastuzumab.
NT-proBNP reflects cardiac wall stress and is thus an indirect and less investigator-dependent measure of cardiac function. We found that NT-proBNP was elevated in 7% of both BCSs and controls according to age- and sex-specific cut-off limits for the general population [22]. The proportion with NT-proBNP ≥ 125 ng/L in BCSs was 22%, compared with 33% in the study from Boerman et al. [6] and 23% in the study from Jacobsen et al. [8]. Analogous to LV 2D EF, the proportions with NT-proBNP ≥ 125 ng/L in those studies were higher in BCSs compared with non-cancer controls [6], and higher in BCSs who had received anthracyclines, compared with those who had not [8].
In the present study, the similar LV function in BCSs and controls contrasts with our hypothesis [20], but is consistent with the similar peak V̇O2 and V̇E/V̇CO2-slope found between the groups. The low proportion with cardiac pathology assessed by echocardiography and biomarkers is consistent with the low proportion with peak V̇O2 below the age- and sex-specific reference ranges in this study, and the low proportion with LV dysfunction in comparable studies [6, 7, 41].
Cardiovascular risk factors
We found no relevant differences between BCSs and controls regarding CV risk factors. A recently published cohort study of more than 14 000 BCSs reported that BCSs had a slightly higher cumulative incidence of diabetes, and slightly lower cumulative incidences of hypertension and dyslipidaemia 10 years after diagnosis compared with age-matched non-cancer controls. These results did not differ by prior exposure to chemotherapy, left-sided radiotherapy or endocrine therapy [42]. There were only minor differences in CV risk factors at the time of breast cancer diagnosis [42]. Corresponding trends were not apparent in our limited sample of BCSs.
Limitations
Our study had the limitations of a cross-sectional design, including potential for survival and sample selection bias. As the CAUSE trial involved an exercise training intervention, there was a risk of recruiting the healthiest individuals from both sampling populations, and thereby missing candidates with anthracycline-related adverse effects (Fig. 1). However, by identifying BCSs through the Cancer Registry of Norway, which provides nearly complete and accurate data on the Norwegian cancer population [43], we ensured that all eligible BCSs in the recruitment area were invited to participate. Nevertheless, only 20% of the invited BCSs were included in the study, which restricts the generalisability of our study results.
The different recruitment procedures for BCSs and controls may have affected the internal validity of our results. Whereas the BCSs were personally contacted, the controls actively volunteered in response to advertisements to take part in a training study. Hence, the controls may have had a stronger motivation for the exercise intervention, potentially reflecting higher activity levels and better health. However, differences in physical activity between the groups were mitigated by excluding the most physically active candidates. The similar findings between the groups do not support a selection bias towards fitter or healthier controls. Furthermore, the CV risk profile of the controls did not substantially deviate from the estimates for similar-aged women in Norwegian population-based studies [44, 45]. Few exclusion criteria concerning CV health strengthens the generalisability of our findings but may have attenuated differences attributable to the breast cancer treatment.
This study did not have the power to detect differences in rare outcomes or to adequately assess the effect of the different breast cancer treatment modalities on outcome variables. Therefore, the explanatory analyses must be interpreted with caution.
SVs measured after CPET were likely underestimated due to the challenge of acquiring Doppler spectra during post-exercise ventilation. Furthermore, post-exercise Q̇ was influenced by the delay between peak exercise and the Doppler-measurement, which was shorter in BCSs compared with controls. After a participant fell during the transfer from the treadmill to the examination bench, resulting in multiple fractures, we increased our focus on ensuring a safe transfer. This change led to increasing delays in Doppler-echocardiography for the subsequent participants, which to some extents may have contributed to the difference between the groups, as a higher proportion of BCSs were examined during the initial phase of the study compared with controls. However, we sought to account for this difference by adjusting for the measured time delay, which yielded similar results as adjustment with the ratio of Doppler-derived heart rate to ECG-derived HR (data not shown).
Clinical implications
This study utilised a spectrum of diagnostic tools to elucidate the various elements of CV health in long-term BCSs, yielding corresponding key findings. Along with a sufficient sample size, this strengthens the validity of our findings, suggesting that overall CV health is not considerably worse in long-term BCSs exposed to first-line anthracycline treatment, and having low to moderate pre-treatment risk of anthracycline-related CV toxicity [32], compared with women without cancer. Within the limitations of the study design, our results reflect a low risk of clinical anthracycline-related cardiotoxicity in this patient population. Banke et al. illustrated this by pointing out that the incidence rate of heart failure after epirubicin treatment is less than half that in a population with hypertension [4]. Our study does not support concerns of an accentuated age-related decline in CRF or a slow subclinical deterioration of cardiac function several years after treatment with anthracyclines. From this perspective, it is important to identify subgroups in need of long-term surveillance, both to ensure adequate management of high-risk individuals and to prevent over-surveillance of the whole group. Large longitudinal data are needed to elucidate this topic.
Conclusion
CRF, cardiac morphology and function, and CV risk profile in BCSs examined a decade after first-line treatment with anthracyclines were similar to that in women with no history of cancer. These findings are reassuring for the growing population of BCSs and those involved in the follow-up care of these individuals.
Electronic supplementary material
Below is the link to the electronic supplementary material.
Supplementary Material 1: Supplementary Table S1: Table S1, CV toxicity risk at the time of breast cancer diagnosis. Supplementary Table S2: Table S2 Associations between treatment modalities and outcomes in BCSs. Supplementary Table S3: Missing peak blood pressures.
Acknowledgements
This study used data from the Cancer Registry of Norway. The interpretation and reporting of these data are the sole responsibility of the authors, and no endorsement by the Cancer Registry of Norway is intended nor should be inferred. The authors thank Torbjørn Wisløff for advice on statistical analyses.
Abbreviations
- BCS
Breast Cancer Survivor
- BMI
Body Mass Index
- BP
Arterial Blood Pressure
- CV
Cardiovascular
- EDV
End-Diastolic Volume
- EF
Ejection Fraction
- ESV
End-Systolic Volume
- GLS
Global Longitudinal Strain
- HbA1c
Glycated Haemoglobin
- HDL-C
High-Density Lipoprotein Cholesterol
- LA
Left Atrium
- LDL-C
Low-Density Lipoprotein Cholesterol
- LV
Left Ventricular
- NT-proBNP
N-Terminal Pro-Brain Natriuretic Peptide
- Q̇
Cardiac Output
- RER
Respiratory Exchange Ratio
- RV
Right Ventricular
- SpO2
Saturation of Peripheral Oxygen
- SV
Stroke Volume
- V̇CO2
Carbon Dioxide Output
- V̇E
Minute Ventilation
- V̇O2
Oxygen Uptake
- VT
Ventilatory Threshold
- WHO
World Health Organisation
- 2D
Two-Dimensional
- 3D
Three-Dimensional
- 4CLS
Four-Chamber Longitudinal Strain
Author contributions
TSN (principal investigator for the CAUSE trial), LT, KVR and SIS made the conception and design of the study. MS and SIS performed the echocardiograms. MS collected clinical data from medical records and case histories, analysed the echocardiograms, analysed the data and wrote the main manuscript text. SHJ conducted the majority of the CPETs. All authors reviewed the manuscript. All authors have approved the submitted version of the manuscript and have agreed to be personally accountable for the author’s own contributions.
Funding
This study was funded by The Norwegian Cancer Society, Aktiv mot kreft (Active Against Cancer) and ProCardio Center for Innovation, Department of Cardiology, Oslo University Hospital.
Data availability
The datasets used in the current study cannot be shared publicly due to the privacy of the study participants. The data will be shared on reasonable request to the corresponding author.
Declarations
Ethical approval
Written informed consent was given by all study participants. The study complies with the Declaration of Helsinki and was approved by the Regional Committees for Medical and Health Research Ethics (2019/1318) and the Data Protection Services for Research (865175).
Competing interests
The authors declare no competing interests.
Footnotes
Publisher’s note
Springer Nature remains neutral with regard to jurisdictional claims in published maps and institutional affiliations.
References
- 1.Cancer Registry of Norway. Cancer in Norway 2022- Cancer incidence, mortality, survival and prevalence in Norway. https://www.kreftregisteret.no/globalassets/cancer-in-norway/2022/cin_report-2022.pdf (2023). Accessed 20.02 2024.
- 2.Ryberg M, Nielsen D, Skovsgaard T, Hansen J, Jensen BV, Dombernowsky P. Epirubicin cardiotoxicity: an analysis of 469 patients with metastatic breast cancer. J Clin Oncol. 1998;16(11):3502–8. 10.1200/jco.1998.16.11.3502. [DOI] [PubMed] [Google Scholar]
- 3.Von Hoff DD, Layard MW, Basa P, Davis HL Jr., Hoff V, Rozencweig AL. Risk factors for doxorubicin-induced congestive heart failure. Ann Intern Med. 1979;91(5):710–7. 10.7326/0003-4819-91-5-710. [DOI] [PubMed] [Google Scholar]
- 4.Banke A, Fosbøl EL, Møller JE, Gislason GH, Andersen M, Bernsdorf M, et al. Long-term effect of epirubicin on incidence of heart failure in women with breast cancer: insight from a randomized clinical trial. Eur J Heart Fail. 2018;20(10):1447–53. 10.1002/ejhf.1168. [DOI] [PubMed] [Google Scholar]
- 5.Jacobse JN, Schaapveld M, Boekel NB, Hooning MJ, Jager A, Baaijens MHA, et al. Risk of heart failure after systemic treatment for early breast cancer: results of a cohort study. Breast Cancer Res Treat. 2021;185(1):205–14. 10.1007/s10549-020-05930-w. [DOI] [PubMed] [Google Scholar]
- 6.Boerman LM, Maass S, van der Meer P, Gietema JA, Maduro JH, Hummel YM, et al. Long-term outcome of cardiac function in a population-based cohort of breast cancer survivors: a cross-sectional study. Eur J Cancer. 2017;81:56–65. 10.1016/j.ejca.2017.05.013. [DOI] [PubMed] [Google Scholar]
- 7.Zambetti M, Moliterni A, Materazzo C, Stefanelli M, Cipriani S, Valagussa P, et al. Long-term cardiac sequelae in operable breast cancer patients given adjuvant chemotherapy with or without doxorubicin and breast irradiation. J Clin Oncol. 2001;19(1):37–43. 10.1200/jco.2001.19.1.37. [DOI] [PubMed] [Google Scholar]
- 8.Jacobse JN, Steggink LC, Sonke GS, Schaapveld M, Hummel YM, Steenbruggen TG, et al. Myocardial dysfunction in long-term breast cancer survivors treated at ages 40–50 years. Eur J Heart Fail. 2020;22(2):338–46. 10.1002/ejhf.1610. [DOI] [PMC free article] [PubMed] [Google Scholar]
- 9.Kodama S, Saito K, Tanaka S, Maki M, Yachi Y, Asumi M, et al. Cardiorespiratory fitness as a quantitative predictor of all-cause mortality and cardiovascular events in healthy men and women: a meta-analysis. JAMA. 2009;301(19):2024–35. 10.1001/jama.2009.681. [DOI] [PubMed] [Google Scholar]
- 10.Peel AB, Thomas SM, Dittus K, Jones LW, Lakoski SG. Cardiorespiratory fitness in breast cancer patients: a call for normative values. J Am Heart Assoc. 2014;3(1):e000432. 10.1161/jaha.113.000432. [DOI] [PMC free article] [PubMed] [Google Scholar]
- 11.Khouri MG, Hornsby WE, Risum N, Velazquez EJ, Thomas S, Lane A, et al. Utility of 3-dimensional echocardiography, global longitudinal strain, and exercise stress echocardiography to detect cardiac dysfunction in breast cancer patients treated with doxorubicin-containing adjuvant therapy. Breast Cancer Res Treat. 2014;143(3):531–9. 10.1007/s10549-013-2818-1. [DOI] [PMC free article] [PubMed] [Google Scholar]
- 12.Kirkham AA, Haykowsky MJ, Beaudry RI, Grenier JG, Mackey JR, Pituskin E, et al. Cardiac and skeletal muscle predictors of impaired cardiorespiratory fitness post-anthracycline chemotherapy for breast cancer. Sci Rep. 2021;11(1):14005. 10.1038/s41598-021-93241-5. [DOI] [PMC free article] [PubMed] [Google Scholar]
- 13.Jones LW, Haykowsky M, Pituskin EN, Jendzjowsky NG, Tomczak CR, Haennel RG, et al. Cardiovascular reserve and risk profile of postmenopausal women after chemoendocrine therapy for hormone receptor–positive operable breast cancer. Oncologist. 2007;12(10):1156–64. 10.1634/theoncologist.12-10-1156. [DOI] [PubMed] [Google Scholar]
- 14.Koelwyn GJ, Lewis NC, Ellard SL, Jones LW, Gelinas JC, Rolf JD, et al. Ventricular-arterial coupling in breast Cancer patients after treatment with anthracycline-containing adjuvant chemotherapy. Oncologist. 2016;21(2):141–9. 10.1634/theoncologist.2015-0352. [DOI] [PMC free article] [PubMed] [Google Scholar]
- 15.Beaudry RI, Haykowsky MJ, MacNamara JP, Tucker WJ, Rao R, Haley B, et al. Cardiac mechanisms for low aerobic power in anthracycline treated, older, long-term breast cancer survivors. Cardiooncology. 2022;8(1):8. 10.1186/s40959-022-00134-1. [DOI] [PMC free article] [PubMed] [Google Scholar]
- 16.Lakoski SG, Barlow CE, Koelwyn GJ, Hornsby WE, Hernandez J, Defina LF, et al. The influence of adjuvant therapy on cardiorespiratory fitness in early-stage breast cancer seven years after diagnosis: the Cooper Center Longitudinal Study. Breast Cancer Res Treat. 2013;138(3):909–16. 10.1007/s10549-013-2478-1. [DOI] [PMC free article] [PubMed] [Google Scholar]
- 17.Ramin C, Schaeffer ML, Zheng Z, Connor AE, Hoffman-Bolton J, Lau B, et al. All-cause and Cardiovascular Disease Mortality among breast Cancer survivors in CLUE II, a long-Standing Community-based cohort. J Natl Cancer Inst. 2021;113(2):137–45. 10.1093/jnci/djaa096. [DOI] [PMC free article] [PubMed] [Google Scholar]
- 18.Darby SC, McGale P, Taylor CW, Peto R. Long-term mortality from heart disease and lung cancer after radiotherapy for early breast cancer: prospective cohort study of about 300,000 women in US SEER cancer registries. Lancet Oncol. 2005;6(8):557–65. 10.1016/s1470-2045(05)70251-5. [DOI] [PubMed] [Google Scholar]
- 19.Amir E, Seruga B, Niraula S, Carlsson L, Ocaña A. Toxicity of adjuvant endocrine therapy in postmenopausal breast cancer patients: a systematic review and meta-analysis. J Natl Cancer Inst. 2011;103(17):1299–309. 10.1093/jnci/djr242. [DOI] [PubMed] [Google Scholar]
- 20.Nilsen TS, Sæter M, Sarvari SI, Reinertsen KV, Johansen SH, Edvardsen ER, et al. Effects of Aerobic Exercise on Cardiorespiratory Fitness, Cardiovascular Risk factors, and patient-reported outcomes in long-term breast Cancer survivors: protocol for a Randomized Controlled Trial. JMIR Res Protoc. 2023;12:e45244. 10.2196/45244. [DOI] [PMC free article] [PubMed] [Google Scholar]
- 21.Helsedirektoratet. Nasjonal faglig retningslinje for forebygging av hjerte- og karsykdom [nettdokument]. https://www.helsedirektoratet.no/retningslinjer/forebygging-av-hjerte-og-karsykdom (2017). Accessed 22.02 2024.
- 22.Averina M, Stylidis M, Brox J, Schirmer H. NT-ProBNP and high-sensitivity troponin T as screening tests for subclinical chronic heart failure in a general population. ESC Heart Fail. 2022;9(3):1954–62. 10.1002/ehf2.13906. [DOI] [PMC free article] [PubMed] [Google Scholar]
- 23.Amireault S, Godin G, Lacombe J, Sabiston CM. Validation of the Godin-Shephard leisure-time physical activity questionnaire classification coding system using accelerometer assessment among breast cancer survivors. J Cancer Surviv. 2015;9(3):532–40. 10.1007/s11764-015-0430-6. [DOI] [PubMed] [Google Scholar]
- 24.Bull FC, Al-Ansari SS, Biddle S, Borodulin K, Buman MP, Cardon G, et al. World Health Organization 2020 guidelines on physical activity and sedentary behaviour. Br J Sports Med. 2020;54(24):1451–62. 10.1136/bjsports-2020-102955. [DOI] [PMC free article] [PubMed] [Google Scholar]
- 25.Lang RM, Badano LP, Mor-Avi V, Afilalo J, Armstrong A, Ernande L, et al. Recommendations for cardiac chamber quantification by echocardiography in adults: an update from the American Society of Echocardiography and the European Association of Cardiovascular Imaging. J Am Soc Echocardiogr. 2015;28(1):1–e3914. 10.1016/j.echo.2014.10.003. [DOI] [PubMed] [Google Scholar]
- 26.Sugimoto T, Dulgheru R, Bernard A, Ilardi F, Contu L, Addetia K, et al. Echocardiographic reference ranges for normal left ventricular 2D strain: results from the EACVI NORRE study. Eur Heart J Cardiovasc Imaging. 2017;18(8):833–40. 10.1093/ehjci/jex140. [DOI] [PubMed] [Google Scholar]
- 27.Nagueh SF, Smiseth OA, Appleton CP, Byrd BF 3rd, Dokainish H, Edvardsen T, et al. Recommendations for the evaluation of left ventricular diastolic function by Echocardiography: an update from the American Society of Echocardiography and the European Association of Cardiovascular Imaging. J Am Soc Echocardiogr. 2016;29(4):277–314. 10.1016/j.echo.2016.01.011. [DOI] [PubMed]
- 28.Balady GJ, Arena R, Sietsema K, Myers J, Coke L, Fletcher GF, et al. Clinician’s guide to cardiopulmonary exercise testing in adults: a scientific statement from the American Heart Association. Circulation. 2010;122(2):191–225. 10.1161/CIR.0b013e3181e52e69. [DOI] [PubMed] [Google Scholar]
- 29.Edvardsen E, Hem E, Anderssen SA. End criteria for reaching maximal oxygen uptake must be strict and adjusted to sex and age: a cross-sectional study. PLoS ONE. 2014;9(1):e85276. 10.1371/journal.pone.0085276. [DOI] [PMC free article] [PubMed] [Google Scholar]
- 30.Giskeødegård GF, Lydersen S. Measurements below the detection limit. Tidsskr nor Laegeforen. 2022;142(13). 10.4045/tidsskr.22.0439. [DOI] [PubMed]
- 31.Støylen A, Mølmen HE, Dalen H. Regional motion of the AV-plane is related to the cardiac anatomy and deformation of the AV-plane. Data from the HUNT study. Clin Physiol Funct Imaging. 2023;43(6):453–62. 10.1111/cpf.12845. [DOI] [PubMed] [Google Scholar]
- 32.Loe H, Steinshamn S, Wisløff U. Cardio-respiratory reference data in 4631 healthy men and women 20–90 years: the HUNT 3 fitness study. PLoS ONE. 2014;9(11):e113884. 10.1371/journal.pone.0113884. [DOI] [PMC free article] [PubMed] [Google Scholar]
- 33.Lyon AR, Lopez-Fernandez T, Couch LS, Asteggiano R, Aznar MC, Bergler-Klein J, et al. 2022 ESC guidelines on cardio-oncology developed in collaboration with the European Hematology Association (EHA), the European Society for Therapeutic Radiology and Oncology (ESTRO) and the International Cardio-Oncology Society (IC-OS). Eur Heart J. 2022;43(41):4229–361. 10.1093/eurheartj/ehac244. [DOI] [PubMed] [Google Scholar]
- 34.Nes BM, Janszky I, Wisløff U, Støylen A, Karlsen T. Age-predicted maximal heart rate in healthy subjects: the HUNT fitness study. Scand J Med Sci Sports. 2013;23(6):697–704. 10.1111/j.1600-0838.2012.01445.x. [DOI] [PubMed] [Google Scholar]
- 35.Hedman K, Cauwenberghs N, Christle JW, Kuznetsova T, Haddad F, Myers J. Workload-indexed blood pressure response is superior to peak systolic blood pressure in predicting all-cause mortality. Eur J Prev Cardiol. 2020;27(9):978–87. 10.1177/2047487319877268. [DOI] [PubMed] [Google Scholar]
- 36.Berger A, Grossman E, Katz M, Kivity S, Klempfner R, Segev S, et al. Exercise blood pressure and the risk for future hypertension among normotensive middle-aged adults. J Am Heart Assoc. 2015;4(4). 10.1161/JAHA.114.001710. [DOI] [PMC free article] [PubMed]
- 37.Lauer MS, Levy D, Anderson KM, Plehn JF. Is there a relationship between exercise systolic blood pressure response and left ventricular mass? The Framingham Heart Study. Ann Intern Med. 1992;116(3):203–10. 10.7326/0003-4819-116-3-203. [DOI] [PubMed] [Google Scholar]
- 38.Li VW, Liu AP, Ho KK, Yau JP, Cheuk DK, Cheung YF. Resting and exercise arterial dysfunction in anthracycline-treated adult survivors of childhood cancers. Cardiooncology. 2018;4:9. 10.1186/s40959-018-0035-0. [DOI] [PMC free article] [PubMed] [Google Scholar]
- 39.Vallerio P, Sarno L, Stucchi M, Musca F, Casadei F, Maloberti A, et al. Long-Term effects of Radiotherapy on arterial stiffness in breast Cancer Women. Am J Cardiol. 2016;118(5):771–6. 10.1016/j.amjcard.2016.06.001. [DOI] [PubMed] [Google Scholar]
- 40.Novo G, Di Lisi D, Manganaro R, Manno G, Lazzara S, Immordino FA, et al. Arterial stiffness: effects of Anticancer drugs used for breast Cancer Women. Front Physiol. 2021;12:661464. 10.3389/fphys.2021.661464. [DOI] [PMC free article] [PubMed] [Google Scholar]
- 41.Bjerring AW, Smeland KH, Stokke T, Haugaa KH, Holte E, Rosner A, et al. Long-term cardiac effects of modern treatment for Hodgkin’s lymphoma. Cardiooncology. 2024;10(1):19. 10.1186/s40959-024-00222-4. [DOI] [PMC free article] [PubMed] [Google Scholar]
- 42.Kwan ML, Cheng RK, Iribarren C, Neugebauer R, Rana JS, Nguyen-Huynh M, et al. Risk of cardiometabolic risk factors in women with and without a history of breast Cancer: the pathways Heart Study. J Clin Oncol. 2022;40(15):1635–46. 10.1200/jco.21.01738. [DOI] [PMC free article] [PubMed] [Google Scholar]
- 43.Larsen IK, Småstuen M, Johannesen TB, Langmark F, Parkin DM, Bray F, et al. Data quality at the Cancer Registry of Norway: an overview of comparability, completeness, validity and timeliness. Eur J Cancer. 2009;45(7):1218–31. 10.1016/j.ejca.2008.10.037. [DOI] [PubMed] [Google Scholar]
- 44.Åsvold BO, Langhammer A, Rehn TA, Kjelvik G, Grøntvedt TV, Sørgjerd EP, et al. Cohort Profile Update: the HUNT study, Norway. Int J Epidemiol. 2023;52(1):e80–91. 10.1093/ije/dyac095. [DOI] [PMC free article] [PubMed] [Google Scholar]
- 45.Hopstock LA, Grimsgaard S, Johansen H, Kanstad K, Wilsgaard T, Eggen AE. The seventh survey of the Tromso Study (Tromso7) 2015–2016: study design, data collection, attendance, and prevalence of risk factors and disease in a multipurpose population-based health survey. Scand J Public Health. 2022;50(7):919–29. 10.1177/14034948221092294. [DOI] [PMC free article] [PubMed] [Google Scholar]
Associated Data
This section collects any data citations, data availability statements, or supplementary materials included in this article.
Supplementary Materials
Supplementary Material 1: Supplementary Table S1: Table S1, CV toxicity risk at the time of breast cancer diagnosis. Supplementary Table S2: Table S2 Associations between treatment modalities and outcomes in BCSs. Supplementary Table S3: Missing peak blood pressures.
Data Availability Statement
The datasets used in the current study cannot be shared publicly due to the privacy of the study participants. The data will be shared on reasonable request to the corresponding author.