

Abstract
Afghanistan continues to experience challenges affecting polio eradication. Mass polio vaccination campaigns, which aim to protect children under the age of 5, are a key eradication strategy. To date, the polio program in Afghanistan has only employed facility-based seroprevalence surveys, which can be subject to sampling bias. We describe the feasibility in implementing a cross-sectional household poliovirus seroprevalence survey based on geographical information systems (GIS) in three districts. Digital maps with randomly selected predetermined starting points were provided to teams, with a total target of 1,632 households. Teams were instructed to navigate to predetermined starting points and enrol the closest household within 60 m. To assess effectiveness of these methods, we calculated percentages for total households enrolled with valid geocoordinates collected within the designated boundary, and whether the Euclidean distance of households were within 60 m of a predetermined starting point. A normalized difference vegetation index (NDVI) image ratio was conducted to further investigate variability in team performances. The study enrolled a total of 78% of the target sample with 52% of all households within 60 m of a pre-selected point and 79% within the designated cluster boundary. Success varied considerably between the four target areas ranging from 42% enrolment of the target sample in one place to 90% enrolment of the target sample in another. Interviews with the field teams revealed that differences in security status and amount of non-residential land cover were key barriers to higher enrolment rates. Our findings indicate household poliovirus seroprevalence surveys using GIS-based sampling can be effectively implemented in polio endemic countries to capture representative samples. We also proposed ways to achieve higher success rates if these methods are to be used in the future, particularly in areas with concerns of insecurity or spatially dispersed residential units.
Keywords: Household survey, seroprevalence, poliovirus, GIS, Afghanistan
Introduction
Poliomyelitis (polio), a highly infectious disease caused by poliovirus, primarily affects children under the age of 5 years (Opare et al., 2019). Since the introduction of the Global Polio Eradication Initiative (GPEI) in 1988, global eradication of the transmission of wild poliovirus types 2 and 3 has been declared eradicated (Kuehn, 2019), while wild poliovirus serotype 1 (WPV1) transmission has never been interrupted in Afghanistan and Pakistan, which share a land border (GPEI, 2019). The efforts to interrupt WPV1 transmission in these two countries have further been challenged by the emergence of circulating vaccine-derived poliovirus (cVDPV), which is biologically identical to WPV and has resulted in paralytic polio cases; cVDPVs emerge when attenuated oral poliovirus vaccine (OPV) strains undergo progressive genetic changes during prolonged circulation in under-immunized populations (WHO, 2017).
Progress toward interruption of indigenous WPV transmission in Afghanistan has been impaired by decades of conflict and insurgency, leading to intermittent bans on house-to-house vaccinations, disruptions in supply chains, and the promotion of negative attitudes towards vaccination (Kalkowska et al., 2019, Verma et al., 2018). A World Health Organization (WHO) situation report indicated that nearly 1 million children under 5 years of age have missed OPV administration since May 2018 until January 2021 (Cousins, 2021; WHO, 2018). Afghanistan has observed a 38% increase in WPV1 cases from 2018 (21 cases) to 2019 (29 cases) and a 93% increase from 2019 (29) to 2020 (56), with Kandahar Province containing more cases than any other province. Moreover, 69 cases of circulating vaccine derived poliovirus type 2 (cVDPV2) were detected in August 2020, of which a majority (62%) were located in Nangahar Province (Martinez et al., 2020).
Poliovirus transmission has primarily been detected through surveillance of Acute Flaccid Paralysis (AFP), which is the onset of weakness in one or more limbs (CDC, 2019). Since paralytic polio occurs in <1% of WPV-infected children, poliovirus can circulate undetected; therefore endemic countries are challenged to rely solely on AFP surveillance to track transmission and achieve global eradication (Chen et al., 2020; Shimabukuro, 2021). Hence, complementing AFP surveillance with environmental surveillance (ES; systematic sewage sampling and testing) and seroprevalence studies has been crucial for estimating spatial and temporal trends of poliovirus circulation, population immunity and program effectiveness. Genomic sequence analysis, which can identify chains of transmission, indicates that WPV1 continues to persist primarily in Karachi, Pakistan and along two corridors between Afghanistan and Pakistan, Nangahar in the North and Kandahar in the South (GPEI, 2019). These two Afghanistan provinces are situated on the Durand line, the 2,430-km border between the two countries. The Durand line is a particularly porous international border; the International Organization of Migration (IOM) indicates that Nangahar and Kandahar are the two most frequented destinations for mobile populations entering the country from Pakistan.
Continued detection of WPV1 transmission though AFP surveillance and ES within Kandahar and Nangahar in 2020 highlighted a need to assess the prevalence of immunity among children to identify poliovirus seronegative populations in areas with ES sampling sites (catchment areas) and without (non-catchment areas). In the past, serosurveillance conducted in Afghanistan has been facility-based due to security concerns. This involves collecting blood samples from children of target age groups, who are accompanied by an adult primary care giver, during their visits to healthcare facilities for medical reasons. This method can incur considerable sampling bias due to varying health-seeking behaviours and access to health facilities (Hussain et al., 2018). Here we report the results of a sampling method of identifying subjects for serosurveillance to represent the greater community within catchment and non-catchment areas. This was conducted in three high-risk districts along the Durand line, two in the northern corridor province of Nangahar and one in the southern corridor province of Kandahar.
This seroprevalence survey was designed as a household approach, requiring survey teams to navigate to randomly pre-selected locations using geographical information systems (GIS) methods. This manuscript describes the design and implementation of a GIS-based household seroprevalence survey for quantifying levels of serological protection against poliovirus types 1, 2, and 3 in children from two areas in Afghanistan.
Materials and Methods
The study was approved by the Institutional Review Board (IRB) for Afghanistan Ministry of Health and determined to be non-research activity by the Centers for Disease Control and Prevention (CDC), Atlanta, USA.
Study area
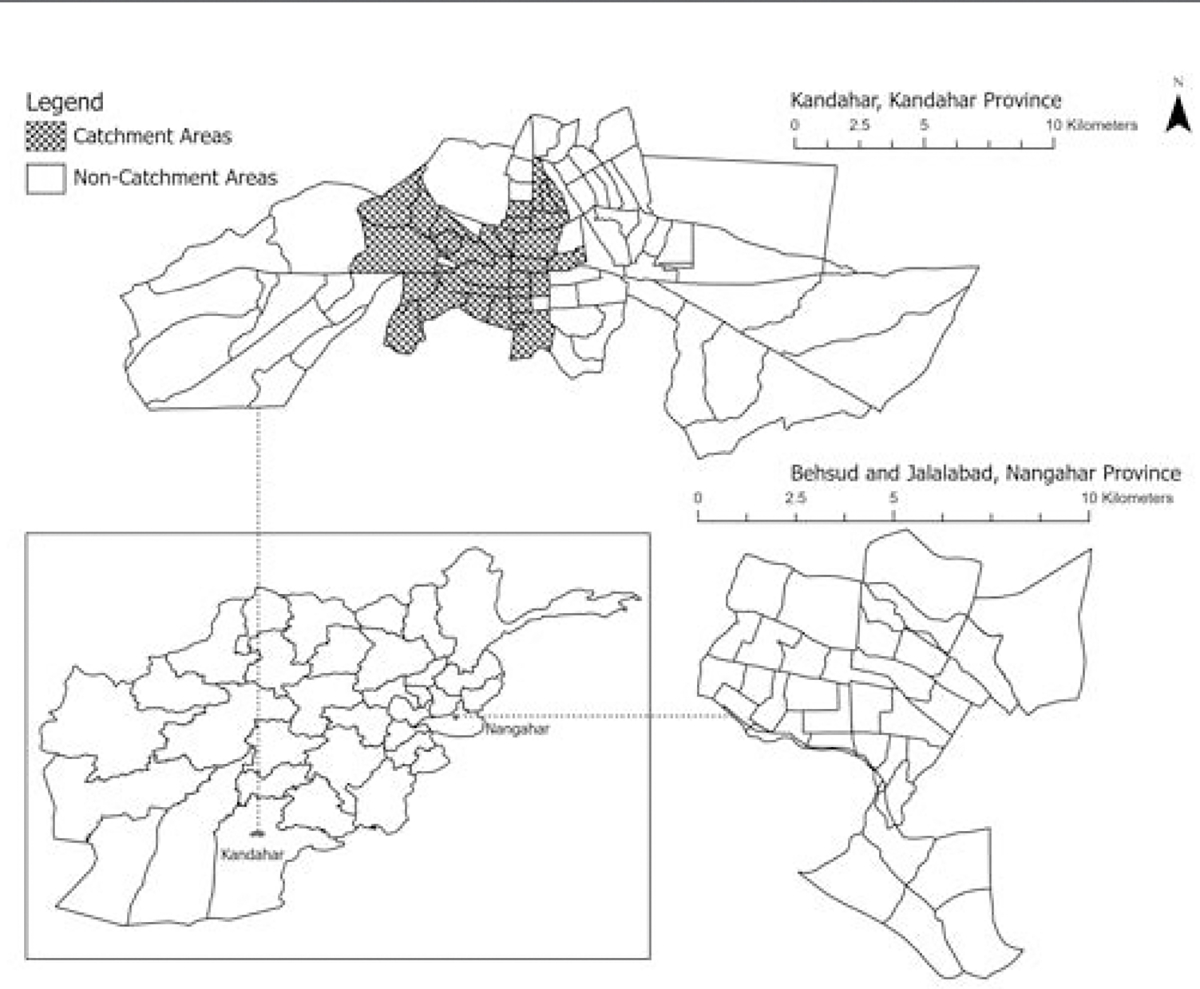
We conducted a cross-sectional household survey among children in two age groups: 6–11 months and 36–48 months, with a total sample target of 1,632 (Table 1). The survey was conducted in two primary areas of Kandahar City and in the districts of Jalalabad and Behsud in Nangahar Province. Teams collected data from February 16th, 2020, to March 19th, 2020, in Behsud and Jalalabad, and from February 25th, 2020, to March 19th, 2020, in Kandahar City. We used administrative level 3 units (referred to locally as “clusters”), the smallest operational unit for polio micro-planning, to define the overall study area boundaries (Figures 1 and 2).
Table 1.
Enrolment targets per study area.
| Area | Study area (strata) | Predetermined starting points(no.) | Replacement collection points(no.) | Clusters(no.) |
|---|---|---|---|---|
| Nangarhar | Behsud | 50 | 20 | 4 |
| Jalalabad | 782 | 180 | 29 | |
| Kandahar | Kandahar Catchment area | 350 | 88 | 30 |
| Non-catchment area | 450 | 112 | 50 |
Figure 1. Kandahar province: GPEI administrative levels.

Figure 2. Nangahar province: GPEI administrative levels.

Spatial sampling methodology
To randomize enrolment, the sampling approach used spatially randomized predetermined starting points to identify households. Due to the density of structures, no building classifications were available (e.g., commercial versus residential) via satellite imagery. Instead, random points were overlayed on maps within the study areas and every predetermined starting point served as a team starting location. The ‘create random points’ tool available in ArcGIS Pro (ESRI, Redlands, CA, USA) software was utilized to generate the primary starting point locations. This tool creates a specified number of random points generated within a constraining polygon. Since the study area encompassed multiple constraining cluster polygons, the ‘dissolve tool’ was used to obtain a single constraining feature for each study area. The clusters in Kandahar were further stratified into ES catchment and non-catchment areas by the Afghanistan Ministry of Health (MoH). Non-catchment areas were included within the study to offer insights into ongoing circulation of poliovirus in areas lacking ES sites. Kandahar was the only study area that included non-catchment areas (50 clusters) as both Jalalabad and Behsud solely consist of catchment areas (Figure 3).
Figure 3. Environmental surveillance in Kandahar, Jalalabad and Behsud. Delineation of catchment and non-catchment areas, all areas in ES catchment.
A power analysis was used to calculate city-level estimates with an enrolment target of 800 children for the two-primary areas: Kandahar City and Jalalabad/Behsud. Within each of the two overall areas, points were allocated to the two strata proportional to the population <5 years of age for each study area (based on estimates calculated using spatial regression models which incorporated socio-demographic, economic surveys and ancillary geospatial covariates associated with population density). An additional sample of 32 children was added to the Behsud study area due to the low number of allocated points (18) by population, which allowed mitigation for limited data submission in these strata and thus expanding the total collection target to 1,632 samples for all three districts.
Data collection teams
A total of 26 staff were trained. Every team comprised of 1 team lead and 12 data collectors that included a social mobilizer and a nurse/phlebotomist for the Jalalabad, Behsud sites and the Kandahar site. Data collectors with extensive knowledge of the terrain and populations were used and provided transportation wherever possible to act as intermediaries between Agha Khan University (AKU) investigators and suspicious or hostile populations. All teams constituted a 1:2 male to female ratio. The presence of female team members was essential for access as women practice the ‘Purdah’ or veil system, a religious and social practice requiring women to be veiled and preventing males from entering the household unless given permission by the head of household. To navigate to the predetermined starting points, each team was provided with digital maps on global positioning system (GPS)-enabled tablets that indicated pre-selected point locations requiring collection of serology samples.
Teams were instructed to select and survey the closest residential structure within a search radius of 60 m from the predetermined points provided. In addition to the 60 m search radius, a total of 400 replacement collection points were provided for each study area in the event of refusals and/or to account for points located in non-residential areas. If there were no qualifying children in the enrolment age group (6–11 months and 36–48 months) or the household refused to participate, field teams attempted to enrol the next closest house within a 60 m search radius of the predetermined starting point provided. Small incentives (a box of date fruits) were provided to families upon the completion of each survey in an effort to improve enrolment rates.
Mobile software
Field teams used ArcGIS Explorer, version 20.2.0; an Android app for navigating to pre-selected points. Explorer was selected due to its capabilities to function in environments without internet access, allowing teams to take digital maps directly into the field using tablets. Each digital map contained vector data and raster data including predetermined starting point locations, replacement points, points of interest (mosques, schools, universities, road labels), cluster boundaries and a cached base map. Digital maps were prepared and deployed to team accounts collectively as mobile map packages. Once downloaded, teams were able to use the digital maps and continue working with cached GIS data for manual navigation. The app allowed teams to toggle layers on and off as needed, which was deemed useful in areas where satellite imagery base-maps are known to create suspicion due to their association with tracking devices or intelligence and military activities. While ArcGIS Explorer does not generate routes or directions, it provides a compass feature that assists orientation. Moreover, the app displays where data collectors are in relation to the primary predetermined starting points. In addition to ArcGIS Explorer, teams were trained to conduct tablet-based data collection using Open Data Kit (ODK), an open-source software for collecting geotagged questionnaire data offline. Each questionnaire collected information on patient demography, socioeconomic status, immunization history and status, co-morbidities, and basic physical and nutritional information. The results generated through this household survey will be provided in a subsequent publication.
Data security
The study obtained approvals from the Ethical Research Committee of Aga Khan University and Internal Review Board (IRB) of Ministry of Public Health, Kabul Afghanistan. All personal patient information was kept confidential, except for a senior project staff having access to identifier data, and data sets were analyzed anonymously. Codes were assigned to each of the data collectors in the field and every completed ODK questionnaire was submitted to a secure, password protected server via an encrypted connection. To avoid loss of data and for completeness, all datasets were exported daily by the CDC and AKU.
Training and pilot study
Prior to the commencement of the survey, a two-phase training was implemented. Phase 1 was comprised of core AKU and CAF staff, while phase 2 consisted of provincial field teams. The trainings were provided by CDC and AKU, and staff were trained on ODK forms, downloading maps, configuring tablets, understanding various layers and legends, collecting GPS points accurately, measuring distances, and navigating to predetermined starting points (Figure 4). Teams were also provided with standard operating procedures (SOPs) for ArcGIS Explorer along with training video guides. Following the trainings, a pilot test was conducted in Pakistan (Gurjro and Azam Basti in Malir and Karachi District, respectively). To attain support from the ‘Mohalla’ elders or village leaders, AKU organized meetings with union council offices in Pakistan and Afghanistan demonstrating the importance of the seroprevalence survey. Mohalla elders are known to perform community level management functions such as religious ceremonies, resource management and conflict resolution in large neighbourhoods, and are often incorporated into studies to facilitate data collection.
Figure 4. Pilot test site, Azam Basti, Malir, Karachi district.

Assessment measures
Three assessment measures were employed to determine each team’s ability to successfully navigate to pre-selected points.
Assessment 1:
To quantify the percentage of expected home surveys that were completed with a valid geo-point, we compared the total number of geotagged ODK submissions to the total number of predetermined locations listed in each study area.
Assessment 2:
To confirm that the survey largely occurred within the correct cluster, we recorded the percentage of ODK submissions that fell within the overall cluster boundary. A ‘select by location’ query was used within ArcGIS Pro, whereby all ODK submissions submitted outside the overall cluster boundary were calculated and compared to the predetermined location list.
Assessment 3:
Per training, teams were instructed to search for a household to enrol within 60 m of the designated random predetermined starting point, and then if unable to enrol any households near that point, move to the next replacement point. To determine the general spatial mismatch between the expected survey location and the actual survey location, we identified the percentage of ODK submissions that occurred within 60 m of the pre-selected points.
In addition to the three assessments conducted, a sub analysis was performed to determine if vegetation cover was a contributing factor to the variability in team performances. Given the numerous crop fields encountered by data collectors in the study area, the number of vegetation pixels per cluster was aggregated using satellite imagery to estimate the vegetation cover. Using medium-resolution (30 m) multispectral imagery acquired on the 6th and 20th of April 2019 for Jalalabad and Behsud and 6th of April 2020 for Kandahar City from Landsat 8 (https://www.usgs.gov/landsat-missions/landsat-8), we determined the density of vegetation using the normalized difference vegetation index (NDVI) that uses spectral reflectivity of solar radiation.
Results
Assessment 1: Sample submissions per study area
A total of 1,272 (78%) ODK sample submissions were received out of the expected target of 1,632, with varying team performances in each study area based on three measures (Table 2). For the total geotagged points collected in each study area calculated against the target samples indicated, Jalalabad achieved the highest (704, 90%) number of collected samples followed by Kandahar catchment area (259/350, 74%), Kandahar non-catchment area (288, 64%) and Behsud (21, 42%). Consequently, it was observed that data collectors made no submissions from 24 out of the 50 clusters in Kandahar non-catchment areas, 7 out of the 30 clusters in Kandahar catchment areas and 4 out of the 4 clusters in Behsud. Our study reported a total of 161 overt refusals across both study areas: 79 in Kandahar catchment and non-catchment areas and 82 in Jalalabad and Behsud.
Table 2.
Team performances per study area.
| Area | Study area (strata) | Expected target submissions (no.) | ODK geotagged submissions (no.) | Points recorded out of expected samples (%) | Points recorded within the correct cluster (%) | Points recorded within 60 m of a (%) predetermined starting point | Predeter mined starting points intersecting with vegetation (%) |
|---|---|---|---|---|---|---|---|
| Nangarhar | Behsud | 50 | 21 | 42 | 0 | 24 | 56 |
| Jalalabad | 782 | 704 | 90 | 76 | 46 | 9 | |
| Kandahar | Kandahar Catchment area | 350 | 259 | 74 | 96 | 64 | 16 |
| Non-catchment area | 450 | 288 | 64 | 80 | 57 | 14 |
Assessment 2: Sample submissions within boundary of study areas
The second measure used to assess team performance was the percentage of submissions points collected within cluster boundaries. The Kandahar catchment area team had the highest percentage (96%), followed by the Kandahar non-catchment area (80%) and Jalalabad teams (76%). In contrast, teams surveying Behsud District recorded 0% of the points contained within the cluster boundary.
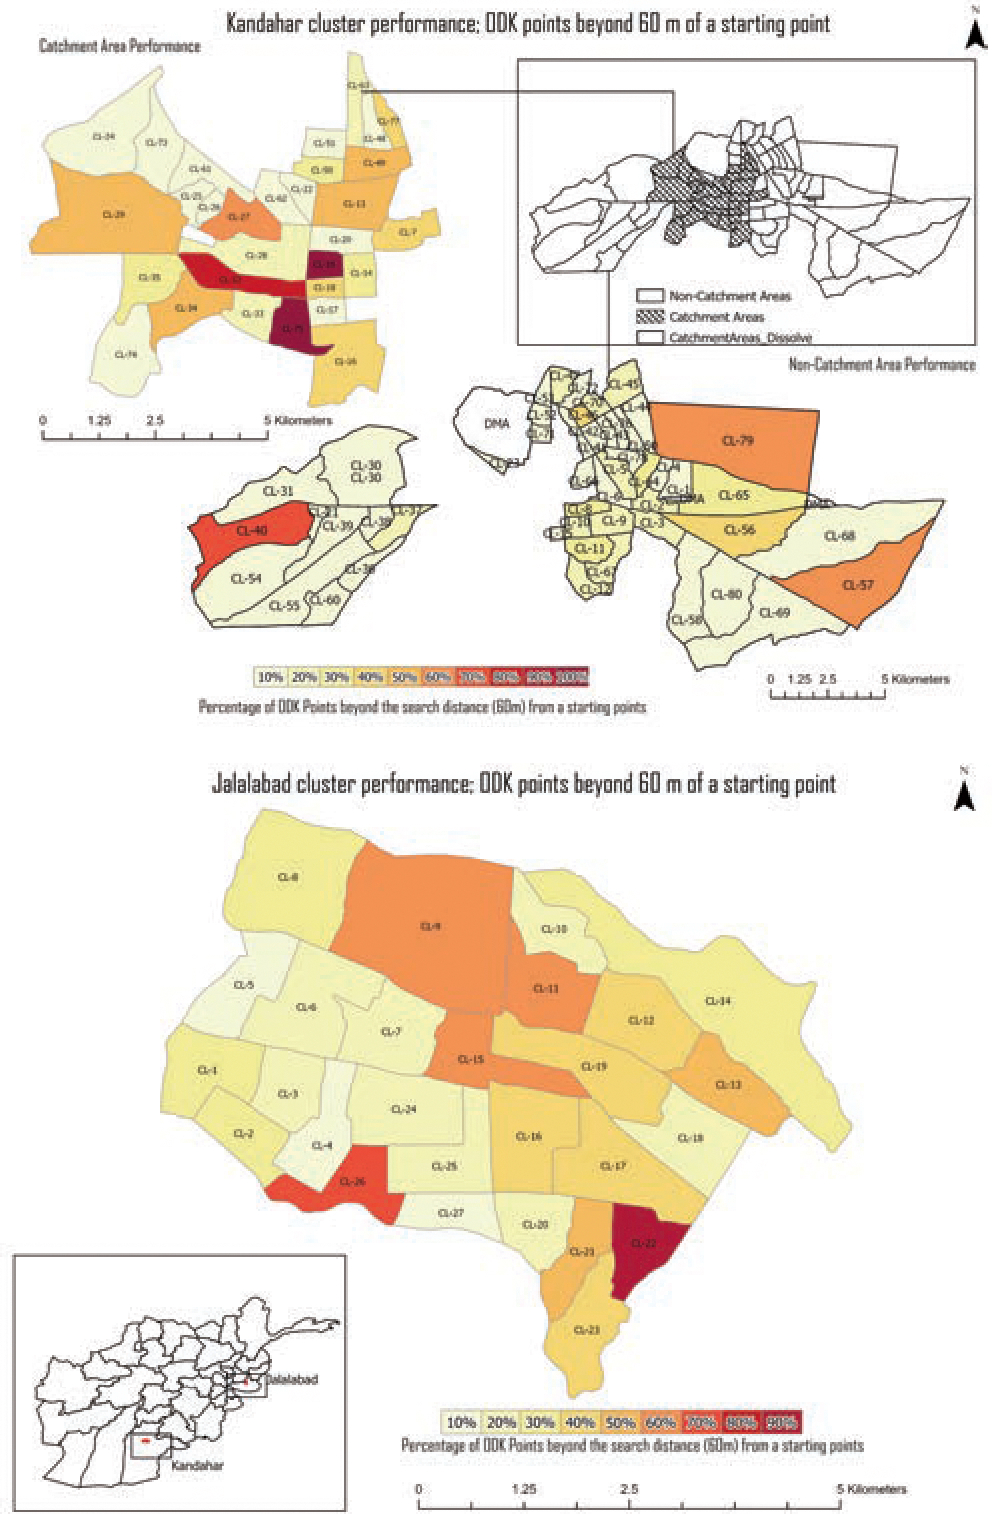
Assessment 3: Sample submissions within 60 m of the predetermined starting points
Team performances in Kandahar catchment areas attained the highest number (64%) of samples within 60 m of a predetermined starting point, followed by Kandahar non-catchment areas (57%), Jalalabad (46%) and Behsud (24%). Clusters 40, 57 and 79 in Kandahar non-catchment area areas presented 60%–70% of ODK submissions that surpassed the 60 m search radius from a given predetermined starting point (Figure 5). Similarly, clusters 20 and 75 in Kandahar catchment area and clusters 9, 11, 15, 22, 26 in Jalalabad exhibited 60%–90% of ODK submissions beyond the 60 m search radius (Figure 5). Finally, all clusters in Behsud displayed 100% of ODK submissions beyond the designated search area provided.
Figure 5. Kandahar and Jalalabad team performances.
The results from the NDVI image ratio sub analysis (Figures 6, 7 and 8) identified Behsud with the highest vegetation landcover, accounting for 57% of the total area in Behsud followed by Kandahar catchment areas (28%), Kandahar non-catchment areas (27%) and Jalalabad (12%). Furthermore, the study area of Behsud demonstrated the highest number (56%) of predetermined starting points intersecting the vegetation mask created, followed by Kandahar catchment areas (16%), Kandahar non-catchment areas (14%) and Jalalabad (9%).
Figure 6. Presence and absence of vegetation pixels in Kandahar. A: shown by the Normalized Difference Vegetation Index (NDVI); B: shown as a Boolean image.

Figure 7. Presence and absence of vegetation pixels in Jalalabad and Behsud. A: shown by the Normalized Difference Vegetation Index (NDVI); B: shown as a Boolean image.

Figure 8.

Spread of vegetation pixel counts per cluster for catchment and non-catchment areas in Kandahar, Jalalabad and Behsud. Box and whisker plot where the line dividing the middle of the shaded boxplot is the median of all data values in the range. The shaded box contains the interquartile range (IQR) and depicts the bottom 25% (dark grey) and top 25% (light grey). Data points contained within the lower and upper whiskers represent 1.5 times the minimum and maximum of the IQR. Data points beyond the whiskers represent outliers.
Discussion
When compared to facility-based survey methodologies conducted in similar regions, our cross-sectional household seroprevalence study, achieved with a relatively high proportion (78%) of our intended sample size in proximity to the designated starting points, reduced the likelihood of sampling bias. A previous facility-based serology survey conducted in Kandahar using blood samples from groups visiting a regional hospital for polio-unrelated minor ailments cited uncertainty in capturing the representativeness of the population, as the cohort indicated a higher immunization coverage than the national estimate (Hussain et al., 2018).
We found designing and implementing the GIS-based sampling approach was feasible and offers key benefits despite logistical challenges, lack of building footprint data, difficulties in discerning individual family dwellings due to the high density of structures, cultural sensitivities and security concerns encountered (Abimbola et al., 2013). Our methodology illustrates that with relatively inexpensive, culturally sensitive, and secure GIS techniques, teams can effectively navigate to randomly predetermined survey points in order to attain a more cross-sectional sample enrolment than is possible with facility-based surveys; however adapting trainings and data collection approaches to the logistical realities of each study setting is important. Where this study was carried out, there is a frequent lack of trust in vaccination campaigns run by government and international organizations emanating from religious misconceptions and misinformation, coupled with vaccination teams being direct targets of intimidation by armed groups (Norris et al., 2016). As such, several measures were put into place prior to the implementation of this study to promote security. First, meetings were organized with Union Council offices in Afghanistan and Pakistan (pilot study) to obtain support of local ethnic ‘Mohalla’ elders or village leaders, known to perform conflict resolution in large neighbourhoods and build trust among communities during data collection. Second, each data collection team was composed of male and female data collectors to help facilitate interactions, especially with female respondents.
Since our study employed a novel methodology, several unforeseen circumstances were reported by team supervisors and data collectors that may provide important insights for implementing similar studies successfully in the future. First, even though teams took several security precautions, the ongoing insecurity and hostility towards polio vaccination campaigns within the region (Kennedy et al., 2015) resulted in hesitancy among some team members while collecting data in the field. As a result, numerous submissions were finalized in the safety of vehicles provided for this study (thus capturing the coordinates there) rather than the location of the survey, leading to i) ODK points collected without Afghan households. In 2016, the district of Kandahar was comprised of 52% irrigated agricultural land in Kandahar province, while in the districts of Jalalabad and Behsud in the province of Nangahar, agricultural land constituted 29% and 23% of area, respectively (Nations, 2016). Based on the results derived from the sub-analyses using the NDVI image ratio and a landcover report conducted by the Food and Agriculture Organization (FAO), we found Behsud to have the highest (56%) percentage of predetermined points intersecting vegetation with the lowest percentage of built-up areas (5.04%), followed much lower by Kandahar catchment and Kandahar non-catchment areas (16% and 14% points intersecting vegetation with 5.29% built up areas) and Jalalabad (9% points intersecting vegetation and 59.38% built up areas). Subsequently, teams reportedly struggled with identifying households located within the 60 m search radius, especially in Behsud. These findings complement team performances demonstrated per study area with Behsud recording the lowest target (42%), followed with Kandahar non-catchment areas (64%), Kandahar catchment areas (74%) and Jalalabad (90%) (Nations, 2016). We also observed an increasing number of clusters with no submissions that corresponded to the vegetation spread extracted in the sub- analysis with Behsud having the highest number of clusters missed (4 of 4) followed by Kandahar (31 of 80, predominantly in the non-catchment area) (Figure 6 and 7). To counter this issue, masking agricultural lands from the constraining polygons prior to randomized point generation can be advantageous in ensuring a higher yield of enrolments. Remote sensing data has become increasingly available and can be used to acquire essential information such as land use and accurate mapping of urban areas (Zha 2003). Alternatively, the search distance radius can be increased. For example, if an area has lower densities of residential structures or is more commercial in nature, allowing teams more distance to search for potential households may improve enrolment.
Third, teams reported technical complications with ArcExplorer, the software used for navigating to each predetermined starting point. There were multiple instances in which the ArcExplorer software crashed, requiring a reboot intermittently. Based on feedback from users, deploying mobile map package file sizes fewer than 300 MB mitigated many of the issues encountered with ArcGIS Explorer crashing and is thus something that should be tested further. Furthermore, we recommend that pilot tests be conducted in proximity to the actual study location to best replicate the conditions in the survey area. Teams undergoing training did not encounter software crashes during the pilot tests conducted in Pakistan.
Fourth, considering the lack of trust in vaccination campaigns in some areas, mobilizing children toward vaccination points in areas with high refusal rates remains a major impediment to polio eradication efforts and continues to challenge frontline workers (Michael et al., 2014). Our study reported a total of 161 overt refusals for the survey across the study areas. However, establishing the exact geographic extent of these areas remains difficult as refusal data were erroneously recorded manually. On occasion, teams arrived in an area and were met by residents who indicated the team was unwelcome and should not visit any houses nearby. Given the security situation, this effectively functioned as a neighbourhood-level refusal, but still required teams to assess on the fly which random starting points might fall within the area of these residents and should be addressed in future studies. A major reason cited for a high rate of refusals in Afghanistan was the fear of being targeted by insurgent groups such as the Taliban, who view western aid and medical teams as threats to controlling the region. The Taliban have banned multiple house-to-house vaccination campaigns fearing vaccinators may “spy” on them ( Mohammad and Habibzada, 2020). Furthermore, polio is not necessarily perceived as a priority health concern as communities are often cutoff from essential basic services. We recommend increasing efforts to build awareness in targeted areas through frequent dialogues with religious leaders and local Taliban members to dispel myths and rumours around polio vaccination and to present polio eradication as a social good rather than a foreign agenda. Moreover, the polio program should be encouraged to continue to collaborate with other humanitarian organizations to offer a range of integrated health services in underserved communities to increase the uptake of vaccines. Team supervisors similarly proposed adding better-quality incentives for enrolled patients, particularly in lower socioeconomic communities as incentives are generally known to be drivers for improving enrolment rates.
Finally, we encountered difficulties in obtaining imagery covering the study area of Jalalabad and Behsud within the survey dates, i.e., February 25th, 2020, to March 19th, 2020, and conducted the analysis using imagery from April 2020 instead. Despite the challenges confronted, the type of methodology used in our analysis brings new light to improving capabilities of measuring immunization reach in polio endemic regions undergoing escalated armed conflict. Our study may offer a viable alternative to reduce sample biases for other facility-based seroprevalence approaches to assess population immunity in areas with high risk of poliovirus transmission (Initiative, 2010) thereby minimizing regions of undetected transmission. Furthermore, similar methodologies can be extended for multiple cVDPV outbreaks.
Conclusions
This study evaluates a novel GIS-based household seroprevalence sampling methodology employed to quantify levels of serological protection against poliovirus types 1, 2, and 3 in Afghanistan. We illustrate the application of inexpensive GIS methods coupled with a random sampling approach to target a more representative population for identifying under-vaccinated communities. Moreover, our study provides a framework that can be extended to similar regions with difficulties in assessing the quality of polio campaigns, ultimately assisting with interruption of cVDPV transmission and prevention of importation to polio-free countries.
Acknowledgments:
We acknowledge Aga Khan University (AKU) Pakistan and Kabul, French Medical Institute (FMIC) Kabul and Care of Afghan Families (CAF), the Centers for Disease Control and Prevention (CDC) and the provincial health directors in Kandahar and Nangahar for jointly implementing this study. We also wish to acknowledge Dr. Asef Ghyasi, Shahid Khan and Khalid Feroze for their guidance through the conceptualization of this project and for facilitating aspects of data collection.
Footnotes
Conflict of interest: The Authors declare no conflict of interest.
Disclaimers: The findings and conclusions in this report are those of the authors and do not necessarily represent the official position of the Centers for Disease Control and Prevention. Use of trade names and commercial sources is for identification only and does not imply endorsement by the Centers for Disease Control and Prevention, the Public Health Service, or the U.S. Department of Health and Human Services.
References
- Abimbola S, Malik AU, Mansoor GF, 2013. The final push for polio eradication: addressing the challenge of violence in Afghanistan, Pakistan, and Nigeria. PLoS Med 10,e1001529. [DOI] [PMC free article] [PubMed] [Google Scholar]
- CDC, 2019. Global Immunization. Available: https://www.cdc.gov/polio/what-is-polio/hcp.html [Accessed 1/29/2021 2021].
- Chen P, Liu Y, Wang H, Liu G, Lin X, Zhang W, Ji F, Xu Q, Tao Z, Xu A, Schaffner DW, 2020. Environmental Surveillance Complements Case-Based Surveillance of Acute Flaccid Paralysis in Polio Endgame Strategy 2019–2023. Appl Environ Microbiol 86:e00702–20. [DOI] [PMC free article] [PubMed] [Google Scholar]
- Cousins S, 2021. Polio in Afghanistan: a changing landscape. Lancet 397: 84–85. [DOI] [PubMed] [Google Scholar]
- GPEI, 2019. Polio endgame strategy 2019–2023, eradication, intergration, certification and containment. World Health Organization (WHO). [Google Scholar]
- Hussain I, Mach O, Hamid NA, Bhatti ZS, Moore DD, Oberste MS. Khan S, Khan H, Weldon WC, Sutter RW, Bhutta ZA, Soofi SB. 2018. Seroprevalence of anti-polio antibodies in children from polio high risk area of Afghanistan: A cross sectional survey 2017. Vaccine 36,1921–1924. [DOI] [PMC free article] [PubMed] [Google Scholar]
- Initiative, G. P. E. 2010. Global polio eradication initiative, Strategic Plan 2010–2012. World Health Organization [Google Scholar]
- Kalkowska DA, Tebbens RJD, Pallansch MA, Thompson KM. 2019. Modeling undetected live poliovirus circulation after apparent interruption of transmission: Pakistan and Afghanistan. Risk Anal, 39,402–413. [DOI] [PMC free article] [PubMed] [Google Scholar]
- Kennedy J, Mckee M, King L. 2015. Islamist insurgency and the war against polio: a cross-national analysis of the political determinants of polio. Global Health, 11,40. [DOI] [PMC free article] [PubMed] [Google Scholar]
- Kuehn B 2019. Poliovirus type 3 is eradicated. JAMA, 322,2276–2276. [DOI] [PubMed] [Google Scholar]
- Martinez M, Akbar IE, Wadood MZ, Shukla H, Jorba J,Ehrhardt D, 2020. Progress Toward Poliomyelitis Eradication — Afghanistan, January 2019–July 2020. MMWR - Morb Mortal Wkly Rep. 69:1464–1468. [DOI] [PMC free article] [PubMed] [Google Scholar]
- Michael CA, Ogbuanu IU, Storms AD, Ohuabunwo CJ, Corkum M, Ashenafi S, Achari P, Biya O, Nguku P, Mahoney F; NSTOP OPV Refusal Study Team, 2014. An assessment of the reasons for oral poliovirus vaccine refusals in northern Nigeria. J Infect Dis 210, S125–30. [DOI] [PMC free article] [PubMed] [Google Scholar]
- Nations, F. O. O. T. U. 2016. The Islamic Republic of Afghanistan: Land Cover Atlas. (https://landportal.org/node/50631). [Google Scholar]
- Mohammad N, Habibzada M. 2020. Polio remains threat in militant-hit areas of Afghanistan and Pakistan. Voice of America, January 24, 2020. [Google Scholar]
- Norris A, Hachey K, Curtis A, Bourdeaux M. 2016. Crippling violence: conflict and incident polio in Afghanistan. PLoS One 11,e0149074. [DOI] [PMC free article] [PubMed] [Google Scholar]
- Opare JKL, Odoom JK, Akweongo P, Afari EA, Pappoe M. 2019. Poliovirus antibody levels and lameness among individuals in three regions of Ghana. Human Vacci Immunotherapeut 15,2050–2059. [DOI] [PMC free article] [PubMed] [Google Scholar]
- Shimabukuro T, Estivariz CF, Gelles RL. 2021. Poliomyelitis [Online]. Centers for Disease Control and Prevention. Available: https://www.cdc.gov/vaccines/pubs/pinkbook/index.html [Accessed 8/25/2021 2021].
- Verma AA, Jimenez MP, Tangermann RH, Subramanian SV, Razak F. 2018. Insecurity, polio vaccination rates, and polio incidence in northwest Pakistan. Proc Natl Acad Sci USA, 115,1593–1598. [DOI] [PMC free article] [PubMed] [Google Scholar]
- WHO. 2017. Poliomyelitis: Vaccine derived polio [Online]. World Health Organization; [Accessed 1/28/2020 2020]. [Google Scholar]
- WHO. 2018. Polio Eradication Initiative [Online]. WHO. Available: http://www.emro.who.int/afg/programmes/polio-eradication-initiative.html [Accessed 1/29/2021 2021]. [Google Scholar]
- Zha Y, Gao J, Ni SY, 2003. Use of normalized difference built-up index in automatically mapping urban areas from TM imagery. Int J Remote Sens 24,583–594. [Google Scholar]