Abstract
Uneven of filling aggregate gradation may cause transportation problems such as pipe blockage due to segregation and stratification of filling slurry. To study the influence of aggregate gradation on the conveying performance of filler slurry, aggregate gradation experiments were carried out, rheological tests on slurries with coal gangue/aeolian sand ratios (6:4, 5:5 and 4:6) showed that appropriately increasing the proportion of aeolian sand can improve particle gradation. Computational fluid dynamics (CFD) scheme was used to simulate the pipeline transportation characteristics of the slurry under the conditions of three sets each of coal gangue/aeolian sand ratios, slurry concentrations (72%,74% and 76%), and inlet velocities (1.15,1.24 and 1.33 m/s). The results show that the pipeline resistance loss is directly proportional to the slurry concentration and inlet velocity, and inversely proportional to the coal gangue/aeolian sand, which indicates that the proportion of aeolian sand should be reduced in filling project to reduce the pipeline transportation resistance.
Keywords: Coal gangue, Aeolian sand, Aggregate gradation, Filler slurry, Pipeline transportation
Subject terms: Engineering, Materials science
Introduction
As a green mining technology, coal mine paste filling can effectively reduce surface subsidence and solid waste accumulation1. Filling slurry is prepared by mixing the filling aggregate, cementitious material, water, and admixtures. The choice of filling aggregate is adapted to the local conditions, and coal gangue is commonly mixed with fly ash, construction waste, etc. to make filling aggregates. However, fly ash and construction waste have high processing costs and cannot be the only source of filling aggregates. Aeolian Sand is a layer of sand accumulated by the wind, with a small particle size. If it can be used as a filling aggregate with coal gangue, not only is the cost low, but it can also reduce environmental pollution and other problems, which is in line with the concept of green mining resource development2. The conveying performance of filling slurry is one of the key technologies in coal mine paste filling technology, the different physical and chemical properties and particle gradation of the aggregate are important factors affecting the conveying performance of the filler slurry. When the material is mixed unevenly and the gradation is inadequate, slurry segregation and stratification will cause a series of transportation problems such as pipe blockage, which not only increases the filling cost but also affects production safety3–5. Therefore, to improve the conveying performance of filler slurry, it is necessary to study the internal relationship between aggregate particle size gradation and flow characteristics to provide theoretical guidance for the safe and efficient transportation of filler slurry to the underground working surface.
Many studies were first conducted in the field of concrete on the influence of aggregate gradation on conveying performance6,7. Geiker et al.8 found that as the volume fraction of coarse aggregate increases, the yield stress and viscosity of concrete significantly increase. Cook et al.9 found that, the coarse sand volume of the combined gradation was shown to not only impact surface finish ability but influence the cohesion within the mixture, which leads to segregation and edge slumping. The fine sand volume contributes to allowing the concrete to have a smooth surface finish and to properly consolidate the concrete through vibration, but deficient fine sand volume promotes segregation and excessive fine sand volume reduces workability. Huang et al.10 found that using high carbon chromium iron slag instead of natural aggregates can significantly improve the performance of concrete. Bale et al.11 used the water hardening simulation software VCCTL to simulate and verify that coal gangue with a gradation index of 0.35 can improve the hydration degree of the filling material and make it have good mechanical parameters. Wen et al.12 studied the correlation between the particle size gradation and the rheological properties of the slurry using waste rock and rod scrubbing as mixed aggregates and found that the yield stress and viscosity of the slurry are highly correlated with the aggregate particle size gradation. Wang et al.13 showed that adding an appropriate amount of effective fine particles to the filler slurry not only improves the fluidity of the slurry, but also increases the stability of the slurry and reduces the amount of dehydration of the filler slurry in the stope. Su et al.14 found through experiments that as the proportion of particles with a diameter less than 0.075mm in iron tailings decreases, the consistency of the mortar increases and the water retention rate decreases. The above scholars have studied the influence of aggregate particle size on the fluidity of filler slurry through experimental methods such as slump and rheometer. However, in an actual filling system, the transportation of slurry is mostly through pipelines. It is impossible to accurately express the flow state of a slurry when it is transported in a pipeline.
Owing to the rapid development of computer technology, the application of fluid dynamics software can realize the dynamic simulation of pipeline transportation. Currently, the most comprehensive numerical simulation software for studying the characteristics of pipeline transportation is the Fluent software. Many scholars have attempted to numerically simulate paste-filling pipeline transportation. Kang et al.15 analyzed and compared several factors affecting pipeline pressure loss based on the principle of minimizing pressure loss during the transportation of full tailings slurry in an L-shaped pipeline at a certain iron mine in Tangshan. Based on this, they conducted structural optimization analysis and research. Gan et al.16 used Fluent software to numerically analyze the resistance loss of L-shaped bends under different conditions, and obtained the optimal values for pipeline diameter length and slurry mass concentration. Liu et al.17 considered the influence of the hydration effect to study the flow characteristics of the slurry in a two-dimensional pipeline, but only analyzed two particle sizes (50 μm and 200 μm) and did not consider the influence of the aggregate particle size gradation.
In summary, in the field of concrete or mine filling, most single materials such as waste rock, coal gangue, and tailings are used as filling aggregates, and their conveying performance varies greatly. There are few reports on the transportation characteristics of aggregate graded filling slurry using coal gangue and aeolian sand as two types of waste. This study first determined the ratio range and particle size distribution of the mixed aggregate (coal gangue/aeolian sand) through the grading coefficient,
In summary, in the field of concrete or mine filling, most single materials such as waste rock, coal gangue, and tailings are used as filling aggregates, and their conveying performance varies greatly. There are few reports on the transportation characteristics of aggregate graded filling slurry using coal gangue and aeolian sand as two types of waste. This study first determines the ratio range and particle size distribution of mixed aggregates (coal gangue/aeolian sand) through the gradation coefficient. Through rheological experiments and Fluent numerical simulation methods. Use Design Expert 11 software to analyze the significant impact and interaction between various factors using response surface methodology. the study investigates the influence of coal gangue aeolian sand aggregate gradation on the filling and transportation performance of coal mine paste, providing technical support for the application of paste filling mining in mines.
Materials and methods
Materials and particle size gradation
The cementing material used was PO42.5 ordinary Portland cement. Fly ash comes from Huangdao Power Plant in Shandong, China, with a grade of I and high volcanic ash activity. and the aggregate was filled with coal gangue and aeolian sand. Its main chemical composition and physical properties are listed in Table 1. The main chemical composition was SiO2, and the packing density of both was greater than 50%.
Table 1.
Physical and chemical properties of coal gangue, aeolian sand and fly ash.
| Aggregate | SiO2 | Al2O3 | Fe2O3 | CaO | MgO | others | Bulk density t/m3 |
|---|---|---|---|---|---|---|---|
| Gangue | 53.21 | 18.95 | 4.32 | 2.36 | 1.42 | 19.74 | 1.48 |
| Aeolian sand | 76.73 | 3.77 | 3.01 | 2.47 | 0.48 | 13.54 | 1.32 |
| Fly ash | 53.94 | 30.91 | 2.38 | 6.53 | 0.92 | 4.90 | 0.75 |
Test plan
Firstly, through testing and analysis of the granularity of gangue and aeolian sand, determine the scope of mixed aggregate (gangue/aeolian sand). Secondly, according to the filling parameters of the Yizhuang Coal Mine, keep the cement: fly ash: mixed aggregate = 1:3:4 unchanged, setting the concentration of the slurry is 72–76%, and change the proportion of gangue/aeolian sand (hereinafter referred to as G/A) according to the results of the level. Then, the current variation experiments are performed, and the EBT2 new mixing concrete flowers manufactured by Jerbinage company in Germany are determined to measure the flow parameters of different agglomerations of mixed aggregate. (Relatively yield stress and plastic viscosity). Finally, use numerical simulation to explore the influence of aggregate gradation pairing filling pulp conveying performance.
-
Bulk density test
This experiment uses the volumetric method to test the bulk density of aggregates. Add the aggregate in batches into the container and record the changes in particle mass and container volume for each batch. When the material particles reach a stacked state, stop adding and record the container volume at this time. The bulk density can be obtained by dividing the mass of material particles in the container by the container volume.
-
Rheological parameters test
The rheological experiment was divided into three steps: In the first step, 900 g slurry of different concentrations was prepared in a basin, stirred for about 5 min until uniform, and poured into a 500 ml beaker, and the slurry was immersed in the stirring rotor. In the second step, the prepared slurry was placed under the rheometer and pre-cut 60 s at the impeller speed of about 0.2 rev./s (speed I). In the third step, the impeller stops turning for 30 s and the side of the container is gently tapped 10 times with a mallet. The shear rate increases from 0 to 1(RPM/s) in 120 s, followed by a deceleration from 1 to 0(RPM/s) in another 120 s, and finally, the yield stress and viscosity are measured.
A large amount of experimental data proves that the rheological model of the filler slurry can be regarded as a Bingham body18–21. Because the filler slurry is a complex heterogeneous system, it is difficult to accurately obtain its rheological parameters; therefore, according to the relationship of T-N, it can be converted into the shear stress τ and shear rate γ of the Bingham body, and formula (1) is obtained.
1 In the formula: T is the torque, Nm; g is the relative yield stress, Nm; h is the relative plastic viscosity coefficient, Ns; N is the rotational speed, m/s.
Numerical simulation and modeling
-
Pipeline flow rate analysis
A simplified three-dimensional pipe bending model was established using the SolidWorks software. First, we imported the model into Mesh and performed mesh division, and then imported the mesh model into Fluent. The filling pipe elbow model is shown in Fig. 1. The inner diameter of the pipe is 0.2m, the radius of curvature is 0.5m, and the filling multiple is 2.87.
According to the current filling capacities of 130, 140, and 150 m3/h in Daizhuang Mine, the average flow velocity (which was set as the inlet velocity of the slurry) calculated using formula (2), was 1.15 m/s, 1.24 m/s, and 1.33 m/s respectively. The slurry density was 1900kg/m3. According to the Reynolds number formula (3), the slurry flowing in the pipeline was laminar. The boundary conditions were set as the velocity inlet, pressure outlet, and absolute pressure at the inlet and outlet positions as one standard atmosphere. The acceleration of gravity was 9.81m/s2, the relative pressure at the outlet position was set to 0, and the calculated inlet pressure is the resistance loss of the pipeline conveying slurry. The specific settings of these parameters are listed in Table 2.
where v is the slurry flow rate, m/s, Q is the filling capacity, m3/h, r is the pipe radius, m.
2
where ρ is the slurry density, kg/m3, v is the slurry flow rate, m/s; d is the pipe diameter, m; μ is the viscosity coefficient, kg/m s−1.
3 -
Resistance loss analysis
This study analyzed the resistance loss using Design Expert 11 software to obtain regression models for each factor, and determined the significant impact of each factor on pipeline resistance loss based on the F-value. Response surface methodology is a statistical method for comprehensive experimental design. By establishing a response surface model, the interaction between various factors can be analyzed intuitively, providing suggestions for engineering.
Fig. 1.
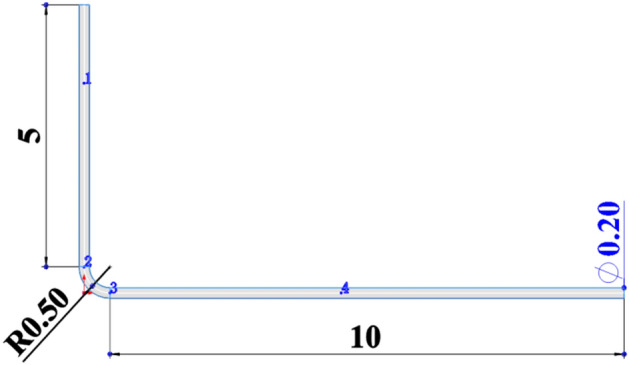
Filling pipeline model diagram.
Table 2.
Parameter settings in numerical simulation.
| Parameter setting | Type | |
|---|---|---|
| Solve settings | Model | Laminar flow |
| Medium | fluid | |
| Program | simple | |
| Boundary conditions | Entrance | Velocity-inlet |
| Export | Pressure-outlet | |
Results and discussion
Analysis of aggregate gradation test results
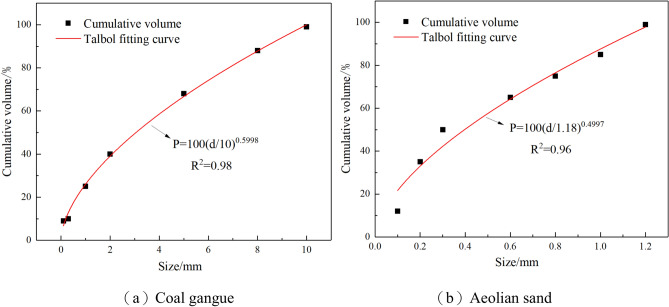
Coal gangue underwent secondary crushing, and its particle size was less than 10 mm. The particle size gradation of coal gangue and aeolian sand was analyzed, and the Talbol formula (formula (4)) was used for fitting22. The results of the particle size distribution curve are shown in Fig. 2.
 |
4 |
where Px is the passing percentage of a certain aggregate particle size d, D is the maximum particle size of the aggregate, mm, and n is the gradation decline coefficient. When n = 0.5, the curve is a Fuller curve.
Fig. 2.
Particle size distribution curve.
It was found that the coal gangue Talbol gradation index was n = 0.5998, indicating that the content of coal gangue coarse aggregate was higher, and it was necessary to add fine aggregate to improve the particle gradation. The Talbol gradation index of aeolian sand is n = 0.4977, which is very close to the Fuller ideal gradation. However, as a fine aggregate, aeolian sand has a relatively regular particle shape and smooth surface, which makes it difficult to form a large skeleton structure. Moreover, its specific surface area is large, and a considerable amount of cement is required to complete it. Therefore, in practical applications, appropriate coarse aggregate should be added to form an interlocking skeleton structure.
From the above analysis, it follows that coal gangue and aeolian sand cannot be used as a single aggregate and must be mixed and matched to improve the gradation and increase the density of the accumulation. The packing density of the aggregate can characterize its gap-filling effect. In order to explore the best mixing ratio of coal gangue and aeolian sand, the ratio of 11 sets of different coal gangue and wind chip sand was designed, and its accumulation density was tested. The results were shown in Fig. 3. According to Fig. 3 when coal gangue accounts for more than 60%of the mixed aggregate, the accumulation density begins to decline gradually. According to the maximum principle of accumulation density, and the aeolian sand accumulation sand can be made full use, the G/A is determined that G/A is 6:4, 5:5, 4:6.
Fig. 3.
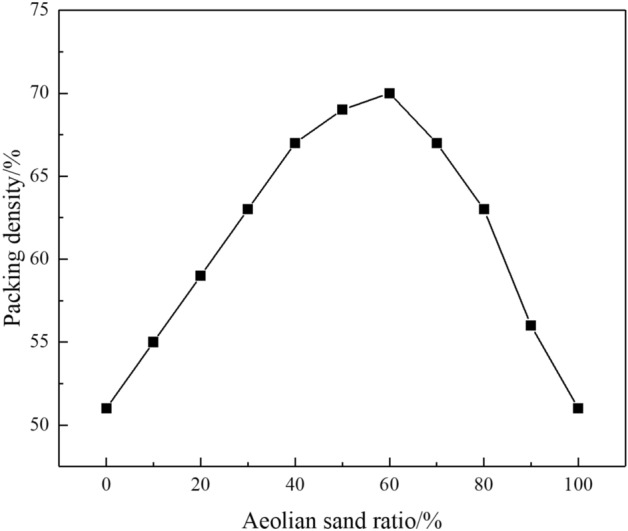
The density curve of mixed aggregates with different proportions.
According to formula (5) and formula (6), the characteristic value of particle size gradation of each ratio was calculated, as shown in Table 3, when the non-uniformity coefficient Cu > 5 and the curvature coefficient Cc = 1–3, the gradation is good23.
 |
5 |
 |
6 |
where d10, d30, and d60 are the corresponding particle sizes when the content under the sieve is smaller than a certain particle size divided into 10%, 30%, and 60%, mm.
Table 3.
Characteristic values of particle size gradation of mixed aggregates with different proportions.
| G/A | d10/mm | d30/mm | d60/mm | Inhomogeneity coefficient Cu | Curvature coefficient Cc |
|---|---|---|---|---|---|
| 6:4 | 0.19 | 0.83 | 4.27 | 22.47 | 0.85 |
| 5:5 | 0.16 | 0.78 | 3.63 | 24.20 | 1.05 |
| 4:6 | 0.14 | 0.73 | 2.85 | 20.36 | 1.34 |
Flowing test results analysis
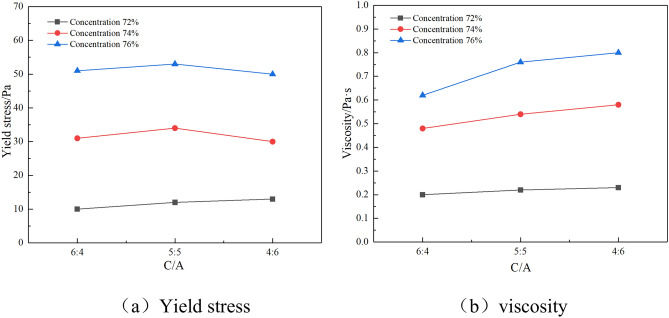
Flow characteristics curves of filling slurry in Under the conditions of Different concentrations and G/A are shown in Fig. 4. The discharge characteristics of the slurry flow under each condition are similar, and the shear stress increases with the increase of the shear rate, which is in line with the characteristics of Binham body. According to the linear fitting results, the slope of the fit line represents viscosity, and the intercept of the y axis indicates yield stress. Under the same quality concentration, as the proportion of aeolian sand increases, the viscosity of the filling slurry increases, and the yield stress increases at a low concentration. The increase in proportion has a small decline at the 74% and 76% concentration. To see the relationship between the two, the slurry viscosity is made with the slope and intercept of Fig. 4 linear fitting, as shown in Fig. 5.
Fig.4.
Slurry rheological characteristic curves under different mass concentrations.
Fig. 5.
The relationship between the relationship between stress, viscosity and G/A.
As shown in Fig. 5, under the same G/A condition, the yield stress and viscosity both increase with the increase of mass concentration. When the slurry concentration is 72%, due to the low concentration of slurry, the frictional force between the slurry particles is small, resulting in lower yield stress and viscosity under the three G/A conditions. When the slurry concentration reaches 74%, there is a slight increase in the yield stress and viscosity of the slurry. When the slurry concentration reaches 76%, the free water content decreases, and the friction between the slurry particles is high. As a fine aggregate, windblown sand consumes a large amount of water due to its relatively large surface area, and the rheological parameters are at their maximum at this time.
Under the same mass concentration conditions, the viscosity of the slurry is generally positively correlated with G/A, with a maximum increase of 29% in viscosity. The yield stress varies greatly, with a trend of first increasing and then slightly decreasing as the proportion of aeolian sand increases between 74 and 76%, with a maximum decrease of 12%. At three different concentrations, the relative yield stress of the slurry with a G/A ratio of 4:6 shows a more significant trend. When the G/A ratio is 4:6, under the binding effect of cement and fly ash, high proportion and fine-grained aeolian sand adsorbs with large-sized coal gangue, but due to the non-hydrophilicity of aeolian sand, its required free water content decreases. This indicates that under high concentration conditions, the proportion of fine aggregate aeolian sand is higher than that of coarse aggregate coal gangue, which will optimize the grading of the mixed aggregate and improve the conveying performance of the slurry. In summary, it can be explained that the concentration and mixed aggregate ratio also affect the filling parameters of the filling slurry, indicating that the appropriate increase of fine particles can achieve the effect of improving the grade to reduce the risk of blocking the slurry pipeline.
Analysis of numerical simulation results
Pipeline flow rate analysis
By simulating the slurry transportation under each set of ratios, it was found that the flow velocity distribution of the slurry in the pipeline under different conditions was consistent, and there was an obvious velocity gradient, which was manifested in the difference in velocity, the speed distribution of the pipeline is shown in Fig. 6. Owing to the effect of gravity, the flow velocity of the vertical section gradually increased from the initial velocity, and there was stratified flow in the pipeline. The flow was faster with increasing proximity to the center of the pipeline, and it was slower with increasing proximity to the pipe wall. The flow outside the elbow is greater than inside the elbow. Moreover, the flow is unstable when it enters the horizontal section. After a period of greater speed at the bottom of the pipe, the flow tended to be stable.
Fig. 6.
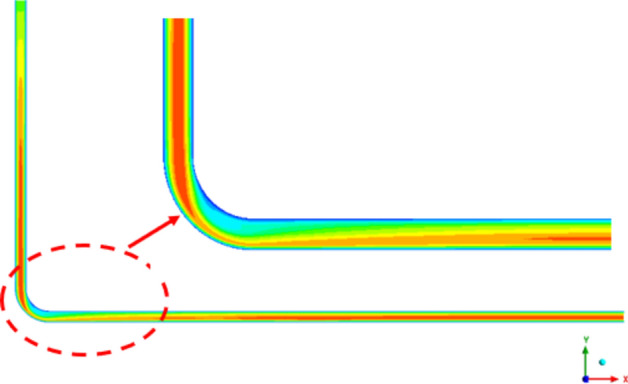
Pipeline velocity distribution diagram.
Taking the cross-section X = 10m as an example, different G/A ratios, concentrations, and inlet velocities affect the velocity distribution of the slurry in the pipeline, as shown in Figs.7, 8, 9.
Fig. 7.
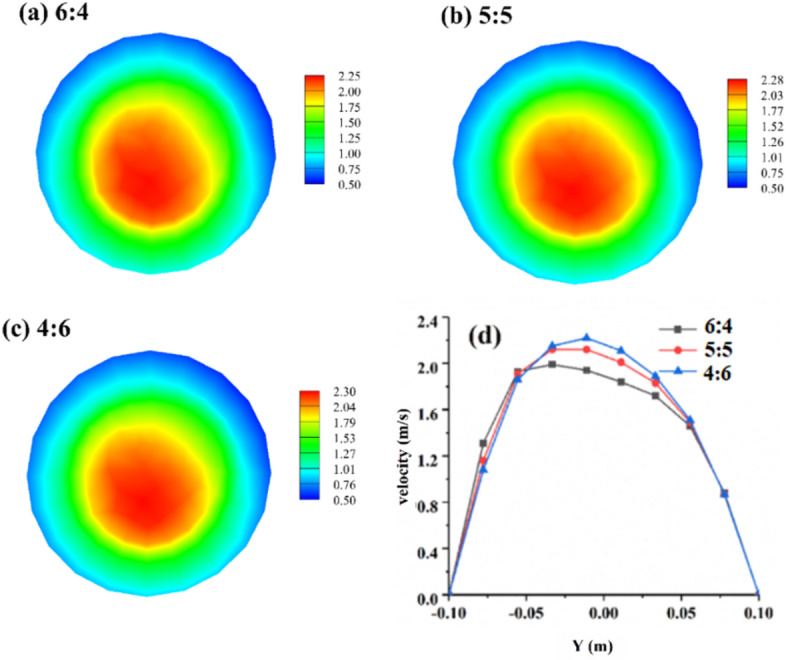
The velocity distribution of the pipe section with different G/A ratios when the slurry concentration is 76% and the inlet velocity is 1.33 m/s.
Fig. 8.
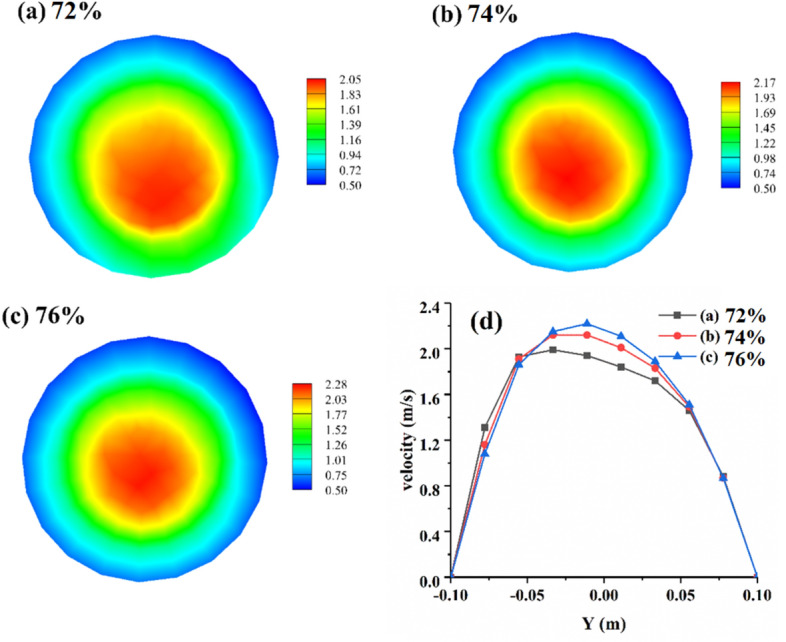
The velocity distribution of different concentrations of the pipe section when the G/A ratio is 4:6 and the inlet velocity is 1.24 m/s.
Fig. 9.
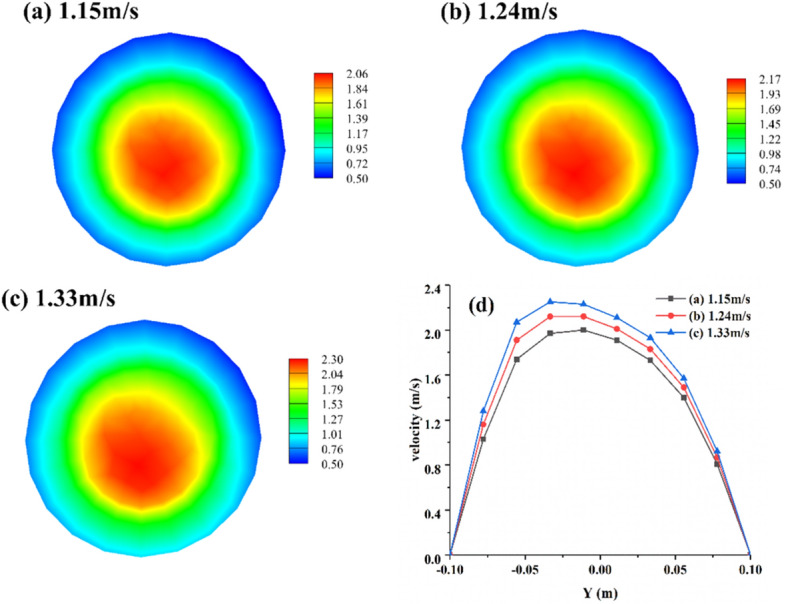
The velocity distribution of the pipe section at different inlet velocities when the slurry concentration is 76% and the G/A ratio is 4:6
Figure 7 is the effect of different G/A ratio on the speed distribution of pipeline section. From Fig. 7a–c, it can be seen that the speed distribution of the G/A ratio is 6:4, 5:5, 4:6 is basically the same consistently. All present the center of the center to the tube wall gradually becoming smaller. Figure 7d shows the speed differences on the y-axis of different G/A ratios on the y-axis of the section X = 10 m. Compared with G/A = 6:4, the maximum flow rate in the pipeline has increased by only 1.3%, which has no obvious impact on the speed of the slurry in the pipeline.
Figure 8 is the effect of different concentrations on the speed distribution of pipeline section. Among them, the concentration of 74% is thinner and low viscosity. Under the action of gravity, its speed is distributed asymmetric on the Y axis. The concentration of 76% and the concentration of 78% consistently distributed, manifested as the highest speed of the center of the pipeline, and gradually reduced the speed gradient to the wall of the pipe. From Fig. 8d, the flow velocity of the slurry pipeline gradually increases with the increase of quality concentration. Compared with 74%, the maximum flow rate in the pipeline has increased by 11.2%, indicating that different concentrations have a significant effect on the speed distribution in the pipeline.
Figure 9 is the effect of different entry speeds on the section speed distribution of the pipeline. From Fig. 9a–c, it can be seen that on the vertical axis of the section X = 10 m, the three different entrance speeds are consistent with the distribution of pulp flow rate. Both are symmetrical. Figure 9d can intuitively see that due to the gravity effect, the maximum speed is on the Y axis, indicating that the flow rate of the slurry pipeline gradually increases with the increase of the flow rate. Compared with the inlet flow rate of 1.15 m/s, the maximum flow rate in the pipeline has increased by 11.7%, indicating that different inlet speeds have significant effects on the flow rate distribution in the pipeline.
Resistance loss analysis
To explore the influence of slurry concentration, inlet velocity, and aeolian sand ratio on pipeline resistance, Design-Expert 11 software was used to analyze the interaction of the three factors on pipeline resistance, and the regression model’s variance analysis results are shown in Table 4. The regression model was highly significant as indicated by its P value (P < 0.0001); the P value indicated that the regression model had a high degree of fit. According to the P value of the three factors, all less than 0.0001, all three had a significant impact on the pipe transportation resistance. From the F value, it is clear that the degree of influence of concentration was higher than that of the inlet velocity, which in turn had more influence than the G/A ratio.
Table 4.
Analysis of variance of polynomial model of pipeline resistance loss.
| Source | Sum of square | df | Root mean square | F | P |
|---|---|---|---|---|---|
| Model | 2.193E+08 | 9 | 2.437E+07 | 1793.46 | < 0.0001 |
| A-Aeolian sand | 5.635E+06 | 1 | 5.635E+06 | 414.77 | < 0.0001 |
| B-Concentration | 1.957E+08 | 1 | 1.957E+08 | 14,403.07 | < 0.0001 |
| C-Inlet velocity | 8.744E+06 | 1 | 8.744E+06 | 643.59 | < 0.0001 |
| AB | 1.086E+06 | 1 | 1.086E+06 | 79.95 | < 0.0001 |
| AC | 30,680.12 | 1 | 30,680.12 | 2.26 | 0.1713 |
| BC | 1.180E+06 | 1 | 1.180E+06 | 86.86 | < 0.0001 |
| A2 | 15,077.67 | 1 | 15,077.67 | 1.11 | 0.3229 |
| B2 | 3.662E+06 | 1 | 3.662E+06 | 269.57 | < 0.0001 |
| C2 | 15,421.20 | 1 | 15,421.20 | 1.14 | 0.3178 |
| Residual | 1.087E+05 | 8 | 13,586.19 | – | – |
| Lack of fit | 84,004.40 | 5 | 16,800.88 | 2.04 | 0.2955 |
| Error | 24,685.12 | 3 | 8228.37 | – | – |
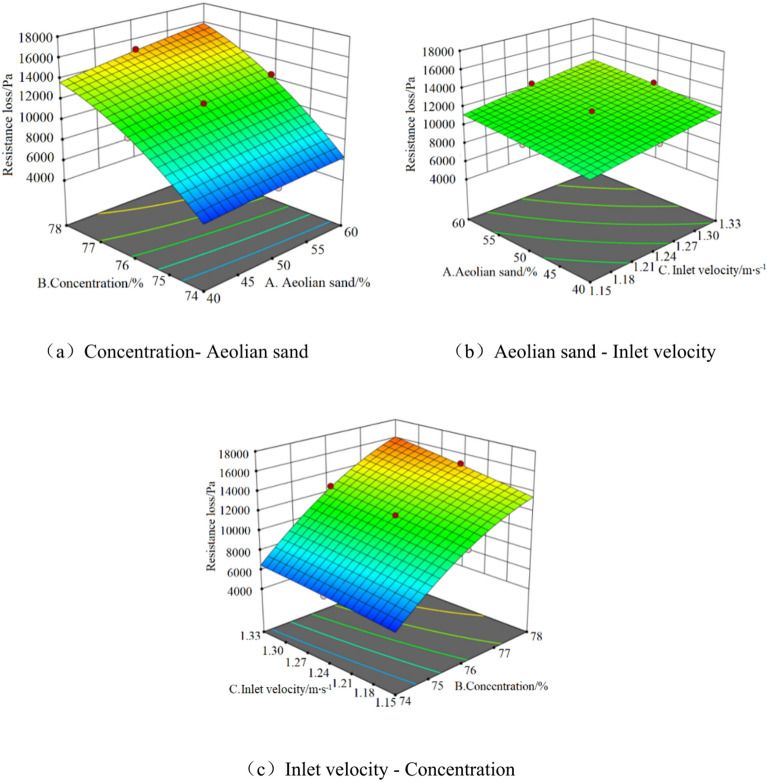
Figure 10 shows the impact of the interaction of three factors on pipeline transport resistance. Figure 10a clearly indicates that the response surface between mass concentration and aeolian sand ratio is steep, indicating a strong interaction between mass concentration and aeolian sand. When the proportion of aeolian sand remains constant, the concentration increases and the pipeline resistance loss significantly increases. Under the same concentration conditions, the pipeline resistance loss of mud increases with the proportion of aeolian sand, but the increase rate is very small. When both the mass concentration and the proportion of aeolian sand reach their maximum, the pipeline resistance loss is the greatest. The particle clusters formed by fine particles require more water, but higher mass concentrations result in lower free water content, which can have adverse effects on pipeline transportation. Therefore, at higher quality concentrations, the proportion of aeolian sand should be reduced, and at lower quality concentrations, the impact of the proportion of aeolian sand is relatively small.
Fig. 10.
Interaction effect of concentration, aeolian sand ratio and inlet velocity on pipeline resistance loss.
Figure 10b shows that the response surface between the proportion of aeolian sand and inlet velocity is the smoothest, indicating that the interaction between the proportion of aeolian sand and inlet velocity has little effect on pipeline resistance loss. This may be due to the non-hydrophilicity of aeolian sand, and the sand particles quickly lose their structural and load-bearing capacity when exposed to water, resulting in poor water stability. The inlet velocity has little effect on the proportion of aeolian sand.
Figure 10c shows that the response surface between inlet velocity and mass concentration is steepest, indicating the strongest interaction between inlet velocity and mass concentration. When the inlet velocity remains constant, the pipeline resistance loss of the slurry increases sharply with the increase of concentration. At a constant concentration, when the inlet velocity increases, the pipeline resistance loss also increases, but the increase is greater. The higher the concentration of the same material, the lower the free water content, and the higher the yield stress and viscosity of the slurry. In addition, the larger the capacity of the filling system, the higher the flow rate of the slurry, and the greater the resistance loss of the filling slurry during transportation. Therefore, in actual slurry pipeline transportation, a reasonable slurry filling system capacity should be controlled.
Discussion
From the influence of the G/A ratio on pipeline resistance loss, it is evident that the higher the proportion of aeolian sand, the greater the pipeline resistance loss. However, when the proportion of coal gangue is relatively high, the gradation is relatively poor, and the aggregate mixing is not uniform. Moreover, according to Fig. 6, the viscosity of the slurry with more coarse aggregates is lower, which also causes the slurry to segregate and increase drainage cost. Therefore, a reasonable aggregate gradation should be controlled so that the slurry simultaneously meets the characteristics of small pipeline resistance loss and anti-segregation at the same time.
The lower the concentration, the smaller the pipeline resistance loss; however, a very low concentration is not conducive to the strength of the filling body. The roof support of the filling body directly affects the filling process. Therefore, the concentration of the filler slurry must not only meet the strength requirements of the filler, but also ensure the safety of pipeline transportation.
Reducing the inlet velocity is conducive to reducing the resistance loss of the pipeline. Reducing the velocity means increasing the inner diameter of the pipeline or reducing the capacity of the filling system, but doing so would increase the filling cost. Therefore, an ideal speed needs to be controlled to maintain a balance between economic and technical requirements.
Conclusion
The rheological properties of the filler slurries with different aggregate ratios were characterized by rheological tests, and the transport characteristics of the filling pipeline were numerically simulated using experimental data. The main conclusions are as follows:
The aggregate gradation and concentration had a significant influence on the fluidity of the slurry. When the ratio of G/A was kept constant, with the increase of slurry concentration, the relative yield stress and viscosity coefficient both increased in different degrees. At constant concentration, as the G/A ratio decreased, the proportion of aeolian sand in the mixed aggregate increased, and the relative plastic viscosity coefficient gradually increased. When the proportion of aeolian sand was higher than that of coal gangue, the relative shear stress first decreased and then increased, indicating that an appropriate increase in the content of fine particles is beneficial for improving the particle gradation.
The pipeline flow velocity distributions under different G/A ratios, concentrations, and inlet velocities were consistent, and there were obvious velocity gradients. Regarding the influence of different G/A ratios, concentrations, and inlet velocities on the pipeline flow rate, it was found that the G/A ratio had no obvious influence on the pipeline flow rate, and the concentration and inlet velocity had a significant influence on the pipeline flow rate.
The analysis of variance was conducted on the three factors that affect the pipeline resistance loss, and it was concluded that all three factors had a significant impact on the pipeline resistance loss. The degree of influence was highest for concentration, lower for inlet velocity, and lowest for aeolian sand ratio. This shows that in actual engineering, the slurry concentration, filling capacity, and particle gradation of aggregates directly affect the transport performance of the filling pipeline.
Author contributions
Bo Liu: Funding acquisition, Resources, Writing–review & editing.Yaoping Zhang: Writing–original draft, Visualization, Methodology, Formal analysis, Data curation, Conceptualization. Shixing Yang: Conceptualization, Project administration, Supervision, Writing–review & editing.
Data availability
The data presented in this study are available on request from the corresponding author. The data are not publicly available due to patent application issues.
Declartions
Competing interests
The authors declare no competing interests.
Footnotes
Publisher’s note
Springer Nature remains neutral with regard to jurisdictional claims in published maps and institutional affiliations.
References
- 1.Gao, M. K. Science discussion on the current status and future development of coal mine filling mining technology. Energy Energy Conserv.06, 1–5. 10.16643/j.cnki.14-1360/td.2024.06.070 (2024). [Google Scholar]
- 2.Qin, W., Xu, J. L., Xuan, D. Y., Ju, J. F. & Chen, X. J. Research on technology and economic evaluation of coal mine green mining. J. Mining Saf. Eng.5, 1092–1101. 10.13545/j.cnki.jmse.2023.0293 (2023). [Google Scholar]
- 3.Cheng, H. Y., Wu, S. C., Zhang, X. Q. & Wu, A. X. Effect of particle gradation characteristics on yield stress of cemented paste backfill. Int. J. Miner. Metall. Mater.27(1), 10–17. 10.1007/s12613-019-1865-y (2020). [Google Scholar]
- 4.Chen, G. Z., Li, C. P., Ruan, Z. E. & Hou, H. Z. Influence of flocculation conditions on floc structure and solid-liquid separation in cemented paste filling. Chin. J. Nonferrous Metals32(10), 3169–3182. 10.11817/j.ysxb.1004.0609.2021-42429 (2022). [Google Scholar]
- 5.John, N. J., Khan, I. & Patel, A. Evaluation of the crushing characteristics of industrial waste aggregates as construction materials. Constr. Build. Mater.10.1016/j.conbuildmat.2023.133111 (2023). [Google Scholar]
- 6.Mouhcine, B. A., Aicha, B., Adil, H. A. & Yves, B. Innovative test for predicting the rheology of self-compacting concrete. Mater. Today Proc.58, 1020–1027. 10.1016/j.matpr.2021.12.521 (2022). [Google Scholar]
- 7.Li, J. Z. et al. Effects of recycled concrete powders on the rheology, setting and early age strength of cement paste. Constr. Build. Mater.401, 132899. 10.1016/j.conbuildmat.2023.132899 (2023). [Google Scholar]
- 8.Geiker, M. R., Brandl, M., Thrane, L. N. & Nielsen, L. F. On the effect of coarse aggregate fraction and shape on the rheological properties of self-compacting concrete. Cem. Concr. Aggr.24, 3–6. 10.1520/CCA10484J (2022). [Google Scholar]
- 9.Cook, M. D. & Ley, M. T. Impacts of fine aggregate gradation on the workability of slip-formed concrete. J. Mater. Civil Eng.10.1061/jmcee7.mteng-15236 (2023). [Google Scholar]
- 10.Huang, P. Y. et al. Study on the influence of high carbon chromium iron slag aggregate with the same grade on the performance of concrete. Mater. Rev.38(22), 211–217. 10.11896/cldb.23090192 (2024). [Google Scholar]
- 11.Ba, L., Fu, R., Wang, J., Zhuo, Q. F. & Chen, W. Optimization of aggregate gradation design for coal gangue gypsum pipeline filling. Modern Min.40(04), 230–235 (2024). [Google Scholar]
- 12.Wen, Z. J., Gao, Q., Wang, Y. D. & He, J. Y. Experimental study on the correlation between rheological properties of slurry with different concentrations and grading of mixed aggregates. J. Northeastern Univ. (Nat. Sci. Ed.)41(05), 642–648 (2020). [Google Scholar]
- 13.Wang, X. D., Xu, G. G., Zhu, S. B., Wu, B. Q. & Yuan, K. K. Study on rheological properties of high concentration cementitious materials using loess and aeolian sand as aggregates. Coal Mine Saf.48(12), 57–62. 10.13347/j.cnki.mkaq.2017.12.015 (2017). [Google Scholar]
- 14.Su, C. Z., Huang, Y., Yang, Q. J. & Long, F. R. The influence of particle size distribution of iron tailings sand on the performance of dry mixed mortar. Concr. Cem. Prod. 1–4. http://kns.cnki.net/kcms/detail/32.1173.TU.20240808.1451.008.html (2024).
- 15.Kang, Z. Q., Xin, D. F., Shao, L. H. & Zhang, C. Research on pressure loss and optimization of material slurry transportation in L-type filling pipeline. Metal Mines9, 33–40. 10.19614/j.cnki.jsks.202009004 (2020). [Google Scholar]
- 16.Gan, D. Q., Xue, N., Liu, Z. Y., Xue, X. L. & Jia, Y. N. Exploration and optimization of resistance loss in full tailings filling slurry pipeline. Metal Mines7, 32–40. 10.19614/j.cnki.jsks.201907006 (2019). [Google Scholar]
- 17.Liu, L. et al. Numerical study on the pipe flow characteristics of the cemented paste backfill slurry considering hydration effects. Powder Technol.343, 454–464. 10.1016/j.powtec.2018.11.070 (2019). [Google Scholar]
- 18.Xiao, B. L. et al. A simple L-shape pipe flow test for practical rheological properties of backfill slurry: A case study. Powder Technol.356, 1008–1015. 10.1016/j.powtec.2019.09.012 (2019). [Google Scholar]
- 19.Wu, F., Yang, G. L., Xiao, B. L. & Gao, Q. Characterization of rheological properties and applications of high concentration mixed aggregate filling slurry based on scalability. J. Cent. South Univ. (Nat. Sci. Ed.)53(08), 3104–3112. 10.11817/j.issn.1672-7207.2022.08.027 (2022). [Google Scholar]
- 20.Wu, F., Yang, Z. Q. & Gao, Q. Experimental study on pipeline transportation characteristics of high concentration mixed aggregate filling slurry. J. Southwest Jiaotong Univ.57(02), 369–375. 10.3969/j.issn.0258-2724.20200264 (2022). [Google Scholar]
- 21.Sun, K. H., Hu, Y. F. & Zhao, X. Experimental study on rheological properties of coal gangue filling slurry based on response surface methodology. Miner. Prot. Util.44(02), 11–21. 10.13779/j.cnki.issn1001-0076.2024.02.002 (2024). [Google Scholar]
- 22.Liu, L., Fang, Z., Wang, M., Qi, C. & Chao, H. Experimental and numerical study on rheological properties of ice-containing cement paste backfill slurry. Powder Technol.10.1016/j.powtec.2020.05.024 (2020). [Google Scholar]
- 23.Wu, J. Y., Jing, H. W., Yin, Q., Meng, B. & Han, G. S. Strength and ultrasonic properties of cemented waste rock backfill considering confining pressure, dosage and particle size effects. Constr. Build. Mater.242, 118132. 10.1016/j.conbuildmat.2020.118132 (2020). [Google Scholar]
Associated Data
This section collects any data citations, data availability statements, or supplementary materials included in this article.
Data Availability Statement
The data presented in this study are available on request from the corresponding author. The data are not publicly available due to patent application issues.


