Abstract
Salvia sclarea is a medicinal herb from the Lamiaceae family, valued for its essential oil which contains sclareol, linalool, linalyl acetate, and other compounds. Despite its extensive use, the genetic mechanisms of S. sclarea are not well understood. This study presents a chromosome-level genome assembly of S. sclarea using the Oxford Nanopore Technology, Illumina short reads, and Pore-C technology. The assembled genome spans 499.03 Mbp with a scaffold N50 of 50.5 Mbp, forming 11 pseudochromosomes. The genome assembly was validated by BUSCO analysis, which indicated a high completeness marked at 98.7%. The genome contains 68.73% repetitive sequences, with long terminal repeats (LTRs) accounting for 33.01%. A total of 17,202 protein-coding genes were predicted. Among them, 16,846 genes were annotated in the NCBI NR database, the highest among all databases, covering 97.93% of the predicted genes. The phylogenetic analysis revealed that S. sclarea shares a close evolutionary relationship with S. officinalis within the Salvia genus, while species in the genus have evolved independently within the Lamiaceae family. This high-resolution genome assembly offers fresh insights into the biosynthesis of essential oils and other aromatic compounds in S. sclarea, establishing a basis for genetic preservation.
Subject terms: Genome assembly algorithms, Mobile elements
Background & Summary
Salvia sclarea, commonly known as clary sage, is an herbaceous plant belonging to the Salvia genus within the Lamiaceae family. Native to the Mediterranean region, this plant is now cultivated in various parts of the world and can be biennial or perennial1. Clary sage has been used for centuries due to its medicinal properties. The oil extracted from the flowers and leaves of S. sclarea has been utilized in traditional medicine for its anti-inflammatory, antimicrobial, and antioxidant properties2,3. Beyond its medicinal value, the essential oil is used in the cosmetics industry, particularly in perfumes. The main components of S. sclarea essential oil include linalool, linalyl acetate, geraniol, nerol, neryl acetate, and sclareol4,5.
The significance of S. sclarea extends beyond its traditional uses, with its essential oils highly valued in various industries. Recently, pseudochromosome-level genome studies have been published for various plants within the Salvia genus, such as S. splendens, S. miltiorrhiza, and S. hispanica6–8. Despite its extensive use and research into its medicinal and aromatic properties, the genetic basis of these traits in S. sclarea has not been fully explored.
This study generated a chromosome-level genome assembly of S. sclarea using Oxford Nanopore Technology (ONT) long reads, Illumina short reads (NGS), and Pore-C technology. A total of 499.03 Mbp genome was assembled with a scaffold N50 length of 50.5 Mbp. Furthermore, 11 pseudo-chromosomes were generated by integrating the Pore-C data. This chromosome-scale genome provides new insights into the biosynthesis of important aromatic compounds, such as essential oils in S. sclarea, and lays the foundation for genetic conservation. Additionally, the genome assembly will facilitate future research to improve clary sage through genetic breeding and biotechnological approaches, ultimately enhancing its economic and medicinal value.
Methods
Sample preparation
The seeds of S. sclarea for the new genome assembly were obtained from a garden center in Yangpyeong, South Korea. The plants were germinated under controlled conditions with a 12-hour light/dark cycle, maintaining temperatures at 26 °C during the day and 28 °C at night. Young leaf samples were collected at the seedling stage and stored at −80 °C. High molecular weight genomic DNA was extracted using the CTAB9 method, and DNA fragments smaller than 10 kb or 25 kb were removed using the Short Read Eliminator (SRE) kit from Circulomics. The genomic DNA was further purified and concentrated using AMPure XP beads (Beckman Coulter). The DNA concentration and purity were measured with a NanoDrop spectrophotometer and Qubit fluorometer.
Genome and transcriptome sequencing
The sequencing library for Oxford Nanopore Technology (ONT) was prepared using the SQK-LSK114 ONT kit. ONT sequencing was performed on a PromethION sequencer using FLO-PRO114M flow cells, generating a total of 28.23 GB (56x) of raw genomic data (Table 1). The samples sequenced on the PromethION platform were processed using ONT’s Guppy (v6.5.7) software to convert the raw ONT sequencing data (FAST5 files) into FASTQ format.
Table 1.
Summary of sequencing data for Salvia sclarea.
| Library type | Platform | Data size (Gb) | Coverage(X) | Read length (bp) |
|---|---|---|---|---|
| WGS short reads | Illumina Novaseq6000 | 54.4 | 108 | 150 |
| WGS long reads | Nanopore PromethION | 28.23 | 56 | 38491 (N50) |
| Pore-C | Nanopore PromethION | 58.83 | 116 | 150 |
| RNA-Seq | Illumina Novaseq6000 | 8.8 | — | 150 |
For the short-read sequencing library, DNA was extracted using the Plant DNA(III) extraction kit (SmartGene, Korea) and prepared with the Illumina TruSeq DNA Nano library preparation kit (Illumina, San Diego, CA, USA). Paired-end sequencing was carried out on the Illumina NovaSeq6000 platform, producing 54.4 GB (108x) of raw data (Table 1).
Total RNA was extracted from the same leaves used for the genome analysis using the Plant RNA extraction kit (SmartGene, Korea). The RNA library was then constructed with the TruSeq Stranded mRNA kit (Illumina, San Diego, CA, USA) and sequenced on the Illumina NovaSeq6000 platform, producing 8.8 Gb of raw RNA data (Table 1).
Sequencing and De novo assembly of the Pore-C data
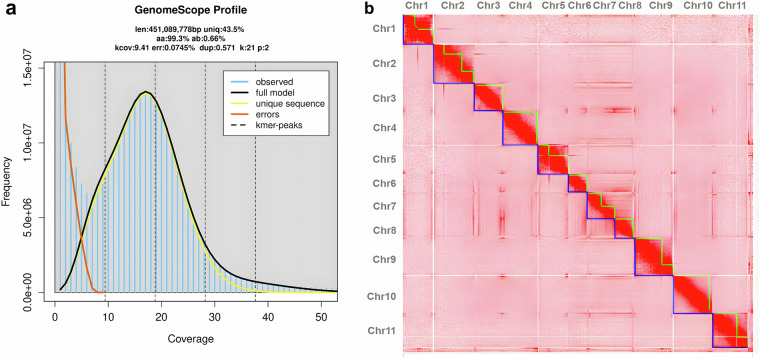
We performed a k-mer analysis using Jellyfish (v2.3.1)10 with a k-mer size of 21. The k-mer frequency distribution was then analyzed using GenomeScope (v2.0)11. The x-axis shows the coverage, and the y-axis shows the k-mer frequency. Observed data are in blue; the model fit is in yellow; unique sequences are in orange, and error sequences are in green. Key metrics include a genome length of 451,008,778 bp, with 43.5% unique sequences, a heterozygosity of 0.66%, an error rate of 0.074%, and a duplication rate of 0.571%. This analysis estimated the genome size to be 451.08 Mb (Fig. 1a).
Fig. 1.
Chromosome-Level Genome Assembly of Salvia sclarea (a) K-mer analysis of S. sclarea genome using GenomeScope profile (b) Pore-C interaction Heatmap illustrating chromosomal interactions in the S. sclarea genome.
The Pore-C raw data for S. sclarea were generated using the PromethION platform. The raw data were processed using Guppy (v6.5.7) from ONT to produce fastq files with a Phred quality score of ≥7, ensuring high-quality sequencing reads. The resulting fastq files were approximately 58.83 GB (116x) in size (Table 1). The resulting fastq files were then subjected to statistical analysis using NanoPlot (v1.41.6)12 to evaluate the data quality and distribution. The Pore-C data was assembled using NextDenovo (v2.5.2)13, which efficiently assembled the sequencing reads into contiguous sequences. The preliminary assembly was then polished using NextPolish (v1.4.1)14 to improve the accuracy and quality of the assembled sequences.
Genome scaffolding was performed using the YaHS-1.115 tool with the Pore-C data. First, contig sequences in the FASTA format were indexed with Samtools (v1.20)16. The Pore-C reads were aligned to these contigs, resulting in a sorted and duplicate-marked BAM file. YaHS was then run with the contig and BAM files to generate scaffolded assemblies, producing AGP and FASTA outputs. Visualization and manual curation of Pore-C contact maps were conducted using JuicerTools (v3.0)17 and Juicebox (v2.20.00)18, ensuring the accuracy of the scaffolding.
The Pore-C interaction heatmap visually represents the interaction data across the 11 chromosomes of S. sclarea. The x-axis and y-axis denote chromosomes, with each cell showing the interaction frequency between the genomic regions. The heatmap confirms the assembly’s accuracy, showing distinct chromosomes with minimal cross-chromosomal interactions, validating the high-quality chromosome-level genome assembly (Fig. 1b).
Chromosome-level genome assembly
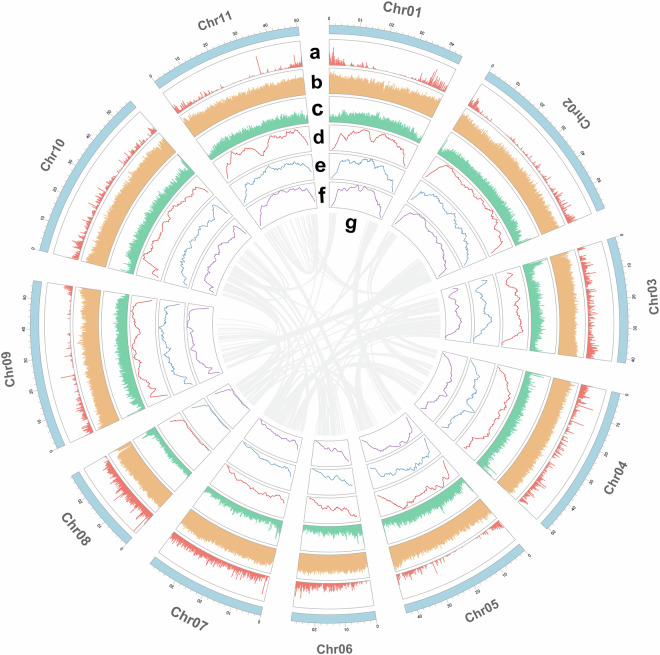
Previous studies have confirmed that S. sclarea has a diploid chromosome number of 2n = 2x = 2219–21. The distribution of various genomic features across the 11 chromosomes was visualized using TBtools22. The circos plot presents various genomic features of S. sclarea across its 11 pseudochromosomes (Fig. 2a). The outermost ring shows the gene density, followed by the repeat sequence density in the second ring. The third ring displays the GC content, while the fourth and fifth rings show the Copia and Gypsy element densities, respectively. The sixth ring highlights the overall LTR density. The innermost lines represent chromosomal synteny within the S. sclarea genome. These visualizations provide detailed insights into the genomic architecture and repeat element composition.
Fig. 2.
Circos plot of the genomic landscape of S.sclarea. (a) Gene density. (b) Repeat sequences density. (c) GC content. (d) Copia density. (e) Gypsy density. (f) LTR density (g) Intraspecies collinearity.
The assembly includes 72 scaffolds that were organized into 11 pseudochromosomes. These pseudochromosomes were refined and finalized through manual curation utilizing Pore-C interaction heatmaps, which ensured accurate chromosomal mapping. The final genome assembly spans 499.03 Mb, with a scaffold N50 value of 50.47 Mb, reflecting a high degree of continuity and assembly quality (Table 2). The lengths of the pseudochromosomes range from 27.72 Mb to 58.83 Mb, totaling 499.03 Mb (Table 3).
Table 2.
Genome assembly and annotation statistics of S. sclarea using Pore-C scaffolding.
| Final statistics of Pore-C scaffolding | |
| The number of scaffolds (pseudomolecule) | 11 |
| Total scaffolds number | 72 |
| Total contigs number | 112 |
| Total length | 499,032,627 bp |
| Total length of unscaffolded contig | 7,653,700 bp |
| Minimum length of scaffold | 27,721,853 bp |
| Maximum length of scaffold | 58,827,749 bp |
| Scaffold N50 | 50,476,100 bp |
| Scaffold N90 | 28,402,000 bp |
| Contig N50 | 26,293,000 bp |
| Contig N90 | 15,270,000 bp |
| Number of scaffolds > 50 KB | 55 |
| % main genome in scaffolds > 50 KB | 99.90% |
Table 3.
The assembly of S. sclarea resulted in 11 pseudochromosomes with lengths.
| ID | Length (bp) |
|---|---|
| Chr1 | 44725600 |
| Chr2 | 58827749 |
| Chr3 | 41332168 |
| Chr4 | 50521182 |
| Chr5 | 43770601 |
| Chr6 | 27721853 |
| Chr7 | 39891702 |
| Chr8 | 28402147 |
| Chr9 | 55812712 |
| Chr10 | 57550813 |
| Chr11 | 50476100 |
| Total | 499032627 |
Assessing genomic data
To assess the completeness of the S. sclarea genome assembly, we employed the BUSCO (Benchmarking Universal Single-Copy Orthologs) v5.4.323 tool. Using the embryophyta_odb10 database, the analysis evaluated the presence of single-copy orthologs. The results indicated a high level of completeness, with 98.7% of the orthologs being complete (single-copy: 96.3%, duplicated: 2.4%). Only 0.6% of the orthologs were fragmented, and 0.7% were missing. These findings confirm the robustness and quality of the genome assembly (Table 4).
Table 4.
Result of the BUSCO assessment of S.sclarea.
| Type | Count | Ratio(%) |
|---|---|---|
| Complete BUSCOs (C) | 1593 | 98.7% |
| Complete and single-copy BUSCOs (S) | 1554 | 96.3% |
| Complete and duplicated BUSCOs (D) | 39 | 2.4% |
| Fragmented BUSCOs (F) | 10 | 0.6% |
| Missing BUSCOs (M) | 11 | 0.7% |
| Total BUSCO groups searched | 1614 | 100% |
Repeat annotation and LTR insertion
To annotate repetitive elements in the S. sclarea genome, we used a combination of RepeatModeler (v2.0.1)24 and RepeatMasker (v4.1.2-pl)25. Initially, RepeatModeler was used to identify and classify de novo repeat families. Subsequently, RepeatMasker utilized this repeat library to mask and annotate the repetitive sequences within the genome. The genome of S. sclarea contains a significant proportion of repetitive elements, comprising 68.73% of the total sequence. Retroelements occupy 33.63% of the genome, with LTR elements being the most prominent at 33.01%. Ty1/Copia elements account for 21.72%, and Gypsy/DIRS1 elements account for 10.80% of the genome. DNA transposons make up 1.70% of the genome. In total, interspersed repeats account for 67.09% of the genome (Table 5).
Table 5.
Annotation of repeat elements in S. sclarea.
| Number of elements | Length occupied | Percentage of sequence | |
|---|---|---|---|
| Retroelements | 63707 | 167835296 bp | 33.63% |
| SINEs: | 0 | 0 bp | 0.00% |
| Penelope: | 0 | 0 bp | 0.00% |
| LINEs: | 3266 | 3106031 bp | 0.62% |
| CRE/SLACS | 0 | 0 bp | 0.00% |
| L2/CR1/Rex | 0 | 0 bp | 0.00% |
| R1/LOA/Jockey | 0 | 0 bp | 0.00% |
| R2/R4/NeSL | 0 | 0 bp | 0.00% |
| RTE/Bov-B | 0 | 0 bp | 0.00% |
| L1/CIN4 | 3266 | 3106031 bp | 0.62% |
| LTR elements: | 60441 | 164729265 bp | 33.01% |
| BEL/Pao | 0 | 0 bp | 0.00% |
| Ty1/Copia | 32442 | 108414020 bp | 21.72% |
| Gypsy/DIRS1 | 26971 | 53911254 bp | 10.80% |
| Retroviral | 0 | 0 bp | 0.00% |
| DNA transposons | 15170 | 8480073 bp | 1.70% |
| hobo-Activator | 2655 | 844031 bp | 0.17% |
| Tc1-IS630-Pogo | 1490 | 709657 bp | 0.14% |
| En-Spm | 0 | 0 bp | 0.00% |
| MULE-MuDR | 4813 | 3245267 bp | 0.65% |
| PiggyBac | 0 | 0 bp | 0.00% |
| Tourist/Harbinger | 4019 | 2031296 bp | 0.41% |
| Other (Mirage, | 0 | 0 bp | 0.00% |
| P-element, Transib) | |||
| Rolling-circles | 4743 | 2373257 bp | 0.48% |
| Unclassified: | 425389 | 158507734 bp | 31.76% |
| Total interspersed repeats: | 334823103 bp | 67.09% | |
| Small RNA: | 0 | 0 bp | 0.00% |
| Satellites: | 0 | 0 bp | 0.00% |
| Simple repeats: | 111375 | 5117419 bp | 1.03% |
| Low complexity: | 13741 | 676966 bp | 0.14% |
| Total | 342990745 bp | 68.73% | |
For the identification of long terminal repeat (LTR) retrotransposons, we implemented a two-step approach. First, LTR candidates were detected using LTR-finder (v1.1)26 and LTR-harvest27 as part of the GenomeTools (v1.6.5)28 package. The results from these tools were then integrated and refined using LTR-retriever (v2.9.0)29, which provided a comprehensive and accurate annotation of LTR elements.
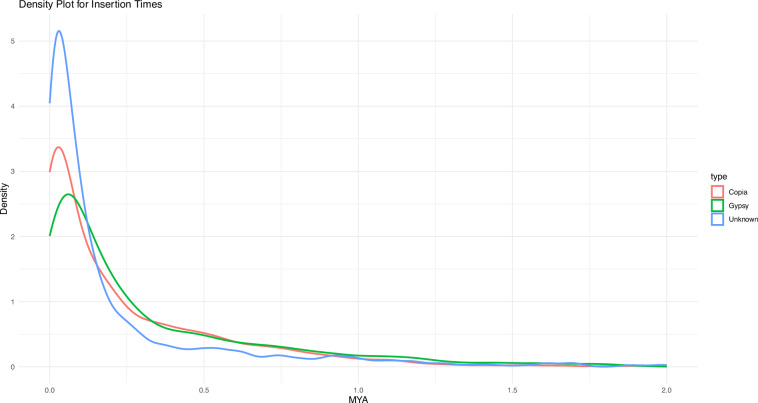
The insertion time of these LTR elements was analyzed to provide insights into their evolutionary history within the genome. Using the density plot for insertion times, we identified the insertion periods for various LTR types: Copia elements showed a peak insertion time at approximately 0.02 million years ago (MYA), Gypsy elements at 0.04 MYA, and unknown elements at 0.01 MYA (Fig. 3).
Fig. 3.
Density plot for LTR retrotransposon insertion times in S. sclarea: Distribution of Copia, Gypsy, and Unknown elements.
Gene annotation
Gene annotation for the S. sclarea genome was performed using a combination of ab initio prediction, homology-based methods, and transcriptome data. For the ab initio gene prediction, we used Braker2 (v2.1.6)30 and SNAP31. Braker2 utilizes RNA-seq data to train the gene prediction models, while SNAP is used to refine the predictions. Homology-based annotation was conducted using GeMoMa (v1.8)32. For this purpose, we utilized genome data from closely related species available in the NCBI database, specifically Salvia splendens, Salvia hispanica, Salvia miltiorrhiza, and Salvia rosmarinus. RNA-seq reads were assembled using StringTie (v2.1.4)33, which provided transcript assemblies used as evidence for gene prediction. Furthermore, we utilized Trinity (v2.15.1)34 to assemble RNA-seq data into contigs, and these were processed with TransDecoder (v5.7.1)35 to identify candidate coding regions within the assembled transcripts. Finally, predictions from ab initio methods, homology-based approaches, and transcriptome evidence were integrated using EVidenceModeler (EVM) v2.1.03636.
Functional annotation of genes was conducted using a two-pronged approach. Protein sequences were aligned against the NCBI non-redundant protein (NR)37 database and the Swiss-prot38 database utilizing DIAMOND (v2.1.9)39, ensuring efficient sequence alignment. EggNOG-mapper40 was used to annotate protein sequences, leveraging the Kyoto Encyclopedia of Genes and Genomes (KEGG)41, Gene Ontology (GO)42 terms, and Pfam43 to provide comprehensive functional insights. The NCBI NR database annotated 16,846 genes, the highest among all databases, covering 97.93% of the 17,202 predicted genes (Table 6).
Table 6.
Functional annotation of S. sclarea genes.
| Genome annotation | Number of elements |
|---|---|
| Predicted protein-coding genes | 17202 |
| Uniprot | 16797 |
| NCBI NR | 16846 |
| eggNOG | 16251 |
| KEGG | 8409 |
| GO | 8576 |
| Pfam | 14596 |
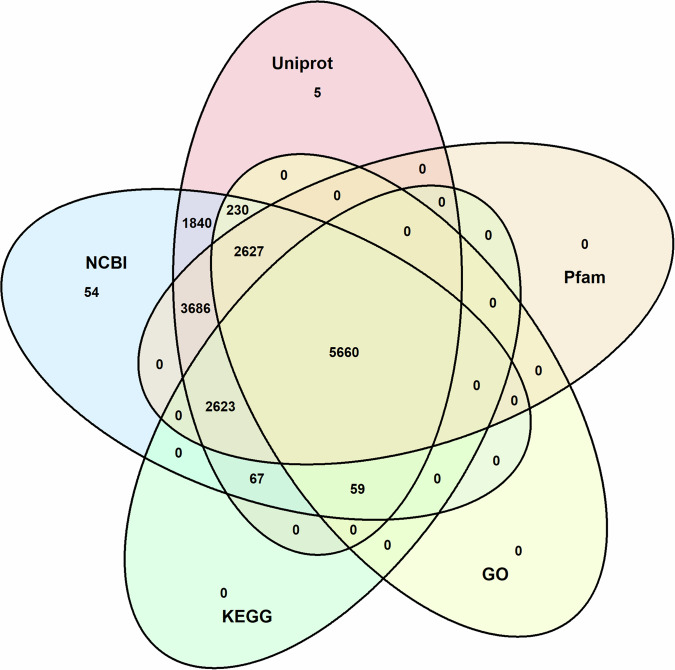
The Venn diagram shows the overlaps and unique counts of functionally annotated genes in S. sclarea across five databases. Uniprot contains 16,797 gene annotations, while NCBI NR has 16,846 gene annotations. EggNOG includes 16,251 annotated genes, with GO covering 8,576 annotations and KEGG 8,409 annotations, while Pfam annotates 14,596 genes. The central overlapping area shows 5,660 gene annotations common across all five databases. Overlaps include 1,840 annotations shared between Uniprot and NCBI NR, and 3,686 annotations shared between NCBI NR and Pfam. This visualization represents the distribution and intersection of gene annotations across multiple databases (Fig. 4).
Fig. 4.
Venn diagram of functional annotation of S. sclarea genes across databases.
Phylogenetic analysis in lamiaceae
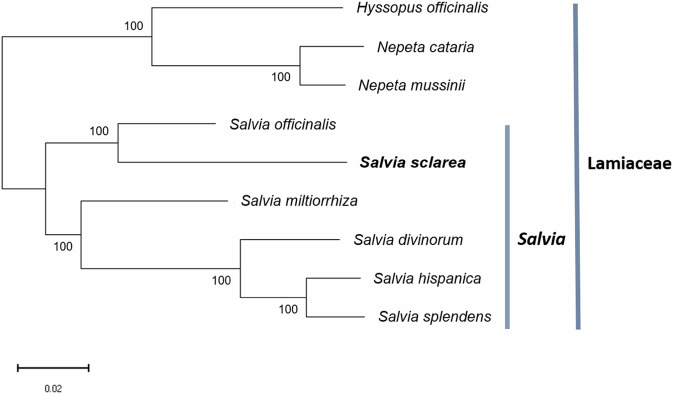
Phylogenetic tree was constructed to identify the evolutionary relationships between S. sclarea and eight other species based on single-copy genes using OrthoVenn344. Three species from the family Lamiaceae were included: Hyssopus officinalis (datadryad.org/stash/dataset/doi:10.5061/dryad.88tj450), Nepeta cataria (datadryad.org/stash/dataset/doi:10.5061/dryad.88tj450), Nepeta mussinii (datadryad.org/stash/dataset/doi:10.5061/dryad.88tj450). And five species from the genus Salvia were included: Salvia splendens (GCF_004379255.2), Salvia hispanica (GCF_023119035.1), Salvia divinorum (GCA_041381175.1), Salvia miltiorrhiza (GCF_028751815.1), and Salvia officinalis45, which were obtained from NCBI database (http://www.ncbi.nlm.nih.gov/). Muscle46 was used to align the sequences, trimAl47 was used to extract and trim the conserved sequences, and FastTree48 was used to construct a phylogenetic tree based on the maximum likelihood method. The analysis was performed using the JTT + CAT model, and the reliability of each node was assessed by the SH test method. Each branch point is indicated with a confidence level of 100, which confirms that the structure of the phylogenetic tree has high statistical reliability.
This tree shows the phylogenetic relationships among various species within the Lamiaceae family, divided into the main groups of the family itself and the genus Salvia (Fig. 5). H. officinalis, N. cataria, and N. mussinii are classified in a different lineage from Salvia within the Lamiaceae and form an independent branch. Within the Salvia genus, S. officinalis and S. sclarea show a close orthologous relationship, and these two species branch from S. miltiorrhiza. S. splendens, S. hispanica, and S. divinorum form separate branches, and S. hispanica and S. splendens are the closest related. These results indicate that species within the Salvia genus have evolved independently within the Lamiaceae, which provides important information for understanding genetic diversity and evolutionary relationships.
Fig. 5.
Phylogenetic tree of related species in Lamiaceae family.
Data Records
The genomic sequencing data (Illumina, Nanopore, Pore-C) are available in the NCBI SRA database, with specific accession numbers as follows: SRP51069349, with specific accession numbers as follows:
The Pore-C sequencing data were deposited in the Sequence Read Archive at the NCBI (SRX24744566)50.
The genomic Nanopore sequencing data were deposited in the Sequence Read Archive at the NCBI (SRX24744567)51.
The genomic Illumina sequencing data were deposited in the Sequence Read Archive at the NCBI (SRX24744565)52.
The transcriptome Illumina sequencing data were deposited in the Sequence Read Archive at the NCBI (SRX24744564)53.
The final chromosome assembly was deposited in GenBank at the NCBI (GCA_041430365.1)54.
The genome annotation files, including predicted CDS and protein sequences and GFF files, are available in the FigShare database (10.6084/m9.figshare.27002593.v1)55.
Technical Validation
The final DNA extracted using the CTAB method and purified with the SRE kit for Nanopore sequencing was analyzed for length and quality using gel electrophoresis and the TapeStation 2200 before proceeding with library preparation.
Acknowledgements
This work was supported by the National Research Foundation of Korea (NRF) grant funded by the Korean government (MSIT, No. 2022R1A2C1004127).
Author contributions
S Choi, and C Kim conceptualized and designed this study. S Choi collected the samples and conducted the experiments. S Choi, and Y Kang analyzed the data. C Kim supervised the research. S Choi wrote the draft manuscript. C Kim provided critical feedback and helped shape the research, analysis, and manuscript. Both S Choi and C Kim contributed to the final version of the manuscript. All authors read and approved the final manuscript.
Code availability
Nanopore Pore-C Data. These mnd files, along with the initial assembly results, were input into the 3d-dna pipeline (v180922) using the run-asm-pipeline.sh script with the following options: -i 10000 --polisher-input-size 1000000 --splitter-input-size 1000000 -r 2 --editor-coarse-resolution 250000 --editor-coarse-region 1250000 -q 0 --polisher-coarse-resolution 1000000 --polisher-coarse-region 30000000. This process generated the rawchrom.assembly, rawchrom.hic, and FINAL.fasta files.
Competing interests
The authors declare no competing interests.
Footnotes
Publisher’s note Springer Nature remains neutral with regard to jurisdictional claims in published maps and institutional affiliations.
References
- 1.Aćimović, M. G. et al. Biological activity and profiling of Salvia sclarea essential oil obtained by steam and hydrodistillation extraction methods via chemometrics tools. Flavour and Fragrance Journal37, 20–32 (2022). [Google Scholar]
- 2.Gülçin, I., UĞUZ, M. T., Oktay, M., Beydemir, Ş. & Küfrevioğlu, Ö. İ. Evaluation of the antioxidant and antimicrobial activities of clary sage (Salvia sclarea L.). Turkish Journal of Agriculture and Forestry28, 25–33 (2004). [Google Scholar]
- 3.Peana, A. T., Moretti, M. D. & Juliano, C. Chemical composition and antimicrobial action of the essential oils of Salvia desoleana and S. sclarea. Planta medica65, 752–754 (1999). [DOI] [PubMed] [Google Scholar]
- 4.Pitarokili, D., Couladis, M., Petsikos-Panayotarou, N. & Tzakou, O. Composition and antifungal activity on soil-borne pathogens of the essential oil of Salvia sclarea from Greece. Journal of agricultural and food chemistry50, 6688–6691 (2002). [DOI] [PubMed] [Google Scholar]
- 5.Hristova, Y. et al. Chemical composition and antifungal activity of essential oil of Salvia sclarea L. from Bulgaria against clinical isolates of Candida species. Journal of BioScience & Biotechnology2 (2013).
- 6.Wang, L. et al. A chromosome-level genome assembly of chia provides insights into high omega-3 content and coat color variation of its seeds. Plant Communications3 (2022). [DOI] [PMC free article] [PubMed]
- 7.Pan, X. et al. Chromosome-level genome assembly of Salvia miltiorrhiza with orange roots uncovers the role of Sm2OGD3 in catalyzing 15, 16-dehydrogenation of tanshinones. Horticulture Research10, uhad069 (2023). [DOI] [PMC free article] [PubMed] [Google Scholar]
- 8.Jia, K.-H. et al. Chromosome-scale assembly and evolution of the tetraploid Salvia splendens (Lamiaceae) genome. Horticulture Research8 (2021). [DOI] [PMC free article] [PubMed]
- 9.Doyle, J. J. & Doyle, J. L. A rapid DNA isolation procedure for small quantities of fresh leaf tissue. Phytochemical bulletin (1987).
- 10.Marçais, G. & Kingsford, C. A fast, lock-free approach for efficient parallel counting of occurrences of k-mers. Bioinformatics27, 764–770 (2011). [DOI] [PMC free article] [PubMed] [Google Scholar]
- 11.Vurture, G. W. et al. GenomeScope: fast reference-free genome profiling from short reads. Bioinformatics33, 2202–2204 (2017). [DOI] [PMC free article] [PubMed] [Google Scholar]
- 12.De Coster, W., D’hert, S., Schultz, D. T., Cruts, M. & Van Broeckhoven, C. NanoPack: visualizing and processing long-read sequencing data. Bioinformatics34, 2666–2669 (2018). [DOI] [PMC free article] [PubMed] [Google Scholar]
- 13.Hu, J. et al. NextDenovo: an efficient error correction and accurate assembly tool for noisy long reads. Genome Biology25, 107 (2024). [DOI] [PMC free article] [PubMed] [Google Scholar]
- 14.Hu, J., Fan, J., Sun, Z. & Liu, S. NextPolish: a fast and efficient genome polishing tool for long-read assembly. Bioinformatics36, 2253–2255 (2020). [DOI] [PubMed] [Google Scholar]
- 15.Zhou, C., McCarthy, S. A. & Durbin, R. YaHS: yet another Hi-C scaffolding tool. Bioinformatics39, btac808 (2023). [DOI] [PMC free article] [PubMed] [Google Scholar]
- 16.Li, H. et al. The sequence alignment/map format and SAMtools. bioinformatics25, 2078–2079 (2009). [DOI] [PMC free article] [PubMed] [Google Scholar]
- 17.Durand, N. C. et al. Juicer provides a one-click system for analyzing loop-resolution Hi-C experiments. Cell systems3, 95–98 (2016). [DOI] [PMC free article] [PubMed] [Google Scholar]
- 18.Durand, N. C. et al. Juicebox provides a visualization system for Hi-C contact maps with unlimited zoom. Cell systems3, 99–101 (2016). [DOI] [PMC free article] [PubMed] [Google Scholar]
- 19.Muravenko, O. V. et al. Integration of Repeatomic and Cytogenetic Data on Satellite DNA for the Genome Analysis in the Genus Salvia (Lamiaceae). Plants11, 2244, 10.3390/plants11172244 (2022). [DOI] [PMC free article] [PubMed] [Google Scholar]
- 20.Kharazıan, N. Karyotypic study of some Salvia Lamiaceae species from Iran. Journal of applied biological sciences5, 21–25 (2011). [Google Scholar]
- 21.Özdemir, C. & Şenel, G. The Morphological, Anatomical and Karyological Propertiesof Salvia sclarea L. Turkish Journal of Botany23, 7–18 (1999). [Google Scholar]
- 22.Chen, C. et al. TBtools: an integrative toolkit developed for interactive analyses of big biological data. Molecular plant13, 1194–1202 (2020). [DOI] [PubMed] [Google Scholar]
- 23.Simão, F. A., Waterhouse, R. M., Ioannidis, P., Kriventseva, E. V. & Zdobnov, E. M. BUSCO: assessing genome assembly and annotation completeness with single-copy orthologs. Bioinformatics31, 3210–3212 (2015). [DOI] [PubMed] [Google Scholar]
- 24.Flynn, J. M. et al. RepeatModeler2 for automated genomic discovery of transposable element families. Proceedings of the National Academy of Sciences117, 9451–9457 (2020). [DOI] [PMC free article] [PubMed] [Google Scholar]
- 25.Tempel, S. Using and understanding RepeatMasker. Mobile genetic elements: protocols and genomic applications, 29-51 (2012). [DOI] [PubMed]
- 26.Xu, Z. & Wang, H. LTR_FINDER: an efficient tool for the prediction of full-length LTR retrotransposons. Nucleic acids research35, W265–W268 (2007). [DOI] [PMC free article] [PubMed] [Google Scholar]
- 27.Ellinghaus, D., Kurtz, S. & Willhoeft, U. LTRharvest, an efficient and flexible software for de novo detection of LTR retrotransposons. BMC bioinformatics9, 1–14 (2008). [DOI] [PMC free article] [PubMed] [Google Scholar]
- 28.Gremme, G., Steinbiss, S. & Kurtz, S. GenomeTools: a comprehensive software library for efficient processing of structured genome annotations. IEEE/ACM transactions on computational biology and bioinformatics10, 645–656 (2013). [DOI] [PubMed] [Google Scholar]
- 29.Ou, S. & Jiang, N. LTR_retriever: a highly accurate and sensitive program for identification of long terminal repeat retrotransposons. Plant physiology176, 1410–1422 (2018). [DOI] [PMC free article] [PubMed] [Google Scholar]
- 30.Brůna, T., Hoff, K. J., Lomsadze, A., Stanke, M. & Borodovsky, M. BRAKER2: automatic eukaryotic genome annotation with GeneMark-EP+ and AUGUSTUS supported by a protein database. NAR genomics and bioinformatics3, lqaa108 (2021). [DOI] [PMC free article] [PubMed] [Google Scholar]
- 31.Korf, I. Gene finding in novel genomes. BMC bioinformatics5, 1–9 (2004). [DOI] [PMC free article] [PubMed] [Google Scholar]
- 32.Keilwagen, J., Hartung, F., Paulini, M., Twardziok, S. O. & Grau, J. Combining RNA-seq data and homology-based gene prediction for plants, animals and fungi. BMC bioinformatics19, 1–12 (2018). [DOI] [PMC free article] [PubMed] [Google Scholar]
- 33.Pertea, M. et al. StringTie enables improved reconstruction of a transcriptome from RNA-seq reads. Nature biotechnology33, 290–295 (2015). [DOI] [PMC free article] [PubMed] [Google Scholar]
- 34.Grabherr, M. G. et al. Full-length transcriptome assembly from RNA-Seq data without a reference genome. Nature biotechnology29, 644–652 (2011). [DOI] [PMC free article] [PubMed] [Google Scholar]
- 35.Haas, B. J. et al. De novo transcript sequence reconstruction from RNA-seq using the Trinity platform for reference generation and analysis. Nature protocols8, 1494–1512 (2013). [DOI] [PMC free article] [PubMed] [Google Scholar]
- 36.Haas, B. J. et al. Automated eukaryotic gene structure annotation using EVidenceModeler and the Program to Assemble Spliced Alignments. Genome biology9, 1–22 (2008). [DOI] [PMC free article] [PubMed] [Google Scholar]
- 37. Database resources of the national center for biotechnology information. Nucleic acids research46, D8-D13 (2018). [DOI] [PMC free article] [PubMed]
- 38.Boeckmann, B. et al. The SWISS-PROT protein knowledgebase and its supplement TrEMBL in 2003. Nucleic acids research31, 365–370 (2003). [DOI] [PMC free article] [PubMed] [Google Scholar]
- 39.Buchfink, B., Xie, C. & Huson, D. H. Fast and sensitive protein alignment using DIAMOND. Nature methods12, 59–60 (2015). [DOI] [PubMed] [Google Scholar]
- 40.Cantalapiedra, C. P., Hernández-Plaza, A., Letunic, I., Bork, P. & Huerta-Cepas, J. eggNOG-mapper v2: functional annotation, orthology assignments, and domain prediction at the metagenomic scale. Molecular biology and evolution38, 5825–5829 (2021). [DOI] [PMC free article] [PubMed] [Google Scholar]
- 41.Kotera, M., Hirakawa, M., Tokimatsu, T., Goto, S. & Kanehisa, M. The KEGG databases and tools facilitating omics analysis: latest developments involving human diseases and pharmaceuticals. Next Generation Microarray Bioinformatics: Methods and Protocols, 19-39 (2012). [DOI] [PubMed]
- 42.Ashburner, M. et al. Gene ontology: tool for the unification of biology. Nature genetics25, 25–29 (2000). [DOI] [PMC free article] [PubMed] [Google Scholar]
- 43.Mistry, J. et al. Pfam: The protein families database in 2021. Nucleic acids research49, D412–D419 (2021). [DOI] [PMC free article] [PubMed] [Google Scholar]
- 44.Sun, J. et al. OrthoVenn3: an integrated platform for exploring and visualizing orthologous data across genomes. Nucleic acids research51, W397–W403 (2023). [DOI] [PMC free article] [PubMed] [Google Scholar]
- 45.Li, C.-Y. et al. The sage genome provides insight into the evolutionary dynamics of diterpene biosynthesis gene cluster in plants. Cell reports40 (2022). [DOI] [PubMed]
- 46.Edgar, R. C. Muscle5: High-accuracy alignment ensembles enable unbiased assessments of sequence homology and phylogeny. Nature Communications13, 6968 (2022). [DOI] [PMC free article] [PubMed] [Google Scholar]
- 47.Capella-Gutiérrez, S., Silla-Martínez, J. M. & Gabaldón, T. trimAl: a tool for automated alignment trimming in large-scale phylogenetic analyses. Bioinformatics25, 1972–1973 (2009). [DOI] [PMC free article] [PubMed] [Google Scholar]
- 48.Price, M. N., Dehal, P. S. & Arkin, A. P. FastTree 2–approximately maximum-likelihood trees for large alignments. PloS one5, e9490 (2010). [DOI] [PMC free article] [PubMed] [Google Scholar]
- 49.NCBI Sequence Read Archivehttps://identifiers.org/ncbi/insdc.sra:SRP510693 (2024).
- 50.NCBI Sequence Read Archivehttps://identifiers.org/ncbi/insdc.sra:SRX24744566 (2024).
- 51.NCBI Sequence Read Archivehttps://identifiers.org/ncbi/insdc.sra:SRX24744567 (2024).
- 52.NCBI Sequence Read Archivehttps://identifiers.org/ncbi/insdc.sra:SRX24744565 (2024).
- 53.NCBI Sequence Read Archivehttps://identifiers.org/ncbi/insdc.sra:SRX24744564 (2024).
- 54.NCBI GenBankhttps://identifiers.org/ncbi/insdc.gca:GCA_041430365.1 (2024).
- 55.choi, sehyun Salvia sclarea annotation. figshare. 10.6084/m9.figshare.27002593.v1 (2024).
Associated Data
This section collects any data citations, data availability statements, or supplementary materials included in this article.
Data Citations
- NCBI Sequence Read Archivehttps://identifiers.org/ncbi/insdc.sra:SRP510693 (2024).
- NCBI Sequence Read Archivehttps://identifiers.org/ncbi/insdc.sra:SRX24744566 (2024).
- NCBI Sequence Read Archivehttps://identifiers.org/ncbi/insdc.sra:SRX24744567 (2024).
- NCBI Sequence Read Archivehttps://identifiers.org/ncbi/insdc.sra:SRX24744565 (2024).
- NCBI Sequence Read Archivehttps://identifiers.org/ncbi/insdc.sra:SRX24744564 (2024).
Data Availability Statement
Nanopore Pore-C Data. These mnd files, along with the initial assembly results, were input into the 3d-dna pipeline (v180922) using the run-asm-pipeline.sh script with the following options: -i 10000 --polisher-input-size 1000000 --splitter-input-size 1000000 -r 2 --editor-coarse-resolution 250000 --editor-coarse-region 1250000 -q 0 --polisher-coarse-resolution 1000000 --polisher-coarse-region 30000000. This process generated the rawchrom.assembly, rawchrom.hic, and FINAL.fasta files.


