Abstract
In the current years, gas–liquid membrane contactors (GLMCs) have been introduced as a promising, versatile and easy-to-operate technology for mitigating the emission of major greenhouse contaminants (i.e., CO2 and H2S) to the ecosystem. This paper tries to computationally study the role of membrane pores wettability on the removal performance of CO2 inside the HFMC. To fulfill this purpose, a mathematical model based on finite element procedure (FEP) has been employed to solve the momentum and mass transport equations in the partial-wetting (50% wetting of micropores) and non-wetting (0% wetting of micropores) modes of membrane during operation. Additionally, a comprehensive simulation was ensembled to predict the results. In this research, 2-amino-2-methyl-l-propanol (AMP) has been employed as a relatively novel alkanolamine absorbent to separate CO2 form CO2/N2 mixture. Analysis of the results implied that the wetting of membrane micropores significantly deteriorated the removal efficiency due to the enhancing mass transfer resistance towards transferring CO2 (75% in the non-wetting mode > 8% considering 50% wetting of micropores).
Keywords: Membrane wettability, CO2 removal, Amine solution, Membrane contactor, CFD simulation
Subject terms: Chemical engineering, Pollution remediation, Computational science
Introduction
Despite gradual increment in the application of renewable energy sources, fossil fuels are still regarded as the prominent energy sources all over the world1–3. However, the combustion of fossil fuels causes the release of different types of detrimental greenhouse gases (GHGs) (i.e., CO2, H2S and NO2), which results in the occurrence of undesirable and irreversible environmental-related phenomena such as global climate change, air pollution, respiratory disease and the desertification of fertile areas. The emergence of these challenges has endangered the human well-beings4,5. In doing so, developing trustworthy approaches for mitigating the release of GHGs to the ecosystem by increasing the absorption percentages is an indisputable duty of scientists in the separation science and technology.
Over the last twenty years, the removal process of CO2 (as the major GHG) using gas–liquid membrane contactor (GLMC) has been of prime attention thank to its noteworthy advantages during industrial operation such as flexibility, compactness, high interfacial area and easy scale-up6–8. Despite the abovementioned advantages, wettability of membrane micropores owing to the penetration of liquid absorbent into them is an important disadvantage of GLMC, which results in deteriorating the mass transfer of CO2 molecules and hence, reduces its removal percentage9,10.
Proper selection of chemical absorbents with high reaction rates is a vital step toward increasing the removal efficiency of CO2 molecules through the GLMC. Alkanolamine solutions like MEA, MDEA, DEA and TEA have recently been employed as benchmark chemical absorbents for CO2 separation11–14. The existence of important positive points like ease of accessibility, excellent absorption yield, high water solubility and affordability compared to other chemical absorbents has motivated the researchers to discover novel types of amines in the gas separation industry. Despite noteworthy advantages, some cons such as thermal/oxidative degradation, environmental toxicity and the requirement of great amount of energy for regeneration have challenged their employment15,16. Figure 1 presents the molecular structure of AMP amine absorbent.
Fig. 1.
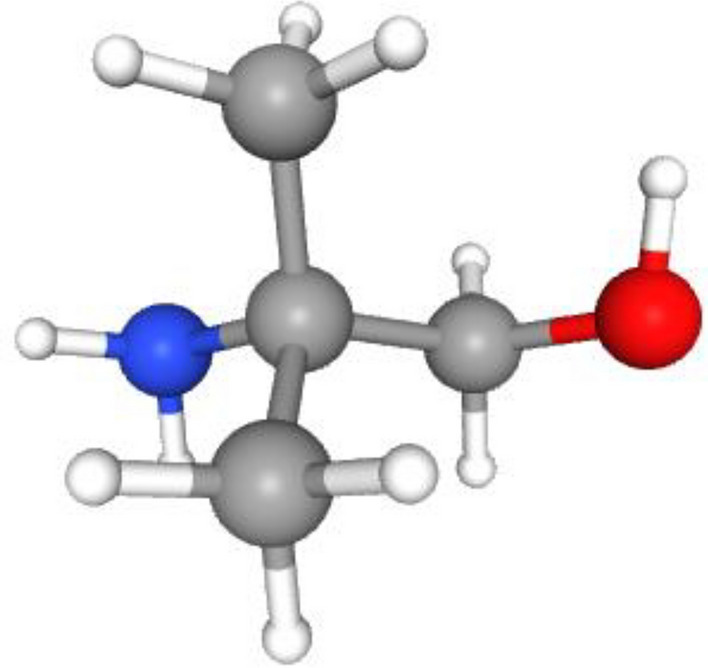
Molecular structure of AMP amine absorbent17.
Currently, expensive and time-consuming nature of experimental/laboratorial researches have convinced the scientists to employ mathematical models based on finite element method (FEM) to assess the absorption efficiency of different GHGs from gaseous feed and also solution of governing transport equations inside the GLMC18–20.
In this paper, the authors have made their endeavor to numerically analyze the removal of CO2 GHG from CO2/N2 gaseous feed using novel amino-2-methyl-l-propanol (AMP) amine solution inside the GLMC under non-wetting and partial-wetting operational modes. To reach this aim, a 2D simulation and an FEM-associated mathematical modeling are developed to compare the effect of membrane pores wettability on the removal of CO2. Additionally, the effectiveness of AMP absorbent on CO2 separation of aims to be studied. Ultimately, the negative/positive effects of momentous module/membrane-based parameters on the absorption of CO2 GHG are studied comprehensively.
Model development
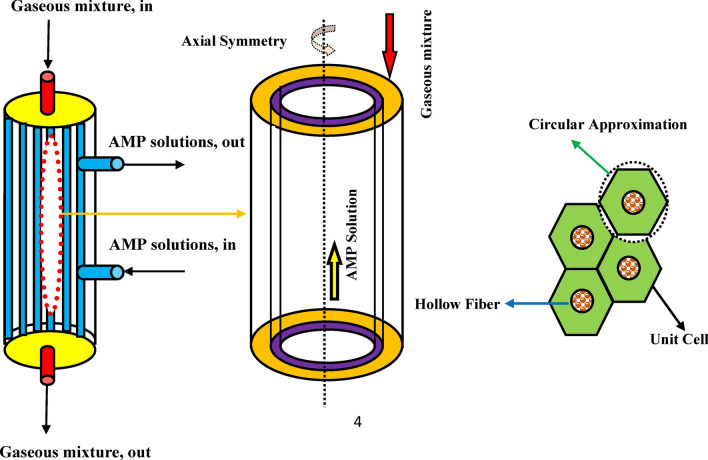
With the aim of analyzing the separation process of CO2 GHG using AMP alkanolamine solution in different wetting ratios (non-wetting, 50% partial wetting and complete-wetting) inside the GLMC, a comprehensive two-dimensional simulation and a mathematical model is developed for studying mass transfer performance in the main domains of GLMC and prognosticating the results. Figure 2 schematically depicts the geometry, mass transfer trend and cross section of GLMC.
Fig. 2.
Schematic demonstration of geometry, cross section and Happel’s free surface model (HFSM) inside the GLMC. Adopted from8.
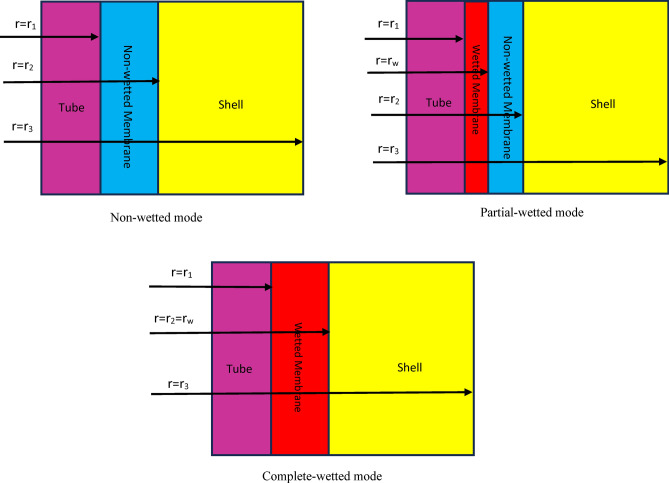
In this paper, countercurrent flowing of CO2/N2 mixture flows in the shell and AMP absorbent results in the movement of CO2 molecules from the shell to the micropores and then after, its absorption by AMP absorbent in the tube of GLMC. The main role of employed membrane is the separation of shell and tube and selective passing of CO2 molecules. Figure 3 aims to schematically demonstrates the non-wetted, partial-wetted and complete-wetted modes of membrane during operation inside the GLMC.
Fig. 3.
Schematic demonstration of membrane during operation inside the GLMC.
To simplify the simulation process of CO2 GHG using AMP solution inside the, some assumptions have been used, which can be interpreted as follows:
steady state mode of operation inside the GLMC to solve the continuity and Navier-stocks equations;
Isothermal state;
The use Henry’s law in the gas–liquid interface;
Laminar flow pattern inside the shell and tube of GLMC;
Application of HFSM for the estimation of effective radius around each individual hollow fiber (r3);
In this research, the authors have employed commercial COMSOL Multiphysics software to prognosticate the separation performance of CO2 GHG through the GLMC thank to its brilliant advantages such as wide range of abilities, user-friendly environment and great capability to analyze equations9,18,21–24. The needed time for running the 2D simulation and solving PDEs was almost 2 min. Essential parameters of GLMC and feed conditions are presented in Table 1. Complete definition of all employed parameters in the manuscript is presented in the nomenclature list.
Table 1.
Specifications of GLMC and feed conditions for developing predictive simulation25.
| Parameter | Unit | Value |
|---|---|---|
 |
m | 4 × 10⁻⁴ |
 |
m | 6.5 × 10⁻⁴ |
 |
m | 5 × 10⁻³ |
| L | m | 0.295 |
| n | – | 35 |
 |
– | 0.6 |
| T | K | 303 |
| Inlet concentration of CO2/N2 | Vol% | 20/80 |
| Ql | ml/min | 400–760 |
| Qg | ml/min | 200 |
Governing equations in different domains
Table 2 comprehensively presents all derived mass transfer (based on Fick’s law) and momentum transfer equations in the shell of GLMC. Velocity profile in the shell of GLMC has been derived by the incorporation of two assumptions (laminar flow regime and the HFSM) (Eq. 4). Combination of Eqs. (5) and (6) results in the prediction of effective hypothetical radius around each hollow fiber (r3). Based on these equations, r3 is calculated 8.45 × 10⁻⁴ m.
Table 2.
| Mass transfer | Momentum transfer |
|---|---|
 |
 |
 |
 |
 |
 |
Governing transport equations along with the CO2-AMP reaction rate inside the tube of GLMC are presented in Table 3.
Table 3.
| Mass transfer | Momentum transfer |
|---|---|
 |
 |
Figure 4 schematically demonstrates the gas/liquid filled compartments of employed microporous membrane through the GLMC.
Fig. 4.
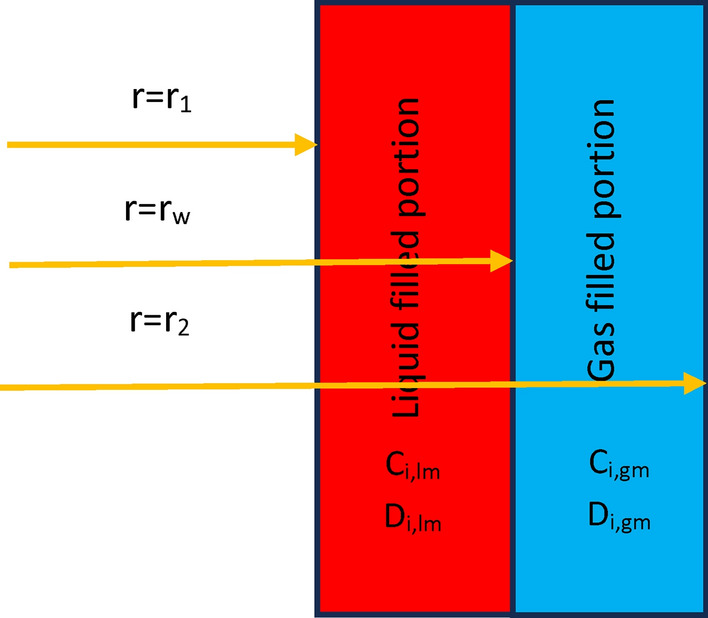
Schematic demonstration of gas/liquid filled compartments of employed microporous membrane through the GLMC.
In the gas-filled compartment of membrane, molecular diffusion is the only governing mechanism of transport. However, in the liquid-filled portion of membrane, both reaction and diffusion are important. Table 4 presents the governing equations inside the membrane.
Table 4.
| Mass transfer equation (gas-filled portion) | Mass transfer equation (liquid-filled portion) |
|---|---|
 |
 |
 |
Tables 5 and 6 list the corresponding momentum/mass boundary conditions in three major domains of GLMC under non-wetted and partial-wetted mode of membrane.
Table 5.
Corresponding boundary conditions in major domains of GLMC considering non-wetted mode of membrane.
| Position | Shell side | Membrane | Tube | |
|---|---|---|---|---|
| Mass | Momentum | Mass | Mass | |
| z = 0 | Convective flux | Outlet: Pressure, no viscous stress, p = 0 | Insulated |


|
| z = L |  |
Inlet velocity V = V0,shell | Insulated | Convective flux |
| r = 0 | – | – | – | Axial symmetry 
|
| r = r1 | – | – |  |
 |
| r = r2 |  |
No slip, Wall |  |
– |
| r = r3 |  |
No slip, Table Wall | – | – |
Table 6.
Corresponding boundary conditions in major domains of GLMC considering partial-wetted mode of membrane.
| Position | Shell side | Gas-filled compartment | Liquid-filled compartment | Tube |
|---|---|---|---|---|
| z = 0 | Convective flux | Insulated | Insulated |


|
| z = L |  |
Insulated | Insulated | Convective flux |
| r = 0 | – | – | – | Axial symmetry 
|
| r = r1 | – |  |
 |
|
| r = rw | – |  |
 |
– |
| r = r2 | – |  |
– |  |
| r = r3 |  |
– | – | – |
Table 7 provides important physico-chemical properties of CO2 and AMP absorbent for using in 2D simulation.
Table 7.
The essential physical, mechanical, transport and chemical parameters for model development.
Mapped meshing investigation
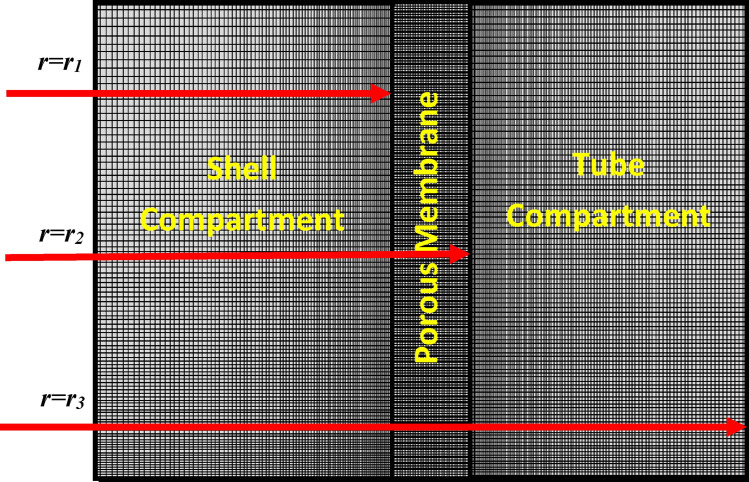
In this investigation, mapped meshing approach has been used to discretize the domains of GLMC into smaller compartment to increase the computational precision and reduce the error13. The main reason of applying this technique is its ability to cover all the domains’ points27,39. It is clear from the Fig. 5 that the designed meshes in the membrane and around it is much denser and smaller due to the occurrence of CO2-AMP reaction. Based on the evaluated data after the 300th mesh, no considerable variation in the concentration of CO2 molecules in the shell outlet takes place, which implied the independency of the results after this mesh number.
Fig. 5.
Mapped meshing of GLMC in the non-wetted mode.
Results and discussion
Validation of results
In this paper, validation of developed 2D simulation results is performed via their compasrison with obtained experimental data from the research of Rongwong et al.25. By comparison of obtained CO2 flux values in an extensive range of liquid velocity, it can be denoted that there is a favorable agreement between the simulation predicted results and experimental findings with average absolute error (ARE) of about 3.6%. Table 8 compares the achieved data.
Table 8.
Validation of developed 2D simulation.
| Liquid velocity (m/s) | CO2 flux (Experimental findings) (molm-2s−1) | CO2 flux (Simulation result) (molm-2s−1) | ARE (%) |
|---|---|---|---|
| 0.5 | 2.21  10–4 10–4
|
2.27  10–4 10–4
|
2.14 |
| 0.775 | 2.27  10–4 10–4
|
2.31  10–4 10–4
|
1.71 |
| 1.05 | 2.29  10–4 10–4
|
2.4  10–4 10–4
|
4.5 |
| 1.37 | 2.32  10–4 10–4
|
2.47  10–4 10–4
|
6 |
Dimensional concentration profile
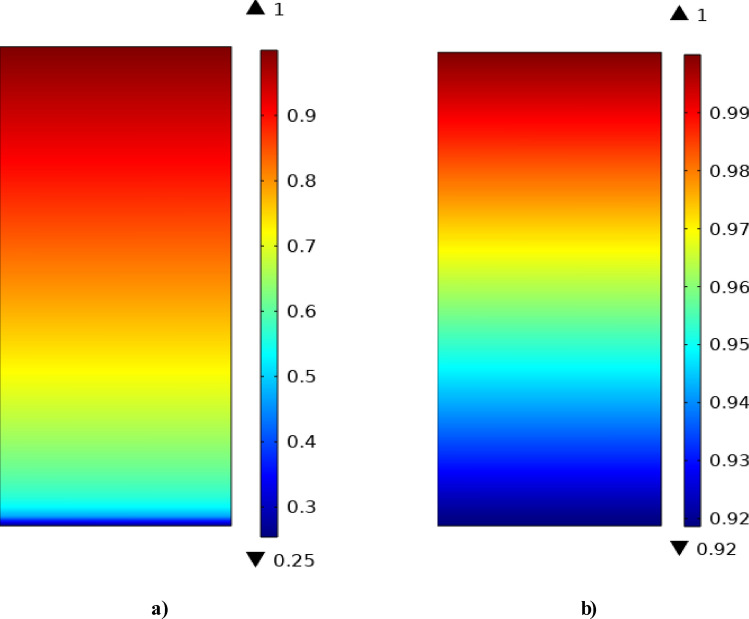
Figure 6 schematically compares the dimensionless concentration gradient (DCG) of CO2 GHG inside the shell of GLMC. As can be seen, the utilization of AMP liquid absorbent significantly reduces the DCG of CO2 in the outlet of shell from 1 to 0.25, which implied 75% separation of inlet CO2. However, 50% wetting of membrane micropores via liquid significantly deteriorates the DCG of CO2 from 1 to y 0.92, which denotes only 8% CO2 removal. Wetting of membrane pores results in increasing the resistance toward the mass transfer of CO2 molecules from shell to membrane pores and then after, tube side of GLMC, which ultimately causes decrement in the removal of inlet CO2 GHG.
Fig. 6.
Dimensionless concentration profile inside the shell of GLMC considering (a) non-wetting and (b) partial-wetting modes of membrane.
Effect of gas flow rate
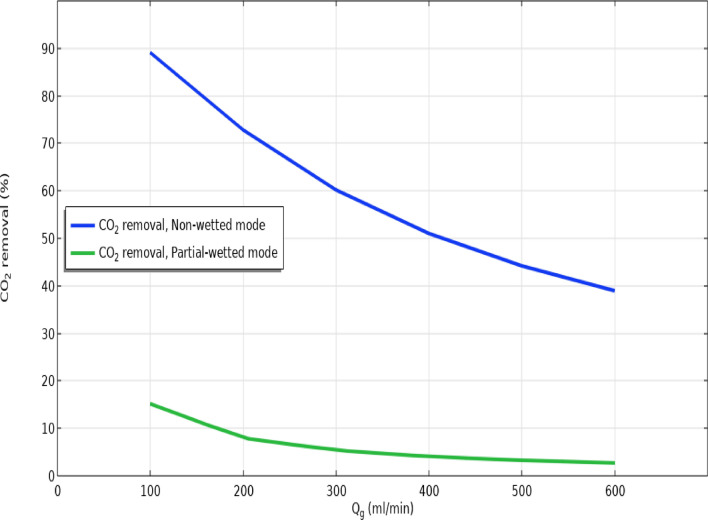
Figure 7 compares the separation percentage of CO2 GHG considering non-wetting and 50% partial wetting of membrane micropores inside the GLMC in different gas flow rates. Operationally, increase in the flow rate of gaseous flow in the shell reduces the residence time of gas and as the result, gas–liquid contact in the membrane-shell interface. This causes the reduction of CO2 separation. Increment of gas flow rates from 100 to 600 ml min−1 declined the separation yield from 89 to 39% in non-wetting and from 15 to about 3% in partial-wetting mode.
Fig. 7.
Impact of gas flow rate on the removal efficacy in non-wetting and 50% partial-wetting of membrane.
Effect of hollow fibers’ count and module length
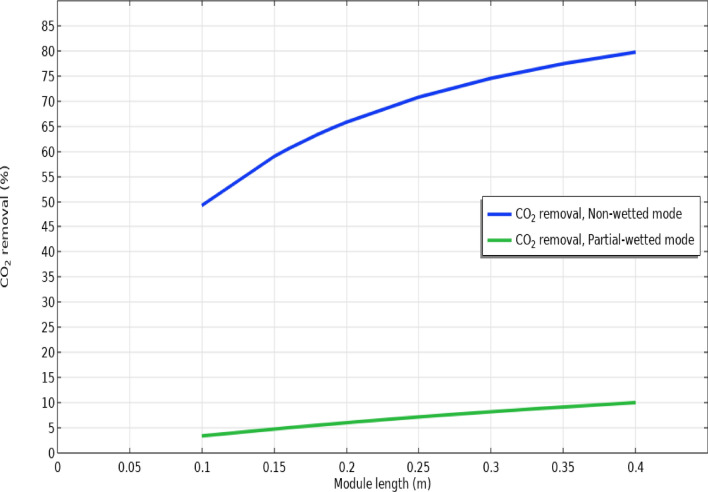
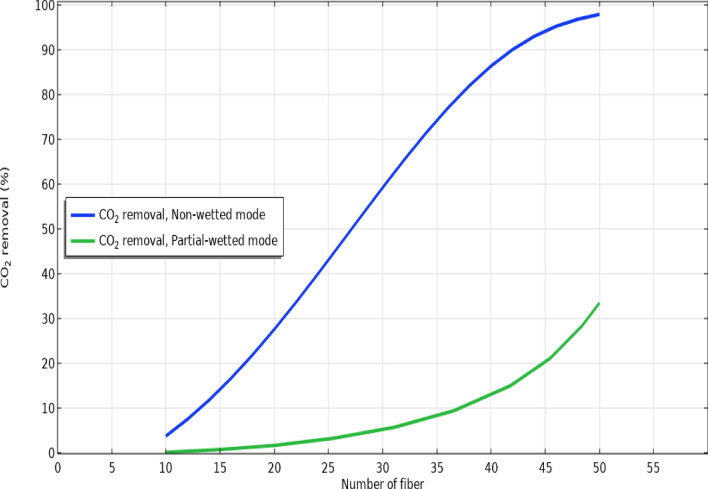
Figures 8 and 9 schematically illustrate the separation performance of CO2 in wide ranges of hollow fiber numbers and module length in non-wetting and partial-wetting modes of membrane during operation, respectively. As demonstrated in Fig. 8, increase in the length of module from 0.1 to 0.4 m enhanced the separation yield from 49.5 to 80% in non-wetting and from 3.5 to 10% on 50% wetting of membrane due to providing greater chance for the contact of CO2 with AMP solution and its better absorption by the absorbent in both non-wetting and partial-wetting modes of membrane.
Fig. 8.
Impact of module length on the removal efficacy in non-wetting and 50% partial-wetting of membrane.
Fig. 9.
Effect of hollow fibers number on the removal efficacy in non-wetting and 50% partial-wetting of membrane.
By glancing at Fig. 9, it is perceived that increase in the hollow fibers’ counts through the GLMC from 10 to 50 considerably improves the separation process due to increasing the contact area and thus, mass transfer of CO2 (from 4 to 97% in non-wetting and from 1 to 32% in partial-wetting modes).
Conclusion
Nowadays, application of GLMCs has been able to open new horizon toward mitigating the anthropogenic emission of environmentally-hazardous CO2 GHG. The prominent purpose of this scientific research is to theoretically evaluate removal of CO2 GHG using novel AMP amine solution in non-wetting and 50% partial-wetting of membrane micropores inside the GLMC. To reach the abovementioned aim, a CFD simulation was developed using COMSOL software. Moreover, momentum and mass transport equations in non-wetting and 50% wetting of membrane were solved via assembling a mathematical model. To ensure the validity of model results, they were compared with experimental data. Based on the achieved findings, AMP can be introduced as an effective amine-based absorbent to separate CO2. Also, it is perceived from the result that 50% wetting of membrane micropores could significantly decreased the separation of CO2 GHG due to enhancing the resistance toward CO2 mass transfer (75% vs. only 8%). Increase in the length of module and hollow fibers’ count positively improved the CO2 GHG capture but increase in the gas flow rate significantly deteriorated the efficacy of CO2 GHG capture.
Acknowledgements
The authors are thankful to the Deanship of Graduate Studies and Scientific Research at Najran University for funding this work under the Easy Funding Program grant code ( NU/EFP/SERC/13/131).
List of symbols

Internal radius of fiber (m)

Exterior radius of fiber (m)

Approximated hypothetical radius around each fiber (m)

Membrane module length (m)

Diffusion coefficient of CO2 in the shell (m2s−1)

Diffusion coefficient of CO2 in the membrane (m2s−1)

Diffusion coefficient of AMP in the shell (m2s−1)

Dimensionless CO2 solubility

Number of fibers

Pressure (Pa)

Initial CO2 concentration in the gas phase (molm−3)

Liquid flow rate (ms−1)

Gas flow rate (ms−1)

Temperature (K)

Average axial velocity of the liquid through the shell (ms−1)

Average axial velocity of gas through the tube (ms−1)

Reaction rate constant (s−1)

Porosity

Tortuosity

Packing factor
Author contributions
A.S: Writing draft, Methodology Z.A: Writing draft V.J: Writing draft, Software R.R: Methodology A.K: Methodology, Software A.K: Analysis, Software M.K: Data curation S.G: Supervision, Funding G.V. S.P: Supervision, Research, Project Administration M.K.A: Project Administration.
Data availability
All data are available within the manuscript.
Declarations
Competing interests
The authors declare no competing interests.
Footnotes
Publisher’s note
Springer Nature remains neutral with regard to jurisdictional claims in published maps and institutional affiliations.
References
- 1.Xue, K. et al. Investigation of membrane wetting for CO2 capture by gas–liquid contactor based on ceramic membrane. Sep. Purif. Technol.304, 122309 (2023). [Google Scholar]
- 2.Nakhjiri, A. T. et al. Modeling and simulation of CO2 separation from CO2/CH4 gaseous mixture using potassium glycinate, potassium argininate and sodium hydroxide liquid absorbents in the hollow fiber membrane contactor. J. Environ. Chem. Eng.6(1), 1500–1511 (2018). [Google Scholar]
- 3.Marjani, A. et al. Evaluation of potassium glycinate, potassium lysinate, potassium sarcosinate and potassium threonate solutions in CO2 capture using membranes. Arab. J. Chem.14(3), 102979 (2021). [Google Scholar]
- 4.Imtiaz, A. et al. A critical review in recent progress of hollow fiber membrane contactors for efficient CO2 separations. Chemosphere325, 138300 (2023). [DOI] [PubMed] [Google Scholar]
- 5.Vaezi, M. et al. Modeling of CO2 absorption in a membrane contactor containing 3-diethylaminopropylamine (DEAPA) solvent. Int. J. Greenh. Gas Control127, 103938 (2023). [Google Scholar]
- 6.Shiravi, A. et al. Hollow fiber membrane contactor for CO2 capture: A review of recent progress on membrane materials, operational challenges, scale-up and economics. Carbon Capt. Sci. Technol.10, 100160 (2024). [Google Scholar]
- 7.Fattah, I. et al. Hollow fiber membrane contactor based carbon dioxide absorption—Stripping: A review. Macromol. Res.31(4), 299–325 (2023). [Google Scholar]
- 8.Shirazian, S. et al. Theoretical investigations on the effect of absorbent type on carbon dioxide capture in hollow-fiber membrane contactors. PLoS ONE15(7), e0236367 (2020). [DOI] [PMC free article] [PubMed] [Google Scholar]
- 9.Nakhjiri, A. T. et al. The effect of membrane pores wettability on CO2 removal from CO2/CH4 gaseous mixture using NaOH, MEA and TEA liquid absorbents in hollow fiber membrane contactor. Chin. J. Chem. Eng.26(9), 1845–1861 (2018). [Google Scholar]
- 10.Li, L. et al. Research progress in gas separation using hollow fiber membrane contactors. Membranes10(12), 380 (2020). [DOI] [PMC free article] [PubMed] [Google Scholar]
- 11.Cao, Y. et al. Recent advancements in molecular separation of gases using microporous membrane systems: A comprehensive review on the applied liquid absorbents. J. Mol. Liq.337, 116439 (2021). [Google Scholar]
- 12.Iliuta, I., Bougie, F. & Iliuta, M. C. CO2 removal by single and mixed amines in a hollow-fiber membrane module—Investigation of contactor performance. AIChE J.61(3), 955–971 (2015). [Google Scholar]
- 13.Nakhjiri, A. T. et al. Experimental investigation and mathematical modeling of CO2 sequestration from CO2/CH4 gaseous mixture using MEA and TEA aqueous absorbents through polypropylene hollow fiber membrane contactor. J. Membr. Sci.565, 1–13 (2018). [Google Scholar]
- 14.Cao, Y., Taghvaie Nakhjiri, A. & Ghadiri, M. Computational fluid dynamics comparison of prevalent liquid absorbents for the separation of SO2 acidic pollutant inside a membrane contactor. Sci. Rep.13(1), 1300 (2023). [DOI] [PMC free article] [PubMed] [Google Scholar]
- 15.Ma, C., Pietrucci, F. & Andreoni, W. CO2 capture and release in amine solutions: To what extent can molecular simulations help understand the trends?. Molecules28(18), 6447 (2023). [DOI] [PMC free article] [PubMed] [Google Scholar]
- 16.Meng, F. et al. Research progress of aqueous amine solution for CO2 capture: A review. Renew. Sustain. Energy Rev.168, 112902 (2022). [Google Scholar]
- 17.National Center for Biotechnology Information. PubChem Compound Summary for CID 11807, 2-Amino-2-methyl-1-propanol. Retrieved October 18, 2024 from; https://pubchem.ncbi.nlm.nih.gov/compound/2-Amino-2-methyl-1-propanol (2024).
- 18.Nakhjiri, A. T. & Heydarinasab, A. CFD analysis of CO2 sequestration applying different absorbents inside the microporous PVDF hollow fiber membrane contactor. Period. Polytech. Chem. Eng.64(1), 135–145 (2020). [Google Scholar]
- 19.Bagi, M. et al. A comprehensive parametric study on CO2 removal from natural gas by hollow fiber membrane contactor: A computational fluid dynamics approach. Chem. Eng., Technol.47(4), 732–738 (2024). [Google Scholar]
- 20.Sayyah Alborzi, Z. et al. Computational fluid dynamics simulation of a membrane contactor for CO2 separation: Two types of membrane evaluation. Chem. Eng. Technol.46(10), 2034–2045 (2023). [Google Scholar]
- 21.Sumayli, A. et al. Comparison of novel ionic liquids and pure water for CO2 separation through membrane contactor: CFD simulation and thermal analysis. Case Stud. Therm. Eng.53, 103856 (2024). [Google Scholar]
- 22.Sumayli, A., Mahdi, W. A. & Alshahrani, S. M. Numerical evaluation of CO2 molecular removal from CO2/N2 mixture utilizing eco-friendly [emim][OAc] and [emim][MeSO4] ionic liquids inside membrane contactor. J. Mol. Liq.396, 123958 (2024). [Google Scholar]
- 23.Nakhjiri, A. T. & Heydarinasab, A. Computational simulation and theoretical modeling of CO2 separation using EDA, PZEA and PS absorbents inside the hollow fiber membrane contactor. J. Ind. Eng. Chem.78, 106–115 (2019). [Google Scholar]
- 24.Cao, Y., Taghvaie Nakhjiri, A. & Sarkar, S. Modelling and simulation of waste tire pyrolysis process for recovery of energy and production of valuable chemicals (BTEX). Sci. Rep.13(1), 6090 (2023). [DOI] [PMC free article] [PubMed] [Google Scholar]
- 25.Rongwong, W., Jiraratananon, R. & Atchariyawut, S. Experimental study on membrane wetting in gas–liquid membrane contacting process for CO2 absorption by single and mixed absorbents. Sep. Purif. Technol.69(1), 118–125 (2009). [Google Scholar]
- 26.Al-Marzouqi, M. et al. Modeling of chemical absorption of CO2 in membrane contactors. Sep. Purif. Technol.gy62(3), 499–506 (2008). [Google Scholar]
- 27.Eslami, S. et al. Modeling and simulation of CO2 removal from power plant flue gas by PG solution in a hollow fiber membrane contactor. Adv. Eng. Softw.42(8), 612–620 (2011). [Google Scholar]
- 28.Happel, J. Viscous flow relative to arrays of cylinders. AIChE J.5(2), 174–177 (1959). [Google Scholar]
- 29.Bird, R., Stewart, W. & Lightfoot, E. Transport Phenomena 2nd edn. (Wiely, 2002). [Google Scholar]
- 30.Cao, Y. et al. Intensification of CO2 absorption using MDEA-based nanofluid in a hollow fibre membrane contactor. Sci. Rep.11(1), 2649 (2021). [DOI] [PMC free article] [PubMed] [Google Scholar]
- 31.Razavi, S. M. R., Shirazian, S. & Nazemian, M. Numerical simulation of CO2 separation from gas mixtures in membrane modules: Effect of chemical absorbent. Arab. J. Chem.9(1), 62–71 (2016). [Google Scholar]
- 32.Babanezhad, M. et al. Computational modeling of transport in porous media using an adaptive network-based fuzzy inference system. ACS Omega5(48), 30826–30835 (2020). [DOI] [PMC free article] [PubMed] [Google Scholar]
- 33.Afza, K. N., Hashemifard, S. & Abbasi, M. Modelling of CO2 absorption via hollow fiber membrane contactors: Comparison of pore gas diffusivity models. Chem. Eng. Sci.190, 110–121 (2018). [Google Scholar]
- 34.Al-Marzouqi, M. H. et al. Modeling of CO2 absorption in membrane contactors. Sep. Purif. Technol.59(3), 286–293 (2008). [Google Scholar]
- 35.Faiz, R. & Al-Marzouqi, M. Mathematical modeling for the simultaneous absorption of CO2 and H2 S using MEA in hollow fiber membrane contactors. J. Membr. Sci.342(1), 269–278 (2009). [Google Scholar]
- 36.Saha, A. K., Bandyopadhyay, S. S. & Biswas, A. K. Solubility and diffusivity of nitrous oxide and carbon dioxide in aqueous solutions of 2-amino-2-methyl-1-propanol. J. Chem. Eng. Data38(1), 78–82 (1993). [Google Scholar]
- 37.Paul, S., Ghoshal, A. K. & Mandal, B. Removal of CO2 by single and blended aqueous alkanolamine solvents in hollow-fiber membrane contactor: modeling and simulation. Ind. Eng. Chem. Res.46(8), 2576–2588 (2007). [Google Scholar]
- 38.Xu, S. et al. Kinetics of the reaction of carbon dioxide with 2-amino-2-methyl-1-propanol solutions. Chem. Eng. Sci.51(6), 841–850 (1996). [Google Scholar]
- 39.Pishnamazi, M. et al. Computational modeling of drug separation from aqueous solutions using octanol organic solution in membranes. Sci. Rep.10(1), 19133 (2020). [DOI] [PMC free article] [PubMed] [Google Scholar]
Associated Data
This section collects any data citations, data availability statements, or supplementary materials included in this article.
Data Availability Statement
All data are available within the manuscript.


