

Abstract
In this study, we explore an enhancement to the U-Net architecture by integrating SK-ResNeXt as the encoder for Land Cover Classification (LCC) tasks using Multispectral Imaging (MSI). SK-ResNeXt introduces cardinality and adaptive kernel sizes, allowing U-Net to better capture multi-scale features and adjust more effectively to variations in spatial resolution, thereby enhancing the model’s ability to segment complex land cover types. We evaluate this approach using the Five-Billion-Pixels dataset, composed of 150 large-scale RGB-NIR images and over 5 billion labeled pixels across 24 categories. The approach achieves notable improvements over the baseline U-Net, with gains of 5.312% in Overall Accuracy (OA) and 8.906% in mean Intersection over Union (mIoU) when using the RGB configuration. With the RG-NIR configuration, these improvements increase to 6.928% in OA and 6.938% in mIoU, while the RGB-NIR configuration yields gains of 5.854% in OA and 7.794% in mIoU. Furthermore, the approach not only outperforms other well-established models such as DeepLabV3, DeepLabV3+, Ma-Net, SegFormer, and PSPNet, particularly with the RGB-NIR configuration, but also surpasses recent state-of-the-art methods. Visual tests confirmed this superiority, showing that the studied approach achieves notable improvements in certain classes, such as lakes, rivers, industrial areas, residential areas, and vegetation, where the other architectures struggled to achieve accurate segmentation. These results demonstrate the potential and capability of the explored approach to effectively handle MSI and enhance LCC results.
Keywords: Image segmentation, Semantic segmentation, Multispectral imaging, Land cover classification, Remote sensing, Computer vision
Subject terms: Computational science, Computer science, Information technology, Planetary science, Engineering
Introduction
Land Cover Classification (LCC) is an approach to map and categorize the variety of physical covers found on the Earth’s surface1–3. Through LCC, areas are delineated based on their predominant attributes, ranging from dense forests and expansive water bodies to bare lands and urban constructions4, offering a schematic representation that illustrates the interaction between physical and biological elements5,6. This classification aids in understanding how various land types are distributed, which is crucial in applications such as city planning, food security, ecological conservation, climate monitoring, sustainable development, resource management, among others7,8.
Currently, LCC is primarily conducted through artificial intelligence methods, specifically computer vision6. Within the realm of computer vision techniques, semantic segmentation stands out as the most commonly applied technique in this area6,9. Semantic segmentation involves the process of partitioning digital images into distinct segments10,11. This is achieved by assigning each pixel of an image to a specific semantic category12, based on the unique characteristics it shares with others in its cluster. This precision at the pixel level allows for a detailed understanding of each component within complex images13. Consequently, it enables a richer interpretation of the landscape, providing more meaningful and actionable insights into the spatial arrangement and physical characteristics of various land types14.
As stated above, computer vision-based segmentation methods have proven effective for LCC; however, much of the research relies on data in the visible spectrum (RGB)15. This type of imagery has often proven insufficient for achieving precise classification16. In this regard, the integration of Multispectral Imagery (MSI) has gained attention. MSI is a type of imagery that captures a wider range of wavelengths6,17, encompassing parts of the electromagnetic spectrum beyond the visible range17,18. This type of imagery allows for a more comprehensive view of the landscape and enhances the ability to distinguish between different structures19, thereby improving the overall accuracy and reliability of LCC.
MSI typically requires specialized equipment to capture the broader range of electromagnetic wavelengths20. Additionally, for LCC, aerial perspectives are generally employed, as they provide the extensive coverage necessary to analyze large land areas effectively6. These requirements have naturally led to the utilization of remote sensing techniques to gather multispectral data7. According to the United States Geological Survey, remote sensing is the method of identifying and monitoring the physical attributes of an area by measuring the radiation it reflects and emits from a distance. This is typically achieved using specialized cameras equipped with various sensors that are integrated into satellites and aircraft21. This technology not only facilitates the acquisition of MSI but also expands the scope of observation, allowing the monitoring of large and inaccessible areas, which consequently enhances the detail and comprehensiveness of LCC studies.
Despite significant advances in the field of LCC, achieving accurate segmentation and classification of semantic information remains an open challenge22. Additionally, the continuous evolution of image acquisition technologies has significantly increased the volume and complexity of data available for analysis23, which represents another major hurdle in this field. U-Net24 is a well-known architecture in the field of semantic segmentation, renowned for its effective and efficient processing capabilities. It features a symmetric encoder-decoder design complemented by skip connections, that allows for precise localization and detailed pixel classification. Due to this, U-Net has been widely adopted for remote sensing and LCC tasks16.
Although U-Net is a notable architecture in semantic segmentation, its application in remote sensing often involves dealing with intricate datasets. Due to this, various researchers have explored modifications to U-Net to enhance its capabilities. A common modification is the improvement of the encoder component. This is typically achieved by integrating other architectures used as feature extractors. Well-known image classification architectures such as ResNet, DenseNet, or Inception are commonly employed9,25–27; however, these models, while robust, are somewhat dated and may not sufficiently address the challenges presented by the modern and dynamic landscapes of Earth’s surface. Therefore, exploration of new refinements that better meet current demands is required.
Based on the above, this work employs a modified U-Net architecture for LCC using MSI. Specifically, we explore the application of SK-ResNeXt as the encoder in U-Net to enhance feature extraction capabilities. SK-ResNeXt combines elements of ResNeXt and Selective Kernel Networks (SK Networks), integrating the multi-path architecture and cardinality of ResNeXt with the adaptive receptive fields of SK convolutions. ResNeXt’s design, centered around increasing cardinality, allows for improved learning capacity without significantly increasing computational complexity, making it well-suited for complex feature extraction. SK Networks, on the other hand, introduce a dynamic selection mechanism that enables the network to choose the most suitable kernel size for each input, providing flexibility in capturing diverse spatial scales. By blending these strengths, SK-ResNeXt captures rich, multi-scale features more effectively than traditional backbones like ResNet or Inception, which lack both the parallel path architecture and adaptive kernel size selection. Therefore, the motivation for using SK-ResNeXt lies in its superior ability to extract complex features effectively, adapting to the spatial variability and spectral richness characteristic of LCC tasks, and ultimately enhancing segmentation performance on multispectral remote sensing data.
For evaluation, the Five-Billion-Pixels dataset has been employed. Released in 2023, this dataset is designed to challenge and benchmark current segmentation methodologies due to its extensive range of precisely annotated pixels. It features four channels and spans 24 diverse categories, offering a robust platform for testing the effectiveness and precision of LCC models under varied and complex scenarios. Additionally, the impact of various combinations of the spectral bands provided by the Five-Billion-Pixels dataset is analyzed to determine how different spectral inputs affect the accuracy and precision of the classification results. This not only tests the adaptability of the modified U-Net to large-scale data challenges but also contributes to bridging the existing gap in the field by offering insights into enhanced LCC methodologies. Extensive comparisons were conducted with other methods to thoroughly evaluate the performance of this segmentation approach.
The main contributions of this work are summarized as follows:
Assessing the effectiveness of the U-Net architecture with an SK-ResNeXt backbone for large-scale LCC using the Five-Billion-Pixels multispectral dataset.
Analyzing how different combinations of spectral bands influence the accuracy and detail of LCC results.
Establishing a benchmarking framework for assessing the effectiveness of segmentation techniques in large-scale, multi-category land cover datasets.
Related work
Given U-Net’s strong performance, it has become a widely studied architecture, especially in LCC tasks. Moreover, substantial prior research has explored various modifications to its components, particularly the encoder, to more effectively leverage the information provided by MSI in complex segmentation scenarios.
One of the most common options for replacing the encoder in U-Net is with Residual Networks (ResNets)28. ResNet is a Convolutional Neural Network (CNN) whose key innovation lies in the incorporation of residual connections29. These connections help to mitigate gradient vanishing and reduce information loss as data flows through the network30, making it possible to train deeper networks and extract rich feature representations. Consequently, ResNet is frequently used as a backbone for U-Net in LCC tasks. For instance, Ni et al.31 and Cao et al.32 both employ U-Net with the lightweight ResNet18 as the encoder backbone for segmenting RG-NIR images into six classes. Fan et al.33 use a ResNet50 as a feature extractor for RGB-NIR imagery to map urban areas in China across eight classes, while Gül et al.34 adopt a similar approach, using ResNet50 for RG-NIR segmentation into six classes. Increasing the encoder complexity, Ismael et al.35 replace U-Net’s backbone with a ResNet101 for RG-NIR segmentation across six classes.
In addition to ResNet variants, some studies have explored the use of ResNeXt as an encoder for U-Net in LCC tasks. ResNeXt, an evolution of ResNet, introduces cardinality through parallel paths in each residual block, allowing multiple pathways to process different aspects of the input, thus enhancing feature extraction capacity without significantly increasing parameter complexity36. Fan et al.37 implement this approach in RG-NIR segmentation for six classes using ResNeXt50 as the backbone. Jinsong et al.38 and Li et al.39 apply a similar model but increase the encoder’s capacity by using ResNeXt101 to further improve U-Net’s feature extraction capabilities, also for RG-NIR segmentation across six categories.
The use of techniques beyond ResNet has also been explored in U-Net encoders. For instance, Cui et al.9 investigate the use of DenseNet as an encoder for U-Net to segment RGB-NIR images into eleven classes. In this case, DenseNet’s dense connections improve gradient flow across all layers, enhancing parameter efficiency and feature extraction capabilities40. However, recent trends have shifted towards advanced approaches, such as Vision Transformers (ViTs). The ViT adapts the Transformer architecture, widely used in natural language processing, for vision tasks by dividing images into patches treated as token sequences41. This structure enables ViT to capture global relationships within the image through self-attention mechanisms42, excelling at identifying large-scale patterns without relying on convolutions. For example, Barr43 employ ViT to enhance the U-Net encoder, combining it with the original encoder by first processing the input through CNN layers, followed by transformer layers, creating a rich feature representation. This approach is used for RGB-NIR segmentation across six land cover classes. Similarly, Zhang et al.44 replace the U-Net encoder with a ViT variant, the Swin Transformer45, for RG-NIR segmentation into six classes. This approach leverages the Swin Transformer’s sliding windows to partition the image into local patches, allowing it to model long-range spatial dependencies and simultaneously obtain hierarchical features. Additionally, Fan et al.46 and He et al.47 also utilize the Swin Transformer, integrating it in parallel with U-Net’s CNN encoder to enhance feature extraction. Both approaches are tested on RG-NIR images with six land cover classes.
As evidenced in the literature, research on enhancing, modifying, or replacing the encoder in U-Net is an area of significant interest and has been widely explored. Over time, these improvements have made U-Net more adaptable and increasingly capable of handling the challenges posed by LCC and MSI. However, certain considerations, limitations, and challenges remain unaddressed. First, for models to be used in real-world applications, they must be trained and evaluated on large and diverse datasets. The related work shows that many studies evaluate their approaches on datasets with relatively few classes. While these datasets allow for testing new encoder integrations, they may not fully capture the variability and complexity of real-world land cover, where classification requirements are considerably more nuanced. As a result, approaches tested on such limited datasets may face challenges when applied to broader LCC tasks.
Additionally, although many studies have integrated effective encoders such as ResNet, DenseNet, or even Transformers, certain limitations in terms of accuracy and efficiency remain. Architectures like ResNet can perform well in specific scenarios, but they may face challenges when handling datasets with numerous classes, particularly when these include multiple spectral bands beyond typical RGB. Furthermore, although advanced architectures like ViTs demonstrate strong performance in feature extraction, they require calculating relationships across all positions, which leads to high computational complexity and increased time and resource costs for training and inference. As Fan et al.37 point out, despite efforts to optimize Transformer efficiency, processing high-resolution remote sensing images with these models still incurs considerable computational costs, limiting their practical applicability.
These findings suggest that the continuous exploration of new encoder modifications is essential to enhance the adaptability and accuracy of U-Net-based models, especially for complex MSI datasets. LCC increasingly demands segmentation models that balance high feature extraction capabilities with computational efficiency. Therefore, work focused on exploring new modifications and improvements in this area remains an open research challenge for developing robust models capable of meeting real-world demands.
Methods
Dataset description
For this study, the Five-Billion-Pixels dataset8 is utilized. This large-scale land cover classification dataset consists of over 5 billion manually annotated pixels derived from 150 high-resolution Gaofen-2 satellite images. These images cover more than 50,000 square kilometers across over 60 administrative districts in China. The dataset is categorized into 24 distinct classes, including artificial, agricultural, and natural land cover types, providing a diverse and comprehensive representation of real-world terrestrial objects, as shown in Fig. 1. Five-Billion-Pixels can be considered an extension of the well-known GID dataset48, providing rich category diversity, extensive geographical coverage, and high spatial resolution of 4 m. These features make it a novel and challenging resource for advancing research in data-driven methodologies related to land cover classification. The images in the dataset include four spectral bands: Blue (0.45-0.52  ), Green (0.52-0.59
  ), Red (0.63-0.69
  ), and NIR (0.77-0.89
  ), with an image resolution of 6800
 7200 pixels. The dataset is available in both 8-bit and 16-bit formats. In addition to the images and masks, the dataset provides coordinate information and is freely accessible.
Fig. 1.

Example images of the Five-Billion-Pixels dataset used in this work. The dataset consists of 24 classes, plus an additional ‘unlabeled’ class annotated with black color.
Model description
U-Net overview
U-Net, shown in Fig. 2, is a U-shaped CNN architecture built on an encoder-decoder paradigm47,49. This architecture features two symmetric pathways: a contraction path (encoder) that compresses the spatial resolution of feature maps while capturing the image context, and an expansion path (decoder) that progressively restores the spatial resolution to construct the segmented output47,50. U-Net is distinguished by its use of skip connections that concatenate feature maps from the encoder with each up-sampled feature map from the decoder at corresponding stages51,52. This integration allows U-Net to merge low-level features from the encoder with high-level features from the decoder, enhancing the precision of the segmentation51. Initially designed for medical image segmentation53, U-Net has been effectively adapted to other fields, where it maintains robust performance, establishing itself as a standard in various segmentation tasks, such as remote sensing segmentation16.
Fig. 2.
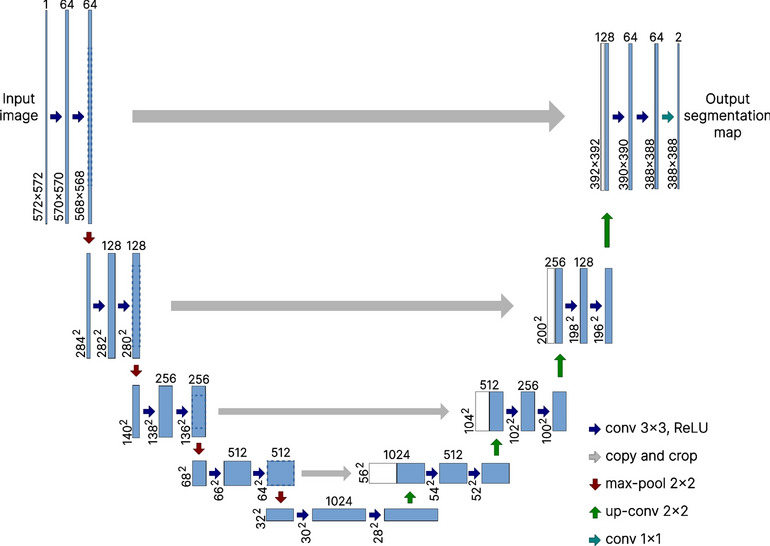
U-Net architecture structure.
SK-ResNeXt overview
SK-ResNeXt is a CNN architecture that combines the strengths of ResNeXt54 and SK Networks55. This architecture was developed to address the challenge faced by CNNs in achieving a balance between depth and computational efficiency. In other words, SK-ResNeXt was designed to attain enhanced accuracy without excessively increasing computational complexity. To fully understand the design principles and the benefits of SK-ResNeXt, it is necessary to delve into its foundational components and comprehend the synergy between them.
To begin, ResNeXt builds upon the ResNet architecture but replaces the simple, single-path design of ResNet with multiple parallel paths, similar to those employed in Inception models56. This structure allows the network to learn a broader and more diverse set of features. The key innovation of this is the cardinality, a factor representing the number of parallel transformation paths within each block of the network36,57. Cardinality acts as a third dimension alongside depth and width, enabling scalable complexity in the network’s architecture36. Unlike the traditional approach of increasing depth and width, which often leads to excessive computational complexity58,59, cardinality offers a more refined strategy. By increasing the number of parallel paths, ResNeXt enhances the network’s learning capacity without a proportional increase in complexity. This design facilitates the extraction of complex features while maintaining relatively low computational resource consumption. This is accomplished through a split-transform-merge strategy, shown in Fig. 3, that divides the input into multiple parallel paths. In each path, a transformation based on a common structural design is applied. Finally, the outputs from each path are merged.
Fig. 3.

Comparison between a ResNet block (left) and a ResNeXt block (right) with a cardinality of 32 parallel paths.
SKNet, meanwhile, address the limitation of fixed receptive field sizes in standard convolutional layers by introducing a mechanism that allows the network to adaptively adjust its receptive field size based on the input data60. This mechanism relies on the use of Selective Kernel (SK) convolutions, which serve as the fundamental building blocks of the entire architecture. Each SK convolution unit contains multiple branches with different kernel sizes that are subsequently fused61. More specifically, each SK convolution is implemented through a split-fuse-select strategy62. In this design, the input is split and passed through multiple branches comprising convolutional layers with varying kernel sizes. The outputs from these branches are then combined, typically via element-wise operations. Finally, an attention mechanism evaluates and selects the kernel size most relevant to the given input61. An example of this mechanism can be observed in Fig. 4, which illustrates a dual-branch approach. This allows the architecture to enhance its ability to model complex patterns more effectively.
Fig. 4.

Dual-branch selective kernel convolution.
While ResNeXt enhances model capacity through the use of cardinality, it still relies on fixed receptive field sizes in its convolutions. SKNet introduces adaptability in receptive fields but does not incorporate the concept of cardinality. SK-ResNeXt integrates these two architectures to leverage the strengths of both. In this combined model, the fixed-size convolutions within the ResNeXt bottleneck blocks are replaced with SK convolutions, effectively incorporating SK units into the parallel paths of the ResNeXt architecture. The network thus preserves the cardinality from ResNeXt, allowing multiple SK units to operate in parallel, and the use of SK units enables each path to adaptively select the most appropriate receptive field size. This combination results in a network capable of capturing rich, multi-scale features from complex visual data while maintaining computational efficiency, leading to improved generalization and effectiveness in various computer vision applications.
Encoder integration
Based on the principles discussed above, integrating SK-ResNeXt as the encoder in U-Net is motivated by the specific demands of LCC tasks using MSI. In this context, SK-ResNeXt’s combination of cardinality and adaptive receptive fields is particularly advantageous. The ability to dynamically adjust receptive field sizes allows the model to capture fine-grained spectral details across multiple scales, which is crucial for accurately distinguishing varied land cover types. Additionally, SK-ResNeXt’s multi-path design facilitates the extraction of a broader set of features, enhancing the model’s ability to differentiate complex patterns in multispectral data. Thus, this integration is expected to yield a segmentation model that can leverage MSI’s rich information effectively, improving segmentation performance and adaptability without significantly increasing computational demands.
Integrating SK-ResNeXt into the U-Net architecture involves replacing the standard encoder of U-Net with the SK-ResNeXt model. This integration capitalizes on the advanced feature extraction capabilities of SK-ResNeXt while maintaining the efficient decoding and up-sampling mechanisms of the U-Net. In this integration, the encoder is constructed using SK-ResNeXt blocks, as shown in Fig. 5, where each block comprises SK convolutional units that replace the fixed-size convolutions found in traditional U-Net encoders. These SK units allow the network to adjust its receptive field sizes dynamically, enabling the extraction of richer and more diverse features at multiple scales. The encoder thus benefits from the ability to model complex patterns within the visual data more effectively. The skip connections between the encoder and decoder are maintained to ensure that spatial information is preserved throughout the network. Outputs from the SK-ResNeXt blocks at various stages of the encoder are connected directly to corresponding layers in the decoder. The decoder remains unchanged, continuing to perform up-sampling and feature reconstruction to generate the final output. This results in a model that can capture complex, multi-scale features more effectively, leading to improved segmentation performance without substantially increasing computational complexity.
Fig. 5.

High-level diagram of the U-Net architecture modified with an SK-ResNeXt encoder utilized in this research.
Evaluation metrics
In LCC tasks, several metrics are commonly employed to assess the performance of models. In this study, we have selected three metrics that are widely recognized and employed in similar studies within the field of semantic segmentation63–67. Below, we detail each metric and explain its application in evaluating the precision and reliability of our classification results.
Overall accuracy
The Overall Accuracy (OA) is a metric that measures the proportion of pixels correctly identified in an image6,68, serving as an indicator of a semantic segmentation model’s general performance. A higher OA signifies better performance, with more pixels correctly identified according to their true classifications. Mathematically it is defined as shown in Eq. (1):
 |
1 |
where TP represents the true positives, TN the true negatives, FP the false positives, and FN the false negatives.
Intersection over union
The Intersection over Union (IoU) provides a ratio from 0 to 1 that measures the overlap between the model’s predictions and the actual data69, with 0 indicating no overlap and 1 indicating perfect congruence. A high IoU score suggests that the model effectively captures all relevant pixels in both presence and absence, mirroring the ground-truth closely6. This metric is calculated as shown in Eq. (2):
 |
2 |
where  represents the intersection, or the count of pixels accurately identified as part of the target class by both the prediction and the ground-truth; and
  , the union, includes all pixels labeled as the target class in either the predicted or actual data.
Mean intersection over union
The mean Intersection over Union (mIoU) expands on the IoU metric by calculating an average of IoU scores for each class within a dataset68,69. This method provides a balanced measure of a model’s segmentation performance across diverse class types. mIoU is defined as shown in Eq. (3):
 |
3 |
where C represents the number of classes, and  is the
  score for the
  class. mIoU ranges from 0 to 1, where higher values close to 1 denote more precise segmentation capabilities across the entire spectrum of categories in the dataset.
Implementation details and procedure
For the experiments, we integrated a 50-layer SK-ResNeXt with a cardinality of 32 into the U-Net architecture. The implementation was carried out entirely in Python using the PyTorch framework, utilizing code from its vision models library as the foundation. The dataset, originally consisting of large tiles, was cropped into 256 256 patches to facilitate processing. After patching, it was split into 80% for training and 20% for evaluation. To enhance the diversity of the training data and improve model generalization, data augmentation techniques were applied, including random horizontal flips, random vertical flips, and random rotations ranging from 0 to 360 degrees. The training was conducted over a maximum of 120 epochs, with the best model saved at each epoch based on the lowest loss. This number of epochs is consistent with that used by the authors of the dataset they employed in their experiments. Adam optimizer was used with a learning rate of
  , cross-entropy as the loss function, and a batch size of 128. The hardware setup consisted of four Nvidia A100 SXM4 40GB GPUs, 64 CPU cores, and 128 GB of RAM.
The impact of different combinations of spectral bands was evaluated in three configurations: starting with the basic RGB, then replacing the blue band with NIR (RG-NIR), and finally adding the NIR band to the complete visible set (RGB-NIR). These combinations were chosen because they are commonly used in similar studies64,68–71 in the field of LCC and MSI. To handle the varying number of channels, we modified the first layer of the architecture to accommodate the desired input configurations. For comparison, we also trained U-Net, PSPNet, DeepLabV3, DeepLabV3+, SegFormer, and Ma-Net architectures using a variety of encoders, including ResNet50, VGG16, MobileNetV2, and MobileNetV3 under the same training parameter settings mentioned above.
Results and discussion
To begin the analysis of results, Table 1 presents the segmentation metrics of all models trained with various encoder and band combinations. Additionally, it includes three efficiency indicators to provide a comprehensive assessment of the models’ computational performance.
Table 1.
Quantitative results for all models according to their band combinations. Training time is measured for 120 epochs.
| Model | Encoder | Band combination | OA (%) | mIoU (%) | Training time (hours) | Inference time (seconds) | Epoch best model |
|---|---|---|---|---|---|---|---|
| U-Net | SK-ResNeXt50 | RGB | 79.010 | 53.161 | 4.129 | 0.010 | 113 |
| RG-NIR | 79.533 | 53.255 | 4.066 | 0.010 | 115 | ||
| RGB-NIR | 80.561 | 54.394 | 4.283 | 0.011 | 109 | ||
| U-Net | - | RGB | 75.025 | 48.814 | 3.602 | 0.003 | 118 |
| RG-NIR | 74.380 | 49.800 | 3.890 | 0.003 | 117 | ||
| RGB-NIR | 76.106 | 50.461 | 4.465 | 0.003 | 117 | ||
| ResNet50 | RGB | 78.859 | 52.740 | 3.395 | 0.006 | 116 | |
| RG-NIR | 78.279 | 52.547 | 3.212 | 0.006 | 116 | ||
| RGB-NIR | 77.522 | 52.208 | 3.539 | 0.006 | 115 | ||
| VGG16 | RGB | 78.417 | 52.814 | 3.326 | 0.009 | 119 | |
| RG-NIR | 78.157 | 52.699 | 3.223 | 0.009 | 117 | ||
| RGB-NIR | 78.482 | 52.921 | 3.552 | 0.006 | 120 | ||
| MobileNetV2 | RGB | 78.654 | 52.369 | 3.375 | 0.010 | 120 | |
| RG-NIR | 78.022 | 51.930 | 3.512 | 0.009 | 120 | ||
| RGB-NIR | 76.798 | 50.121 | 3.802 | 0.010 | 119 | ||
| DeepLabV3+ | ResNet50 | RGB | 79.669 | 53.484 | 3.443 | 0.005 | 118 |
| RG-NIR | 79.866 | 53.730 | 3.154 | 0.005 | 120 | ||
| RGB-NIR | 79.970 | 54.008 | 3.473 | 0.006 | 120 | ||
| MobileNetV2 | RGB | 79.144 | 51.906 | 2.840 | 0.005 | 120 | |
| RG-NIR | 78.145 | 51.136 | 2.854 | 0.006 | 120 | ||
| RGB-NIR | 79.337 | 51.949 | 3.083 | 0.006 | 118 | ||
| MobileNetV3 | RGB | 78.925 | 52.271 | 3.465 | 0.006 | 120 | |
| RG-NIR | 79.566 | 52.475 | 3.516 | 0.006 | 120 | ||
| RGB-NIR | 79.350 | 52.170 | 3.626 | 0.006 | 118 | ||
| PSPNet | ResNet50 | RGB | 76.436 | 48.875 | 2.920 | 0.003 | 119 |
| RG-NIR | 75.238 | 47.372 | 2.999 | 0.003 | 120 | ||
| RGB-NIR | 77.418 | 50.213 | 3.126 | 0.003 | 120 | ||
| VGG16 | RGB | 77.483 | 50.236 | 3.292 | 0.004 | 118 | |
| RG-NIR | 78.067 | 50.629 | 3.147 | 0.003 | 119 | ||
| RGB-NIR | 77.719 | 50.075 | 3.183 | 0.003 | 120 | ||
| MobileNetV2 | RGB | 75.739 | 46.193 | 2.580 | 0.003 | 119 | |
| RG-NIR | 76.159 | 46.371 | 2.610 | 0.003 | 115 | ||
| RGB-NIR | 76.493 | 46.695 | 2.959 | 0.003 | 120 | ||
| Ma-Net | ResNet50 | RGB | 75.623 | 48.006 | 3.789 | 0.003 | 115 |
| RG-NIR | 77.403 | 50.281 | 3.648 | 0.003 | 117 | ||
| RGB-NIR | 78.556 | 52.110 | 3.985 | 0.003 | 119 | ||
| VGG16 | RGB | 78.732 | 51.241 | 3.689 | 0.003 | 118 | |
| RG-NIR | 77.871 | 51.132 | 3.477 | 0.003 | 115 | ||
| RGB-NIR | 77.938 | 51.019 | 3.776 | 0.003 | 112 | ||
| MobileNetV2 | RGB | 79.313 | 50.883 | 3.552 | 0.003 | 120 | |
| RG-NIR | 78.329 | 50.722 | 3.544 | 0.003 | 120 | ||
| RGB-NIR | 78.858 | 50.783 | 3.888 | 0.003 | 120 | ||
| DeepLabV3 | ResNet50 | RGB | 79.940 | 54.106 | 4.308 | 0.006 | 120 |
| RG-NIR | 79.154 | 53.764 | 4.376 | 0.006 | 120 | ||
| RGB-NIR | 79.880 | 53.890 | 4.613 | 0.006 | 120 | ||
| MobileNetV2 | RGB | 78.682 | 51.843 | 3.724 | 0.008 | 118 | |
| RG-NIR | 78.825 | 51.795 | 3.895 | 0.006 | 118 | ||
| RGB-NIR | 79.111 | 51.957 | 3.965 | 0.006 | 120 | ||
| MobileNetV3 | RGB | 79.100 | 51.962 | 3.570 | 0.006 | 120 | |
| RG-NIR | 79.071 | 51.954 | 3.620 | 0.006 | 118 | ||
| RGB-NIR | 79.163 | 52.345 | 3.779 | 0.006 | 119 | ||
| SegFormer | - | RGB | 71.334 | 42.381 | 2.682 | 0.012 | 108 |
| RG-NIR | 71.716 | 43.100 | 2.684 | 0.012 | 119 | ||
| RGB-NIR | 72.794 | 44.264 | 2.976 | 0.013 | 111 |
Starting with the computational efficiency, the training times show that PSPNet models with the MobileNetV2 encoder require the least amount of training time, never exceeding three hours across all three band combinations. This is even lower than SegFormer, the second fastest model in training time, which also stayed under three hours but consistently took slightly longer than PSPNet. Conversely, the models that take the longest to train are the DeepLabV3 models with the ResNet50 encoder, with times exceeding 4.3 hours. Regarding U-Net + SK-ResNeXt50, which is the main focus of this study, these models exhibit training times over 4 hours; however, it is important to highlight that despite having an encoder that is clearly more advanced than the others, it does not report the highest training times. In fact, when compared to the vanilla U-Net, which is the most direct natural reference, the training times of U-Net + SK-ResNeXt50 show little differences. Specifically, for the RGB combination, it takes 0.527 hours more; for RG-NIR, 0.176 hours more; and it is even faster for RGB-NIR, taking 0.182 hours less. This demonstrates that the SK-ResNeXt50’s design effectively balances advanced feature extraction capabilities with computational efficiency. This is especially significant for large-scale applications and environments with limited computational resources, as it demonstrates that this approach does not necessarily imply prohibitive training costs.
Continuing with the inference times, the PSPNet, Ma-Net, and vanilla U-Net models demonstrate the fastest inference speeds, predominantly around 0.003 seconds, except for the specific case of PSPNet with the VGG16 encoder and RGB combination, which registers 0.004 seconds, a minimal difference. DeepLabV3 and DeepLabV3+, with their various encoders, exhibit intermediate inference times ranging from 0.005 to 0.008 seconds. The U-Net + SK-ResNeXt50 approach registers relatively high inference times, measuring 0.010 seconds for the RGB and RG-NIR combinations and reaching 0.011 seconds for RGB-NIR. However, SegFormer proves to be the slowest model in terms of inference, slightly above U-Net + SK-ResNeXt50. Specifically, this approach records 0.012 seconds for RGB and RG-NIR, and 0.013 seconds for RGB-NIR, with the latter being the slowest inference time among all approaches analyzed. Although U-Net + SK-ResNeXt50 is slightly slower than the other models, it is important to note that these inference times do not represent a significant disadvantage, as the absolute differences are minimal and do not noticeably impact performance in practical applications.
Moving on to the epoch in which the best model was achieved, this indicator provides insight into how quickly models converge to an optimal performance level. In turn, this allows an assessment of resource efficiency, as a model that converges faster requires less training time to reach its peak performance, which is favorable in terms of resource savings. In this regard, a certain parity is observed between U-Net + SK-ResNeXt50 and SegFormer as the models that converge the fastest. U-Net + SK-ResNeXt50 stands out particularly with the RG-NIR and RGB-NIR combinations, converging at epochs 115 and 109, respectively. This indicates that U-Net + SK-ResNeXt50 effectively leverages the non-visible bands to accelerate convergence, highlighting its adaptability in utilizing multispectral information for enhanced feature extraction. SegFormer, on the other hand, shows the fastest convergence with the RGB combination, reaching it at epoch 108, ahead of U-Net + SK-ResNeXt50’s 113 epochs. The comparison with other models shows that U-Net + SK-ResNeXt50 has clear advantages in learning efficiency, as it requires fewer computational resources to reach its optimal performance. This is especially evident when comparing this approach to others, such as Ma-Net + MobileNetV2 or DeepLabV3 + ResNet50, whose best models were achieved in the final epoch of training, reflecting that these models converge more slowly and may require extended training periods to reach their peak. Additionally, compared to U-Net, its most direct reference, U-Net + SK-ResNeXt50 also converges a few epochs earlier, demonstrating that integrating SK-ResNeXt50 as the U-Net encoder does not impose a computational cost that compromises efficiency.
Examining the segmentation performance (Table 1), we observe that, overall, the U-Net + SK-ResNeXt50 approach outperforms models such as PSPNet, Ma-Net, and U-Net with various encoder configurations in terms of both OA and mIoU. Specifically, compared to the vanilla U-Net, U-Net + SK-ResNeXt50 achieves OA improvements of 5.312% for the RGB combination, 6.928% for RG-NIR, and 5.854% for RGB-NIR. Similarly, in terms of mIoU, it demonstrates enhancements of 8.906% for RGB, 6.938% for RG-NIR, and 7.794% for RGB-NIR. These figures highlight a significant performance gain of the U-Net + SK-ResNeXt50 over its baseline, especially considering the relatively modest increase in training time discussed earlier. Compared to DeepLabV3 and DeepLabV3+, particularly with ResNet50 as encoder, U-Net + SK-ResNeXt50 exhibits improvements as well. Specifically, with the RGB-NIR band combination, U-Net + SK-ResNeXt50 achieves a 0.935% and 0.715% increase in mIoU over DeepLabV3 and DeepLabV3+, respectively, and a 0.853% and 0.739% increase in OA. This configuration of U-Net + SK-ResNeXt50 with RGB-NIR bands stands out as the best across all models, encoders, and band combinations evaluated. SegFormer exhibits the lowest performance in our experiments, possibly due to its greater architectural complexity, which may require further fine-tuning or adjustments to fully capture the spatial and spectral details needed for effective LCC. U-Net + SK-ResNeXt50 demonstrates substantial improvements over SegFormer, with over a 10% increase in OA and a more than 20% improvement in mIoU across all band combinations. Overall, the results demonstrate that U-Net + SK-ResNeXt50 is a robust and superior approach compared to other models, particularly when using multispectral data. These improvements in accuracy more than compensate for the slight increase in inference time observed earlier.
Examining the overall impact of the different spectral band combinations in terms of OA and mIoU, we observe that while the inclusion of the NIR band generally has a positive effect on the results, this effect is not consistently observed across all cases. For example, in the case of U-Net with a ResNet50 encoder, the best performance in terms of OA and mIoU is achieved with the standard RGB combination. In this scenario, replacing the blue band with NIR results in a decrease of 0.735% in OA and 0.366% in mIoU. Furthermore, adding NIR to the RGB bands leads to an even greater decrease, with reductions of 1.695% in OA and 1.009% in mIoU. A similar pattern is observed with U-Net employing a MobileNetV2 encoder. In other cases, an alternating trend is noted where replacing the blue band with NIR does not produce improvements, but adding NIR to the complete set of visible bands does enhance performance. This behavior is evident in most cases, indicating that the most consistent improvements occur with the four-channel combination (RGB-NIR). In the case of U-Net + SK-ResNeXt50, a progressive improvement is observed with the incorporation of the NIR band. Specifically, using the RG-NIR combination yields an improvement of 0.662% in OA and 0.177% in mIoU over the RGB configuration. Notably, the addition of NIR to the full set of visible bands results in the best performance, with enhancements of 1.963% in OA and 2.319% in mIoU compared to RGB alone. This improvement is likely attributable to the design of the SK-ResNeXt encoder, which is specifically engineered to enhance feature extraction. Unlike less advanced encoders, the cardinality and adaptability of SK-ResNeXt enable it to more effectively leverage the additional information provided by the NIR band, facilitating the extraction of richer features and consequently improving segmentation outcomes.
For a more detailed analysis regarding the impact of spectral bands, Table 2 presents the IoU results for each of the 24 classes in the dataset. In this case, we have focused on the models and encoders that showed the best overall performance (Table 1). The table shows that U-Net + SK-ResNeXt50 dominates in several classes, especially when using RGB-NIR, where it demonstrates the most notable improvements. For example, in the class Park, an IoU of 17.129% is observed, representing an improvement of 32.906% over the second-best result of 12.888% reported by DeepLabV3 with a ResNet50 encoder. This improvement is justified by the high reflectance of vegetation in the NIR band and the ability of the SK-ResNeXt encoder to better exploit this information, leading to enhanced differentiation of cover types. A similar pattern is observed in the category Squa, a type of area where vegetation is also often present, achieving 12.750% compared to 8.981% by DeepLabV3+ with a ResNet50 encoder. In other classes such as Fish, Pond, Snow, Stadium, Road, Rura, Natu, Arti, and Indu, U-Net + SK-ResNeXt50 with RGB-NIR also demonstrates superior performance. Although in some classes U-Net + SK-ResNeXt50 using RGB-NIR does not report the best numbers, it consistently maintains a minimal difference, which, combined with its significant advantage in specific classes, confirms the superiority shown in the overall metrics.
Table 2.
Evaluation results of IoU by class.
| Model | Bands | Indu | Padd | Irri | Dryc | Gard | Arbo | Shru | Park | Natu | Arti | River | Urba |
|---|---|---|---|---|---|---|---|---|---|---|---|---|---|
| U-Net | RGB | 40.959 | 36.273 | 57.470 | 43.288 | 8.170 | 48.605 | 3.122 | 5.453 | 28.985 | 16.304 | 53.615 | 52.973 |
| RG-NIR | 40.706 | 36.410 | 63.080 | 46.500 | 16.911 | 54.324 | 10.256 | 12.757 | 29.035 | 18.724 | 49.104 | 56.360 | |
| RGB-NIR | 43.919 | 34.866 | 58.475 | 40.438 | 10.020 | 49.915 | 8.854 | 7.630 | 32.734 | 17.072 | 55.794 | 52.973 | |
| DeepLabV3+ (ResNet50) | RGB | 45.148 | 38.478 | 64.177 | 38.581 | 16.798 | 54.533 | 7.853 | 8.746 | 33.896 | 19.172 | 60.045 | 57.761 |
| RG-NIR | 43.506 | 38.497 | 62.885 | 46.444 | 16.335 | 54.123 | 8.801 | 6.139 | 31.273 | 18.339 | 59.857 | 57.122 | |
| RGB-NIR | 45.890 | 41.401 | 63.014 | 50.464 | 21.398 | 54.846 | 8.640 | 7.078 | 32.688 | 18.880 | 58.802 | 57.735 | |
| Ma-Net (MobileNetV2) | RGB | 43.473 | 31.299 | 60.053 | 44.157 | 11.700 | 51.026 | 5.490 | 2.348 | 34.028 | 17.597 | 52.940 | 56.603 |
| RG-NIR | 42.540 | 36.102 | 62.718 | 38.286 | 15.526 | 49.713 | 6.177 | 2.952 | 30.795 | 20.314 | 58.670 | 56.091 | |
| RGB-NIR | 39.407 | 33.540 | 64.138 | 38.044 | 18.201 | 48.424 | 4.044 | 1.147 | 32.160 | 15.845 | 59.201 | 55.175 | |
| DeepLabV3 (ResNet50) | RGB | 45.392 | 39.515 | 63.540 | 40.529 | 20.101 | 56.472 | 7.636 | 12.354 | 34.737 | 18.835 | 58.904 | 57.817 |
| RG-NIR | 44.163 | 39.549 | 63.829 | 46.319 | 18.805 | 54.907 | 7.832 | 10.459 | 31.325 | 17.955 | 59.477 | 57.938 | |
| RGB-NIR | 44.201 | 38.490 | 63.907 | 43.168 | 17.438 | 55.979 | 7.968 | 12.888 | 33.000 | 18.981 | 59.476 | 57.738 | |
| PSPNet (VGG16) | RGB | 41.783 | 35.954 | 62.250 | 28.212 | 11.226 | 51.738 | 5.659 | 6.034 | 30.563 | 11.199 | 51.992 | 55.375 |
| RG-NIR | 41.155 | 35.188 | 62.422 | 46.133 | 13.220 | 53.377 | 6.677 | 2.572 | 28.391 | 9.717 | 52.747 | 54.849 | |
| RGB-NIR | 39.117 | 35.067 | 58.956 | 43.207 | 15.205 | 52.049 | 6.375 | 10.039 | 28.893 | 15.199 | 53.307 | 55.640 | |
| SegFormer | RGB | 33.621 | 21.934 | 51.796 | 21.737 | 6.872 | 47.123 | 3.323 | 1.000 | 24.354 | 2.515 | 40.164 | 47.359 |
| RG-NIR | 31.144 | 28.257 | 54.425 | 26.189 | 5.358 | 45.575 | 2.020 | 0.907 | 18.482 | 3.925 | 42.427 | 48.451 | |
| RGB-NIR | 32.618 | 29.341 | 54.922 | 28.211 | 5.991 | 49.873 | 2.258 | 1.003 | 23.846 | 4.051 | 46.089 | 49.103 | |
| U-Net (SK-ResNeXt50) | RGB | 45.595 | 41.061 | 64.510 | 38.333 | 14.292 | 55.176 | 6.716 | 9.993 | 29.924 | 17.672 | 60.561 | 58.145 |
| RG-NIR | 44.810 | 38.836 | 63.750 | 38.954 | 18.700 | 55.005 | 7.871 | 13.213 | 34.387 | 20.251 | 60.697 | 57.688 | |
| RGB-NIR | 45.632 | 38.619 | 63.865 | 50.147 | 19.926 | 55.478 | 8.131 | 17.129 | 35.279 | 21.971 | 60.284 | 58.074 |
| Model | Bands | Lake | Pond | Fish | Snow | Bare | Rura | Stad | Squa | Road | Over | Rail | Airp |
|---|---|---|---|---|---|---|---|---|---|---|---|---|---|
| U-Net | RGB | 58.715 | 11.237 | 39.992 | 9.690 | 18.611 | 46.407 | 13.414 | 6.109 | 51.748 | 35.008 | 16.033 | 21.408 |
| RG-NIR | 70.668 | 17.836 | 47.993 | 13.265 | 25.357 | 48.627 | 15.665 | 5.713 | 52.391 | 30.123 | 18.144 | 15.620 | |
| RGB-NIR | 69.854 | 16.263 | 50.346 | 11.646 | 24.493 | 44.496 | 12.469 | 2.916 | 53.159 | 37.100 | 17.507 | 16.662 | |
| DeepLabV3+ (ResNet50) | RGB | 77.016 | 18.216 | 54.754 | 11.685 | 25.978 | 49.307 | 26.062 | 10.250 | 54.290 | 44.287 | 19.489 | 27.265 |
| RG-NIR | 76.939 | 17.255 | 53.584 | 14.277 | 25.515 | 47.709 | 29.965 | 7.709 | 54.115 | 43.602 | 21.744 | 26.758 | |
| RGB-NIR | 78.558 | 18.727 | 54.428 | 16.077 | 28.170 | 50.044 | 30.382 | 8.981 | 53.819 | 42.258 | 20.768 | 23.741 | |
| Ma-Net (MobileNetV2) | RGB | 71.777 | 9.089 | 50.474 | 7.135 | 18.395 | 44.886 | 15.366 | 0.000 | 51.462 | 31.985 | 17.173 | 19.386 |
| RG-NIR | 71.501 | 10.481 | 45.422 | 5.265 | 26.498 | 46.280 | 15.965 | 0.000 | 50.175 | 32.749 | 19.419 | 21.406 | |
| RGB-NIR | 70.394 | 7.308 | 44.087 | 7.591 | 18.951 | 46.521 | 11.563 | 0.000 | 51.184 | 33.466 | 22.580 | 21.836 | |
| DeepLabV3 (ResNet50) | RGB | 77.640 | 17.100 | 52.256 | 16.649 | 30.144 | 49.633 | 34.739 | 9.725 | 54.655 | 44.336 | 22.771 | 28.290 |
| RG-NIR | 77.961 | 17.299 | 52.288 | 12.745 | 27.888 | 49.796 | 27.286 | 7.080 | 53.415 | 43.019 | 20.477 | 28.326 | |
| RGB-NIR | 77.623 | 19.994 | 47.993 | 13.360 | 31.631 | 48.734 | 31.621 | 8.075 | 53.797 | 43.969 | 21.215 | 28.759 | |
| PSPNet (VGG16) | RGB | 74.583 | 12.279 | 45.413 | 6.762 | 20.861 | 46.389 | 19.587 | 4.882 | 50.426 | 37.012 | 16.830 | 14.956 |
| RG-NIR | 73.703 | 15.069 | 44.536 | 5.316 | 21.116 | 46.905 | 23.744 | 4.893 | 50.528 | 37.934 | 21.011 | 16.130 | |
| RGB-NIR | 72.869 | 12.977 | 46.469 | 6.486 | 21.800 | 44.603 | 26.722 | 7.443 | 50.914 | 36.297 | 17.094 | 19.524 | |
| SegFormer | RGB | 67.126 | 9.938 | 24.297 | 0.111 | 13.265 | 36.131 | 2.914 | 0.670 | 41.505 | 13.983 | 4.277 | 9.719 |
| RG-NIR | 67.382 | 12.723 | 29.437 | 3.776 | 13.783 | 39.080 | 4.650 | 1.551 | 42.706 | 15.556 | 6.919 | 11.653 | |
| RGB-NIR | 68.743 | 12.443 | 31.375 | 1.183 | 13.719 | 39.177 | 3.663 | 1.184 | 44.012 | 15.050 | 9.096 | 5.981 | |
| U-Net (SK-ResNeXt50) | RGB | 74.961 | 16.918 | 47.786 | 9.278 | 27.613 | 48.640 | 28.240 | 8.420 | 54.663 | 42.205 | 27.517 | 35.636 |
| RG-NIR | 78.004 | 18.302 | 53.580 | 16.118 | 28.231 | 48.098 | 31.063 | 11.159 | 55.789 | 45.309 | 24.677 | 36.365 | |
| RGB-NIR | 76.868 | 20.071 | 51.764 | 17.465 | 30.937 | 50.048 | 32.905 | 12.750 | 55.774 | 44.505 | 24.543 | 32.638 |
The results shown correspond to the models with the best overall performance (Table 1). The abbreviations for categories are specified as: Indu - industrial area, Padd - paddy field, Irri - irrigated field, Dryc - dry cropland, Gard - garden land, Arbo - arbor forest, Shru - shrub forest, Natu - natural meadow, Arti - artificial meadow, Urba - urban residential, Fish - fish pond, Bare - bare land, Rura - rural residential, Stad - stadium, Squa - square, Over - overpass, Rail - railway station, Airp - airport. Results are presented in percentages (%).
The other models exhibit a less consistent performance when the NIR band is included, with results varying across classes and band configurations, and failing to achieve the same level of improvement as U-Net + SK-ResNeXt50 with RGB-NIR. For instance, Ma-Net with MobileNetV2 shows a decrease in IoU from 2.348% in RGB to 1.147% in RGB-NIR for the Park class, indicating that the additional band does not enhance performance for this architecture; instead, it appears to introduce noise that negatively impacts its accuracy. Similarly, DeepLabV3+ with ResNet50 displays this pattern in the Park class, dropping from an IoU of 8.746% in RGB to 7.078% in RGB-NIR, and even further to 6.139% in RG-NIR. SegFormer also shows a decrease in performance, particularly in the Garden class, where it falls from 6.872% in RGB to 5.991% in RGB-NIR. This trend is observed across multiple models, suggesting that they lack the ability to effectively leverage the additional information provided by the non-visible band, which may result in suboptimal feature extraction or the introduction of irrelevant spectral information.
Additionally, visual tests were conducted to practically assess the performance of the models. For this purpose, we focused on the most representative models from each architecture family that demonstrated the best overall performance (Tabla 1). These tests were also performed for each combination of spectral bands, allowing us to not only evaluate the models but also analyze how effectively they leverage, or fail to leverage, the inclusion of the non-visible band.
Figure 6 shows the segmentation results using the RGB combination. In this figure, we observe that, overall, the models struggle to approximate the ground-truth, displaying blurred edges and misclassifications. Notably, SegFormer exhibits significant difficulties in accurately segmenting areas such as Overpass, Fish pond, and Pond. These challenges are especially evident in the first row, where SegFormer performs the worst among the models. PSPNet with the VGG16 encoder also demonstrates issues, as it struggles to accurately delineate and capture categories such as Overpass and River, which other models handle more effectively. The vanilla U-Net, DeepLabV3 with ResNet50, and Ma-Net with MobileNetV2 also face challenges in precisely delineating the classes Fish pond and Pond. In contrast, U-Net + SK-ResNeXt50 shows a superior ability to handle these classes, more effectively capturing those regions and achieving better differentiation. Additionally, U-Net + SK-ResNeXt50 shows slight improvements in categories such as Bare land (fourth row) and Urban residential (fifth row), and more effectively differentiates the Irrigated field from Unlabeled areas (third row). Nevertheless, as previously mentioned, there remains room for improvement to reach the precision of the ground-truth.
Fig. 6.

Comparison of visual results using RGB channels. The results shown correspond to the models with the best overall performance (Table 1). The white dashed-line regions indicate the areas where the models show the most notable differences.
Figure 7 presents the visual tests using the RG-NIR combination. In this case, certain improvements are observed in the models’ ability to delineate specific regions. For instance, SegFormer shows better performance with the Overpass (first row), though there is still room for improvement. The most notable enhancement is seen in water-related categories. In the third row, all models segment the River almost perfectly, with only slight irregularities and misclassifications in some pixels from the vanilla U-Net and DeepLabV3. However, when multiple water bodies are involved alongside Unlabeled areas, the models tend to struggle. This is evident in the fourth row, where DeepLabV3+, DeepLabV3, Ma-Net, PSPNet, and SegFormer often confuse the Pond with the River. U-Net + SK-ResNeXt50 stands out in the fourth and fifth rows, excelling in segmenting the Pond and Lake and clearly distinguishing them from the River category. In these cases, U-Net + SK-ResNeXt50 is the only model that nearly achieves complete segmentation of the Pond in the fourth row and the Lake in the fifth.
Fig. 7.

Comparison of visual results using RG-NIR channels. The results shown correspond to the models with the best overall performance (Table 1). The white dashed-line regions indicate the areas where the models show the most notable differences.
Figure 8 presents the tests conducted using the RGB-NIR combination. In this case, the inclusion of the NIR band with RGB yields mixed effects across models. Some models, including U-Net, DeepLabV3+, DeepLabV3, Ma-Net, and SegFormer, experience declines in performance, particularly in the third, fourth, and fifth rows, where distinguishing between different water bodies proves challenging. A similar pattern is observed in the first row, where confusion between Fish Pond and Pond increases. This suggests that the shift to four-channel processing, along with the additional spectral information, may introduce complexities for certain models, making it difficult for them to effectively utilize the NIR band and potentially resulting in added noise. In this scenario, U-Net + SK-ResNeXt50 demonstrates the best performance, reaffirming the numerical results by effectively utilizing the additional spectral information. This approach shows the most notable improvements, particularly in the delineation of Lake and River regions. It also differentiates and delineates areas such as Fish ponds, Industrial zones, Urban residential areas, and Vegetation fields more effectively. This is especially evident in the third and fifth rows, where it nearly achieves perfect segmentation of the scenes. Additionally, in the first, second, and fourth rows, U-Net + SK-ResNeXt50 shows consistency and produces predictions that are closer to the ground-truth compared to other models.
Fig. 8.

Comparison of visual results using RGB-NIR channels. The results shown correspond to the models with the best overall performance (Table 1). The white dashed-line regions indicate the areas where the models show the most notable differences.
Table 3 illustrates the improvements achieved by U-Net + SK-ResNeXt50 over U-Net configurations employing other encoders, across different band combinations. These percentages reflect the consistent advantages provided by SK-ResNeXt50, particularly under the RGB-NIR configuration, where the improvements reach up to 5.854% in OA and 7.794% in mIoU compared to the baseline U-Net. While the baseline U-Net relies on a straightforward encoder with sequential fixed convolutional layers, SK-ResNeXt50 incorporates advanced mechanisms such as parallel transformation paths and dynamic kernel selection. This allows it to isolate and amplify subtle spectral variations, especially from NIR, which are often overlooked by simpler architectures. Additionally, the SK units’ ability to adjust receptive fields dynamically ensures that the network is better tuned to segment intricate class boundaries and heterogeneous regions, areas where the baseline U-Net often underperforms.
Table 3.
Relative performance improvements of the proposed U-Net + SK-ResNeXt configuration compared to various U-Net variations under different band combinations.
| Encoder | RGB | RG-NIR | RGB-NIR | SK-ResNeXt improvement | ||
|---|---|---|---|---|---|---|
| OA (%) | mIoU (%) | |||||
| U-Net | Baseline |  |
5.312 | 8.906 | ||
 |
6.928 | 6.938 | ||||
 |
5.854 | 7.794 | ||||
| ResNet50 |  |
0.307 | 0.798 | |||
 |
1.928 | 1.347 | ||||
 |
3.922 | 4.187 | ||||
| VGG16 |  |
0.756 | 0.657 | |||
 |
1.761 | 1.055 | ||||
 |
2.649 | 2.783 | ||||
| MobileNetV2 |  |
0.453 | 1.512 | |||
 |
1.937 | 2.552 | ||||
 |
4.899 | 8.525 | ||||
When comparing SK-ResNeXt50 with ResNet50, it is evident that the additional architectural enhancements of SK-ResNeXt50 yield significant benefits. For example, under the RGB-NIR configuration, SK-ResNeXt50 achieves improvements of 3.922% in OA and 4.187% in mIoU over ResNet50. These results highlight that while ResNet50 offers strong performance due to its residual connections, it lacks the adaptive capabilities and enhanced feature extraction provided by SK-ResNeXt50’s selective kernel mechanism and cardinality. The ability to dynamically adjust receptive fields allows SK-ResNeXt50 to better leverage the NIR band, which appears to be underutilized by the fixed receptive field sizes of ResNet50.
In contrast to VGG16 and MobileNetV2, SK-ResNeXt50 also demonstrates superior performance. For instance, in the RGB-NIR configuration, the improvement over VGG16 is 2.649% in OA and 2.783% in mIoU, while over MobileNetV2, it reaches 4.899% in OA and 8.525% in mIoU. These figures highlight the limitations of simpler encoders, which rely on fixed and less flexible mechanisms for feature extraction, making them less capable of adapting to the additional spectral information provided by the NIR band. MobileNetV2, in particular, appears to struggle to fully leverage this non-visible information, potentially due to its lightweight design optimized for efficiency at the expense of adaptability.
These findings provide strong evidence that the integration of SK-ResNeXt50 into the U-Net architecture offers significant advantages not only due to increased model capacity but also through its architectural ability to dynamically respond to the complexities of LCC tasks. This supports the hypothesis that the combination of cardinality and adaptive feature extraction mechanisms is particularly well-suited for leveraging the challenges and opportunities presented by multispectral data in remote sensing.
To conclude, Table 4 presents a comparison of the performance of U-Net + SK-ResNeXt50 with other state-of-the-art approaches on the Five-Billion-Pixels dataset. Notably, U-Net + SK-ResNeXt50 achieves both the highest OA and mIoU scores, indicating its balanced performance in terms of accuracy and segmentation quality. Although U-Net + DPA and DeepLabv3 + DPA achieve competitive OA scores, they fall short in mIoU, suggesting potential limitations in fine-grained segmentation, particularly for complex boundaries and heterogeneous regions. In contrast, models like Mix Transformer show promising mIoU but struggle to balance this with a high OA. Lower-performing models, such as GFCNet and SimCLR, which rely on contrastive learning, exhibit significantly reduced scores in both metrics. This performance gap underscores the added value of SK-ResNeXt50’s adaptive receptive field selection, which enhances its capability to handle multispectral data with diverse spatial and spectral characteristics. U-Net + SK-ResNeXt50 effectively leverages this adaptability, capturing intricate details across a wide range of land cover types, as evidenced by its superior mIoU score.
Table 4.
Comparison of U-Net + SK-ResNeXt50 performance with other methods from current literature on the Five-Billion-Pixels dataset.
In summary, the results suggest that U-Net + SK-ResNeXt50 not only improves upon traditional U-Net’s limitations but also surpasses other recent innovations, offering a robust approach for high-resolution, LCC tasks. Notably, it is the model that benefits most from the inclusion of the non-visible NIR band, unlike others whose performance decreases with this additional spectral information. Therefore, the modifications to U-Net enhance its adaptability to a wide range of land cover types and challenging conditions, ensuring consistent segmentation quality without substantial computational costs or inference delays. This balance of accuracy, adaptability, and efficiency positions U-Net + SK-ResNeXt50 as a highly promising model for complex remote sensing applications, where both spectral depth and spatial precision are essential.
Conclusions and future work
In this work, we explore the application of SK-ResNeXt as an encoder within the U-Net architecture for LCC. This modification aims to enhance the capabilities of U-Net, particularly its feature extractor, by incorporating the cardinality and adaptive kernel size characteristics of SK-ResNeXt. These features provide U-Net with greater flexibility in capturing multi-scale information and refining the segmentation process, improving its overall performance in complex land cover classification tasks. To assess the performance of this approach, the Five-Billion-Pixels dataset was used. This dataset consists of 150 large-scale RGB-NIR images, with more than 5 billion labeled pixels and 24 categories, offering a challenging benchmark for testing LCC models. Extensive quantitative and qualitative evaluations were conducted, and the impact of different band combinations on the segmentation process was analyzed. Additionally, the performance of this approach was compared with other methods, including the original U-Net, DeepLabV3, DeepLabV3+, Ma-Net, PSPNet, and SegFormer using various encoders such as ResNet50, VGG16, MobileNetV2, and MobileNetV3.
The quantitative results demonstrate that U-Net + SK-ResNeXt achieved remarkable performance in terms of OA and mIoU, surpassing the baseline vanilla U-Net. Specifically, the improvements were reported to be 5.312% with the RGB configuration, 6.928% with RG-NIR, and 5.854% with RGB-NIR in terms of OA. In terms of mIoU, the improvements over the original U-Net are 8.905% using RGB, 6.938% using RG-NIR, and 6.506% using RGB-NIR. Furthermore, the U-Net + SK-ResNeXt approach proves particularly effective at leveraging multispectral information, as its performance with the four-channel combination (RGB-NIR) outperformes all other architectures used for comparison. The visual tests also demonstrate the superiority of U-Net + SK-ResNeXt, as it not only presents the fewest issues but is also the only approach that improves its segmentation results with the inclusion of the non-visible band. In contrast, other approaches like DeepLabV3, DeepLabV3+, PSPNet, Ma-Net, and SegFormer shows a decline in performance when this band is added. Specifically, the U-Net + SK-ResNeXt approach, with the inclusion of the NIR band, enhances its ability to delineate, and accurately classify cover types such as lakes, rivers, ponds, industrial areas, residential areas, and vegetation. This demonstrates how the modification provides U-Net with better capabilities for effectively utilizing multispectral information. Additionally, the proposed approach not only improves upon well-established segmentation models but also outperforms other state-of-the-art methods in the field. This superior performance underscores its potential as an advanced solution for complex LCC applications, demonstrating both effective use of multispectral information and robust segmentation quality across diverse land cover types.
Future work could focus on further modifications to the U-Net architecture, such as enhancing the decoder, which holds the potential to further improve the overall performance of U-Net. Additionally, exploring other datasets with a broader range of spectral bands, such as shortwave infrared or red edge, or even extending this approach to the hyperspectral domain, could provide valuable insights. Moreover, future experiments could expand the comparative analysis by incorporating architectures that were not included in this study, offering a more comprehensive evaluation of the approach’s performance across a wider range of models.
Author contributions
L.T.R.: Conceptualization, Formal Analysis, Investigation, Methodology, Software, Writing - original draft, Writing - review & editing. A.D.S.: Conceptualization, Methodology, Writing - review & editing, Supervision. All authors reviewed the manuscript.
Funding
This work was supported in part by the Air Force Office of Scientific Research Under Award FA9550-24-1-0206, in part by the Agencia Estatal de Investigación, Ministerio de Ciencia e Innovación, under Grant PID2021-128945NB-I00 funded by MCIN/AEI/10.13039/501100011033 and by “ERDF A way of making Europe,” and in part by the ESPOL project CIDIS-003-2024. The authors acknowledge the support of the Generalitat de Catalunya CERCA Program to CVC’s general activities, and the Departament de Recerca i Universitats from Generalitat de Catalunya with reference 2021SGR01499.
Data availability
The datasets generated during and/or analyzed during the current study are available in at: https://x-ytong.github.io/project/Five-Billion-Pixels.html.
Declarations
Competing interests
The authors declare no competing interests.
Footnotes
Publisher’s note
Springer Nature remains neutral with regard to jurisdictional claims in published maps and institutional affiliations.
Contributor Information
Leo Thomas Ramos, Email: ltramos@cvc.uab.cat.
Angel D. Sappa, Email: asappa@cvc.uab.cat
References
- 1.Chen, C. et al. Analysis of regional economic development based on land use and land cover change information derived from landsat imagery. Sci. Rep.10, 12721. 10.1038/s41598-020-69716-2 (2020). [DOI] [PMC free article] [PubMed] [Google Scholar]
- 2.Chughtai, A. H., Abbasi, H. & Karas, I. R. A review on change detection method and accuracy assessment for land use land cover. Remote Sens. Appl. Soc. Environ.22, 100482. 10.1016/j.rsase.2021.100482 (2021). [Google Scholar]
- 3.Akomolafe, G. F. & Rosazlina, R. Land use and land cover changes influence the land surface temperature and vegetation in Penang Island, peninsular Malaysia. Sci. Rep.[SPACE]10.1038/s41598-022-25560-0 (2022). [DOI] [PMC free article] [PubMed] [Google Scholar]
- 4.Javaid, K. et al. Spatio-temporal analysis of land use land cover change and its impact on land surface temperature of Sialkot city, Pakistan. Sci. Rep.[SPACE]10.1038/s41598-023-49608-x (2023). [DOI] [PMC free article] [PubMed] [Google Scholar]
- 5.Zhou, Y., Li, X. & Liu, Y. Land use change and driving factors in rural China during the period 1995–2015. Land Use Policy99, 105048. 10.1016/j.landusepol.2020.105048 (2020). [Google Scholar]
- 6.Ramos, L. T. & Sappa, A. D. Multispectral semantic segmentation for land cover classification: An overview. IEEE J. Sel. Top. Appl. Earth Obs. Remote Sens.17, 14295–14336. 10.1109/JSTARS.2024.3438620 (2024). [Google Scholar]
- 7.Aryal, J., Sitaula, C. & Frery, A. C. Land use and land cover (lulc) performance modeling using machine learning algorithms: a case study of the city of Melbourne, Australia. Sci. Rep.[SPACE]10.1038/s41598-023-40564-0 (2023). [DOI] [PMC free article] [PubMed] [Google Scholar]
- 8.Tong, X.-Y., Xia, G.-S. & Zhu, X. X. Enabling country-scale land cover mapping with meter-resolution satellite imagery. ISPRS J. Photogramm. Remote Sens.196, 178–196. 10.1016/j.isprsjprs.2022.12.011 (2023). [DOI] [PMC free article] [PubMed] [Google Scholar]
- 9.Cui, B., Chen, X. & Lu, Y. Semantic segmentation of remote sensing images using transfer learning and deep convolutional neural network with dense connection. IEEE Access8, 116744–116755. 10.1109/ACCESS.2020.3003914 (2020). [Google Scholar]
- 10.Asgari Taghanaki, S. et al. Deep semantic segmentation of natural and medical images: a review. Artif. Intell. Rev.54, 137–178. 10.1007/s10462-020-09854-1 (2021). [Google Scholar]
- 11.Wang, M., She, A., Chang, H., Cheng, F. & Yang, H. A deep inverse convolutional neural network-based semantic classification method for land cover remote sensing images. Sci. Rep.[SPACE]10.1038/s41598-024-57408-0 (2024). [DOI] [PMC free article] [PubMed] [Google Scholar]
- 12.Sohail, A. et al. A systematic literature review on machine learning and deep learning methods for semantic segmentation. IEEE Access10, 134557–134570. 10.1109/ACCESS.2022.3230983 (2022). [Google Scholar]
- 13.Luo, Z. et al. Rs-dseg: semantic segmentation of high-resolution remote sensing images based on a diffusion model component with unsupervised pretraining. Sci. Rep.[SPACE]10.1038/s41598-024-69022-1 (2024). [DOI] [PMC free article] [PubMed] [Google Scholar]
- 14.Khan, M., Hanan, A., Kenzhebay, M., Gazzea, M. & Arghandeh, R. Transformer-based land use and land cover classification with explainability using satellite imagery. Sci. Rep.[SPACE]10.1038/s41598-024-67186-4 (2024). [DOI] [PMC free article] [PubMed] [Google Scholar]
- 15.Kütük, Z. & Algan, G. Semantic segmentation for thermal images: A comparative survey. In 2022 IEEE/CVF Conference on Computer Vision and Pattern Recognition Workshops (CVPRW), 285–294, 10.1109/CVPRW56347.2022.00043 (2022).
- 16.Zhang, G., Nur, S., Wang, C. & Quan, L. Research on land cover classification of multi-source remote sensing data based on improved u-net network. Sci. Rep.[SPACE]10.1038/s41598-023-43317-1 (2023). [DOI] [PMC free article] [PubMed] [Google Scholar]
- 17.Goessinger, E. V. et al. Classification of melanocytic lesions using direct illumination multispectral imaging. Sci. Rep.[SPACE]10.1038/s41598-024-69773-x (2024). [DOI] [PMC free article] [PubMed] [Google Scholar]
- 18.Kulkarni, S. C. & Rege, P. P. Pixel level fusion techniques for sar and optical images: A review. Inf. Fusion59, 13–29. 10.1016/j.inffus.2020.01.003 (2020). [Google Scholar]
- 19.Kottner, S., Schulz, M. M., Berger, F., Thali, M. & Gascho, D. Beyond the visible spectrum - applying 3d multispectral full-body imaging to the virtoscan system. Forensic Sci. Med. Pathol.17, 565–576. 10.1007/s12024-021-00420-x (2021). [DOI] [PMC free article] [PubMed] [Google Scholar]
- 20.Pejović, V. et al. Photodetectors based on lead sulfide quantum dot and organic absorbers for multispectral sensing in the visible to short-wave infrared range. Adv. Funct. Mater.[SPACE]10.1002/adfm.202201424 (2022). [Google Scholar]
- 21.Jafarbiglu, H. & Pourreza, A. A comprehensive review of remote sensing platforms, sensors, and applications in nut crops. Comput. Electron. Agric.197, 106844. 10.1016/j.compag.2022.106844 (2022). [Google Scholar]
- 22.Yuan, X., Shi, J. & Gu, L. A review of deep learning methods for semantic segmentation of remote sensing imagery. Expert Syst. Appl.169, 114417. 10.1016/j.eswa.2020.114417 (2021). [Google Scholar]
- 23.Zhang, B. et al. Progress and challenges in intelligent remote sensing satellite systems. IEEE J. Sel. Top. Appl. Earth Obs. Remote Sens.15, 1814–1822. 10.1109/JSTARS.2022.3148139 (2022). [Google Scholar]
- 24.Ronneberger, O., Fischer, P. & Brox, T. U-net: Convolutional networks for biomedical image segmentation. Med. Image Comput. Comput. Assist. Interv. MICCAI234–241, 2015. 10.1007/978-3-319-24574-4_28 (2015) ((Springer International Publishing, Cham). [Google Scholar]
- 25.Liu, Z., Chen, B. & Zhang, A. Building segmentation from satellite imagery using u-net with resnet encoder. In 2020 5th International Conference on Mechanical, Control and Computer Engineering (ICMCCE), 1967–1971, 10.1109/ICMCCE51767.2020.00431 (2020).
- 26.Yuan, L. et al. Multi-objects change detection based on res-unet. In 2021 IEEE International Geoscience and Remote Sensing Symposium IGARSS, 4364–4367. 10.1109/IGARSS47720.2021.9553995 (2021).
- 27.Kumthekar, A. & Reddy, G. R. An integrated deep learning framework of U-Net and inception module for cloud detection of remote sensing images. Arab. J. Geosci.[SPACE]10.1007/s12517-021-08259-w (2021). [Google Scholar]
- 28.He, K., Zhang, X., Ren, S. & Sun, J. Deep residual learning for image recognition. In 2016 IEEE Conference on Computer Vision and Pattern Recognition (CVPR), 770–778. 10.1109/CVPR.2016.90 (2016).
- 29.He, F., Liu, T. & Tao, D. Why resnet works? residuals generalize. IEEE Trans. Neural Netw. Learn. Syst.31, 5349–5362. 10.1109/TNNLS.2020.2966319 (2020). [DOI] [PubMed] [Google Scholar]
- 30.Theckedath, D. & Sedamkar, R. R. Detecting affect states using vgg16, resnet50 and se-resnet50 networks. SN Comput. Sci.[SPACE]10.1007/s42979-020-0114-9 (2020). [Google Scholar]
- 31.Ni, Y., Liu, J., Cui, J., Yang, Y. & Wang, X. Edge guidance network for semantic segmentation of high-resolution remote sensing images. IEEE J. Sel. Top. Appl. Earth Obs. Remote Sens.16, 9382–9395. 10.1109/JSTARS.2023.3316307 (2023). [Google Scholar]
- 32.Cao, Y., Jiang, N., Wang, D.-H., Wu, Y. & Zhu, S. Uam-net: An attention-based multi-level feature fusion unet for remote sensing image segmentation. In Pattern Recognition and Computer Vision, 267–278, 10.1007/978-981-99-8462-6_22 (Springer Nature Singapore, 2024).
- 33.Fan, Y., Ding, X., Wu, J., Ge, J. & Li, Y. High spatial-resolution classification of urban surfaces using a deep learning method. Build. Environ.200, 107949. 10.1016/j.buildenv.2021.107949 (2021). [Google Scholar]
- 34.Gül, F. & Aptoula, E. A distance transform based loss function for the semantic segmentation of very high resolution remote sensing images. In IGARSS 2024 - 2024 IEEE International Geoscience and Remote Sensing Symposium, 9888–9891, 10.1109/IGARSS53475.2024.10640515 (2024).
- 35.Ismael, S. F., Kayabol, K. & Aptoula, E. Unsupervised domain adaptation for the semantic segmentation of remote sensing images via one-shot image-to-image translation. IEEE Geosci. Remote Sens. Lett.20, 1–5. 10.1109/LGRS.2023.3281458 (2023). [Google Scholar]
- 36.Liang, Z., Wang, L., Tao, M., Xie, J. & Yang, X. Attention mechanism based resnext network for automatic modulation classification. In 2021 IEEE Globecom Workshops (GC Wkshps), 1–6, 10.1109/GCWkshps52748.2021.9682126 (2021).
- 37.Fan, J., Li, J., Liu, Y. & Zhang, F. Frequency-aware robust multidimensional information fusion framework for remote sensing image segmentation. Eng. Appl. Artif. Intell.129, 107638. 10.1016/j.engappai.2023.107638 (2024). [Google Scholar]
- 38.Sun, Y. et al. Csrl-net: contextual self-rasterization learning network with joint weight loss for remote sensing image semantic segmentation. Int. J. Remote Sens.44, 7515–7542. 10.1080/01431161.2023.2285742 (2023). [Google Scholar]
- 39.Li, J. et al. Frequency-driven edge guidance network for semantic segmentation of remote sensing images. IEEE J. Sel. Top. Appl. Earth Obs. Remote Sens.17, 9677–9693. 10.1109/JSTARS.2024.3393531 (2024). [Google Scholar]
- 40.Zhou, T. et al. Dense convolutional network and its application in medical image analysis. Biomed. Res. Int.2022, 2384830. 10.1155/2022/2384830 (2022). [DOI] [PMC free article] [PubMed] [Google Scholar]
- 41.Khan, S. et al. Transformers in vision: A survey. ACM Comput. Surv.[SPACE]10.1145/3505244 (2022). [Google Scholar]
- 42.Shamshad, F. et al. Transformers in medical imaging: A survey. Med. Image Anal.88, 102802. 10.1016/j.media.2023.102802 (2023). [DOI] [PubMed] [Google Scholar]
- 43.Barr, M. Enhancing the ability of convolutional neural networks for remote sensing image segmentation using transformers. Neural Comput. Appl.36, 13605–13616. 10.1007/s00521-024-09743-6 (2024). [Google Scholar]
- 44.Zhang, C. et al. Transformer and cnn hybrid deep neural network for semantic segmentation of very-high-resolution remote sensing imagery. IEEE Trans. Geosci. Remote Sens.60, 1–20. 10.1109/TGRS.2022.3144894 (2022). [Google Scholar]
- 45.Liu, Z. et al. Swin transformer: Hierarchical vision transformer using shifted windows. In 2021 IEEE/CVF International Conference on Computer Vision (ICCV), 9992–10002, 10.1109/ICCV48922.2021.00986 (2021).
- 46.Fan, L., Zhou, Y., Liu, H., Li, Y. & Cao, D. Combining swin transformer with unet for remote sensing image semantic segmentation. IEEE Trans. Geosci. Remote Sens.61, 1–11. 10.1109/TGRS.2023.3329152 (2023). [Google Scholar]
- 47.He, X. et al. Swin transformer embedding unet for remote sensing image semantic segmentation. IEEE Trans. Geosci. Remote Sens.60, 1–15. 10.1109/TGRS.2022.3144165 (2022). [Google Scholar]
- 48.Tong, X.-Y. et al. Land-cover classification with high-resolution remote sensing images using transferable deep models. Remote Sens. Environ.237, 111322. 10.1016/j.rse.2019.111322 (2020). [Google Scholar]
- 49.Wang, X. et al. A deep learning method for optimizing semantic segmentation accuracy of remote sensing images based on improved unet. Sci. Rep.[SPACE]10.1038/s41598-023-34379-2 (2023). [DOI] [PMC free article] [PubMed] [Google Scholar]
- 50.Wang, L. et al. Unetformer: A unet-like transformer for efficient semantic segmentation of remote sensing urban scene imagery. ISPRS J. Photogramm. Remote. Sens.190, 196–214. 10.1016/j.isprsjprs.2022.06.008 (2022). [Google Scholar]
- 51.Zioulis, N. et al. Hybrid skip: A biologically inspired skip connection for the unet architecture. IEEE Access10, 53928–53939. 10.1109/ACCESS.2022.3175864 (2022). [Google Scholar]
- 52.Qian, L. et al. Multi-scale context unet-like network with redesigned skip connections for medical image segmentation. Comput. Methods Progr. Biomed.243, 107885. 10.1016/j.cmpb.2023.107885 (2024). [DOI] [PubMed] [Google Scholar]
- 53.Siddique, N., Paheding, S., Elkin, C. P. & Devabhaktuni, V. U-net and its variants for medical image segmentation: A review of theory and applications. IEEE Access9, 82031–82057. 10.1109/ACCESS.2021.3086020 (2021). [Google Scholar]
- 54.Xie, S., Girshick, R., Dollár, P., Tu, Z. & He, K. Aggregated residual transformations for deep neural networks. In 2017 IEEE Conference on Computer Vision and Pattern Recognition (CVPR), 5987–5995, 10.1109/CVPR.2017.634 (2017).
- 55.Li, X., Wang, W., Hu, X. & Yang, J. Selective kernel networks. In 2019 IEEE/CVF Conference on Computer Vision and Pattern Recognition (CVPR), 510–519, 10.1109/CVPR.2019.00060 (2019).
- 56.Ishikawa, C., Marasigan, J. A. U. & Caya, M. V. C. Cloud-based signature validation using cnn inception-resnet architecture. In 2020 IEEE 12th International Conference on Humanoid, Nanotechnology, Information Technology, Communication and Control, Environment, and Management (HNICEM), 1–6, 10.1109/HNICEM51456.2020.9400027 (2020).
- 57.Rudiyanto, Purnama, I. K. E. & Rachmadi, R. F. Brain tumor segmentation on mri images using 2d resnext. In 2024 International Seminar on Intelligent Technology and Its Applications (ISITIA), 361–366, 10.1109/ISITIA63062.2024.10668056 (2024).
- 58.Uzair, M. & Jamil, N. Effects of hidden layers on the efficiency of neural networks. In 2020 IEEE 23rd International Multitopic Conference (INMIC), 1–6, 10.1109/INMIC50486.2020.9318195 (2020).
- 59.Kabir, H. M. D. et al. Spinalnet: Deep neural network with gradual input. IEEE Trans. Artif. Intell.4, 1165–1177. 10.1109/TAI.2022.3185179 (2023). [Google Scholar]
- 60.Wu, H. et al. Scs-net: A scale and context sensitive network for retinal vessel segmentation. Med. Image Anal.70, 102025. 10.1016/j.media.2021.102025 (2021). [DOI] [PubMed] [Google Scholar]
- 61.Gao, W. et al. Deep neural networks for sensor-based human activity recognition using selective kernel convolution. IEEE Trans. Instrum. Meas.70, 1–13. 10.1109/TIM.2021.3102735 (2021).33776080 [Google Scholar]
- 62.Yang, G., Li, J. & Gao, X. A dual domain multi-exposure image fusion network based on spatial-frequency integration. Neurocomputing598, 128146. 10.1016/j.neucom.2024.128146 (2024). [Google Scholar]
- 63.Zheng, X. & Chen, T. High spatial resolution remote sensing image segmentation based on the multiclassification model and the binary classification model. Neural Comput. Appl.35, 3597–3604. 10.1007/s00521-020-05561-8 (2021). [Google Scholar]
- 64.Chen, J. et al. Strengthen the feature distinguishability of geo-object details in the semantic segmentation of high-resolution remote sensing images. IEEE J. Sel. Top. Appl. Earth Obs. Remote Sens.14, 2327–2340. 10.1109/JSTARS.2021.3053067 (2021). [Google Scholar]
- 65.Niu, R. et al. Hybrid multiple attention network for semantic segmentation in aerial images. IEEE Trans. Geosci. Remote Sens.60, 1–18. 10.1109/TGRS.2021.3065112 (2022). [Google Scholar]
- 66.Yuan, H. et al. Mpffnet: Lulc classification model for high-resolution remote sensing images with multi-path feature fusion. Int. J. Remote Sens.44, 6089–6116. 10.1080/01431161.2023.2261153 (2023). [Google Scholar]
- 67.Hu, Q., Wu, Y. & Li, Y. Semi-supervised semantic labeling of remote sensing images with improved image-level selection retraining. Alex. Eng. J.94, 235–247. 10.1016/j.aej.2024.03.035 (2024). [Google Scholar]
- 68.Tao, C. et al. Msnet: Multispectral semantic segmentation network for remote sensing images. GISci. Remote Sens.59, 1177–1198. 10.1080/15481603.2022.2101728 (2022). [Google Scholar]
- 69.Liu, J., Zhang, D., He, L., Yu, X. & Han, W. Mfagnet: Multi-scale frequency attention gating network for land cover classification. Int. J. Remote Sens.44, 6670–6697. 10.1080/01431161.2023.2274318 (2023). [Google Scholar]
- 70.Yang, C., Hou, J. & Wang, Y. Extraction of land covers from remote sensing images based on a deep learning model of ndvi-rsu-net. Arab. J. Geosci.[SPACE]10.1007/s12517-021-08420-5 (2021). [Google Scholar]
- 71.Jiang, J., Feng, X. & Huang, H. Semantic segmentation of remote sensing images based on dual-channel attention mechanism. IET Image Proc.[SPACE]10.1049/ipr2.13101 (2024). [Google Scholar]
- 72.Chen, H., Yang, W., Liu, L. & Xia, G.-S. Coarse-to-fine semantic segmentation of satellite images. ISPRS J. Photogramm. Remote. Sens.217, 1–17. 10.1016/j.isprsjprs.2024.07.028 (2024). [Google Scholar]
- 73.Zhang, Z., Jing, W., Li, H., Tao, C. & Zhang, Y. Gfcnet: Contrastive learning network with geography feature space joint negative sample correction for land cover classification. Remote Sens.[SPACE]10.3390/rs15205056 (2023). [Google Scholar]
- 74.Zhang, Z., Wang, X., Mei, X., Tao, C. & Li, H. False: False negative samples aware contrastive learning for semantic segmentation of high-resolution remote sensing image. IEEE Geosci. Remote Sens. Lett.19, 1–5. 10.1109/LGRS.2022.3222836 (2022). [Google Scholar]
- 75.Chen, T., Kornblith, S., Norouzi, M. & Hinton, G. A simple framework for contrastive learning of visual representations. In Proc. of the 37th International Conference on Machine Learning, ICML’20, 10.5555/3524938.3525087 (JMLR.org, 2020).
Associated Data
This section collects any data citations, data availability statements, or supplementary materials included in this article.
Data Availability Statement
The datasets generated during and/or analyzed during the current study are available in at: https://x-ytong.github.io/project/Five-Billion-Pixels.html.