

Abstract
The application of high-pressure grinding rolls (HPGR) for ore crushing is considered to be one of the effective ways to save energy and reduce emissions in the ore processing industry. The crushing effect is directly determined by the forces of ore material during roll crushing. However, the mechanical state of ore material in roll crushing and the effect of roll structure, process parameters, feed particle size, on the force during the crushing of ore material needs to be expanded. Therefore, this paper intends to use the discrete element method to study the mechanical characteristics of roll crushing of ore materials. Firstly, the iron ore breakage model parameters are calibrated according to compression and impact crushing tests. Then, considering different roll structures, process parameters, and feed particle sizes of high-pressure grinding rolls, a simulation of the industry high-pressure grinding roll crushing process is developed. The particle velocity is innovatively used to study the force of particles in different regions of the compression zone. Considering the force and wear of ore particles, rollers, and cheek plates, the breakage process of HPGR is analyzed comprehensively. The results show that the material in the roll-crushing process is mainly subject to the normal force. The forces on particles at different locations in the compression zone are related to average velocity. To improve the crushing effect of HPGR, the crushing process of the ore should be combined with the wear of the roller and cheek plates. The vulnerable zone between the roller and cheek plates is indicated, and the extrusion pressure of the roller is slightly lower than the shear force between the particles.
Keywords: High-pressure grinding rolls, Discrete element method, Particle breakage, Mechanical characteristics, Wear analysis
Subject terms: Mechanical engineering, Mineralogy
Introduction
The High-Pressure Grinding Rolls (HPGR) was invented in the 1980s by Professor Klaus Schönert of Germany based on an interparticle breakage mechanism. Initially, due to severe wear of the roll surface, it can only be used in the cement field, and then with the development of an inlaid stud roll surface, finally in the field of ore crushing1,2. HPGR has higher crushing efficiency and lower energy consumption than other crushers and is now widely used in the ore-crushing industry. The use of HPGR crushing is more conductive to the development of ore micro-cracks, which improves the grindability of the material and achieves “more crushing and less grinding”, contributing to cost reduction and energy saving in the ore industry3–7.
The research on HPGRs has gradually increased in recent years. With the emergence of the DEM, the research on HPGRs has begun to develop in the direction of combining numerical study and experiment. Currently, the discrete element method has been widely used in the study of HPGRs. Yu et al.8 investigated the effect of different stud diameters on the working performance of HPGR by the DEM method. With the increase of stud diameters, the working roll gap decrease. However, the effect on throughput and power consumption is small. Paul et al.9 used the DEM method to model the HPGR of the smooth roll surface and cheek plates. The results show that the maximum normal force on the particles is located in the transverse direction of the pinch point between the rolls. The position of the material in contact with the rolls generates a large shear force, which leads to the destruction of the material by shear. The crushing effect at the middle of the rolls is higher than at the edge of the rolls, but beyond the rolls, the crushing effect is greatly reduced. Zhang et al.10 modeled HPGR by using a multi-physics model coupled with a particle breakage model, and the throughput, power consumption, and product size distribution of HPGR were well predicted. The effect of roll speed on the working process of HPGR was obtained. The results showed that throughput and power consumption increased with the increase in roll speed, but had less effect on the working gap, product size distribution, and particle fracture energy. Gabriel et al.11 used the discrete elements method and multi-body dynamics coupling and added a hydraulic spring system to the DEM to simulate the model of the floating rolls, the variation of the working gap of the HPGR was better represented, and the throughput, working gap, and rolls pressure distributions were in good agreement with the predictions of the phenomenological model. Rodriguez et al. 12–15 used a coupled DEM-MBD-PRM approach to simulate the floating rolls of the HPGR, and the trends of the machine throughput and power, as well as the product size distribution at different operating parameters and axial positions of the rolls. The effects of roll aspect ratio, cheek plate wear level and offset roller press on HPGR performance were also analyzed. Zou et al. 16 investigated the wear of stripe stud surface and its effect on the HPGR work performance by the Archard Wear model. The results showed that the wear was more severe in the central region of the rolls, and the wear of the floating rolls was greater than that of the fixed rolls. The power and product fineness drop of HPGR decreases with increasing wear of the rolls, but has little effect on throughput.
Although many scholars have carried out a lot of research on different aspects of HPGR, the complexity of the force situation of the ore material between the two rolls is still need to be further studied. For example, the above studies mostly considered aspect ratios, but the combined effect of individual roll diameter and roll width changes on HPGR remains to be considered. The force variation of particles on the roller axis can be explained by the edge effect, however, the change of particle force in the horizontal diameter direction of the roller remains to be studied, and the reason for the change in force is not clear. At present, the influence of different factors on the crushing condition of HPGR is only considered the particle or HPGR wear, however, the optimization of HPGR performance should consider the crushing effect and wear condition comprehensively.
Motivated by the above discussions, the main problem considered in this paper is the mechanical characteristics of ore material and HPGR. Firstly, the DEM is used to simulate the crushing process of HPGR, and the breakage model parameters are calibrated by experiments. Secondly, the axial and horizontal diameter directions of rollers are stratified, and the particle velocity is combined to obtain the force variation trend caused by the relative sliding between particles. Then, the influence of different factors on the force of particles is studied, and the wear of rollers and cheek plates is also considered. Finally, the change rule of the contact force between ore particles and rollers, as well as between ore particles and cheek plates is analyzed, and the main reason for the wear of the roller and the cheek plates is obtained.
Simulation model and condition
Simulation modelling
As shown in Fig. 1, HPGR mainly consists of six parts: frame, rollers (including fixed and floating rollers), feeding system, transmission system, lubrication system, and control system. The crushing process is mainly divided into the acceleration zone, compression zone, and release zone17. The ores are transported to the accelerating zone from the feeding system under the action of gravity, and then it is taken into the compression zone by the pressure of the two rolls as well as the action of friction between the ores and the rolls. Due to the conditions of interparticle breakage, it is known that the feed particle size is generally smaller than the gap between the two rolls and has a certain particle bed. Therefore, the ores in the compression zone are subjected to the roll surface contact position in addition to the normal and tangential force, but also subjected to the surrounding particles of the compressive force. When the crushing strength of the ore exceeds its limit, most of the ore is crushed in the form of a cake and discharged from the release zone.
Fig. 1.
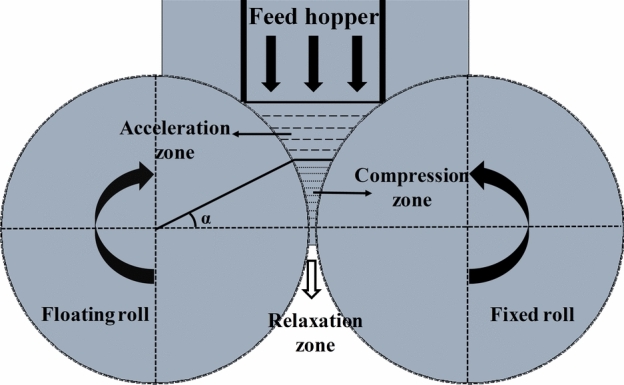
HPGR sketch, showing acceleration, compression, and relaxation zones.
The Simulation of the ore crushing process is carried out using a simplified HPGR model. Firstly, three-dimensional software was employed to establish the rolls and cheek plates model. The detailed parameters are roll diameter of 2000 mm, roll width of 1000 mm, nail diameter of 30 mm, height of 7 mm, the distance between the two rolls of 38 mm, and the cheek plate distance from the roll boundaries of 10 mm. The intrinsic and contact parameters of the particles and the geometry are then added to the EDEM to calculate the forces and motions of the particles and the geometry. In practice, the ore is first screened to ensure that the feed size is within a certain range, and then enter the HPGR. However, a small amount of ore beyond the screening range will also enter the HPGR. Therefore, the proportion of particle size and mass of iron ore that does not pass through the screen is measured, as shown in Fig. 2. The particle size calculation formula is given by Eq. (1).
 |
1 |
where, L is the longest side of the ore, and the longest side perpendicular to L is defined as I, S is an edge orthogonal to L and I.
Fig. 2.
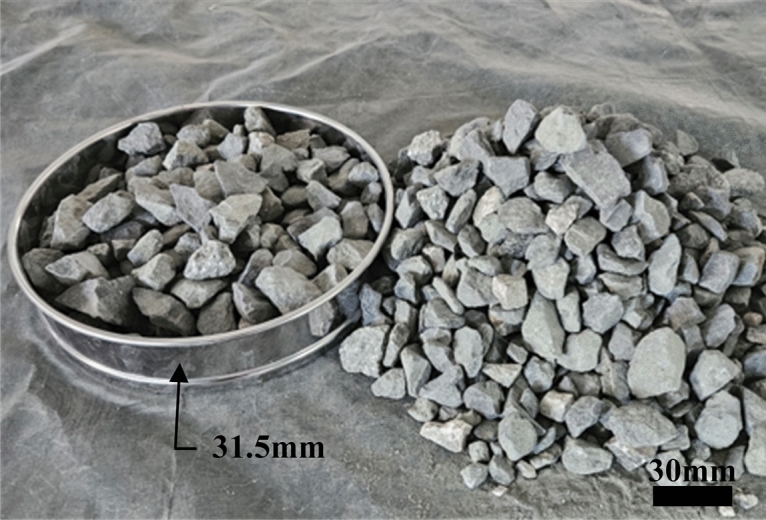
Feed size statistics.
The feed particle size distribution was obtained through statistics and set in the software as shown in Table 1. The 3D model was imported into EDEM and the two rollers were set to rotate relative to each other at a speed of 2.26 m/s. The guided silo and the particle factory were set up above the acceleration zone and the total mass of the generated pellets was set to 2300 kg, With a particle generation rate of 700 kg/s. Finally, the breakage and wear models are added to the software, and the appropriate parameters are entered.
Table 1.
Feed particle size distribution.
| Particle size (mm) | 17.6 | 22.4 | 27.2 | 28.8 | 32 | 33.6 | 35.2 |
|---|---|---|---|---|---|---|---|
| Mass ratio (%) | 1 | 2 | 5 | 10 | 72 | 5 | 5 |
Particle breakage modelling
In this study, two fracture models of the bonded model and the Tavares UFRJ Breakage model (Tavares model) are adopted in EDEM. In the Bonding model, particles are connected by a parallel bond capable of withstanding both normal and tangential forces. When the pressure on one ore exceeds pre-determined ultimate stress, the bond breaks, thus simulating the behavior of the material particles as they break. The forces and moments on the particles are set to 0 at the time of bonding, and are adjusted incrementally every Time Step as follows18,19:
| 2 |
| 3 |
| 4 |
| 5 |
 |
6 |
 |
7 |
where, RB is the bond radius, Sn,t is the normal and tangential stiffness, respectively, δt is the time step, Vn,t is the particle normal and tangential velocities, respectively, ωn,t is the particle normal and tangential angular velocity, respectively.
The bond is broken when the normal and tangential shear stresses are greater than a predetermined value:
| 8 |
| 9 |
The Tavares model of fragmentation is based on a particle replacement approach and the model introduces the concept of damage mechanics. Tavares argued that the weakening of particles upon repeated impacts and the inelastic deformation behavior of particles under impact are thought to result from the expansion of crack-like damage within the ore particles. Based on the above theory, Tavares developed a model for the weakening of particles subjected to repetitive low-energy impacts20.
The crushing principle of the Tavares model is shown in Fig. 3. Each particle has a specific fracture energy, which can be assigned based on its size, mean value, and standard deviation. The impact energy of the particles during collision and crushing is counted by the software and then compared with the initial fracture energy of the particles. The fracture energy of the particles is updated when the effective impact energy is less than the initial fracture energy. Nevertheless, the particles are crushed when the effective impact energy of the particles is greater than the fracture energy. After fracture, the parent particles are replaced and the distribution of the daughter particles can be represented by t10.
Fig. 3.

Flow chart of Tavares model breaking principle.
The fracture energy versus fracture probability relationship is described as an upper-truncated lognormal distribution
| 10 |
| 11 |
where, E is the particle fracture energy distribution corresponding to the maximum stressing energy that it can sustain in a collision, Emax is the upper truncation value of the distribution, E50, σ are the median and standard deviation of the distribution, respectively. Those can used to calculate the fragmentation probability of particles. The median specific fracture energy of the particles is given by:
| 12 |
where, E∞ is the limiting value of particle crushing energy, d0 is the transition particle size from crack emergence to extension, φ can be fitted by crushing tests, dp is a representative size; kp and ks are the stiffnesses of the particles and the steel, respectively.
When the energy absorbed by the particles during force and impact is less than the fracture energy of the particles, the particles are “weakened”. The fracture energy of the particles is renewed (less than the original fracture energy), which can be obtained from the following equation:
| 13 |
| 14 |
where, Ef is the fracture energy of the particle, D is the damage, eEk is effective impact energy, and γ is the damage accumulation coefficient, which characterizes the amenability of a material to sustain damage before catastrophically breaking. Finally, e is the proportion of energy involved in a collision which is allocated to the particles based on their stiffness. This is defined as:
| 15 |
where, Kp is the particle stiffness, and Ks is the stiffness of the surface in contact with the particles. If two identical particles collide then the energy is distributed equally between them, Kp = Ks in the above equation e is 0.5.
When the final fracture energy of the particle is less than the impact energy, the particle is broken. The particle size distribution after crushing conforms to the t-family distribution. However, it is difficult to obtain t-family curve by single particle crushing. Vedat et al.21,22 established a new size distribution model, which can easily obtain the particle size distribution of broken products. Tavares et al. 23 defined the particle size distribution of the crushed product by integrating data from drop weight tests on 40 materials, and the Tavares breakage model was proposed, which can simulate the particle size distribution of broken particles well. The extent of breakage of the fragments can be represented by the parameter t10, which represents the proportion of fragments in the progeny fragments that are smaller than 1/10 of the particle size of the parent particle. The extent of breakage when stressing a batch of particles is related to the specific stressing energy and the median fracture energy of the particles using the following:
| 16 |
where, A and b are parameters fitted from the impact test of the particle24–26.
The Tavares model can directly represent the forces on the particle bed. Therefore, in this paper, the Tavares model is used to analyze the force state of particles in the crushing process of the HPGR. And the size distribution of the crushed products can be easily counted. The Bonding model calculates the forces on each bonding bond of the particles at the microscopic level during the simulation, so the calculation rate is slower compared to Tavares. However, the particular behavior of particles during crushing can be shown in detail using a bonding model.
Experimental calibration of key model parameters
Contact parameter calibration
Three types of parameters need to be set for EDEM simulation, intrinsic parameters, contact parameters, and parameters, which are being used to calculate crushing and wear. In this paper, the selected ore particle material is iron ore (40 wt% of Fe) from a domestic mine. The material of the rolls and cheek plates is set to be steel.
The intrinsic parameters are the basic properties of the material, which can be obtained by searching for information. Contact parameters include collision recovery coefficients, static friction coefficients and rolling friction coefficients between the particles and the geometry.
The contact parameters can be calibrated by tests, but iron ores in nature are irregularly shaped. The Tavares model can support the crushing simulation of spherical particles. The contact parameters of spherical and irregular particles are quite different. Although the results of the iron ore parameters obtained from the corresponding tests are more realistic, they deviate from the actual ones during the simulation process. The contact parameters are virtually calibrated using the repose angle test, and the parameters are considered to be correct when the simulated repose angle test approximates the repose angle of the actual ore27,28. The cylinder for the test has an outer diameter of 159 mm, a wall thickness of 3 mm, and a height of 500 mm. A total of four tests were conducted to measure the angles in four directions for each test, and the results are shown in Table 2. The simulation process is shown in Fig. 4. Repose angle test for calibrating ore contact parameters. (a) actual ore repose angle; and (b) modeled repose angle. The contact parameters are shown in Table 3.
Table 2.
Repose angle test results.
| Test number | |||||
|---|---|---|---|---|---|
| The number of measurements | 1 | 2 | 3 | 4 | |
| 1 | 33.17° | 32.76° | 32.95° | 32.83° | |
| 2 | 32.74° | 33.32° | 33.27° | 32.86° | |
| 3 | 33.16° | 32.97° | 32.83° | 33.41° | |
| 4 | 33.23° | 33.05° | 33.33° | 33.09° | |
| Average value | 33.08° | 33.03° | 33.10° | 33.05° | |
Fig. 4.
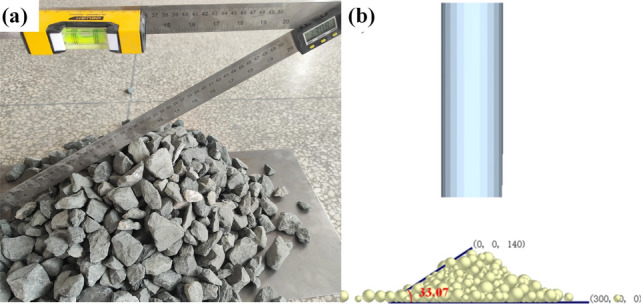
Repose angle test for calibrating ore contact parameters. (a) actual ore repose angle; and (b) modeled repose angle.
Table 3.
Contact parameters used in the stacking angle test.
| Particle–particle | Particle–geometry | |
|---|---|---|
| Collision recovery coefficient | 0.1 | 0.1 |
| Static friction coefficient | 0.5 | 0.53 |
| Rolling friction coefficient | 0.1 | 0.1 |
Calibration of breakage model parameters
The fragmentation conditions of the Tavares model are considered the result of the contrast between the impact energy and the fracture energy. So, it is necessary to have the distribution of the fracture energy. The fracture energy conforms to the upper-truncated lognormal distribution of Eq. (10), which can be used to describe the relationship between the fracture energy and its fracture probability for particles of the same particle size. In this paper, the fracture energy per unit mass is used to express the relationship between fracture energy and fracture probability for different particle sizes. According to the size of the ore samples, the sizes of ores ranging from 9.5 to 37 mm were used for the test in this paper. The ore was sieved by the vibrating sieve machine into five levels (30 pcs per group), named − 16 + 9.5 mm, − 19 + 16 mm, − 26.5 + 19 mm, − 31.5 + 26.5 mm, − 37 + 31.5 mm. The screening process is shown in Fig. 5.
Fig. 5.

Iron ore screening process, (a) for the ore screen, with a total of 5 grades of sieve hole side length; (b) for the gravel screen, with a total of 5 grades of mesh size.
The fracture probability of particles with a limited number of samples can be estimated by Eq. (17) 29,30:
| 17 |
where j is considered to be the ordinal number of the particles in descending order of their per unit mass fracture energy, and n is the total number of samples.
The fracture energy of an ore is interpreted as the energy required to break the ore. This can be obtained by integrating the force–displacement curve when the ore is compressed. In this paper, the compression test was carried out to obtain the force–displacement curve of the ore by ore strength testing tester, which has a maximum compression force of 300 KN, as shown in Fig. 6.
Fig. 6.
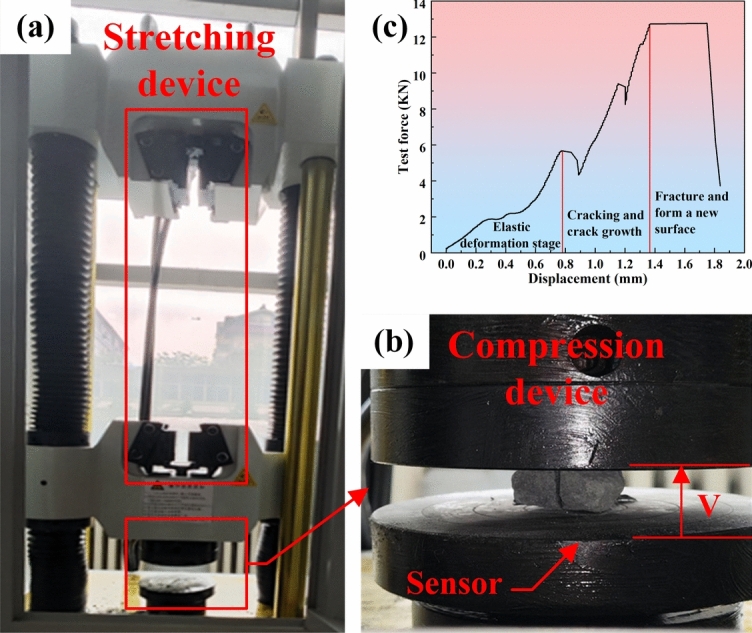
Ore uniaxial compression test: (a) Ore strength testing machine; (b) ore crack shape; (c) force–displacement curve of ore in compression.
The specific energy of fracture-probability of fracture for particles of different particle sizes was fitted to Eq. (10). The fitted curves and associated parameters are shown in Fig. 7 and Table 4. The mean parameter B in the fitted function for the five particle sizes is the standard deviation of the fracture energy distribution. Parameter A is the median fracture energy (E50), and E50 was fitted to Eq. (12) with particle size as shown in Fig. 8.
Fig. 7.
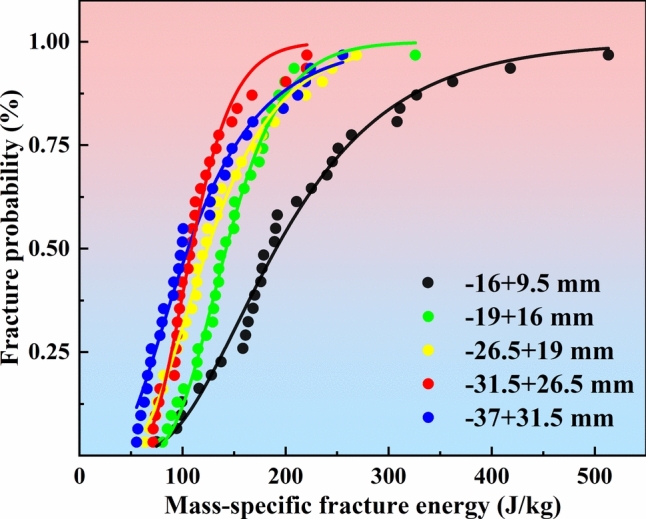
Fitting curves of fracture specific energy-fracture probability for different particle sizes.
Table 4.
Fitting parameters for fracture specific energy-fracture probability for different particle sizes.
Equation:
| ||||||
|---|---|---|---|---|---|---|
| Particle Size | − 16 + 9.5 mm | − 19 + 16 mm | − 26.5 + 19 mm | − 31.5 + 26.5 mm | − 37 + 31.5 mm | |
| Fitting parameters | A (lnE50) | 5.25358 | 4.9578 | 4.82012 | 4.68806 | 4.65663 |
| B (σ) | 2.15813 | 3.34319 | 2.29352 | 3.43152 | 1.85696 | |
| Adjusted R2 | 0.98455 | 0.98995 | 0.99213 | 0.97848 | 0.98301 | |
Fig. 8.
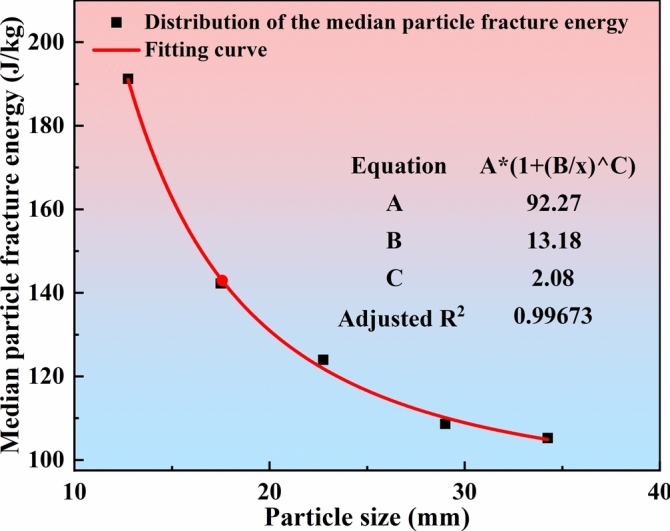
Particle size-median fracture specific energy fitting curve.
The parent particle is replaced when the impact energy of the particle is greater than its fracture energy. The size distribution of the daughter particles can be described as a function of the stress energy. Both uniaxial compression and drop hammer impact tests can be used to estimate the model parameters. In this paper, a drop hammer impact tester was used to crush the ore and to statistically characterize the size distributions after crushing. The selected ore samples were sieved into three grades − 16 + 9.5 mm, − 19 + 16 mm, − 26.5 + 19 mm, 30 pieces of each grade, and impacted with an impact energy of 0.25 kwh/t, 1 kwh/t, 2.5 kwh/t, respectively. The crushed ore was collected and sieved as shown in Fig. 9.
Fig. 9.
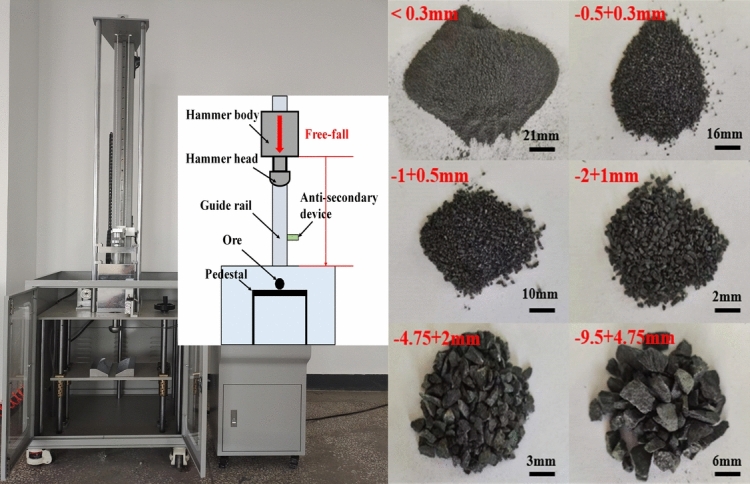
Iron ore after impact crushing by drop hammers.
The sieved particles were weighed to obtain the size distribution of the crushed sub generations of iron ore of different particle sizes at different impact energies, and the dashed position in the figure indicates the size of the original particle size 1/10 as in Fig. 10a–c. Express t10 as a function of impact energy, if there is no obvious trend in the relationship between t10 and impact energy, the effect of median fracture energy of the particles can be ignored and the parameter fitting using Eq. (18) is shown in Fig. 10d.
| 18 |
Fig. 10.

(a) Size distribution of − 16 + 9.5 mm crushed product; and (b) size distribution of − 19 + 16 mm crushed product; and (c) size distribution of − 26.5 + 19 mm crushed product; and (d) Fitted curve of t10.
The material crushing simulation parameters were calibrated by the above tests as shown in Table 5. The amount of wear is a visual representation of the forces on the rolls and cheek plates. In this paper, the wear of HPGR is investigated through the Archard wear modeling. The parameters of the Archard Wear model are shown in Ref.31.
Table 5.
Parameters of the Tavares model obtained from the tests.
| γ | E infinity | d0 | Phi(Φ) | Std deviation | Alpha percentage | b |
|---|---|---|---|---|---|---|
| 5 | 92.27 | 13.2 | 2.08 | 2.62 | 42.13 | 0.38 |
Results and discussion
Macro and micro crushing force analysis
The crushing simulation process is shown in Fig. 11a, and the forces on the particles in the EDEM post-processing can be divided into total force, compressive force, and contact force. The total force profile with time is shown in Fig. 11b. The simulation data are taken as the average value of the total particle force from 1.5 to 5.2 s, which is about 2076 N. Since the total force in the software is a vector, this data refers to the force on the particle after the equilibrium force is canceled out. The crushing process of HPGR can be seen as quasi-static crushing from the total force on the particles.
Fig. 11.

(a) Schematic of crushing simulation; (b) variation of total force; (c) variation of total compressive force in the particle bed; (d) force diagram of the particle bed in Bonding model.
The total particle compressive force reflects the total force exerted on all particles in the particle bed. This paper mainly considers the total particle compressive. The simulation data are taken as the average value of the total particle compressive force in 1.5–5.2 s is about 5050KN, as shown in Fig. 11c. The product crushed by HPGR is “weakened”. Alireza et al.32,33 studied the weakening behavior of particles with different feeding characteristics in HPGR by analyzing the magnitude of the fracture energy of the particles before and after crushing. The Tavares model is based on the impact and compressive forces on the particles to update the size of the fracture energy and then determine the particle breakage, so the larger the total particle compressive force, the smaller the remaining fracture energy of the particles in the particle bed, and the better the “weakening” effect on the particles. An increase in the maximum compressive force on a single particle indicates that the HPGR has a greater ability to deal with ores that are difficult to crush.
Since the detailed force on a single particle in the Tavares model cannot be visualized, the Bonding model is used in this paper to obtain the force on the ore particles in the compression zone. The force on the ore particles in the middle part of the compression zone is shown in Fig. 11d. It can be seen from Fig. 11d that the ore particles are subjected to compressive forces from different directions in the compression zone, which illustrates the conduction of the force in the particle bed, and the unavoidable loss of energy during the conduction results in the efficiency of laminated crushing being lower than that of single-particle crushing, but much higher than that of the mill.
Normal/tangential contact force analysis
The contact force between the particle and the particle/geometry can be classified into normal force as well as tangential force. The contact cloud diagram of the normal force and tangential force in the HPGR at a certain moment is shown in Fig. 12. From Fig. 12, it can be seen that the normal force distribution range is wide, the average force is about 2000 N, while the tangential force is small and generally appears in the roll surface and particle contact position, the average force is about 750 N. Therefore, the crushing of particles in the compression zone is mainly the extrusion crushing caused by the normal force, and the shear crushing caused by the tangential force accounts for a small proportion.
Fig. 12.

Distribution of normal (a) and tangential (b) forces above 500N.
To understand the forces at different locations in the compression zone of the particles, monitors were built to stratify the compression zone. The rolls are divided into 5 layers in both axial and horizontal diameter directions as shown in Fig. 13. In this paper, the compression zone is innovatively stratified in the horizontal diameter direction of the roller to observe the force change law of the particles. The contact force and the total particle compressive force at different positions in the compression zone were analyzed, respectively.
Fig. 13.

Layering and monitoring of compression zones.
The trend of force on particles at different locations in the compression zone is shown in Fig. 14. From Fig. 14a, it can be seen that the particles are subjected to a normal force that is slightly larger than the tangential force. The total particle compressive force is similar to the contact force, with less force at the position of contact with the cheek plates and more force at the middle of the rolls. The velocity of particles at different positions in the compression zone can effectively reflect the cause of particle stress change. Particles at the edge of the rolls due to the friction of the cheek plates will lead to a decrease in particle speed, as shown in Fig. 15. Which in turn leads to a lower density of the particle bed and a decrease in force. The particles are therefore parabolic in the compression zone, which also reflects the edge effect of the HPGR.
Fig. 14.

Force on particles at different positions of the roll (a) roller axis direction; (b) roller horizontal diameter direction.
Fig. 15.
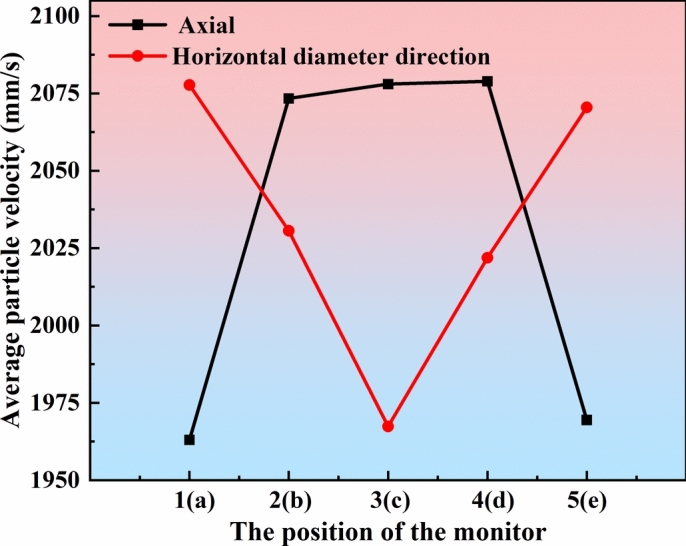
Average velocity of particles at different locations in the compression zone.
From Fig. 14b it can be seen that the normal/tangential force in the position of contact with the rolls is larger, and the middle position is very low. The particles close to the roll surface are subject to the friction of the rolls and the compressive force between the rolls and the surrounding particles, so the contact force is higher. The relative sliding between the particles will lead to a relatively low force on the particles in the middle position of the rolls. This can also be obtained from the velocity of the particles in the compression zone. As can be seen in Fig. 15, the speed of the particles is greater near the roll surface and is close to the roll speed. The velocity of the particles at the center of the two rolls is smaller, and the tendency of the particles to slide relative to each other is larger, so the density of the particle bed decreases. Similarly, the total particle compressive force between the two rolls is lower.
Analysis of forces on particles with different parameter levels
Through studying the different crushing conditions, the performance of the crusher is improved. Vedat34 studied the effect of different sizes and types of coal on the performance of a jaw crusher. The results showed that the strength of coal decreases with increasing particle size due to the presence of initial cracks. Coal fragmentation was positively correlated with net calorific value and negatively correlated with coal moisture. Vedat35 also studied the influence of different mill speeds on kinetic breakage parameters. This paper focuses on the influence of different factors on the crushing effect of HPGR to provide reference for the optimization of HPGR performance in the industrial field. Therefore, the model dimensions refer to the dimensions of the HPGR testing machine and the GM series HPGR in the industrial field. The range of variation of roll diameter, roll width, roll gap, feed particle size (unit mm) and the range of variation of roll speed (unit m/s) are set in Table 6, 10 levels for each parameter. Of all the parameters, level 5 is set as the standard, and the remaining parameters are referenced to level 5 when a single parameter is changed.
Table 6.
Parameters of simulation models at different levels.
| Level | 1 | 2 | 3 | 4 | 5 | 6 | 7 | 8 | 9 | 10 |
|---|---|---|---|---|---|---|---|---|---|---|
| Roll diameter (mm) | 1600 | 1700 | 1800 | 1900 | 2000 | 2100 | 2200 | 2300 | 2400 | 2500 |
|
Roll width (mm) |
742 | 806.5 | 871 | 935.5 | 1000 | 1064.5 | 1129 | 1193.5 | 1258 | 1322.5 |
| Roll gap (mm) | 34 | 35 | 36 | 37 | 38 | 39 | 40 | 41 | 42 | 43 |
| Feed particle size (mm) | 28 | 29 | 30 | 31 | 32 | 33 | 34 | 35 | 36 | 37 |
| Roll speed (m/s) | 1.26 | 1.51 | 1.76 | 2.01 | 2.26 | 2.52 | 2.77 | 3.02 | 3.27 | 3.52 |
Each parameter type is divided into 10 levels, and the total particle compressive force and the maximum compressive force on a single particle for each parameter are shown in Fig. 16.
Fig. 16.

(a) Variation of total particle compressive at different factor levels; (b) Variation of maximum compressive force on single particle at different parameter levels.
The number of particles in the compression zone varies considerably when the roll diameter/roll width is varied. Therefore, the total particle compressive force needs to be multiplied by a factor when the roll diameter/roll width is varied. The factor is: standard roll diameter/roll width divided by roll diameter/roll width.
From Fig. 16, it can be seen that when the roll diameter increases from 1600 to 2500 mm, the particle force produces a large change. Increase of the total particle compressive force by approx. 1.8 times and increase of the maximum compressive force on a single pellet by approx. 48%. The material layer in the extrusion area becomes thicker when the roll diameter increases. The upper layer of particles exerts a greater force on the particles in the compression zone due to gravity, resulting in more compact particles in the compression zone which in turn leads to an increase in the force on the particles.
As the roll width increased from 742 to 1322.5 mm, the particle bed thickness remained unchanged and the number of particles in the axial direction of the rolls increased. The increase in the number of particles along the axial direction of the rolls has a small effect on the forces on the particle bed. Therefore, as the roll width increases, the total particle compressive force and the maximum compressive force on a single particle increase slightly, by about 23% and 11%, respectively.
As the roll gap increases from 34 to 43 mm, the compression effect of the roller on the particles is gradually weakened. The total particle compressive force and the maximum compressive force on a single particle are reduced by approximately 25%.
When the feed particle size was increased from 28 to 37 mm, the density of the particle bed in the extrusion zone was reduced, and the total particle compressive force decreased by about 36%. However, the increase in particle diameter led to an increase in the force area and a consequent increase in the maximum compressive force on a single particle, which increased by about 76%.
When the roll speed increases from 1.26 to 3.02 m/s, the total particle compressive force first increases by about 35%, and then tends to be stable. However, the tendency of the particles to slide relative to the particles/rolls is enhanced as the roll speed is gradually increased. Eventually, the bite force of the rolls and the total particle compressive force will gradually decrease.
Analysis of HPGR treatment performance at different parameter levels
Particles with a diameter of less than 6 mm after crushing by the HPGR can be directly into the mill, which is widely accepted by enterprises. Therefore, in this paper, the mass percentage of particles with a size less than 6 mm after crushing is expressed as the crushing effect of the HPGR. The throughput and the mass percentage of particles with sizes less than 6 mm for different parameter levels are shown in Fig. 17.
Fig. 17.

(a) Plot of variation in throughput at different parameter levels; (b) Plot of percentage change in mass of particles with size less than 6 mm at different parameter levels.
From Fig. 17a, it can be seen that the throughput of HPGR is directly affected by the roll width and roll speed, and the throughput increases significantly with the roll width and roll speed by 85% and 100%, respectively. The trend of the throughput increase slows down after the roll speed is increased to a certain range. The feed particle size has little effect on throughput. As the roll gap and roll width increased from level 1 to level 10, the throughput of the HPGR increased by 7% and 14%, respectively.
Figure 17b shows that the crushing effect is enhanced by about 64% with the increase in roll diameter. With the increase in roll width and roll speed, the crushing effect has a small increase, increasing by about 8%. The crushing effect decreases with the increase of roll gap and feeds particle size, and the mass ratio of particles with size less than 6 mm is reduced by about 25%. The trend of the mass ratio of particles smaller than 6 mm in diameter is generally consistent with the trend of the total particle compressive force at different parameter levels. Therefore, the crushing effect of the HPGR can be indirectly expressed by the total particle compressive force.
Based on the above conclusions, it is clear that increasing the force on the particle layer is an effective way to improve the crushing effect. For example, increase the roll diameter or reduce the feed size and roll gap. However, they have a limited impact on throughput. Although, increasing appropriately the roll width and roll speed is considered to be an effective way to increase throughput, the power consumption of the equipment will increase. Therefore, in industrial production, the roller size and equipment parameters should be selected according to the specific needs.
Wear analysis of rolls and cheek plates at different parameter levels
The wear of rolls and cheek plates is very important because of the more serious wear of rolls and cheek plates during the working process of HPGR. It is not convenient to replace them when they are worn out, which affects the processing efficiency. Rolls and cheek plates wear as shown in Fig. 18, it can be seen that the roll wear occurs on the entire roll surface. The center area of the roll has more wear than the edge area of the roll. Wear of the cheek plates, on the other hand, is mainly concentrated in the compression zone.
Fig. 18.

Wear distribution of rolls and cheek plates.
The forces on the rolls and cheek plates are represented by the average normal contact force (ANCF) and the average tangential contact force (ATCF), the wear of the rolls and cheek plates was also characterized by the Archard wear model. The forces and wear on the rolls and cheek plates are shown in Fig. 19.
Fig. 19.

(a, d) Average normal contact force on rolls and cheek plates at different factor levels; (b, e) Average tangential contact force on rolls/cheek plates at different factor levels; (c, f) Wear depth of rolls/cheek plates at different factor levels.
From Fig. 19, it can be seen that the ATCF of the rolls is slightly larger than their ANCF, so the wear between the particles and the rolls due to the shear-slip effect is slightly higher than that caused by the extrusion between them. The ATCF of cheek plates is much higher than the ANCF, so the wear caused by mutual friction with particles is considered to be the main form of wear on cheek plates.
From Fig. 19, it can be seen that when the roll diameter increases from 1600 to 2500 mm, the force on the rolls and cheek plates increases. The ATCF of the rolls increased by about 129%, while the ANCF increased by about 240%, ATCF and ANCF of cheek plates increased by 92% and 190%, respectively. Therefore, the degree of wear of the rolls and cheek plates increases with the increase in roll diameter, and the proportion of wear due to extrusion increases.
The force on the rolls is increased by about 20% when the roll width is increased. The depth of wear is also slightly increased, but the increase in roll width has less effect on the wear of the cheek plates.
As the feed particle size increased from 28 to 37 mm, the forces on both the rolls and the cheek plates were slightly reduced. Where the ANCF of the rolls is reduced by about 40%, while the ATCF of the rolls and cheek plates is reduced by about 26%.
The trends of ANCF and ATCF of rolls when the roll gap and roll speed increase are considered to be similar to that of the feed particle size, but the trends of force and wear depth changes are more obvious when the roll gap increases. The force on the particle layer increases slightly as the roll speed increases. However, the contact time between the particles and the geometry is shorter as the roll speed increases, so the average force on both the rolls and the cheek plates decreases. The frequency of contact between the two increases so the average wear level increases significantly, and the depth of wear of the rolls does not change significantly due to the short simulation time.
It can be seen from the above conclusion, the cheek plates are stationary relative to the ore, and the friction between the cheek plates and ore will cause serious wear of the cheek plates. The relative displacement between the ore and the roller is small, so the interaction between extrusion force and shear force is the main cause of roll wear. Although, increasing the roller diameter can improve the crushing effect of the HPGR, it will lead to the acceleration of the wear degree of the roller and the cheek plates. Increasing the roller speed will improve the processing capacity of HPGR, but the replacement frequency of the roller will also increase.
Model validation
The crushing test of iron ore particles is carried out by the testing machine of HPGR. The roll speed and roll gap of the testing machine are adjustable, and the experimental parameters are the same as those in level 5 of Table 6. The crushed iron ore is screened by vibrating screen, and the proportion of particle mass less than 6 mm is about 12.57%. The test process is shown in Fig. 20. As can be seen from Fig. 17b, the simulation result is 13.84%, the error between the experimental and the simulation is 9.17%.
Fig. 20.

(a) Crushing test of High-pressure grinding rolls; (b) screening of broken products.
Conclusion
In this paper, the contact parameters of the particles with the geometry and the parameters of the Tavares model are calibrated by repose angle tests, uniaxial compression, and drop hammer impact tests, and the HPGR crushing process is simulated. The crushing test of iron ore is carried out by an HPGR testing machine, and the validity of the model is preliminarily verified. The main conclusions are as follows:
The roller is stratified in axial and horizontal diameters, and the particle velocity is used to study the force of particles at different positions in the compression zone. The tendency of particle contact force in the axial direction of the rolls is opposite to the direction of horizontal diameter. The normal force is always greater than the tangential force. In the direction of horizontal diameter, the particles have a strong relative sliding tendency between the two rolls, which makes the average speed of the particles in this area low, and the force is also low.
The particle force is strongly influenced by the roll diameter. When the roll diameter is increased from 1600 to 2500 mm, the total particle compressive force increases about 1.8 times. Due to the relative sliding between particles, the total particle compression force first increased by about 35% and then decreased when the roll speed increased from 1.26 to 3.52 m/s. The maximum compressive force on a single particle increases with the feed particle size due to the increase in the force area of the particle. As the feed particle size increases from 28 to 37 mm, the maximum compressive force on a single pellet increases by approx. 76%. The rest of the factors have less influence on the force on the particles.
The throughput of HPGR is positively correlated with the roll speed and roll width. With the increase in roll width from 742 to 1322.5 mm, the throughput of the HPGR increased by about 85%. As the roll speed increases, the throughput of the HPGR approximately doubles, but the effect on throughput diminishes as the roll speed continues to increase. The rest of the factors have a small impact on the throughput of HPGRs. The effect of each factor on the mass percentage less than 6 mm in the crushed product (crushing effect) is similar to its effect on the total particle compressive force.
Wear is greater in the middle of the rolls, and the wear of the cheek plates is mainly located in the compression zone. From the change of the contact force between particles and rollers, the extrusion pressure of ore on rollers is slightly less than the friction force. Except for roll speed, the effect of each factor on the degree of wear of the HPGR is similar to the effect on the total particle compressive force. As the roll speed increases, the force on the rolls and cheek plates decreases, but the degree of wear increases with throughput. The optimization of HPGR should consider the crushing effect and wear condition comprehensively to meet the actual production demand.
Acknowledgements
This work was supported by a grant from the Longmen Laboratory Project (grant numbers LMQYTSKT036), Ministry of Industry and Information Technology Special Projects (TC220H05V-03), and Henan Provincial Department of Science and Technology (231111221000)
Author contributions
R.G.: Conceptualization, Funding acquisition, Project administration, Resources, Supervision, Writing-review and editing. Z.Q.: Conceptualization, Data curation, Formal analysis, Investigation, Methodology, Software, Validation, Visualization, Writing-original draft. S.Z.: Conceptualization, Data curation, Project administration, supervision, Visualization, Writing-review and editing. H.X.: Formal analysis, Visualization, Writing-review and editing. L.C.: Formal analysis, Project administration, Visualization, Writing-review and editing. F.Y.: Data curation, Software, Visualization. All authors reviewed the manuscript.
Data availability
All data generated or analyzed during this study are included in this published article.
Declarations
Competing interests
The authors declare no competing interests.
Footnotes
Publisher’s note
Springer Nature remains neutral with regard to jurisdictional claims in published maps and institutional affiliations.
References
- 1.Yin, W., Tang, Y., Ma, Y., Zuo, W. & Yao, J. Comparison of sample properties and leaching characteristics of gold ore from jaw crusher and HPGR. Miner. Eng.111, 140–147. 10.1016/j.mineng.2017.06.012 (2017). [Google Scholar]
- 2.Aydoğan, N. A., Ergün, L. & Benzer, H. High pressure grinding rolls (HPGR) applications in the cement industry. Miner. Eng.19, 130–139. 10.1016/j.mineng.2005.08.011 (2006). [Google Scholar]
- 3.Kodali, P., Dhawan, N., Depci, T., Lin, C. L. & Miller, J. D. Particle damage and exposure analysis in HPGR crushing of selected copper ores for column leaching. Miner. Eng.24, 1478–1487. 10.1016/j.mineng.2011.07.010 (2011). [Google Scholar]
- 4.Theisen, W. A novel PM-wear protection method to meet high comminution demands. Wear250, 54–58. 10.1016/s0043-1648(01)00630-5 (2001). [Google Scholar]
- 5.Campos, T. M., Bueno, G. & Tavares, L. M. Modeling comminution of iron ore concentrates in industrial-scale HPGR. Powder Technol.383, 244–255. 10.1016/j.powtec.2020.12.075 (2021). [Google Scholar]
- 6.Camalan, M. & Önal, M. A. R. Influence of high-pressure grinding rolls on physical properties and impact breakage behavior of coarsely sized cement clinker. Part. Sci. Technol.34, 278–288. 10.1080/02726351.2015.1075636 (2015). [Google Scholar]
- 7.Tang, Y., Yin, W., Huang, S., Xue, J. & Zuo, W. Enhancement of gold agitation leaching by HPGR comminution via microstructural modification of gold ore particles. Miner. Eng.159, 106639. 10.1016/j.mineng.2020.106639 (2020). [Google Scholar]
- 8.Nagata, Y. et al. Effect of the roll stud diameter on the capacity of a high-pressure grinding roll using the discrete element method. Miner. Eng.154, 106412. 10.1016/j.mineng.2020.106412 (2020). [Google Scholar]
- 9.Cleary, P. W. & Sinnott, M. D. Axial pressure distribution, flow behaviour and breakage within a HPGR investigation using DEM. Miner. Eng.163, 106769. 10.1016/j.mineng.2020.106769 (2021). [Google Scholar]
- 10.Zhang, C., Zou, Y., Gou, D., Yu, A. & Yang, R. Experimental and numerical investigation of particle size and particle strength reduction in high pressure grinding rolls. Powder Technol.410, 117892. 10.1016/j.powtec.2022.117892 (2022). [Google Scholar]
- 11.Barrios, G. K. P. & Tavares, L. M. A preliminary model of high pressure roll grinding using the discrete element method and multi-body dynamics coupling. Int. J. Miner. Process.156, 32–42. 10.1016/j.minpro.2016.06.009 (2016). [Google Scholar]
- 12.Rodriguez, V. A., Barrios, G. K. P., Bueno, G. & Tavares, L. M. Investigation of lateral confinement, roller aspect ratio and wear condition on HPGR performance using DEM–MBD–PRM simulations. Minerals11, 801. 10.3390/min11080801 (2021). [Google Scholar]
- 13.Rodriguez, V. A., Campos, T. M., Barrios, G. K. P., Bueno, G. & Tavares, L. M. A Hybrid PBM–DEM model of high-pressure grinding rolls applied to iron ore pellet feed pressing. KONA Powder Particle J.40, 262–276. 10.14356/kona.2023011 (2023). [Google Scholar]
- 14.Rodriguez, V. A., Barrios, G. K. P., Campos, T. M. & Tavares, L. M. Critical assessment of novel developments in HPGR technology using DEM. Materials17, 1665. 10.3390/ma17071665 (2024). [DOI] [PMC free article] [PubMed] [Google Scholar]
- 15.Rodriguez, V. A., Barrios, G. K. P., Bueno, G. & Tavares, L. M. Coupled DEM-MBD-PRM simulations of high-pressure grinding rolls. Part 1: Calibration and validation in pilot-scale. Miner. Eng.177, 107389. 10.1016/j.mineng.2021.107389 (2022). [Google Scholar]
- 16.Zou, Y., Zhang, C., Gou, D., Cheng, G. & DEM Yang, R. analysis of wear evolution and its effect on the operation of a lab-scale HPGR mill. Miner. Eng.204, 108401. 10.1016/j.mineng.2023.108401 (2023). [Google Scholar]
- 17.Rashidi, S., Rajamani, R. K. & Fuerstenau, D. W. A review of the modeling of high pressure grinding rolls. KONA Powder Particle J.34, 125–140. 10.14356/kona.2017017 (2017). [Google Scholar]
- 18.Tahmasebi, P. A state-of-the-art review of experimental and computational studies of granular materials: Properties, advances, challenges, and future directions. Prog. Mater. Sci.138, 101157. 10.1016/j.pmatsci.2023.101157 (2023). [Google Scholar]
- 19.Potyondy, D. O. & Cundall, P. A. A bonded-particle model for rock. Int. J. Rock Mech. Min. Sci.41, 1329–1364. 10.1016/j.ijrmms.2004.09.011 (2004). [Google Scholar]
- 20.Tavares, L. M. & King, R. P. Modeling of particle fracture by repeated impacts using continuum damage mechanics. Powder Technol.123, 138–146. 10.1016/s0032-5910(01)00438-7 (2002). [Google Scholar]
- 21.Deniz, V. A new size distribution model by t-family curves for comminution of limestones in an impact crusher. Adv. Powder Technol.22, 761–765. 10.1016/j.apt.2010.10.020 (2011). [Google Scholar]
- 22.Umucu, Y., Deniz, V. & Cayirli, S. A new model for comminution behavior of different coals in an impact crusher. Energy Sources Part A Recov. Util. Environ Effects36, 1406–1413. 10.1080/15567036.2010.503232 (2014). [Google Scholar]
- 23.Tavares, L. M. & das Chagas, A. S. A stochastic particle replacement strategy for simulating breakage in DEM. Powder Technol.377, 222–232. 10.1016/j.powtec.2020.08.091 (2021). [Google Scholar]
- 24.Saeidi, F., Tavares, L. M., Yahyaei, M. & Powell, M. A phenomenological model of single particle breakage as a multi-stage process. Miner. Eng.98, 90–100. 10.1016/j.mineng.2016.07.006 (2016). [Google Scholar]
- 25.Tavares, L. M. & das Neves, P. B. Microstructure of quarry rocks and relationships to particle breakage and crushing. Int. J. Miner. Process.87, 28–41. 10.1016/j.minpro.2008.01.007 (2008). [Google Scholar]
- 26.Tavares, L. M. Analysis of particle fracture by repeated stressing as damage accumulation. Powder Technol.190, 327–339. 10.1016/j.powtec.2008.08.011 (2009). [Google Scholar]
- 27.Fang, W., Wang, X., Han, D. & Chen, X. Review of material parameter calibration method. Agriculture12, 706. 10.3390/agriculture12050706 (2022). [Google Scholar]
- 28.Barrios, G. K. P., de Carvalho, R. M., Kwade, A. & Tavares, L. M. Contact parameter estimation for DEM simulation of iron ore pellet handling. Powder Technol.248, 84–93. 10.1016/j.powtec.2013.01.063 (2013). [Google Scholar]
- 29.Campos, T. M. et al. Relationships between particle breakage characteristics and comminution response of fine iron ore concentrates. Miner. Eng.164, 106818. 10.1016/j.mineng.2021.106818 (2021). [Google Scholar]
- 30.Sullivan, J. D. & Lauzon, P. H. Experimental probability estimators for Weibull plots. J. Mater. Sci. Lett.5, 1245–1247. 10.1007/bf01729379 (1986). [Google Scholar]
- 31.Mo, S. et al. Research on time-varying meshing stiffness of wind turbine gearbox considering tooth surface wear. Proc. Inst. Mech. Eng. Part J: J. Eng. Tribol.237, 1583–1602. 10.1177/13506501231172258 (2023). [Google Scholar]
- 32.Aminalroaya, A. & Pourghahramani, P. Investigation of particles breakage and weakening behaviors in multi-component feed grinding by high pressure grinding rolls (HPGR). Miner. Process. Extr. Metall. Rev.43, 217–232. 10.1080/08827508.2021.1880400 (2021). [Google Scholar]
- 33.Aminalroaya, A. & Pourghahramani, P. The effect of feed characteristics on particles breakage and weakening behavior in high pressure grinding rolls (HPGR). Miner. Process. Extr. Metall. Rev.43, 610–621. 10.1080/08827508.2021.1913153 (2021). [Google Scholar]
- 34.Deniz, V. A study on the effects of coal feed size and coal type on the performance of a laboratory jaw crusher. Energy Sources Part A: Recov. Util. Environ. Effects36, 1249–1255. 10.1080/15567036.2010.549917 (2014). [Google Scholar]
- 35.Deniz, V. Effects of mill speed on kinetic breakage parameters of four different particulate pumices. Particul. Sci. Technol.31, 101–108. 10.1080/02726351.2012.658903 (2013). [Google Scholar]
Associated Data
This section collects any data citations, data availability statements, or supplementary materials included in this article.
Data Availability Statement
All data generated or analyzed during this study are included in this published article.