

Abstract
The hydraulic column is a core component in the coal mine support system, however, the real-time monitoring of the hydraulic column during the service process of the hydraulic support faces challenges. To address these issues, a high-precision stress mapping method of hydraulic column is proposed. The hydraulic column loss function was constructed to guide the data-driven model training, and the cylinder stress mechanism model was established by using the elastic–plastic theory of thick-walled cylinder. The weight coefficients of the data-driven model and the mechanism model were determined by the measurement data, and the high-precision stress mapping results were obtained by combining the data-driven model data and mechanism model data. A monitoring platform was built for the unit hydraulic support column, and the unit hydraulic support column was used as the test object to carry out pressure tests of 600 kN, 800 kN, 1000 kN and 1200 kN. The test data of the four groups showed that the error between the stress mapping results and the measured value of the strain gauges was 3.086%, 1.783%, 1.182% and 1.548%, respectively. The mapping period is 0.32 s, which proves that the method can provide real-time and high-precision feedback on the stress state of the hydraulic column, realize real-time monitoring of the stress state of the hydraulic column, solve the problem that stress cannot be measured by attaching strain gauges in the complex underground environment, predict the fault and safety problems of the hydraulic column due to overload, and provide data reserve for the adaptive regulation of the hydraulic support.
Keywords: Coal mine, Hydraulic column, Stress monitoring, Loss function, Model fusion
Subject terms: Mechanical engineering, Civil engineering
Introduction
Hydraulic support is the core supporting equipment in the process of coal mining, and its supporting performance and health status directly affect the safety of coal mining and personnel1–5. With the increasing depth of coal mining, higher requirements are put forward for the reliability of hydraulic support. The hydraulic column is the core component to ensure the support performance6–9. When coal and rock collapse or even rock burst occurs, the hydraulic column directly bears the impact force generated by the surrounding rock disturbance and is the most important force component in hydraulic suppor10. Real-time and accurate monitoring of hydraulic column service performance is an important method to ensure the smooth mining of coal mines.
Domestic and foreign scholars have carried out relevant research on the status monitoring of hydraulic support. Xie et al.11 used the information fusion algorithm to monitor the support status of hydraulic support, and combined it with the digital model of the actual supported hydraulic support to realize the digitization and modularization of the management and connection process of hydraulic support during the life cycle. Zhang Fan et al.12 used the finite element method to analyze the fatigue life of the top beam of the hydraulic support and built a dataset, and predicted the top beam life of the hydraulic support by using the short-time-memory recurrent neural network. Zhang Xuhui et al.13 built a predictive maintenance system for mining equipment based on digital twin technology to realize the function of fault warning for key components of mining equipment. Zhang Kun14 and Chen et al.15 fused multi-sensor data to realize dynamic perception of spatial attitude data of hydraulic support. Based on the massive monitoring data of hydraulic support, Cheng Jingyi et al.16 developed an intelligent sensing system for the support and roof status of fully mechanized mining face, which realized the prediction of roof pressure, early warning of roof collapse, adaptability of support and evaluation of support quality. Liang et al.17 analyzed the kinematic model of hydraulic support, designed fiber Bragg grating inclination sensor, and proposed an error compensation method for inclination monitoring to achieve reliable measurement of the inclination Angle of hydraulic support.
Real-time monitoring of the stress state of the column can avoid unnecessary reinforcement and maintenance, reduce material and labor costs, and reduce downtime due to safety hazards, thereby improving economic efficiency18. In addition, by responding quickly and dealing with potential problems, the mine can maintain higher production efficiency and maximize output. At the same time, through continuous monitoring and maintenance, the service life of the column can be significantly extended, which not only reduces the replacement frequency and related costs, but also improves the sustainability of the overall operation.
The above researches mainly focus on the attitude monitoring of hydraulic support and fatigue monitoring of top beam, while the researches on column stress monitoring are relatively few. At present, only the fluid pressure is used to monitor the service performance of column, and the real-time monitoring method and theory of column stress need to be improved. This paper builds a data-driven model based on deep learning and a mechanism model of key components based on the elastic–plastic theory of thick-walled cylinders and the basic theory of rotating shells. The weight coefficients of the data-driven model and mechanism model are determined through measurement data, and the accuracy of hydraulic column stress mapping is improved by combining the two data, providing a method for real-time monitoring of hydraulic column stress. It lays the data foundation for the adaptive control of hydraulic support.
High-precision mapping method of hydraulic column stress
Two methods of hydraulic column stress mapping are data-driven and mechanism model driven. Using only data-driven method will over-rely on sample quality and quantity, and cannot guarantee model accuracy and generalization ability. In addition, data-driven method is a black box model with poor interpretability. Due to the requirements of installation and use, the structure shape of the hydraulic column is irregular and the coupling relationship between the hydraulic column components is complicated. Therefore, the method driven by mechanism model cannot solve the stress of the hydraulic column as a whole.
Combining the advantages of data-driven method and mechanism model driven method, a high-precision hydraulic support column stress mapping method is proposed, as shown in Fig. 1.
Fig. 1.

Method implementation flow.
High-precision hydraulic column stress mapping method by constructing data-driven model, mechanism model and data fusion method, high-precision stress mapping data is obtained. Firstly, numerical simulation was used to analyze the overall structural performance of the hydraulic column to provide data support for the data-driven model. As the hydraulic column monitoring needs to pay attention to extreme stress points, a data-driven model of the hydraulic column loss function training was constructed. Secondly, the construction of a data-driven model with high precision and strong generalization ability requires a large amount of and high-quality data. Therefore, the derivation of the stress mechanism model of the key components of the hydraulic column is different from the data-driven model, which takes tens or even hundreds of milliseconds to get the mapping results. The mechanism model is a set of analysis expressions, which can quickly output the mapping results. Finally, the real-time sensing data is input into the completed data-driven model and mechanism model respectively, and the two mapping data are integrated by data fusion method to obtain high-precision mapping data. The data fusion method is also a set of expressions, which means that the time spent by the high-precision hydraulic column mapping method is basically the same as that spent by the data-driven mapping method alone.
Data-driven model
The data-driven model construction process is to solve the hydraulic column stress data based on numerical simulation, make dataset through parametric numerical simulation, finally, the stress weight loss function and stress boundary loss function are established to train the data-driven model.
Numerical simulation
The hydraulic support column is numerically simulated19. Ignoring the parts that have little influence on the hydraulic column, the simplified model is composed of cylinder, piston rod, emulsion, top beam and base support, as shown in Fig. 2.
Fig. 2.
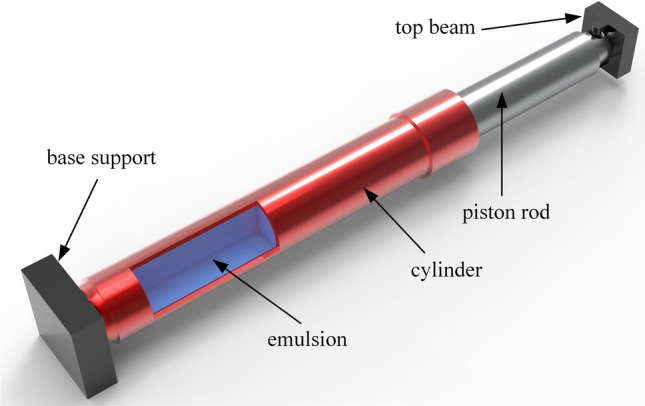
Hydraulic column structure diagram.
The top beam and the base support are set as rigid body, the contact between the piston rod and the inner wall of the cylinder is set as friction contact, and the friction coefficient is 0.15. The cylinder and piston rod are divided into tetrahedral mesh, the mesh size is set to 10 mm, the emulsion height is set to 900 mm, the mesh size is very important in the finite element analysis20. The ALE(Arbitrary Lagrangian Eulerian adaptive meshing, ALE) mesh size is determined by numerical simulation. Considering the solution time under the premise of satisfying the solution accuracy, the ALE mesh size is set to 5 mm. Figure 3 is the relationship between the maximum stress of the column and the ALE mesh size.
Fig. 3.
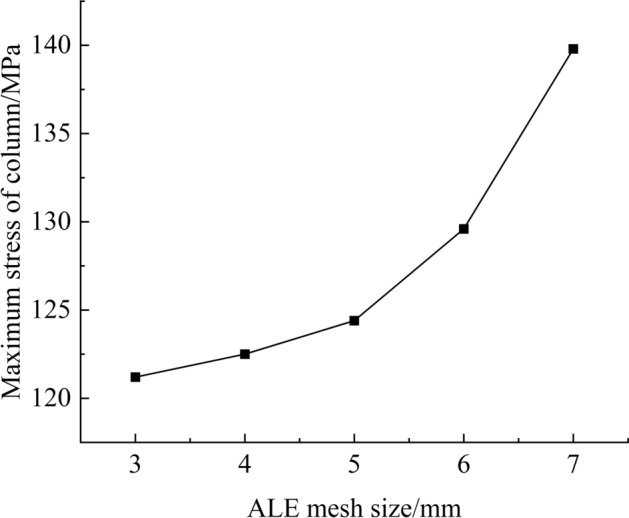
Relationship between maximum stress of column and ALE mesh size.
When the mesh size is less than 5, the maximum stress of the cylinder changes little, so the ALE mesh size is set to 5 mm. In addition to the axial movement freedom of the top beam, the freedom of the other 5 directions is restricted. The base is fixed. The stress cloud map of numerical simulation is shown in Fig. 4.
Fig. 4.
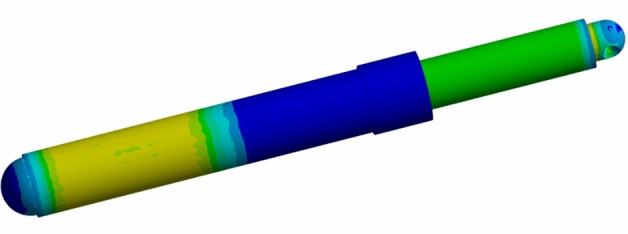
Numerical simulation results.
The two parameters of force and emulsion height were selected as input variables of the data-driven model, and the stress of all finite element nodes of the hydraulic column was selected as output variables. The rated working resistance of the hydraulic column used in the test is 1000 kN, the national standard GB/T 25974.2-2010 hydraulic column center overload performance chapter pointed out that the use of 1.5 times the rated working resistance for external ballast, the test height is 70%-80% of the full stroke, this paper selected the load force range of 400–2000 kN, Increase by 200 kN; The piston stroke of the hydraulic column was 1100 mm, the height of the emulsion was selected as 500–900 mm, and the increase was 100 mm. The two groups of parameters were cross-tested, and a total of 45 groups of numerical simulation tests were performed. The 45 groups of numerical simulation stress of the hydraulic column node were derived to make a dataset.
Data-driven model training
In the real-time monitoring system of column stress, the trade-off between real-time performance and accuracy is a key issue21. Real-time performance requires the system to quickly process and transmit data in order to detect and respond to changes in column stress in a timely manner. However, improving real-time performance usually means that the calculation method needs to be simplified, which may reduce the accuracy of the data. On the contrary, complex algorithms can provide higher accuracy and improve the monitoring effect through more detailed feature extraction and analysis, but this will increase the computational burden and reduce the real-time response capability of the system. Therefore, according to the specific application scenarios and priorities of the column, this paper finds the best balance between real-time performance and accuracy, so as to improve the accuracy of monitoring as much as possible without significantly sacrificing real-time performance. A one-dimensional deconvolution neural network has the ability to process sequence data efficiently and retain key information while reducing the data dimension, therefore, a one-dimensional deconvolution neural network was selected as the data-driven model to fit the dataset in “Numerical simulation” section. Table 1 shows the parameters of the data-driven model.
Table 1.
Data-driven model parameter.
| Layer | Output shape | Param |
|---|---|---|
| Input_1 | (None, 1, 2) | 0 |
| conv1d_tran | (None, 3, 64) | 448 |
| conv1d_tran_1 | (None, 5, 64) | 12352 |
| global_plool_1d | (None, 64) | 0 |
| dense | (None, 67374) | 4379310 |
The commonly used types of loss functions in regression problems are mean square error (MSE) and mean absolute error (MAE)22, which are suitable for the case of equal weight of sample data. However, in the application of feedback column stress state and other structural health monitoring, the traditional loss function has the problem of convergence difficulty, which limits the accuracy of the data-driven model23. Therefore, we should focus on the data points that affect the constitutive safety of the column in the sample data24, improve the fitting accuracy of these data points, and take into account the characteristics of the constitutive material of the column. Based on the above analysis, the column loss function is constructed.
The hydraulic column damage is mainly caused by excessive local stress. The fitting accuracy of extreme stress points is emphasized, and the stress weight loss function is constructed:
 |
1 |
where, N is the number of finite element nodes of the hydraulic column,  is the penalty coefficient, 5 is taken in this paper, y is the numerical simulation result,
  is the mapping result, and
  is the stress threshold. The rated working resistance of the hydraulic column used in this paper is 1000 kN. According to the statistical results of numerical simulation, the average value of the high-stress area of the hydraulic column is 154.4 MPa. Therefore, the stress above 150 MPa is regarded as the high-stress area, that is
  MPa.
MPa.
The piston rod material used for the hydraulic column is 45 steel, the yield strength is 355 MPa, the cylinder material is 27SiMn, and the yield strength is 835 MPa. The stress values of the piston rod and cylinder mapped by the data-driven model should be within the corresponding range, so the stress boundary loss function is constructed:
 |
2 |
where,  is the maximum yield strength of the hydraulic column material, the piston rod corresponds to 355 MPa, and the cylinder corresponds to 835 MPa, which
  is the penalty coefficient, and 1000 is taken in the paper.
The hydraulic column loss function is obtained by combining the above two loss functions:
 |
3 |
where, loss1 is the stress weight loss function and loss2 is the stress boundary loss function. w1 and w2 are the corresponding weight coefficients, and w1 = 1 and w2 = 5 are set in this paper.
Loss function ablation study
In order to verify the necessity of stress weight loss function and stress boundary loss function, the two loss functions were ablated and the mean absolute error loss function was used as a control. Table 2 shows the ablation results of the two groups. The evaluation indexes include MAE (mean absolute error, MAE), MAE* (The mean absolute error of data points with stress values greater than 150 MPa), and k (the number of stress value less than 0 MPa).
Table 2.
Results of loss function ablation study.
| Loss function type | 1200 kN-900 mm | 1000 kN-800 mm | ||||
|---|---|---|---|---|---|---|
| MAE/MPa | MAE*/MPa | Count (k < 0) | MAE/MPa | MAE*/MPa | Count (k < 0) | |
| Without loss2 | 0.853 | 2.57 | 42 | 1.044 | 3.819 | 61 |
| Without loss1 | 70.134 | 211.28 | 0 | 50.712 | 185.55 | 0 |
| MAE | 0.736 | 2.219 | 2 | 2.547 | 9.318 | 1 |
| Fusion | 0.279 | 0.841 | 1 | 0.236 | 0.865 | 0 |
Significant values are in bold.
There are more negative stress values in the results without boundary loss function, which is inconsistent with the reality. The mean absolute error of the results without weight loss function is large, but there is no negative stress value. Compared with the mapping results using MAE loss function, the mean absolute error of the mapping results using hydraulic column loss function is lower, which confirms the validity of the hydraulic column loss function.
Hydraulic column cylinder mechanism model
In order to improve the accuracy and generalization ability of cylinder stress mapping, the elastoplastic theory of thick-walled cylinder and the basic theory of rotating shell are used to derive the mechanism model of cylinder stress. Hydraulic column cylinder bottom edge welded to header, and the boundary of the cylinder is fixed in the form of non-free support. If the deformation of the edge joint is analyzed by the thick-walled cylinder theory, the boundary separation phenomenon will occur, which is inconsistent with the reality. Because the edge connection is not free, the cylinder and the header will bend, and the edge bending phenomenon can be regarded as the result of the action of the edge force and the edge moment. Therefore, the stress of the hydraulic column cylinder can be approximately regarded as the superposition of the stress solution of the thick-walled cylinder and the edge stress solution.
Stress of thick-walled cylinder
The stress of thick-walled cylinders can be solved by the combination of geometric equation, force balance equation and physical equation. The stress distribution equation of thick-walled cylinders of ideal elastic–plastic materials has been derived in the elastic–plastic mechanics textbook, which will not be derived in detail here. The stress distribution equation of thick-walled cylinder in elastic stress field is25:
 |
4 |
where,  denotes radial stress,
  denotes circumferential stress,
  denotes axial stress, P is the internal pressure of the cylinder, r is the distance between the desired node and the axis of the cylinder, R1 represents the inner diameter of the cylinder, and R2 represents the outer diameter of the cylinder.
Edge stress
The internal force and moment caused by the edge force and the edge moment can be obtained from the basic equation of the rotating shell, and then the edge force and the edge moment can be solved according to the coordination between the edge force, the edge moment and the deformation caused by the stress of the thick-walled cylinder. The expression of cylinder edge stress is as follows:
 |
5 |
where,  denotes axial stress,
  denotes circumferential stress, S represents cylinder wall thickness,
  ,
,  ,
,  and
and  , respectively, are internal force and internal moment generated by edge force F and edge moment M. Internal force and internal moment can be obtained by bringing the edge force and edge moment into the edge bending solution of the cylindrical shell26:
 |
6 |
where,  represents Poisson’s ratio, and x represents the distance from the edge,
  . When the internal moment makes the edge bend outward, the internal surface stress is positive and the external surface stress is negative. Figure 5 is the force diagram of the hydraulic column cylinder:
Fig. 5.
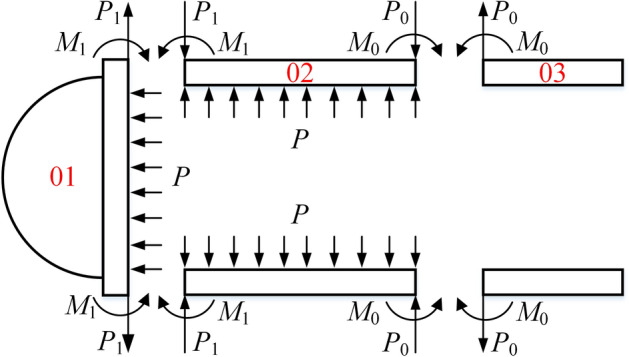
Cylinder edge coordination diagram.
In the Fig. 5, P0 and P1 represent the edge force, M0 and M1 represent the edge moment. The cylinder is divided into 3 parts along the connecting edge of the header and the bottom edge of the piston. The left part is the header, number 01, the middle part is the rodless cavity of the cylinder, number 02, and the right part is the rodded cavity of the cylinder, number 03. The deformation coordination equations for part 02 with parts 01 and 03 are as follows:
 |
7 |
 |
8 |
where,  denotes the deformation caused by the emulsion pressure P,
  ,
,  ,
,  and
and  respectively represent the deformation caused by the edge force and the edge moment,
 represents the edge angle caused by the emulsion pressure P,
  ,
,  and
and  ,
,  respectively represent the edge angle generated by the edge force and the edge moment. The positive and negative signs of the deformation
  are specified as follows: the radius of the edge parallel circle is reduced to positive; The positive and negative signs of the edge angle
  are specified as follows: based on the left interface of the separation body, the edge interface rotates clockwise to be positive. The deformation and edge angle of the cylinder and round plate at the edge can be expressed as26:
 |
9 |
where, E stands for elastic modulus, S1 stands for cylinder wall thickness, S2 stands for header round plate wall thickness,  ,
,  ,
,  .
.
Analyze the edges of barrel rodless cavity 02 and barrel rodded cavity 03, and judge the positive and negative signs of the edge bending solution, and bring Eq. (9)① into deformation coordination and balance Eq. (8):
 |
10 |
By bringing the expressions of k1 and D1 into the above formula, P0 and M0 on the edges of rodless cavity 02 and rodded cavity 03 of the barrel are respectively:
 |
11 |
By bringing the desired P0 and M0 into Eq. (5), the stress on the right edge of the rodless cavity can be obtained as follows:
 |
12 |
The hydraulic support column is affected by the functions of energy absorption, liquid supply and installation, and the header shape is different. Taking the unit hydraulic support column header in this paper as an example, the header is composed of a half sphere and a round plate, and this kind of shaped header is difficult to accurately solve the internal force and internal moment caused by P1 and M1. By analyzing the force of the header, the emulsion pressure P acting on the right side of the header and the supporting force on the left side of the header cancel each other, that is, the influence of P on the edge force and edge moment of the cylinder edge is negligible. In order to simplify the analysis, the header was simplified into a round plate, and the right side of the round plate was not subject to liquid pressure. In order to verify the analysis, numerical simulation was used to verify it. Figure 6 shows the comparison of inner and outer wall stress of cylinder with original header and round plate header with different wall thickness under 10 MPa load.
Fig. 6.

Stress comparison between the real model and the simplified model.
As can be seen from Fig. 6, as the wall thickness of the circular plate increases, the cylinder stress of the simplified model is basically consistent with that of the real model. Therefore, the header can be simplified as a round plate for solving the edge force P1 and edge moment M1. By bringing Eq. (9)② into Eq. (7), the deformation coordination equation between the header 01 and the rodless cavity 02 of the cylinder at the edge is as follows:
 |
13 |
By bringing the expressions of k1, D1 and D2 into the above formula, take  , S2 = 40 mm, P1 and M1 at the edges of rodless cavity 02 and header 01 of the barrel can be obtained as follows:
 |
14 |
Similarly, by bringing the desired P1 and M1 into Eq. (5), the stress on the left edge of the rodless cavity of the cylinder can be obtained as follows:
 |
15 |
After solving the stress of thick-walled cylinder and edge stress, the stress of hydraulic column cylinder can be expressed as27:
 |
16 |
The thick-walled cylinder stress  ,
,  ,
,  and edge stress
  ,
,  ,
,  ,
,  are the main stress, where
  ,
,  ,
,  .
.
Model data fusion
The data of the data-driven model and the mechanism model were integrated using a weighted fusion method considering the authenticity of the strain gauge. It is worth noting that determining the weight of each information source or model is the core challenge of weighted fusion. Weight selection usually depends on experience or heuristic methods, and it is not easy to find the optimal weight combination. In addition, if an information source or model is disturbed by noise to generate outliers, and its weight is large, it may cause the fusion result to deviate seriously from the real situation. Therefore, it is necessary to consider the influence of noise on the prediction result28. The deviation coefficients of the two models were calculated using the measured data of the strain gauge, and the weight of the two models was determined by the inverse ratio of the deviation coefficients. The method flow chart is shown in Fig. 7.
Fig. 7.

Data fusion flow chart.
The accuracy of the fusion model plays a vital role in the prediction of column stress, because the high-precision fusion model can capture and analyze the complex stress distribution and change trend more accurately. In order to improve the prediction accuracy, the fusion model usually combines a variety of data sources and algorithms to provide more comprehensive decision support. In this case, the selection of the weights of each model needs to balance its sensitivity and specificity29, so as to avoid the selection of data sources with large errors, so that the model can maintain stable and reliable performance in most cases, and ensure the effective application of the fusion model in complex multi-state systems.
The authenticity of strain gauge data is affected by such factors as whether the surface of the structural parts is polished clean and smooth, whether the strain gauges are firmly pasted, wire resistance, channel drift, etc. Therefore, it is necessary to conduct multidimensional authenticity judgment on the collected strain gauge data. The true degree of strain gauge data is expressed as:
 |
17 |
In Eq. (17),  represents the measured value of the i th strain gauge, ci is used to determine whether the measured value of the i th strain gauge is within the yield strength range
  of the material. If
  , ci = 1; otherwise, ci = 0. Fm represents the load force sensor data on the column head, and cort represents the correlation coefficient between the measured value of the strain gauge and the load force within the time t range.
  represents the calculated value of the mechanism model of the i th strain gauge, function f is a piecewise function, if it is satisfied
  , the function value is 0, otherwise, the function value is 1. Specification: Ti > 0.8, the strain gauge measurement value is valid.
On the basis of the validity of the measured values of the strain gauge, the deviation coefficients of the two models are calculated. The formula for solving the deviation coefficients is as follows:
 |
18 |
In Eq. (18),  and
and  represents the sum of error between the stress mapping value and the measured value of the data-driven model and the mechanism model respectively. n represents the number of strain gauge measurement data,
  represents the mapping value of the i th data of the data-driven model, and
  represents the mapping value of the i th data of the mechanism model. And the deviation coefficient representing the i th measurement data of the data-driven model
  and the mechanism model
  respectively, the deviation coefficient is solved by minimizing the sum of the error between the mapping value and the measurement value of the two models. At the same time, the inverse ratio of the sum of the deviation coefficients is used to determine the fusion weight coefficient of the two models. The stress data
  after fusion is as follows:
 |
19 |
Experiment
A 6,500 kN static and dynamic composite loading machine30 was used to test the unit hydraulic support column with a rated working resistance of 1000 kN. The testing machine can complete the full-scale indoor test research of roadway support equipment, which is mainly composed of three parts: test bench, hydraulic loading system and measurement and control system, as shown in Fig. 8.
Fig. 8.

6500kN static and dynamic composite loading testing machine.
There are 10 layers of strain gauges along the axial direction of the hydraulic column from top to bottom, each layer has 4 columns (except the fifth layer has 3 columns, reserved for one channel for pressure sensor), and a total of 39 strain gauges are arranged at an interval of 120°, 60°, and 60° in the clockwise direction. The loading parameters of the hydraulic column are as follows: the load of the four groups of tests is set at 600 kN, 800 kN, 1000 kN and 1200 kN respectively, the number of strain gauges is 39, the height of the emulsion is 900 mm, and the hydraulic column is placed perpendicular to the ground. It is worth noting that multi-parameter interaction is of great significance to the test results31. For example, the emulsion height is an important test parameter, but due to the limitation of test conditions, it cannot be changed for the time being, and the test results of this parameter will be increased in the future. The physical picture of the hydraulic column and strain gauge is shown in Fig. 9.
Fig. 9.
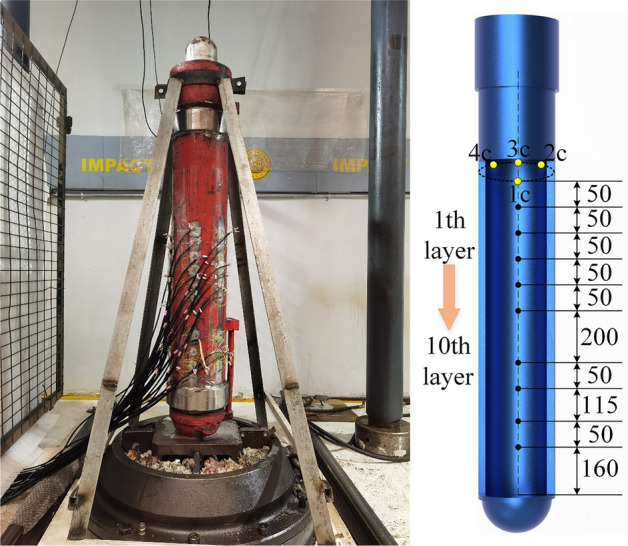
Hydraulic column and strain gauge physical picture.
In numerical simulation, boundary conditions refer to various restrictions and conditions imposed on the boundary of the simulation model, which have an important influence on the simulation results. However, because the boundary conditions are often simplified in the numerical simulation process, in order to ensure the accuracy of the simulation, it is necessary to verify whether these boundary conditions are consistent with the actual situation. The above test loads are input into the data-driven model and the mechanism model respectively. Figure 10 shows the statistical comparison of the results of the data-driven model, the mechanism model, the fusion results and the measurement results:
Fig. 10.

Comparison of test results.
It can be seen from the above figure that the fusion results of the two models are closer to the measured stress value, the mean absolute errors of the data-driven model results, mechanism model results, and fusion results with measured stress values are shown in Table 3. The variation trend of strain gauge data from layer 1 to layer 10 of the four groups of tests is generally the same, indicating that the probability of accidental error caused by uncertain factors in the test process is low, and the trend of the mapping results of the four groups of data-driven models is basically the same, indicating that the data-driven model has good generalization. It can be seen from Table 3 that the prediction error and experimental error of the four fusion models do not exceed 3.5%, indicating that the prediction accuracy of the fusion model is high. Because the fusion model is obtained by combining the data-driven model with the mechanism model, and the training data of the data-driven model are all provided by numerical simulation, which verifies the rationality of the boundary condition setting in numerical simulation. In addition, it can be seen from Fig. 9 that the maximum error between the calculated value of the mechanism model (i.e., the theoretical model) and the measured value of the strain gauge does not exceed 15 MPa, indicating the accuracy of the proposed mechanism model32. Considering the complex correlation between multi-source uncertain parameters in engineering practice, and the influence of noise and sensor zero drift on test data in each group of test data acquisition process is different33, which increases the difficulty of data fitting by data-driven model. Taking the fusion result of 600 kN in Table 3 as an example, the fusion result has a large error with the result measured by strain gauge. The main reason for this phenomenon is caused by the zero drift of the sensor : the strain value caused by low load is low, and the ratio of zero drift value to strain is large, so the collected strain error is large. Therefore, it is necessary to calibrate the zero point before using the sensor.
Table 3.
Mean absolute error.
| 600 kN group (%) | 800 kN group (%) | 1000 kN group (%) | 1200 kN group (%) | |
|---|---|---|---|---|
| Mechanism model | 3.817 | 6.282 | 8.027 | 5.514 |
| Data-driven model | 8.243 | 6.974 | 6.197 | 5.643 |
| Fusion | 3.086 | 1.783 | 1.182 | 1.548 |
Significant values are in bold.
By analyzing the data in Table 3, it can be seen that the performance of the mechanism model fluctuates with the increase of load, especially in the 1000 kN group, the error reaches the highest value of 8.027%, which indicates that the mechanism model may have poor adaptability under high load conditions. The data-driven model performed better in the 1200 kN test group, but the performance in the 600 kN group and the 800 kN group was not as good as the mechanism model. This may mean that the data-driven model can perform better under certain conditions. Among the prediction results of all groups, the error of the fusion model is the lowest, showing its stability and superiority under different load conditions. This shows that the fusion model can better combine the advantages of the mechanism model and the data-driven model.
Real-time performance is a key indicator of hydraulic column monitoring and control. Using random numbers as input data of the high-precision mapping method, 1000 times of cyclic execution and 5 times of repeated tests, the average measured time is 21.62 s, and the time for processing a single sample is 21.6 ms.
The hydraulic column digital platform is built, as shown in Fig. 11, to realize the visual display of all node stress, selected node stress value curve, hydraulic column maximum stress value curve, whether the stress value exceeds the material yield strength and other information. It is worth noting that in practical applications, there may be extreme temperatures or strong vibrations, and the column stress monitoring system needs to be adapted and optimized in many aspects to ensure its accuracy and reliability34. Therefore, the following aspects should be done well : It is the key to select the appropriate sensor material and design. Under extreme temperature conditions, the sensor material must have good thermal stability to avoid performance drift caused by temperature changes. Secondly, the use of vibration reduction design, such as the use of elastic mounting structure or damping pad to reduce the impact of vibration on the sensor. Finally, system encapsulation and protection measures can not be ignored. The use of high temperature resistant and corrosion resistant packaging materials, as well as sealing design, prolong the service life of the system. Through these comprehensive measures, the column stress monitoring system can maintain stable operation in extreme temperature and vibration environment, and provide reliable data support.
Fig. 11.

Hydraulic column digital platform.
As can be seen from Fig. 11, the mapping results are close to the numerical simulation results with the same boundary conditions, and the numerical simulation results are also highly restored in details. For example, the stress distribution on the cylinder surface near the piston, the header of the piston rod and the bottom of the cylinder in the mapping results are almost consistent with the numerical simulation results. After testing, the hydraulic column stress digital mapping period (sensor data input—mapping—rendering) is 0.32 s. In actual use, if the hydraulic column stress state is not required to be displayed, only the stress value is recorded. After testing, the mapping period of a single sample is 35.7 ms (sensor data input—mapping—data recording).
Conclusion
Hydraulic support is the key equipment of roadway support. Accurate and efficient sensing of hydraulic column stress state plays a key role in monitoring support state, adjusting support parameters and whether it can be safely mined. This paper studies the high-precision mapping of hydraulic column stress and draws the following conclusions:
Custom loss function is more suitable for hydraulic column stress monitoring scenarios, the data show that when the node stress is higher than 150 MPa, the mean absolute error of the data-driven model trained with stress weight loss function and boundary loss function is reduced by 4.91 MPa compared with the data-driven model trained with MAE loss function.
When calculating the edge stress of the hydraulic column cylinder of the special-shaped header, the special-shaped header can be equivalent to a round plate under different wall thickness and different load conditions.
The multi-model fusion method can improve the fitting accuracy of the real sensor data. The four groups of comparative experimental data show that the mean absolute error of the mapping results after model fusion is 1.9%. After testing, the hydraulic column stress mapping period is 0.32 s, which basically meets the requirements of real-time monitoring of the hydraulic column stress state. At the same time, it is found that the zero drift of the sensor will cause greater error in the collection of strain data under low load conditions, which can be improved by channel correction or optimization of sensor distribution.
In the future, based on the research in this paper, it will be combined with the digital twin framework of predictive maintenance, and the machine learning algorithm will be used to train the historical data to predict the failure mode and residual life of the hydraulic support. Combined with the column digital platform established in this paper, a more effective maintenance plan can be formulated. Based on the results of predictive analysis, the maintenance strategy is dynamically adjusted. At the same time, through the digital platform, the effects of different maintenance schemes can be simulated to select the optimal maintenance strategy and reduce maintenance costs and downtime. In addition, the digital platform of the hydraulic support is integrated with the digital twin system of other mining equipment, which can realize the collaborative optimization of multiple systems, and improve the operation efficiency and safety of the whole mine through the overall optimization.
Author contributions
Jianzhuo Zhang: Investigation, Resources, Writing—Original Draft, Funding acquisition. Chuanxu Wan: Formal analysis, Investigation, Writing—Original Draft. Jie Wang: Conceptualization, Supervision, Writing—Review & Editing. Ce Chen: Methodology, Validation, Resources. Tao Wang: Supervision, Data Curation. Kai Xu: Data curation, Validation, Resources.
Funding
This work was supported by the National Key Research and Development Program of China—Intelligent impact support technology and equipment for impact hazardous tunnels and engineering demonstration(2022YFC3004605); National Natural Science Foundation of China (Grant Nos. U1908222, 52104087 and 52174116).
Data availability
The data that support the findings of this study are available on request from the corresponding author, upon reasonable request.
Competing interests
The authors declare no competing interests.
Footnotes
Publisher’s note
Springer Nature remains neutral with regard to jurisdictional claims in published maps and institutional affiliations.
References
- 1.Yihui, P. et al. Support attitude and height analysis method of hydraulic support based on jack stroke drive. J. Min. Saf. Eng.40(06), 1231–1242 (2023). [Google Scholar]
- 2.Qiang, Z. et al. Structure optimal design research on backfill hydraulic support. J. Cent. S. Univ.7, 113–122 (2017). [Google Scholar]
- 3.Kunyu, X. et al. Research progress on failure analysis and life assessment of key components in hydraulic supports. China Surf. Eng.35(01), 97–106 (2022). [Google Scholar]
- 4.Yunyue, X. et al. Analysis of distribution characteristics of study on floor specific pressure of hydraulic support for deep mining based on impact loading. J. China Coal Soc.45(03), 982–989 (2020). [Google Scholar]
- 5.Zhiqiang, H. et al. The fracturing models of hard roofs and spatiotemporal law of mining-induced stress in a top coal caving face with an extra-thick coal seam. Geomech. Geophys. Geo-Energy Geo-Resour.7(1), 1–15 (2021). [Google Scholar]
- 6.Xuewen, W. et al. Stress analysis and stability analysis on doubly-telescopic prop of hydraulic support. Eng. Fail. Anal.32, 274–282 (2013). [Google Scholar]
- 7.Zhi, T. et al. Design and characteristics numerical analysis of energy absorption and anti-impact column. J. China Univ. Min. Technol.45(06), 1118–1123 (2016). [Google Scholar]
- 8.Yishan, P., Yimin, S. & Jun, L. Pattern, change and new situation of coal mine rockburst prevention and control in China. Chin. J. Rock Mech. Eng.42(09), 2081–2095 (2023). [Google Scholar]
- 9.Liang, Y. et al. Research progress of coal and rock dynamic disasters and scientific and technological problems in China. J. China Coal Soc.48(05), 1825–1845 (2023). [Google Scholar]
- 10.Qingliang, Z. et al. Dynamic response characteristics analysis of four column chock shield support under impact load. Coal Sci. Technol.51(01), 437–445 (2023). [Google Scholar]
- 11.Jiacheng, X. et al. Virtual monitoring method for hydraulic supports based on digital twin theory. Mining Technology2019, 1–11 (2019). [Google Scholar]
- 12.Fan, Z. et al. Fatigue life prediction on top beam of mine hydraulic support based on DT-LSTM. Min. Res. Dev.42(10), 192–200 (2022). [Google Scholar]
- 13.Xuhui, Z. et al. Predictive maintenance system for complex mining equipment based on digital twin. Chin. J. Eng. Des.29(05), 643–664 (2022). [Google Scholar]
- 14.Kun, Z. et al. Research and experimental verification of attitude perception method of advanced hydraulic support based on information fusion technology. J. China Coal Soc.48(S1), 345–356 (2023). [Google Scholar]
- 15.Hongyue, C. et al. Research on attitude monitoring method of advanced hydraulic support based on multi-sensor fusion. Measurement2022, 187 (2022). [Google Scholar]
- 16.Jingyi, C. et al. Technology of intelligent sensing of longwall shield supports status and roof strata based on massive shield pressure monitoring data. J. China Coal Soc.45(06), 2090–2103 (2020). [Google Scholar]
- 17.Minfu, L. et al. A fiber bragg grating tilt sensor for posture monitoring of hydraulic supports in coal mine working face. Measurement138, 305–313 (2019). [Google Scholar]
- 18.Jing, W. et al. A novel method for integrity assessment of soil-nailing works with actively heated fiber-optic sensors. J. Geotech. Geoenviron. Eng.150(8), 04024063 (2024). [Google Scholar]
- 19.Sunwu, X. et al. Equilibrium phase diagram design and structural optimization of SAC/ Sn-Pb composite structure solder joint for preferable stress distribution. Mater. Charact.206(PtA), 113389 (2023). [Google Scholar]
- 20.Yafeng, W. & Sigmund, O. Multi-material topology optimization for maximizing structural stability under thermo-mechanical loading. Comput. Methods Appl. Mech. Eng.407, 115938 (2023). [Google Scholar]
- 21.Jiayi, S. et al. An on-line imaging sensor based on magnetic deposition and flowing dispersion for wear debris feature monitoring. Mech. Syst. Signal Process.212, 111321 (2024). [Google Scholar]
- 22.Neto, E. A. L. & De Carvalho, F. D. A. T. An exponential-type kernel robust regression model for interval-valued variables. Inf. Sci.2018, S002002551-8303633 (2018). [Google Scholar]
- 23.Jiangpeng, S. et al. DF-CDM: Conditional diffusion model with data fusion for structural dynamic response reconstruction. Mech. Syst. Signal Process.222, 111783 (2024). [Google Scholar]
- 24.Yuyao, G. et al. Integrated modeling for retired mechanical product genes in remanufacturing: A knowledge graph-based approach. Adv. Eng. Inf.59, 102254 (2024). [Google Scholar]
- 25.Zhihui, L., Yulong, L. & Anmin, Y. Investigation of plastic deformation and brittle fracture in a thick-walled cylinder subjected to internal pressure. Chin. J. Appl. Mech.37(04), 1515–1520+1857 (2020). [Google Scholar]
- 26.Bomin, D. & Zhenglin, H. Chemical Equipment Design Book: Chemical Containers (Chemical Industry Press, 2003). [Google Scholar]
- 27.Kangyu, W. et al. Critical dynamic stress and cumulative plastic deformation of calcareous sand filler based on Shakedown theory. J. Mar. Sci. Eng.11(1), 195 (2023). [Google Scholar]
- 28.Siqiang, M. et al. A robust infrared small target detection method jointing multiple information and noise prediction: Algorithm and benchmark. IEEE Trans. Geosci. Remote Sens.61, 1–17 (2023). [Google Scholar]
- 29.Rentong, C. et al. Component uncertainty importance measure in complex multi-state system considering epistemic uncertainties. Chin. J. Aeronaut.37(12), 31–54 (2024). [Google Scholar]
- 30.Jianzhuo, Z. et al. Hydraulic impact test bench with 6 500 k N static and dynamic composite loading. J. China Coal Soc.45(05), 1648–1658 (2020). [Google Scholar]
- 31.Baoping, Z. et al. Impact of tunneling parameters on disc cutter wear during rock breaking in transient conditions. Wear560–561, 205620 (2024). [Google Scholar]
- 32.Chen, W. et al. Analysis of bidirectional magnetic field modulation on concentrated winding spoke-type PM machines. IEEE Trans. Transport. Electr.10(3), 6076–6086 (2024). [Google Scholar]
- 33.Haoran, F., Chong, W. & Shaohua, L. Novel method for reliability optimization design based on rough set theory and hybrid surrogate model. Comput. Methods Appl. Mech. Eng.429, 117170 (2024). [Google Scholar]
- 34.Baoping, Z. et al. Transient rock breaking characteristics by successive impact of shield disc cutters under confining pressure conditions. Tunnell. Undergr. Space Technol.150, 105861 (2024). [Google Scholar]
Associated Data
This section collects any data citations, data availability statements, or supplementary materials included in this article.
Data Availability Statement
The data that support the findings of this study are available on request from the corresponding author, upon reasonable request.