

Abstract
Cognitive load stimulates neural activity, essential for understanding the brain’s response to stress-inducing stimuli or mental strain. This study examines the feasibility of evaluating cognitive load by extracting, selection, and classifying features from electroencephalogram (EEG) signals. We employed robust local mean decomposition (R-LMD) to decompose EEG data from each channel, recorded over a four-second period, into five modes. The binary arithmetic optimization (BAO) algorithm employed to reduce the feature space and extract multi-domain features from modes, thereby optimizing classification performance. Using six optimized machine learning (ML) classifiers, we conducted an exhaustive study that encompassed both lead-wise and overall feature classification. We improved our method by combining R-LMD-based multi-domain features with BAO and optimized ensemble learning (OEL) classifiers. It was 97.4% accuracy (AC) at finding cognitive load in the MAT (mental arithmetic task) dataset and 96.1% AC at finding it in the STEW (simultaneous workload) dataset. In the same vein, this work introduces lead-wise cognitive load detection, which offers both temporal and spatial information regarding brain activity during cognitive tasks. We analyzed the 19 and 14 leads for the MAT and STEW, respectively. The F3 lead was notably noteworthy in its ability to analyze a variety of cognitive tasks, obtaining the maximum classification AC of 94.5% and 94%, respectively. Our approach (R-LMD+BAO+OEL) outperformed existing state-of-the-art techniques in cognitive load detection.
Keywords: Cognitive load, Lead-wise, EEG, R-LMD, BAO, OEL
Subject terms: Biomedical engineering, Electrical and electronic engineering
Introduction
EEG provides a direct measure of brain activity by recording electrical signals generated by neuronal oscillations. EEG is uniquely suited for workload assessment because it captures the brain’s response to varying cognitive demands with high temporal resolution1. Unlike heart rate variability (HRV), which reflects indirect measures of cognitive load, EEG can directly track neural correlates associated with mental effort, such as changes in frequency bands. Previous research has shown that specific EEG patterns correlate with different levels of workload, making it a powerful tool for real-time monitoring of cognitive states2.
Tasks require different mental resources, such as task-specific knowledge, attention, working memory, and decision-making. However, human brains have a limited capacity to process and combine this information. This limitation is known as cognitive load, representing the workload imposed on these finite cognitive resources2,3. In neuroscience, ongoing monitoring of cognitive workload has been shown to influence brain dynamics. Researchers often explore various physiological parameters such as heart rate4, facial expressions, pupil dilation5, and ocular metrics to estimate cognitive load. The visceral motor system, or autonomic nervous system, can influence these parameters. Stressful events can disrupt the balance between the sympathetic and parasympathetic nervous systems, leading to excessive activation and inhibition of the parasympathetic system6. This disruption can result in physiological changes such as altered respiration, HRV, skin conductance, and blood pressure7–9.
The purpose of detecting cognitive load using EEG signals is to assess an individual’s cognitive workload in real-time by analyzing their brain activity during specific tasks. This technology has valuable applications in healthcare, enabling the monitoring of cognitive load in patients with neurological conditions like dementia or traumatic brain injuries, etc10.
Literature survey
EEG has been demonstrated to be an invaluable tool in exploring and quantifying a myriad of mental workloads and functions, significantly advancing the fields of cognitive science and psychology. It plays a crucial role in monitoring and evaluating cognition by noninvasively examining functional changes in the brain. To extract the desired information from EEG data preprocessing, the key steps involve feature extraction, feature selection (FS), and classification. Numerous techniques for categorizing EEG-based data have been documented in the literature, and they have significantly impacted the field of medicine11–13.
By concentrating on analyzing brain responses during mental arithmetic tasks, Wang et al.14 devised a technique using the fractal dimension spectrum to assess mental workload. A technique for defining mental load across different degrees of mental arithmetic demands was presented by Zarjam et al.15. Even with these developments, noninvasive stress detection techniques still need to improve in accuracy. To close this gap, Shon et al.16 used a mixed method that included genetic algorithms (GA) to pick stress-related traits, improve the classifier’s settings, and boost stress recognition to 89 %. Sharma et al.17 used EEG signals to create a Bayesian-optimized K-nearest neighbors (KNN) classifier that can find cognitive stress while doing mental math. They got sample entropy characteristics with 96% accuracy by using a preprocessing pipeline that had a Savitzky-Golay filter and a Stationary Wavelet Transform (SWT). With the help of Random Forest (RF) and Wavelet Packet Transform (WPT), Hou et al.18 were able to accurately put four human emotions into groups using differential entropy (DE) features 87.3% of the time. Sadiq et al.19 presented an automated framework using multidomain features and feature selection for improved motor imagery EEG classification, with variational mode decomposition and a cascade-forward neural network achieved the better accuracy. Yu et al.20 proposed a framework using improved empirical Fourier decomposition (IEFD) and neural networks for classifying EEG motor and mental imagery tasks, achieving high accuracy and outperforming traditional methods for brain-computer interfaces (BCIs). Komolovaite et al.21,22 introduced convolution neural network (CNN) models (EEGNet) to categorize emotion types and facial inversion stimuli. Their research attempted to identify emotional states using EEG waves. A general mixture model (GMM) for emotion recognition was introduced by Murali et al.23, which used EEG signals to evaluate the psychological states of people with mental disabilities. EEGNet and DeepConvNet, two CNN models for emotion type classification and facial inversion stimuli, were presented in21.
Murali et al.23 used EEG signals to figure out how mentally disabled people were feeling and showed a general mixture model (GMM) for recognizing emotions. Safari et al.24 presents a method to assess mental workload using STEW- EEG data by analyzing effective brain connectivity. The brain connectivities were extracted and refined through a hierarchical feature selection process. The top features were classified using machine learning models, with SVM and forward feature selection achieving the highest accuracy of 89.53%. To estimate mental workload from EEG signals using deep neural networks. By analyzing brain connectivity with the direct Directed Transfer Function (dDTF) method and applying a deep hybrid model combining CNN and LSTM, the study achieved 83.12% accuracy in classifying workload levels using a subject-independent approach on the STEW dataset24. In25 combines EEG and eye-tracking data to classify mental workload during n-back tasks using machine learning. Involving 15 participants, it achieved 76.59% accuracy in a four-class workload classification, using 34 selected features, and highlights the synergy between EEG and eye-tracking in workload estimation. In26 EEG signal analysis with geometric features for early depression diagnosis, achieved 98.79% accuracy with KNN, surpassing traditional methods. Henry gas solubility optimization with feedforward neural network (FFNN) presented for automatic alcoholism detection, achieved 99.16% accuracy. By analyzing chaotic EEG patterns and using optimized features with neural networks27. Sadiq et al.28 reported a motor-imagery tasks classification in brain-computer interfaces achieved 95.3% accuracy. It uses denoising, wavelet decomposition, and 2D modeling, with neural networks for classification, outperforming existing methods. Sadiq et al.29 proposed a multivariate empirical wavelet transform (MEWT) algorithm and least-square support vector machine for motor imagery EEG classification. In30 multivariate variational mode decomposition(MVMD) and ReliefF feature selection methods were employed motor imaginary classification.
Yalcin et al.31 introduced a particle swarm optimization (PSO)-based artificial neural network (PSOANN) for epilepsy diagnosis and epileptic episode classification. It achieved an outstanding accuracy of 99.45%. In the wavelet framework, Acharya et al.32 described a method for automatically categorizing epileptic EEG activity. They were able to classify EEG segments with clinically acceptable accuracy and at a lower cost by using principal component analysis and a smaller set of data. This was possible because the Gaussian mixture model (GMM) classifier produced an AC of 98%. Akbari et al.33 proposed DWT+BPSO classifies seizure and seizure-free EEG signals with 99.3% accuracy using geometrical features from the Poincaré plot. A classification approach for obstructive sleep apnea (OSA) was described by Huseyin et al.34. Sadiq et al.35 introduced a pretrained CNN framework for classifying motor and mental imagery EEG signals in BCIs, achieving better accuracy with ShuffleNet. It highlights the effectiveness of pretrained models in preserving EEG time-frequency details for robust classification. Hassan et al.36 proposed by a multilayer perceptron neural network, a mutual information-based best individual feature (MIBIF) selection algorithm, and empirical mode decomposition to find epileptic seizures in EEG. Nature-inspired FS algorithms can be seen as an optimization task to reduce features space and increasing AC % or decreasing prediction errors37.
Many researchers consider FS to be an optimization process because of the huge search space and complex feature interactions. Depending on how they evaluate the selected feature subset, FS approaches are often split into two groups: filters and wrappers38. Instant filters assess the feature subset employing established techniques based on the data itself, wrapper approaches investigate the feature subset with the aid of a learning algorithm, such as classification. Genetic algorithms (GAs) have been developed in many forms to search for optimal feature subsets39. The literature was immersed in various FS approaches, utilizing metaheuristic algorithms to identify the best feature subsets. Ant-lion optimizer (ALO)40 mimics the hunting behavior of ants and is an example of a wrapper-based FS approach. The grey wolf optimizer (GWO), as described by Emily (2016) in her paper, is another innovative method that has successfully tackled FS problems. It was shown to work well for seven real engineering problems and 29 benchmark functions in a study41 that also utilized a wrapper-based method called moth-flame optimization to solve FS problems.
In reviewing the literature, it becomes evident that researchers have employed both traditional decomposition methods and FS techniques, often achieving suboptimal AC for various EEG applications. In this article, we have employed robust-local mean decomposition (RLMD), Binary arithmetic optimization (BAO), and optimized ensemble classifier (OEL) for signal decomposition, optimal FS, and classification respectively. This work provides the lead wise analysis for cognitive load detection. This approach helps researchers and clinicians investigate how different brain regions contribute to cognitive processes and how these processes vary across individuals and tasks.
RLMD offers several advantages over other methods such as DWT, SWT, SSA, and Circulant-SSA (CSSA) for EEG signal decomposition. Here are some reasons why RLMD may be preferred
Adaptive Decomposition: RLMD adaptively decomposes the signal into multiple components based on local mean estimation. This adaptive nature allows RLMD to capture both fast and slow varying components of the signal effectively, without relying on predefined basis functions or wavelets.
Local Feature Preservation: RLMD preserves local features of the signal during decomposition. Unlike some other methods that may smooth out or distort local features, RLMD aims to retain the characteristics of the signal at different scales.
Computationally Efficient: RLMD can be implemented efficiently, requiring fewer computations compared to some other methods like EMD, which involves iterative sifting processes. This makes RLMD suitable for real-time or online applications where computational efficiency is crucial.
BAO is a relatively newer optimization algorithm that has shown promise in various applications. Here are some reasons why BAO may be considered better to other optimization algorithms such as PSO, GA, BPSO, BGWO, Binary Salp Swarm Algorithm (BSSA), Binary Differential Evolution (BDE), Binary Bat Algorithm (BBA), and Binary Harris hawks Optimization (BHHO):
BAO is a specialized approach for binary optimization problems that leverages binary arithmetic operations to effectively navigate the solution space.
When applying arithmetic operations to binary optimization problems, BAO has demonstrated effective convergence rates. This allows it to effectively search the search space and arrive at optimal or nearly optimal solutions in a small number of iterations.
It is a metaheuristic algorithm that is known for having fewer control parameters compared to other algorithms. This characteristic simplifies the process of parameter tuning and enhances the user-friendliness.
BAO ensures population diversity, preventing premature convergence to suboptimal solutions, facilitating effective exploration and preventing stagnation in local optima.
An optimized ensemble classifier can offer several advantages over individuals, especially in classification accuracy, robustness, and generalization are critical. Here are some reasons why an optimized ensemble classifier might be preferred:
Improved Accuracy: Ensemble classifiers enhance classification accuracy by combining multiple base classifiers, leveraging diversity, and achieving higher accuracy than single classifiers alone.
Reduction of Overfitting: It reduces overfitting by integrating multiple models trained on varied data subsets or employing diverse algorithms. This approach captures broader patterns that are more generalizable, thereby mitigating the risk of noise or irrelevant features.
The outline of the paper’s formation is: Section II describes the dataset, while Section III explains the methods used. Section IV brings the results & discussion, and Section V offers the conclusion & future works.
EEG datasets
MAT and STEW were used in this work, which are publicly available to detect the lead-wise/overall cognitive load detection, described in the following subsections.
MAT
The National Technical University of Ukraine provided a dataset comprising 36 students aged between 18 and 26 years. These students completed a MAT involving two numbers serial subtraction. The EEG recording utilized 20 electrodes arranged in a 10-20 pattern across the scalp, despite 23 electrodes available. Each recording consists of artifact-free EEG segments lasting 3 minutes for the resting state with closed eyes and 1 minute for mental counting. It serves as a valuable resource about neural dynamics and cognitive processes during tasks42.
STEW
A publicly available EEG dataset was compiled for studying simultaneous task EEG workload activity. This dataset involved 48 male college students with 14 EEG electrodes positioned on their heads according to the 10-20 arrangement. Participants engaged in a single-session simultaneous capacity test. The experiment comprised two sections: initially, subjects spent 3 minutes in a relaxed position with eyes open, followed by completing the SIMKAP test. The last 3 minutes of this recording captured the workload condition43.
Methods
The EEG signals underwent decomposition into modes that is IMFs utilizing RLMD. Subsequently, entropy features were derived from these IMFs. The BAO technique was then employed to identify the optimal feature subset (SFeat) through a fitness function. The chosen features underwent classification using various optimized-based ML classifiers namely, tree, discriminant, navie Bayes, KNN, SVM, and EL. The proposed method diagram, depicted in Fig. 1, outlines the approach utilized in this study. Detailed explanations of the method are provided in the subsequent subsections.
Figure 1.

Cognitive load detection methodology diagram.
Signal preprocessing
In the preprocessing phase, various filters are utilized to minimize artifacts and obtain artifact-free signals. For the MAT dataset, to minimize artifacts, high-pass, low-pass, and power line notch filters with a cut-off frequency of 0.5 Hz, 45 Hz, and 50 Hz were employed respectively42. Conversely, for the STEW dataset, to mitigate artifacts, a high-pass filter set at 1 Hz, removal of line noise, artifact subspace reconstruction to eliminate high-amplitude artifacts, and re-referencing using data averaging were implemented43.
R-LMD decomposition
The original RLMD algorithm, an adaptive technique for analyzing time-frequency datasets, was based on the principle of decomposing a signal into a subset of simpler sub-signals. This approach is called as the LMD algorithm44. The ensuing content describes the LMD method for a given signal  with s = 0, 1, ..., and how it decomposes the signal into its mode functions (IMF1 to IMF5) as shown in Fig. 2.
Figure 2.

R-LMD based 5-level decomposition with their PSDs.
Step-1: The decomposition process commences by identifying all local extrema in the original signal ( ). We compute the amplitudes
  of two consecutive extrema
  and their local mean
  using Eq. 1.
 |
1 |
Step-2: Next derive the remaining sub-series by subtracting the initial local mean  from the original signal, resulting in the residual series
  as described in Eq. (2) and (3).
 |
2 |
Step-3: Divide  by
by  to perform amplitude modulation and obtain
  . Here,
  represents envelope function of frequency-modulated signal
  meeting the condition
  is 1. If this condition is not met,
  may be as an original signal, and the aforementioned steps will be reiterated until the target signal
  , where F is the total iterations, is generated.
 |
3 |
Step-4: Retrieve the envelope  (s) using the following formula:
 |
4 |
 |
Step-5: Multiply  by the
  to produce the first product function (IMF1)
  which often y(s) signal that is highest frequency component.
 |
5 |
 |
6 |
While the LMD algorithm demonstrates advantages by eliminating negative frequencies from extracted signal subsets, it frequently encounters challenges such as end effects and mode mixing. In response, the RLMD method addresses these issues by initially identifying and refining parameters related to envelope estimation, boundary conditions, and the stopping criterion for sifting. This new RLMD algorithm aims to resolve these issues concurrently. Further information on the RLMD algorithm is available in45. Figure 2 illustrates the segmented EEG signal along with its decomposition and power spectral density (PSD).
Feature extraction
Feature extraction is essential for obtaining useful information from raw EEG signals to enable accurate classification. In this study, we extracted multi-domain features from different domains, including the time domain (Skewness (SN), Kurtosis (KT)), frequency domain (power spectrum density (PSD)), and entropy-based features (Fuzzy entropy (FE), renyi’s entropy (RE), differential entropy (DE))46–48. Which are described in the following subsections.
PSD
PSD quantifies the distribution of signal power among various frequency components. For IMFs derived from an EEG signal, that provides insight into the frequency content and power distribution of the individual IMFs. This is particularly useful in analyzing the characteristics of EEG signals, which are inherently non-stationary and complex. For a given IMF x(t) from an EEG signal, the PSD P(f) is defined as the Fourier transform of the autocorrelation function  of the signal:
 |
7 |
Here, f is the frequency, and  is the autocorrelation function of the signal x(t).
However we have extract the KT and SN from IMFs. KT helps in analyzing the distribution characteristics of the signal components. SN can provide insights into a cognitive load, as certain cognitive states may induce asymmetrical EEG signal patterns49,50.
FE
Chen et al. introduced the FE concept. Based on sample and estimated entropies, a more efficient method addresses their drawbacks. We substitute the Gaussian function for the Heaviside function when comparing two vectors. The Heaviside function’s leaping feature separates Shannon entropy from approximation entropy. FE can successfully circumvent the limitations and approximation entropy of the sample due to the continuation of the Gaussian function. We compute FE using Equ 10.
 |
8 |
RE
Non-parametric estimation is used to determine Renyi’s quadratic entropy51. This equation was used to calculate it for the random variable  52.
52.
 |
9 |
Here,  and
and  reflect the dataset samples
  and
and  . A Gaussian kernel function
  is represented by N, the number of samples.
DE
According to information theory, DE quantifies the average level of unpredictability of a random variable when subjected to continuous probability distributions. People often refer to it as continuous entropy.
 |
10 |
h(x) is the probability density of a random variable x. Therefore, the DEn can be expressed as53 for any time series x that conforms to the Gauss distribution,  .
.
 |
11 |
FS using AOA
Arithmetic Optimization Algorithm (AOA) is inspired by fundamental arithmetic operations such as addition, subtraction, multiplication, and division54. Exploration and exploitation are the two stages of the AOA search process. These phases encompass the subsequent steps:
 |
12 |
In the current iteration, x1 exhibits a uniform distribution within the range of (0, 1), with the math optimizer accelerated (MOA) function serving as the coefficient. This computation takes place in the following manner:
 |
13 |
Where Max and Min are maximum and minimum values of MOA and  is maximum iteration.
Exploration
Using division and multiplication operators, we randomly search for solutions during the exploration phase and update them as follows:
 |
14 |
Here  is the
  position of the
  solution
  iteration,
  is
is  position of the best solution,
  and
and  are the upper and lower bounds for the
  position, individually,
  is a integer,
  controls the search process during the exploration phase,
  follows a uniform distribution over the interval (0,1). Moreover, the Math Optimizer Probability (MOP) is computed as follows:
 |
15 |
MOP(i) is the function value at iteration i and  is a sensitive number that characterizes the exploration’s correctness when iterating within the range of (0,10).
Exploitation
In the exploitation phase, solutions are continuously refined and adjusted through the use of subtraction and addition operators, leading to the following updates:
 |
16 |
where  follows a uniform distribution in (0,1)
Proposed algorithm BAO
The FS aim is to choose the best subset of features and remove unnecessary ones. Because of its flexibility and computing efficiency, the Arithmetic Optimization Algorithm (AOA) is an excellent solution for continuous optimization issues, yet it encounters difficulties when dealing with discrete optimization, especially combinatorial problems. BAOAs, or Binary Arithmetic Optimization Algorithms, provide different methodologies for FS to overcome this. We utilize Lévy flight in conjunction with transfer functions to transform the continuous search space into a discrete form, thereby improving search performance and the capacity to escape local optima.
Transfer function
Combinatorial optimization issues prevent the AOA from directly addressing FS. According to Mirjalili (2013), transfer functions are very efficient at converting continuous variables to discrete values. Six distinct transfer functions, derived from two families: S-shaped and V-shaped, carry out discretization to accomplish this. For example, the S-shaped transfer function is used to transform the PSO algorithm into a binary representation, with the accompanying transfer probability computed as described in Kennedy’s work (kennedy1997discrete):
 |
17 |
where  denotes the position in dimension l at iteration i, and the position is updated according to the following formula:
 |
18 |
Conversely, the V-shaped transfer function is utilized to convert the continuous form into a binary form. The transfer probability is then calculated as outlined in55:
 |
19 |
Next, the position is updated as follows:
 |
20 |
where  represents the complement of
Le’vy flight
The Le’vy flight is a form of non-Gaussian random walk where each step is characterized by isotropic random directions in a multidimensional space56. Furthermore, studies have indicated that the significant alteration brought about by the Le’vy flight is advantageous for escaping from local optima and achieving the ideal solution (Zhao, 2020). To overcome the limitations of poor convergence speed and weak search efficiency in the AOA, we have incorporated the use of Le’vy flying in our algorithms. This integration has led to the following updated solution:
 |
21 |
The variable  denotes the a-th solution at iteration i+1. The expression sign[rand-0.5] can take on three values: 1, 0, or − 1. The symbol
  represents element-wise multiplication, whereas Le’vy refers to the random search path that follows the Le’vy distribution, as seen below:
 |
22 |
where F is the Le’vy flight’s step length, indicated as follows, and  establishes the Le’vy distribution’s form.
 |
23 |
where 
 M(0,
M(0, , y
, y  M(0,1) and
  is shown as follows:
 |
24 |
where  is the standard Gamma function and
  .
.
Fitness function
Solutions are discrete sequences of 1 and 0’s during the FS process: a one means that the corresponding feature is not selected, and a zero means that it is selected. These solutions are then evaluated using ML classifiers57. It is also important to guarantee a minimum number of selected features and maximum classification AC during the evaluation of the solutions these two factors are incorporated into the fitness function, which is formulated as follows58:
 |
25 |
Here,  denotes the classification error rate from the classifiers,
  represents the total number of features,
  is the count of selected features,
  signifies the importance of classification quality, and k indicates the weight of the feature reduction rate59. Figure 3 shows the fitness curves for the selected features in the MAT and STEW datasets.
Figure 3.
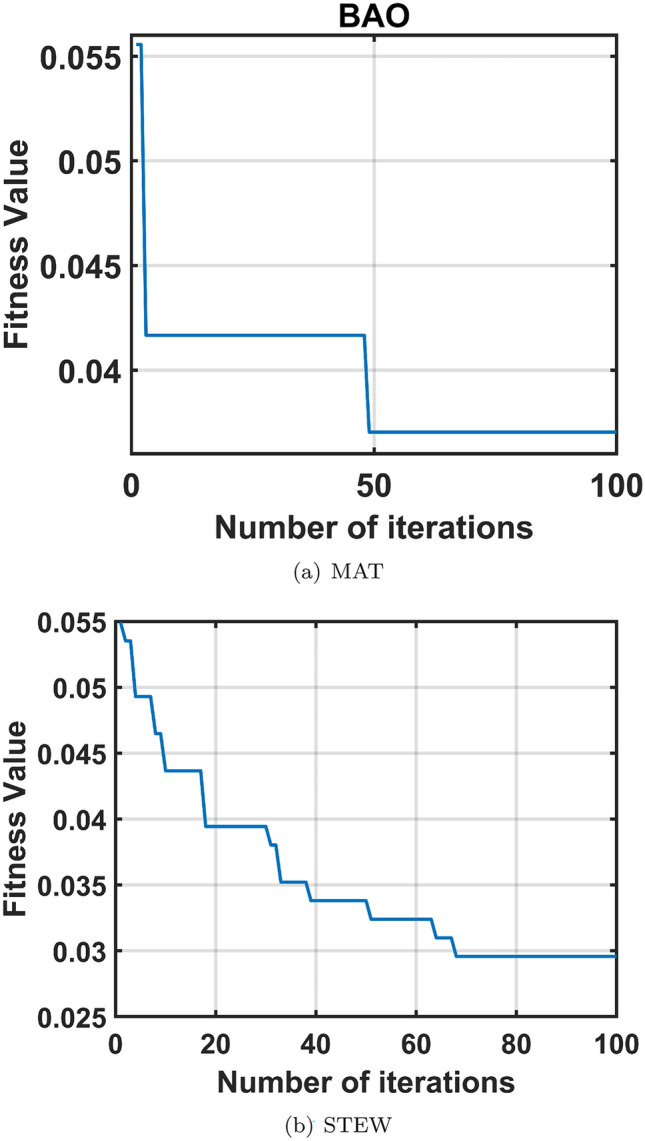
Fitness curves generated by BAO.
Classification using optimized ML classifiers
Classification using optimized machine learning classifiers involves fine-tuning algorithms to achieve maximum performance for specific tasks. This process includes selecting the best features, adjusting hyperparameters, and applying techniques to prevent overfitting. When analyzing EEG signals, optimized classifiers significantly improve the accuracy and efficiency of identifying various states or conditions based on the extracted features from the EEG data60. In this work, six optimized ML classifiers were employed to classify the data via three performance metrics such as AC, SE, and SP61.
Results and discussion
The presented method was implemented and tested using MATLAB R2022a on a system with an Intel Core i7 CPU and 16 GB of RAM. The results were analyzed in two ways: lead-wise and overall features using R-LMD. Due to the large number of features, the BAO FS method was used to select the optimal features for lead-wise and overall features. The following subsections describe the results and analysis.
Overall
We examined the identified parameters on the EEG datasets using R-LMD, BAO, and optimized ML classifiers in the overall analysis. Table 1 presents the results of the MAT dataset. The BAO+OEL technique yielded a maximum AC, SE, and SP of 97.4%, 97%, and 98% for the MAT dataset. Additionally, the dataset produced the greatest results for AC, SE, and SP for the STEW dataset, which were 96.1%, 96%, and 97%, respectively. Table 2 shows the outcomes for the STEW dataset. The lowest error classification rate is lower, and the MAT dataset fared better in terms of outcomes than the STEW dataset. Figures 4 and 5 display the classification error plot, confusion matrix, and ROC of the MAT and STEW datasets, respectively.
Table 1.
MAT dataset results using optimized ML classifiers.
| Optimized classifiers | AC % | SE % | SP % |
|---|---|---|---|
| Tree | 94.6 | 95 | 94 |
| Discriminant | 90.5 | 89 | 92 |
| Naive Bayes | 91.8 | 92 | 91 |
| KNN | 96.2 | 97 | 96 |
| SVM | 95.3 | 94 | 96 |
| EL | 97.4 | 97 | 98 |
Significant values are given in bold.
Table 2.
STEW dataset results using optimized ML classifiers.
| Optimized classifier | AC % | SE % | SP % |
|---|---|---|---|
| Tree | 95.2 | 97 | 94 |
| Discriminant | 91.8 | 93 | 91 |
| Naive Bayes | 94.4 | 95 | 94 |
| KNN | 95.9 | 96 | 97 |
| SVM | 94.7 | 97 | 92 |
| EL | 96.1 | 96 | 97 |
Significant values are given in bold.
Figure 4.

OEL Performance of MAT dataset.
Figure 5.

OEL Performance of STEW dataset.
Lead-wise
In this section, we conducted a lead-wise analysis of EEG datasets using the OEL classifier, chosen for its overall performance among the six optimized ML classifiers. In EEG datasets, we used lead features (19 for MAT and 14 for STEW). Tables 3 and 4 show the results, lead-wise, using the proposed approach for EEG datasets. The lead F3 exhibits superior AC, SE, and SP values of 94.5%, 93%, and 96% compared to the other leads in MAT. However, for STEW, the AC, SE, and SP values of the F3 lead are 94%, 93%, and 95%. According to the findings, the frontal lead F3 is more prominent in detecting cognitive load.
Table 3.
MAT dataset lead-wise results.
| Lead | AC % | SE % | SP % |
|---|---|---|---|
| FP1 | 91.1 | 91 | 91 |
| FP2 | 93.9 | 94 | 94 |
| Fz | 90.7 | 90 | 91 |
| F3 | 94.5 | 93 | 96 |
| F4 | 92.9 | 92 | 94 |
| F7 | 89.4 | 88 | 91 |
| F8 | 90.0 | 88 | 92 |
| T3 | 90.6 | 91 | 90 |
| T4 | 80.1 | 79 | 81 |
| T5 | 86.8 | 85 | 89 |
| T6 | 88.1 | 99 | 77 |
| P3 | 88.2 | 87 | 89 |
| P4 | 89.1 | 89 | 90 |
| Pz | 89.0 | 89 | 89 |
| O1 | 90.5 | 93 | 88 |
| O2 | 64.5 | 84 | 45 |
| C3 | 89.8 | 92 | 88 |
| C4 | 87.3 | 91 | 83 |
| Cz | 88.9 | 88 | 90 |
Significant values are given in bold.
Table 4.
STEW dataset lead-wise results.
| Lead | AC % | SE % | SP % |
|---|---|---|---|
| AF3 | 90.4 | 91 | 89 |
| F7 | 92.9 | 92 | 94 |
| F3 | 94.0 | 93 | 95 |
| FC5 | 90.2 | 90 | 90 |
| T7 | 90.7 | 90 | 92 |
| P7 | 88.4 | 89 | 88 |
| O1 | 90.5 | 90 | 91 |
| O2 | 90.5 | 93 | 88 |
| P8 | 87.2 | 99 | 75 |
| T8 | 88.2 | 86 | 90 |
| FC6 | 89.3 | 90 | 89 |
| F4 | 93.4 | 94 | 93 |
| F8 | 89.5 | 89 | 91 |
| AF4 | 90.7 | 90 | 92 |
Significant values are given in bold.
The boxplots in Fig. 6 display the top 3 leads that have achieved better classification performance of the proposed model for the MAT dataset as presented in Table 3, illustrating the interclass distribution of selected features. Conversely, the remaining signal features exhibit lower values than the task signal. Similarly, Fig. 7 shows the top 3 leads for the STEW dataset as presented in Table 4, along with the distribution of the remaining dimensions. The x-axis represents the lead name and the y-axis is extracted values of that lead.
Figure 6.

Top 3 leads box plot of MAT.
Figure 7.

Top 3 leads box plot of STEW.
In Fig. 8, we present topographical maps illustrating the top three leads. These maps have been generated using features that represent spatial brain activity during both resting and task states. They show brain activity by assessing the values of three distinct leads across various brain regions. The maps can be used to identify changes in brain activity associated with rest and cognitive tasks. The frontal lobes, which are involved in higher-level cognitive tasks, are highlighted in these maps. Differences in brain activity between rest periods and cognitive tasks are evident. These topographical maps are useful for analyzing cognitive load about underlying neural activity.
Figure 8.

Topographic map for top 3 leads to rest and task states.
We statistically analysed the EEG data to determine whether there were significant differences in brain signals between states of rest and mental task load. The ANOVA test  showed this. The OEL classifier experienced the highest classification AC of 97.4% for the MAT dataset and 96.1% for the STEW dataset. We achieved an AC of 94.5% and 94% in lead-wise classification. The classification’s performance was much better than that of the other optimized classifiers
The decomposition level is a crucial tuning parameter for R-LMD, along with the number of iterations for BAO. The proposed techniques were tested using various values of these parameters, with the results visually presented in Fig. 9 for overall and lead-wise analysis of the MAT dataset. It was observed that a decomposition level of L = 5 and iterations I = 100 yielded the best results therefore, these values were consistently used throughout the study.
Figure 9.
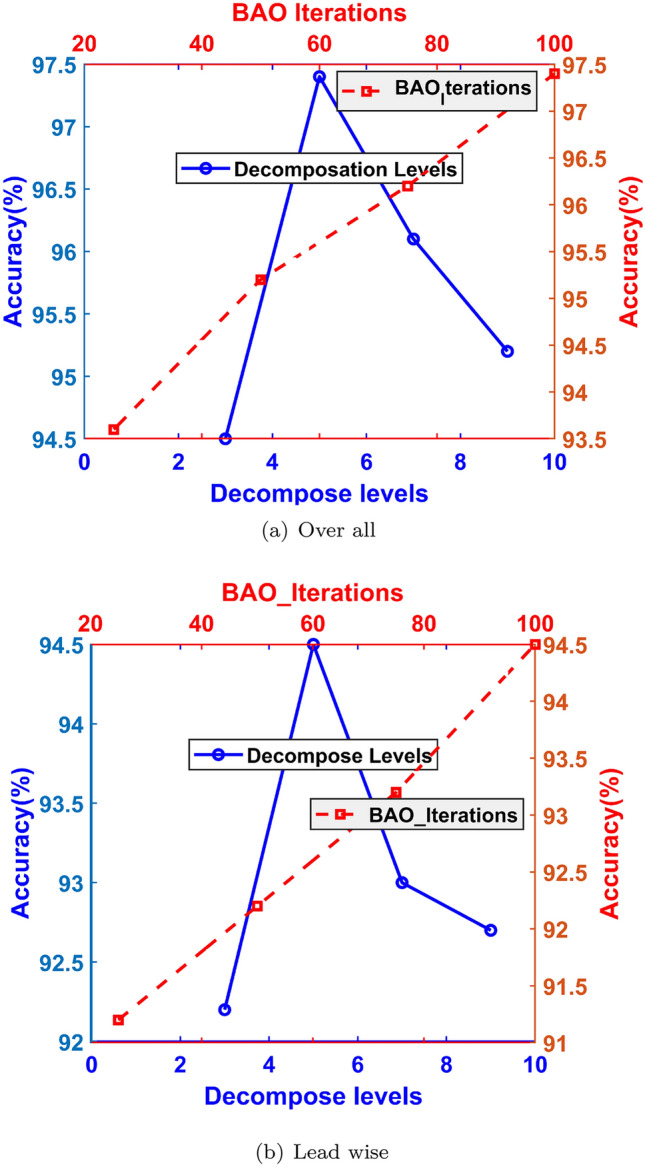
Plot shows variance in classification AC (%) for tuning parameters of R-LMD and BAO..
Discussion
Table 5 compares the proposed study to previous machine learning models, optimization models, and decomposition methods. Researchers extensively use the discrete wavelet transform (DWT) in statistical signal processing applications, particularly in fields like EEG analysis. Researchers use the SWT to counteract the DWT’s lack of translation invariance. This method is considered redundant because the number of samples in each level of the SWT output is equal to the number of samples in the input. An example of an EMD application is the Hilbert-Huang Transform (HHT). It extracts time-frequency information from a signal that exhibits nonlinear behavior and is not constant across time62–64. This classifier’s key component is decomposing an EEG signal into modes. Due to the phenomenon of mode mixing, this particular method presents greater complexity compared to alternative approaches. The approach adapts to different resolutions and uses data to detect signals. This system is extremely sensitive to noise, and the phenomenon of mode-mixing could further complicate matters. Hence, the attributes extracted from the EEG data have a substantial influence on the accuracy of the classification. This study employed the R-LMD method to decompose the signals. It decomposes signals into modes, each of which corresponds to a unique frequency component. This multiscale decomposition, which collects both low- and high-frequency EEG patterns linked to cognitive stress, makes it easier to pick up on small changes in brain activity. BAO method was used to select the most significant features from all the available ones. BAO has the capability to process high-dimensional data that contains a significant number of features, resulting in efficient and speedy computing performance. When compared to the WOA, the BSSA, and BHHO, these are often demanding more time and may lead to reduced performance metrics65–67. We used six ML classifiers with K-fold cross-validation (10-fold CV) to categorize the selected characteristics using BAO. 10-fold CV provides a robust, efficient, and reliable way to evaluate model performance. It balances the need for accurate performance estimation with computational feasibility, making it a preferred choice for many machine learning practitioners. They improve accuracy, prevent overfitting, and involve hyperparameter adjustment.
Table 5.
Comparison with existing approaches.
| Reference/year | Method | AC (%) | SE (%) | SP (%) | Dataset |
|---|---|---|---|---|---|
| Ref.62 /2020 | DWT+KNN | 96.6 | 97 | 96.8 | DEAP |
| Ref.65/2012 | SWT+WOA+SVM | 97.25 | 97.21 | 98.1 | MAT |
| Ref.67/2022 | Ci-SSA+KNN | 95.28 | 94 | 95 | MAT |
| Ref.63/2017 | HHT+SVM | 89.07 | 90.12 | 89 | MAT |
| Ref.68/2021 | SWT+KNN | 96 | 96.72 | 95.62 | MAT |
| Ref.69/2016 | WT+SVM | 93.36 | 92.59 | 94.71 | MAT |
| Ref.17/2021 | SWT+Optimized-KNN | 94 | 92.1 | 94.83 | MAT |
| Ref.66/2023 | Ci-SSA+BHHO+KNN | 96.88 | 96 | 98 | MAT |
| Ref.70/2019 | EMD+SVM | 93.14 | 92 | 94.44 | STAI |
| Ref.71/2023 | Pooling function+SVM | 96.42 | 96.11 | 97.52 | MAT |
| Ref.72/2024 | VMD+LightGBM | 97.2 | 97.4 | 96.9 | MAT |
| Ref.64/2020 | DCT+BPSO+SVM | 96.36 | 96.85 | 90.8 | NEMAR |
| Proposed | R-LMD+BAO+OEL | 97.4 | 97 | 98 | MAT |
| R-LMD+BAO+OEL | 96.1 | 96 | 97 | STEW |
Significant values are given in bold.
Conclusion
This study introduces novel techniques for computing multi-domain features to detect cognitive load in two datasets: MAT and STEW. Two scenarios for analysis were employed: lead-wise and overall. The EEG signals were segmented and decomposed into five modes using R-LMD, from which multidomain features were extracted. FS was performed using BAOA. Six optimizable ML models were trained and evaluated using 10-fold cross-validation. The highest classification accuracy (AC) achieved in the overall analysis was 97.4% for the MAT dataset and 96.1% for the STEW dataset. In lead-wise analysis, 19 leads for MAT and 14 leads for STEW were used, with the F3 lead achieving the best accuracy at 94.5% and 94%, respectively. The proposed methodology (R-LMD + BAO + OEL) demonstrated superior performance compared to earlier methods in identifying cognitive load EEG signals through decomposition, feature extraction, and FS techniques. The future scope of proposed work is:
Deep learning models can enhance classification accuracy.
Noise and artifact reduction techniques can be used during the preprocessing stage.
Additional decomposition techniques, features, and feature selection methods could be investigated.
Acknowledgements
The authors are thankful to the coordinator of Signals and Systems lab, QIS College of Engineering and Technology for computational resources.
Author contributions
JY: Methodology, implementation, validation, writing a draft; KS: supervision; VR: conceptualization; KS: Editing and writing, MA: validation of results; YMK: Implementation.
Data availability
In this work, two publicly available MAT https://archive.physionet.org/cgi-bin/atm/ATM and STEW https://ieee-dataport.org/open-access/stew-simultaneous-task-eeg-workload-dataset datasets were used.
Declarations
Competing interests
The authors declare no competing interests.
Footnotes
Publisher’s note
Springer Nature remains neutral with regard to jurisdictional claims in published maps and institutional affiliations.
References
- 1.Teplan, M. et al. Fundamentals of eeg measurement. Meas. Sci. Rev.2(2), 1–11 (2002). [Google Scholar]
- 2.Antonenko, P., Paas, F., Grabner, R. & Van Gog, T. Using electroencephalography to measure cognitive load. Educ. Psychol. Rev.22(4), 425–438 (2010). [Google Scholar]
- 3.Paas, F., Tuovinen, J. E., Tabbers, H. & Van Gerven, P. W. Cognitive load measurement as a means to advance cognitive load theory. Educ. Psychol.38(1), 63–71 (2003). [Google Scholar]
- 4.Duman, R. S. Neurobiology of stress, depression, and rapid acting antidepressants: remodeling synaptic connections. Depress. Anxiety31(4), 291–296 (2014). [DOI] [PMC free article] [PubMed] [Google Scholar]
- 5.Deschênes, A., Forget, H., Daudelin-Peltier, C., Fiset, D. & Blais, C. Facial expression recognition impairment following acute social stress. J. Vis.15(12), 1383–1383 (2015). [Google Scholar]
- 6.Wielgosz, J., Schuyler, B. S., Lutz, A. & Davidson, R. J. Long-term mindfulness training is associated with reliable differences in resting respiration rate. Sci. Rep.6(1), 27533 (2016). [DOI] [PMC free article] [PubMed] [Google Scholar]
- 7.He, J., Li, K., Liao, X., Zhang, P. & Jiang, N. Real-time detection of acute cognitive stress using a convolutional neural network from electrocardiographic signal. IEEE Access7, 42710–42717 (2019). [Google Scholar]
- 8.Oliveira Filho, F., Ribeiro, F., Cruz, J.L., de Castro, A.N. & Zebende, G. Statistical study of the eeg in motor tasks (real and imaginary). Phys. A: Stat. Mech. Appl.622, 128802 (2023).
- 9.Abdulwahhab, A. H., Abdulaal, A. H., Al-Ghrairi, A. H. T., Mohammed, A. A. & Valizadeh, M. Detection of epileptic seizure using eeg signals analysis based on deep learning techniques. Chaos Solitons Fract.181, 114700 (2024). [Google Scholar]
- 10.Tasci, G. et al. Qlbp: Dynamic patterns-based feature extraction functions for automatic detection of mental health and cognitive conditions using eeg signals. Chaos Solitons Fract.172, 113472 (2023). [Google Scholar]
- 11.Dedovic, K. et al. The montreal imaging stress task: using functional imaging to investigate the effects of perceiving and processing psychosocial stress in the human brain. J. Psychiatry Neurosci.30(5), 319–325 (2005). [PMC free article] [PubMed] [Google Scholar]
- 12.Wan, W. et al. Resting state eeg complexity as a predictor of cognitive performance. Phys. A624, 128952 (2023). [Google Scholar]
- 13.Boaretto, B. R., Budzinski, R. C., Rossi, K. L., Masoller, C. & Macau, E. E. Spatial permutation entropy distinguishes resting brain states. Chaos Solitons Fract.171, 113453 (2023). [Google Scholar]
- 14.Wang, Q. & Sourina, O. Real-time mental arithmetic task recognition from eeg signals. IEEE Trans. Neural Syst. Rehabil. Eng.21(2), 225–232 (2013). [DOI] [PubMed] [Google Scholar]
- 15.Zarjam, P., Epps, J. & Lovell, N.H. Characterizing mental load in an arithmetic task using entropy-based features. In: 2012 11th International Conference on Information Science, Signal Processing and their Applications (ISSPA), IEEE, pp. 199–204 (2012).
- 16.Shon, D. et al. Emotional stress state detection using genetic algorithm-based feature selection on eeg signals. Int. J. Environ. Res. Public Health15(11), 2461 (2018). [DOI] [PMC free article] [PubMed] [Google Scholar]
- 17.Sharma, L. D., Chhabra, H., Chauhan, U., Saraswat, R. K. & Sunkaria, R. K. Mental arithmetic task load recognition using eeg signal and bayesian optimized k-nearest neighbor. Int. J. Inf. Technol.13(6), 2363–2369 (2021). [Google Scholar]
- 18.Zhang, J. & Min, Y. Four-classes human emotion recognition via entropy characteristic and random forest. Inf. Technol. Control49(3), 285–298 (2020). [Google Scholar]
- 19.Sadiq, M. T. et al. Toward the development of versatile brain-computer interfaces. IEEE Trans. Artif. Intell.2(4), 314–328 (2021). [Google Scholar]
- 20.Yu, X., Aziz, M. Z., Sadiq, M. T., Fan, Z. & Xiao, G. A new framework for automatic detection of motor and mental imagery eeg signals for robust bci systems. IEEE Trans. Instrum. Meas.70, 1–12 (2021).33776080 [Google Scholar]
- 21.Komolovaitė, D., Maskeliūnas, R. & Damaševičius, R. Deep convolutional neural network-based visual stimuli classification using electroencephalography signals of healthy and alzheimer’s disease subjects. Life12(3), 374 (2022). [DOI] [PMC free article] [PubMed] [Google Scholar]
- 22.Yedukondalu, J., Karaddi, S.H., Bindu, C.H., Sharma, D., Sarkar, A.K. & Sharma, L.D. Automated metal surface flaws detection using convolutional neural network and deep visualization analysis. Arab. J. Sci. Eng. 1–12 (2024).
- 23.Krishna, N. M. et al. An efficient mixture model approach in brain-machine interface systems for extracting the psychological status of mentally impaired persons using eeg signals, Ieee. Access7, 77905–77914 (2019). [Google Scholar]
- 24.Safari, M., Shalbaf, R., Bagherzadeh, S. & Shalbaf, A. Classification of mental workload using brain connectivity and machine learning on electroencephalogram data. Sci. Rep.14(1), 9153 (2024). [DOI] [PMC free article] [PubMed] [Google Scholar]
- 25.Aksu, ŞH., Çakıt, E. & Dağdeviren, M. Mental workload assessment using machine learning techniques based on eeg and eye tracking data. Appl. Sci.14(6), 2282 (2024). [Google Scholar]
- 26.Akbari, H., Sadiq, M.T., Payan, M., Esmaili, S.S., Baghri, H. & Bagheri, H. Depression detection based on geometrical features extracted from sodp shape of eeg signals and binary pso. Traitement du Signal38(1) (2021).
- 27.Sadiq, M. T., Akbari, H., Siuly, S., Li, Y. & Wen, P. Alcoholic eeg signals recognition based on phase space dynamic and geometrical features. Chaos Solitons Fract.158, 112036 (2022). [Google Scholar]
- 28.Sadiq, M. T., Yu, X., Yuan, Z. & Aziz, M. Z. Motor imagery bci classification based on novel two-dimensional modelling in empirical wavelet transform. Electron. Lett.56(25), 1367–1369 (2020). [Google Scholar]
- 29.Sadiq, M. T. et al. Motor imagery eeg signals decoding by multivariate empirical wavelet transform-based framework for robust brain-computer interfaces. IEEE Access7, 171431–171451 (2019). [Google Scholar]
- 30.Sadiq, M. T., Yu, X., Yuan, Z., Aziz, M. Z., ur Rehman, N., Ding, W., & Xiao, G. Motor imagery bci classification based on multivariate variational mode decomposition. IEEE Trans. Emerg. Top. Comput. Intell.6(5), 1177–1189 (2022).
- 31.Yalcin, N., Tezel, G. & Karakuzu, C. Epilepsy diagnosis using artificial neural network learned by pso. Turk. J. Electr. Eng. Comput. Sci.23(2), 421–432 (2015). [Google Scholar]
- 32.Acharya, U. R., Sree, S. V., Alvin, A. P. C. & Suri, J. S. Use of principal component analysis for automatic classification of epileptic eeg activities in wavelet framework. Expert Syst. Appl.39(10), 9072–9078 (2012). [Google Scholar]
- 33.Akbari, H., Sadiq, M. T., Jafari, N., Too, J., Mikaeilvand, N., Cicone, A. & Serra Capizzano, S. Recognizing seizure using poincaré plot of eeg signals and graphical features in dwt domain. Brat. Med. J. (2023). [DOI] [PubMed]
- 34.Gürüler, H., Şahin, M. & Ferİkoglu, A. Feature selection on single-lead ecg for obstructive sleep apnea diagnosis. Turk. J. Electr. Eng. Comput. Sci.22(2), 465–478. (2014)
- 35.Sadiq, M. T. et al. Exploiting pretrained cnn models for the development of an eeg-based robust bci framework. Comput. Biol. Med.143, 105242 (2022). [DOI] [PubMed] [Google Scholar]
- 36.Hassan, K. M., Islam, M. R., Nguyen, T. T. & Molla, M. K. I. Epileptic seizure detection in eeg using mutual information-based best individual feature selection. Expert Syst. Appl.193, 116414 (2022). [Google Scholar]
- 37.Hichem, H., Elkamel, M., Rafik, M., Mesaaoud, M. T. & Ouahiba, C. A new binary grasshopper optimization algorithm for feature selection problem. J. King Saud Univ. Comput. Inf. Sci.34(2), 316–328 (2022). [Google Scholar]
- 38.Liu, H. & Motoda, H. Feature extraction, construction and selection: A data mining perspective, Vol. 453, Springer Science & Business Media, (1998).
- 39.Oh, I.-S., Lee, J.-S. & Moon, B.-R. Hybrid genetic algorithms for feature selection. IEEE Trans. Pattern Anal. Mach. Intell.26(11), 1424–1437 (2004). [DOI] [PubMed] [Google Scholar]
- 40.Mirjalili, S. The ant lion optimizer. Adv. Eng. Softw.83, 80–98 (2015). [Google Scholar]
- 41.Mirjalili, S. Moth-flame optimization algorithm: A novel nature-inspired heuristic paradigm. Knowl.-Based Syst.89, 228–249 (2015). [Google Scholar]
- 42.Zyma, I. et al. Electroencephalograms during mental arithmetic task performance. Data4(1), 14 (2019). [Google Scholar]
- 43.Lim, W. L., Sourina, O. & Wang, L. P. Stew: Simultaneous task eeg workload data set. IEEE Trans. Neural Syst. Rehabil. Eng.26(11), 2106–2114 (2018). [DOI] [PubMed] [Google Scholar]
- 44.Färe, R., Grosskopf, S. & Tyteca, D. An activity analysis model of the environmental performance of firms†application to fossil-fuel-fired electric utilities. Ecol. Econ.18(2), 161–175 (1996). [Google Scholar]
- 45.Liu, Z., Jin, Y., Zuo, M. J. & Feng, Z. Time-frequency representation based on robust local mean decomposition for multicomponent am-fm signal analysis. Mech. Syst. Signal Process.95, 468–487 (2017). [Google Scholar]
- 46.Richman, J. S. & Moorman, J. R. Physiological time-series analysis using approximate entropy and sample entropy. Am. J. Physiol. Heart Circ. Physiol.278(6), H2039–H2049 (2000). [DOI] [PubMed] [Google Scholar]
- 47.Yedukondalu, J. & Sharma, L. D. Cognitive load detection using ci-ssa for eeg signal decomposition and nature-inspired feature selection. Turk. J. Electr. Eng. Comput. Sci.31(5), 771–791 (2023). [Google Scholar]
- 48.Kabir, M. S. et al. Contrastive machine learning reveals in eeg resting-state network salient features specific to autism spectrum disorder. Chaos Solitons Fract.185, 115123 (2024). [Google Scholar]
- 49.Pollock, V., Schneider, L. & Lyness, S. Eeg amplitudes in healthy, late-middle-aged and elderly adults: normality of the distributions and correlations with age. Electroencephalogr. Clin. Neurophysiol.75(4), 276–288 (1990). [DOI] [PubMed] [Google Scholar]
- 50.Yedukondalu, J. & Sharma, L. D. Circulant singular spectrum analysis and discrete wavelet transform for automated removal of eog artifacts from eeg signals. Sensors23(3), 1235 (2023). [DOI] [PMC free article] [PubMed] [Google Scholar]
- 51.Gupta, V., Chopda, M. D. & Pachori, R. B. Cross-subject emotion recognition using flexible analytic wavelet transform from eeg signals. IEEE Sens. J.19(6), 2266–2274 (2018). [Google Scholar]
- 52.Principe, J. C., Xu, D. & Erdogmuns, D. Renyi’s entropy, divergence and their nonparametric estimators 47–102 (Renyi’s Entropy and Kernel Perspectives, Information Theoretic Learning, 2010). [Google Scholar]
- 53.Tong, J., Liu, S., Ke, Y., Gu, B., He, F., Wan, B. & Ming, D. Eeg-based emotion recognition using nonlinear feature. In 2017 IEEE 8th international conference on awareness science and technology (iCAST), IEEE, pp. 55–59 (2017).
- 54.Khatir, S. et al. An improved artificial neural network using arithmetic optimization algorithm for damage assessment in fgm composite plates. Compos. Struct.273, 114287 (2021). [Google Scholar]
- 55.Mirjalili, S. Dragonfly algorithm: a new meta-heuristic optimization technique for solving single-objective, discrete, and multi-objective problems. Neural Comput. Appl.27, 1053–1073 (2016). [Google Scholar]
- 56.Liu, Y. & Cao, B. A novel ant colony optimization algorithm with levy flight. Ieee Access8, 67205–67213 (2020). [Google Scholar]
- 57.Altman, N. S. An introduction to kernel and nearest-neighbor nonparametric regression. Am. Stat.46(3), 175–185 (1992). [Google Scholar]
- 58.Abu Khurma, R. et al. A review of the modification strategies of the nature inspired algorithms for feature selection problem. Mathematics10(3), 464 (2022). [Google Scholar]
- 59.Emine, B. & Ülker, E. An efficient binary social spider algorithm for feature selection problem. Expert Syst. Appl.146, 113185 (2020). [Google Scholar]
- 60.Jan, Z. M., Verma, B. & Ensemble classifier optimization by reducing input features and base classifiers. In IEEE Congress on Evolutionary Computation (CEC). IEEE2019, 1580–1587 (2019).
- 61.Yedukondalu, J., Sharma, D. & Sharma, L. D. Subject-wise cognitive load detection using time-frequency eeg and bi-lstm. Arab. J. Sci. Eng.49(3), 4445–4457 (2024). [Google Scholar]
- 62.Hasan, M. J. & Kim, J.-M. A hybrid feature pool-based emotional stress state detection algorithm using eeg signals. Brain Sci.9(12), 376 (2019). [DOI] [PMC free article] [PubMed] [Google Scholar]
- 63.Vanitha, V. & Krishnan, P. Real time stress detection system based on eeg signals. Biomed. Res. India27, S271–S275 (2016). [Google Scholar]
- 64.Gupta, R., Alam, M. A. & Agarwal, P. Modified support vector machine for detecting stress level using eeg signals. Comput. Intell. Neurosci.2020(1), 8860841 (2020). [DOI] [PMC free article] [PubMed] [Google Scholar]
- 65.Sharma, L. D. et al. Evolutionary inspired approach for mental stress detection using eeg signal. Expert Syst. Appl.197, 116634 (2022). [Google Scholar]
- 66.Yedukondalu, J. & Sharma, L. D. Cognitive load detection using circulant singular spectrum analysis and binary harris hawks optimization based feature selection. Biomed. Signal Process. Control79, 104006 (2023). [Google Scholar]
- 67.Yedukondalu, J. & Sharma, L.D. Cognitive load detection using binary salp swarm algorithm for feature selection. In 2022 IEEE 6th Conference on Information and Communication Technology (CICT), IEEE, pp. 1–5 (2022).
- 68.Sharma, L. D., Saraswat, R. K. & Sunkaria, R. K. Cognitive performance detection using entropy-based features and lead-specific approach. SIViP15(8), 1821–1828 (2021). [Google Scholar]
- 69.Al-Shargie, F., Tang, T.B., Badruddin, N. & Kiguchi, M. Mental stress quantification using eeg signals. In International conference for Innovation in Biomedical Engineering and Life Sciences: ICIBEL2015, 6-8 December 2015, Putrajaya, Malaysia 1, Springer, pp. 15–19 (2016).
- 70.Cheema, A. & Singh, M. Psychological stress detection using phonocardiography signal: An empirical mode decomposition approach. Biomed. Signal Process. Control49, 493–505 (2019). [Google Scholar]
- 71.Baygin, N. et al. Automated mental arithmetic performance detection using quantum pattern-and triangle pooling techniques with eeg signals. Expert Syst. Appl.227, 120306 (2023). [Google Scholar]
- 72.Jain, P., Yedukondalu, J., Chhabra, H., Chauhan, U. & Sharma, L. D. Eeg-based detection of cognitive load using vmd and lightgbm classifier. Int. J. Mach. Learn. Cybern. 1–18 (2024).
Associated Data
This section collects any data citations, data availability statements, or supplementary materials included in this article.
Data Availability Statement
In this work, two publicly available MAT https://archive.physionet.org/cgi-bin/atm/ATM and STEW https://ieee-dataport.org/open-access/stew-simultaneous-task-eeg-workload-dataset datasets were used.