

Abstract
Purpose:
Manual delineation on all breathing phases of lung cancer 4D CT image datasets can be challenging, exhaustive, and prone to subjective errors because of both the large number of images in the datasets and variations in the spatial location of tumors secondary to respiratory motion. The purpose of this work is to present a new deep learning-based framework for fast and accurate segmentation of lung tumors on 4D CT image sets.
Methods:
The proposed DL framework leverages motion region convolutional neural network (R-CNN). Through integration of global and local motion estimation network architectures, the network can learn both major and minor changes caused by tumor motion. Our network design first extracts tumor motion information by feeding 4D CT images with consecutive phases into an integrated backbone network architecture, locating volume-of-interest (VOIs) via a regional proposal network and removing irrelevant information via a regional convolutional neural network. Extracted motion information is then advanced into the subsequent global and local motion head network architecture to predict corresponding deformation vector fields (DVFs) and further adjust tumor VOIs. Binary masks of tumors are then segmented within adjusted VOIs via a mask head. A self-attention strategy is incorporated in the mask head network to remove any noisy features that might impact segmentation performance. We performed two sets of experiments. In the first experiment, a five-fold cross-validation on 20 4D CT datasets, each consisting of 10 breathing phases (i.e., 200 3D image volumes in total). The network performance was also evaluated on an additional unseen 200 3D images volumes from 20 hold-out 4D CT datasets. In the second experiment, we trained another model with 40 patients’4D CT datasets from experiment 1 and evaluated on additional unseen nine patients’4D CT datasets. The Dice similarity coefficient (DSC), center of mass distance (CMD), 95th percentile Hausdorff distance (HD95), mean surface distance (MSD), and volume difference (VD) between the manual and segmented tumor contour were computed to evaluate tumor detection and segmentation accuracy. The performance of our method was quantitatively evaluated against four different methods (VoxelMorph, U-Net, network without global and local networks, and network without attention gate strategy) across all evaluation metrics through a paired t-test.
Results:
The proposed fully automated DL method yielded good overall agreement with the ground truth for contoured tumor volume and segmentation accuracy. Our model yielded significantly better values of evaluation metrics (p < 0.05) than all four competing methods in both experiments. On hold-out datasets of experiment 1 and 2, our method yielded DSC of 0.86 and 0.90 compared to 0.82 and 0.87, 0.75 and 0.83, 081 and 0.89, and 0.81 and 0.89 yielded by VoxelMorph, U-Net, network without global and local networks, and networks without attention gate strategy. Tumor VD between ground truth and our method was the smallest with the value of 0.50 compared to 0.99, 1.01, 0.92, and 0.93 for between ground truth and VoxelMorph, U-Net, network without global and local networks, and networks without attention gate strategy, respectively.
Conclusions:
Our proposed DL framework of tumor segmentation on lung cancer 4D CT datasets demonstrates a significant promise for fully automated delineation. The promising results of this work provide impetus for its integration into the 4D CT treatment planning workflow to improve the accuracy and efficiency of lung radiotherapy.
Keywords: 4D CT, deep learning, lung tumor segmentation, motion R-CNN
1 |. INTRODUCTION
Radiation therapy is a critical component of cancer treatment, with technical and computational advancements such as the robust delineation of targets and precise dose delivery contributing to highly accurate and effective treatments. Both target delineation and dose delivery can be challenging, however, in dynamic treatment sites that involve continuous motion of both target and surrounding normal organs. For lung cancer radiotherapy, it can be difficult to precisely target radiation to lung tumors due to respiratory motion, with motion varying from 0.5 up to 2.5 cm.1,2 In addition, suboptimal delineation of a target may also lead to under- or overradiation delivery. Precise delineation of lung tumors in the presence of respiratory motion is therefore vital, especially for stereotactic body radiation therapy (SBRT) of localized lung cancers, in which large doses of radiation are delivered in a few treatment fractions.3 Free-breathing CT scans are not able to accurately synchronize the anatomic changes and deformation triggered by respiratory motion, resulting in motion artifacts that can increase delineation errors and compromise the accuracy of radiation treatments.
Over the years, different time-resolved imaging techniques have been developed for motion management. The introduction of 4D CT scans has increased the precision of lung radiotherapy treatment planning and delivery in comparison to free-breathing CT technique. Currently, 4D CT is routinely used for treatment planning of lung radiotherapy. Briefly, 4D CT involves acquiring multiple (typically 8–10) CT images over an entire breathing cycle, capturing the location and movement of the tumor and adjacent normal organs over time. In terms of tumor delineation, internal target volume (ITV) is usually employed for the motion-associated tumor sites to account for internal motion. A planning target volume (PTV) is then generated by adding a margin to the ITV in order to account for setup displacement, and subclinical tumor boundaries.4,5 Currently, a maximum intensity projection (MIP) is often used as a postprocessing step to reflect the range of tumor motion based on the density value encountered in each pixel during the respiratory cycle.6 However, it has been reported that MIP largely underestimates the range of tumor motion for respiratory motions with irregularities in periodicity and amplitudes.7 MIP has not been recommended as a standard procedure for all patients due to its tendency to underestimate the range of tumor motion.8 An alternative approach of using two phase images (i.e., end-of-inhale and end-of-exhale phase) in the 4D CT has also been reported to underestimate the tumor volume definition, resulting in geometrical misses. It is recommended that all phases of breathing cycle be segmented to properly identify the overall tumor volume definition and ensure an appropriate coverage of the target.9 However, in current clinical practice, tumor volume, in general, is not segmented on all breathing phases of 4D CT datasets as it can be a very time-consuming process. Though manual target delineation on all breathing phases may be the most robust method to define tumor volume, it comes at the expense of increased physician workload, requiring physicians to study and contour eight to 10 times more images across the 4D CT dataset. Therefore, an automatic and effective computer-aided tumor segmentation method on 4D CT images can be of great value for facilitating automatic segmentation of tumors on all breathing phases of 4D CT while ensuring segmentation consistency in the treatment planning workflow.
Different iterative algorithms have been proposed in the literature to segment lung tumors on 3D CT images. Cui et al. used prior PET scans in an enhanced random walk algorithm to segment lung tumor from low-contrast 3D CT images.10 Gu et al. used a click and grow algorithm to segment lung tumors on 3D CT.11 Vivanti et al. demonstrated a four-step process involving deformation registration, segmentation of lung tumors, leak detection, and tumor boundary regularization.12 Methods based on active contouring algorithms13 and sparse field active models14 have also been investigated to segment lung tumor on 3D image sets. A major drawback of iterative algorithms is the required computational exhaustiveness to converge to an optimal solution, which becomes far greater when applied to 4D CT image sets. Different image pattern features such as mean-shift methods or level set-based method has also been used to improve throughput using image pattern features.15 Normalized cross-correlation based on intensity variance16 and tumor tracking based on optical flow17 have also been introduced. These techniques require the tumor position in the first frame as an input. Recently, deep learning (DL) methods have been successfully applied for medical image analysis, including registration, segmentation, and dose predictions, where they have been shown to achieve state-of-the-art performances.18–24 Automatic feature extraction of both global and local features hidden within the raw data is one of the most appealing strengths of DL methods; they eliminate the time-consuming feature extraction process required in traditional machine learning (ML) methods. Deformable image registration algorithms such as large deformation diffeomorphic metric mapping (LDDMM) and its DL variants (e.g., Quicksilver25 and VoxelMorph26) have been proposed;however, they25,26 have not been tested on phase images of 4D CT lung datasets. Furthermore, applying a previous DL-based deformable image registration model (e.g., VoxelMorph) on a new patient dataset would still require user to identify tumor in one of the phases so that all other phases can be registered to this phase. Hence, adopting these methods on a new 4D dataset would still require some degree of user interaction. While a large number of investigations have been conducted on DL-based segmentation methods, only a handful of studies have proposed DL pipeline for 4D datasets and demonstrated its feasibility for automatic segmentations on 4D CT datasets.27
Deformable image registration algorithms such as LDDMM and its DL variants (e.g., Quicksilver25 and VoxelMorph26) have been proposed; however, they25,26 have not been tested on phase images of 4D CT lung datasets. Furthermore, applying a previous DL-based deformable image registration model (e.g., VoxelMorph) on a new patient dataset would still require user to identify tumor in one of the phases so that all other phases can be registered to this phase. Hence, adopting these methods on a new 4D dataset would still require some degree of user interaction. Though a large number of investigations have been conducted on DL-based segmentation methods, only a handful of studies have proposed DL pipeline on 4D datasets and demonstrated its feasibility to automatically locate and segment tumors directly on 4D CT datasets.27
In this work, we further this concept by presenting a new deep learning-based pipeline, called motion region convolutional neural network (motion R-CNN), to automatically locate and segment tumor on 4D CT datasets without the need to provide tumor annotation from the first phase. Region-based CNNs are popular deep networks for object detection. While we previously performed a DL-based proof of concept cross-validation study on 4D CT data from 10 lung cancer patients,28 this work furthers the idea of R-CNN for detecting tumor location and presents a DL framework that brings forth several distinctive features: (a) The performance of traditional mask R-CNN is enhanced by adding global and local motion head networks, which removes the unreasonable volume-of-interest (VOI)’s predicted locations to improve the network efficiency. (b) The attention gate strategy is integrated into the mask head network to automatically highlight the informative features that can well represent the tumor region and diminish the noise features (i.e., feature extracted from blur region of vessel) influencing the performance of segmentation. (c) The consistent phases are fed into the backbone network to well represent the location information between both non-adjacent as well as adjacent phases by the residual network. (d) In comparison to registration methods, our approach does not rely on the user to locate and identify tumor in one of the phases in order to bring the remaining phases to this one phase. Instead, our approach leverages deformation vector field (DVF) to further adjust the position of the detected VOIs. To demonstrate the effectiveness of our DL pipeline, we compared the performance of our method against the performance of four different methods: a state-of-the-art segmentation method U-Net, our network without global and local network architectures, our network without attention gated strategy, and VoxelMorph.26 We compared these methods across five different evaluation metrics through quantitative and statistical analysis on both cross-validation and unseen hold-out datasets.
2 |. MATERIALS AND METHODS
2.1 |. Data acquisition
In this study, 4D CT image sets of 50 previous patients with lung cancer were acquired during treatment planning on a Siemens SOMATOM Definition AS CT scanner with a resolution of 0.977 × 0.977 × 2.5 mm3. 4D CT images were acquired under free-breathing conditions. Each 4D CT image consisted of 10 3D CT sets corresponding to 10 respiratory phases. In each phase, the lung tumor contours were manually delineated by radiation oncologists as our ground truths. For each 3D CT, the axial slice is with size of 512 × 512 pixels and the number of slices range from 141 to 190 for different patients. To make them uniform for the network input, the 3D CTs were central cropped its background and zero-padding to same size of 384 × 384 × 192 pixels.
2.2 |. Network architecture
The main network architecture, named motion R-CNN, is comprised of four stages: general feature extraction, global feature map extraction and location, local feature map extraction and location, and final segmentation of VOI. Similar framework is followed during both training and inference of a new case. A series of 4D CT and corresponding manual contours with VOIs are used as a training dataset.
2.2.1 |. General feature extraction
General feature extraction is the first step of the network architecture in which a series of 4D datasets is used as input to the backbone subnetwork architecture. The purpose of backbone network architecture is to extract initial general features from the 4D datasets. The network design of backbone architecture is illustrated in Figure 1. We implemented backbone network architecture via 3D residual network due to its strength in image recognition owing to its deep network design that learns the residual representation of the image.29 In this way, the features within different phases of 4D CT (e.g., tissue contrast difference between different phases in the 4D CT) can potentially be learned through deep network design of 3D residual network.
FIGURE 1.
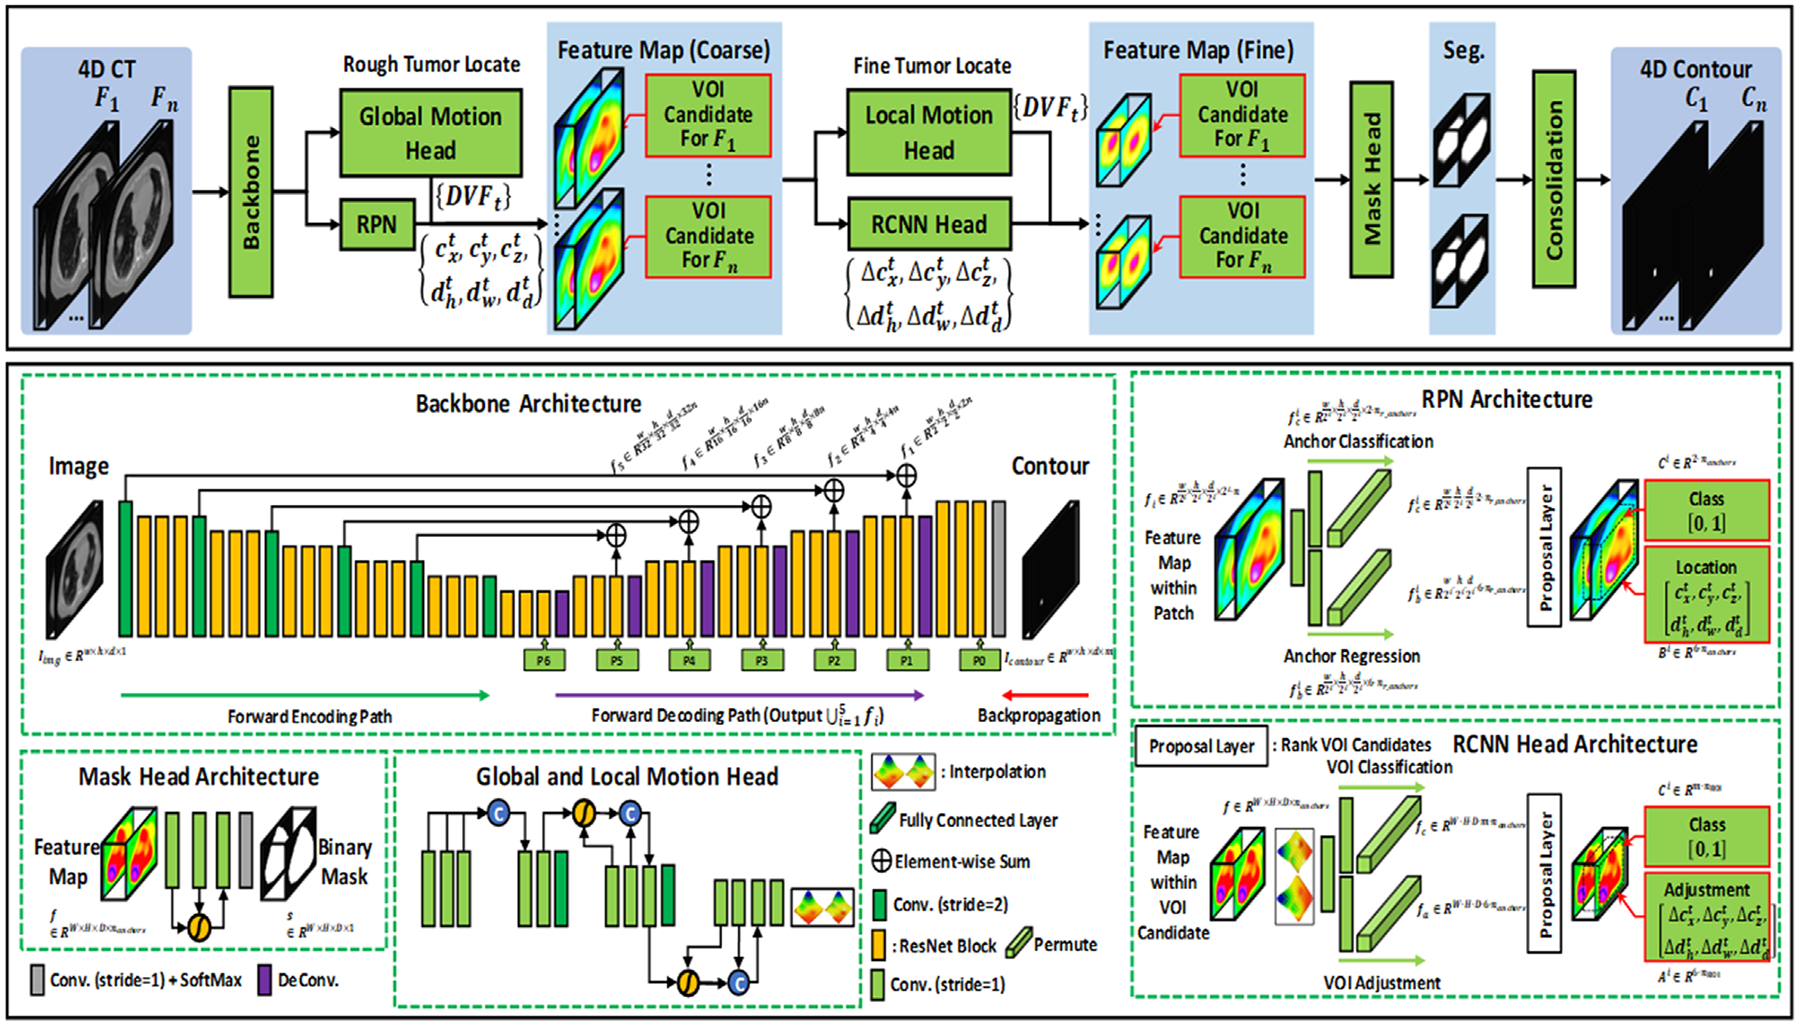
Schematic flowchart of the proposed motion R-CNN for 4D CT lung tumor localization and segmentation. The first row shows the training and inference procedure. The second row shows the subnetworks’ structures used in motion R-CNN, where fi denotes the feature map extracted from backbone architecture; w, h, d denote the width, height, depth of an input patch, respectively; m denotes the number of labels (1 + number of tumor contours); n denotes the number of feature maps; denotes the features extracted via RPN for foreground/background classification; denotes features extracted via RPN for VOI candidate localization. : VOI candidate’s center position in x-, y-, and z-axis, respectively, at phase t. : Width, height, and depth, respectively, of VOI candidate’s center position. nr_anchors denotes the number of anchor (VOI candidate) ratios; nanchors denotes the number of anchors (VOI candidates). Ci denotes the probability of VOI candidate i. Bi denotes the location of VOI candidate i. Ai denotes the adjustment of VOI candidate i. denote the VOI candidate’s center position’s adjustment in x-, y-, and z-axis, respectively. denote the width, height, and depth adjustment, respectively, of VOI candidate’s center position
Backbone network architecture follows forward encoding and forward decoding paths with back propagation. The forward encoding path consisted of five levels each with a convolution layer, followed by three residual blocks, processing an input image into lower dimensional data. Each of the three residual blocks contains two convolutional layers and an element-wise sum operator. The kernel size of the convolutional layer was 3 × 3 × 3 pixels. The number of channels of the convolution layer was 16, 32, 64, 128, and 256 for five respective stages. The decoder network follows similar design as the forward encoding path, but with a deconvolutional layer. As shown in Figure 1, several long skip connections are used between encoding and decoding paths to concatenate feature maps extracted from the previous encoding convolution layer and current decoding deconvolution layer in each stage. Skip connections easily pass high-dimensional information between the input and output, which in turn encourages the following subnetworks to collect multiscale features. It also mitigates the problem of gradient loss and promote the recovery of a clean image through the image details passed from convolutional to deconvolutional layers.30 General feature map of 4D CT is generated through backbone network architecture.
2.2.2 |. Global feature map extraction and location
This is the second stage in our proposed motion R-CNN architecture and involves two subnetworks: global motion head and regional proposal network (RPN).
Global motion head architecture
Main goal of global motion head architecture is to predict large lung motion. The network design of global motion head architecture is illustrated in Figure 1. The output of backbone network architecture, general feature maps, is used as an input to global motion head architecture. As shown in Figure 1, there are total of 12 convolutional layers in the encoding path. The feature maps go through three compression operators to reduce the dimensionality of the original size by a factor of eight. Each compression operator consisted of several convolutional layers with identical padding and batch normalization and subsequent max pooling layer. Subsequently, feature maps pass through convolutional layer for DVF prediction. In this way, the global motion head network learns rough estimation of DVF from general feature maps extracted via backbone network architecture. In Figure 1, DVFt denotes rough position of the VOI of t-th phase and is also the output of global motion head architecture.
RPN architecture
General feature maps extracted from backbone architecture are used as inputs to RPN.The RPN architecture is a fully convolutional neural network that simultaneously predicts object boundaries and objectness scores at each position.31 Briefly, it consists of two parts:anchor regression and anchor classification as shown within the RPN architecture (Figure 1). Based on the general feature maps extracted via backbone, RPN regresses the extracted features to the 4D CT’s tumor’s rough locations and predicts the bounds of those potential tumor regions, that is, potential VOIs. At this point, RPN utilizes the DVFt predicted by global motion head architecture to identify unreasonable VOIs and removes them from the potential VOIs to generate candidate VOIs (Figure 1).Once the candidate VOIs are proposed, extracted features from the backbone were cropped within candidate VOIs and re-scaled via VOIs alignment to share same size, which is uniform for feeding into the following third stage in workflow. Classification loss, that is, binary cross-entropy (BCE) measured between predicted class (foreground or background) and its ground truth class, and candidate VOI’s index regression loss (localization loss) is used for supervision. The second stage of our proposed method, therefore, results in coarse feature maps with candidate VOI for each phase F1 as shown in Figure 1.
2.2.3 |. Local feature map extraction and location
This is the third stage in our proposed motion R-CNN architecture and involves two subnetworks: local motion head and RCNN.
Local motion head architecture
Main goal of local motion head architecture is to predict local lung motion on a fine scale from coarse feature maps as input. The network design of local motion head architecture is illustrated in Figure 1 and is identical to that of global local head architecture.Prior to local motion head training, the images were center-cropped to a lower dimension. Furthermore, the final convolution layer in the network was used to generate local DVFt from extracted and cropped feature maps.
R-CNN head architecture
Coarse feature maps from global motion head are used as inputs to R-CNN. The R-CNN shares similar network architecture with RPN but with different learnable parameters. Briefly, R-CNN first identifies several candidate VOIs from coarse feature maps and label their categories and bounding box as shown in Figure 1. The R-CNN consists of two parts: VOI classification and VOI adjustment.As shown in Figure 1, they use a CNN to perform forward computation to extract features from candidate VOIs and adjust potential VOIs’ location. The location of VOIs obtained from R-CNN is further adjusted by leveraging DVFt from local motion head. The feature maps cropped via RPN are then further refined by cropping them within adjusted VOIs (derived from RCNN) and VOI alignment to make them uniform for feeding into the last stage in workflow, which includes a mask head subnetwork.
2.2.4 |. Mask head subnetwork
Finally, fine feature maps are fed into mask head network, which consisted of three convolution layers as shown within mask head architecture in Figure 1. Main goal of mask head is to segment the binary mask of contours within candidate VOIs. However, our network involves several subnetworks (i.e., RPN, R-CNN, global and local head network) prior to reaching the mask head network. These subnetworks may introduce additional unwanted noise, in addition to that arising from motion artifacts, both of which can impact the segmentation performance. To tackle such instances, we integrated a self-attention strategy into the mask head network to diminish such noisy features that could possibly affect the segmentation performance. The segmentation loss, which is a combination of Dice loss and BCE loss, is used to supervise the mask head architecture.
2.2.5 |. Loss functions and supervision
To supervise the backbone, BCE loss, which is calculated between the segmented contour and manual contour of tumor, is used. In this work, in order to let the backbone to extract semantic features of tumor during training, we let the backbone not only output its hidden layer’s feature maps, but also output binary mask of tumor at its last layer. We do not use the binary mask as segmented tumor during testing. We only use this binary mask to optimize the backbone. The loss term is represented as follows:
Let {Ii} denote the input 4D CT sequence, in our work, i ∈ {1, 2, … , 10}. Let {Gi} denote the manual tumor contour of this 4D CT, and {Si} denote the segmented tumor contour derived at last layer of backbone (note that we do not use this contour as final segmented contour, this contour is only used to supervise the backbone). Then, the backbone is supervised by minimizing the following BCE32 loss term:
| (1) |
RPN is used to detect tumor rough positions by the fed feature maps {fi}i = 1,2,…,k extracted from backbone, where k denotes the k-th pyramid hidden layer. To ease following segmentation, RPN finds out rough ROIs as foreground and gets rid of rest region as background. Thus, binary class, center and bound of each rough VOI should be estimated by RPN. Denoting the RPN can estimate nanchors ROI candidates. Then, for each rough ROI, the binary class is represented by Ci ∈ R2·nanchors. Its center (xc, yc, zc) and bound (Δw, Δh, Δd) are represented by Bi ∈ R6·nanchors . Thus, the output of RPN is
| (2) |
To supervise RPN, the classification loss of Ci and regression loss of Bi is used.33 The output of RCNN and supervision of RCNN are similar to that of RPN. Global motion head takes feature maps {fi}i = 1,2,…,k as input and output DVFs {DVF1→i}, where i ∈ {2, … , 10}. {DVF1→i} represents the DVFs that match first phase to rest phases. To supervise the global motion head, we use image similarity loss (normalized cross-correlation [NCC])34 and a DVF regularization term35 (bending energy). The regularization term is used to force the smoothness of realism of the derived DVFs.
| (3) |
where Lbend denotes the bending energy, and i ∈ {2, … , 10}.
The output of local motion head and supervision of local motion head is similar to that of global motion head. The supervision of mask head is similar to that of backbone network architecture.
2.2.6 |. Data preparation and testing
For a sequence of 4D lung CT, central cropping is used to cut the background of 4D CT, namely, we used a threshold (10 HU) to let the cropped image that can only cover the body mask and remove the background. The central cropping is performed on the average of all phases of a 4D CT, so that the cropping would not cut the body region off. Then, zero padding is used to let each cropped 4D CT to have uniform size. In addition, in order to enlarge the training data’s variation, augmentation, such as rotation, flipping, scaling, and elastic deformation are used for training data.Adam gradient optimizer is used to optimize the learnable parameters of the network.The number of training was set to 200 epochs. The learning rate was set to 2 × 10⁻⁴. For each iteration of one epoch, a batch of eight patches was used as training data. The proposed method was implemented on a NVIDIA Tesla V100 GPU with 32 GB of memory.
After training, the segmentation of a new 4D CT was obtained by first feeding the 4D CT phases into the trained motion R-CNN to retrieve candidate VOIs and predicted probability maps of tumor within VOIs. Then, these VOIs and probability maps were retransformed and resampled to the original resolution image. By consolidating VOIs and the contour probability maps, the final segmentation of each patient is obtained.
2.3 |. Experiments
We have performed two sets of experiments, each with five different methods, in this work.
In the first set of experiments, 20 patients’ 4D CT datasets were used in a five-fold cross-validation. The 20 4D CT image sets consisted of 10 breathing phases, each was first randomly and equally grouped into five subgroups with one group selected as test data and the remaining four groups used as training data. The experiment was repeated five times to let each subgroup be used as test data exactly once. After evaluating five-fold cross-validation, we evaluated the trained model on additional 20 patients’ 4D CT datasets that were not used during the five-fold cross-validation. The number of training samples in first experiment is 46 080.
In the second set of experiments, we trained another model by using all 40 patients’ 4D CT datasets from the first experiment. We then evaluated this trained model on additional nine patients’ 4D CT datasets that were not used during the training.Hence, a total of 49 patients’ 4D CT datasets were used in this work. The distribution of these 49 cases is shown in Table S1. The number of training samples in second experiment is 115 200.
These two experiments were repeated for five different methods including our proposed method. We compared the segmentation performance yielded by our method against the ones achieved by four different network architectures (traditional U-Net, proposed method without global and local networks, proposed method without implementation of attention gate strategy, and VoxelMorph) quantitatively and statistically through five different evaluation metrics.
2.4 |. Evaluation metrics
For tumor motion tracking evaluation, the center-of-mass distance (COMD) calculated between manual tumor contour and segmented contour was used as tracking error. We also calculated the Dice similarity coefficient (DSC), 95th percentile Hausdorff distance (HD95), mean surface distance (MSD), and volume difference (VD) between the manual tumor contour and segmented contour for tumor segmentation accuracy.
DSC can be expressed as
| (4) |
where, |X| and |Y| are the cardinalities of the ground truth mask X and predicted mask Y, respectively.
Hausdorff distance and MSD are the two quantities that measure the surface organ distance between the ground truth and the predicted contours.
| (5) |
where, is 95% percentile Hausdorff distance, which measures the 95th percentile distance of all distances between points in X and the nearest point in Y, defined as and d(x, y) is Euclidean distance.
MSD is defined as
| (6) |
where
3 |. RESULTS
In this section, we first present qualitative results, including visual comparison of our approach against the manually contoured tumors for each respiratory cycle. This is followed by quantitative results for evaluating tumor tracking accuracy in both validation and testing datasets.
3.1 |. Visual analysis
Figure 2 shows visual comparison of five methods for the best, an average, and a worst case. All five methods are compared to the ground truth segmentation. For the best case, the segmentations by all five methods were in a good agreement with the ground truth. For the worst case, all five methods struggled to generate an accurate segmentation. Nonetheless, our proposed method had the closer agreement to the ground truth than four competing methods for the worst case, especially segmenting tumor at two different locations that was lacking in those generated by other four competing methods.
FIGURE 2.

Visual comparison of ground truth segmentation to those generated by VoxelMorph, U-Net, network without global and local networks, network without attention gate strategy, and proposed method on two breathing phases for the best (top), an average (middle), and the worst case (bottom)
The visual comparison of five different methods for segmenting tumors located at three different locations is shown in Figure S1. For all three types of tumors, our method has a good spatial agreement to the ground truth segmentation, especially for tumor in the posterior wall within proximity to spinal cord.
Figure S2 shows visual comparison of five methods for a large tumor case (13.04 cm3) attached to the chest wall. For a large tumor case, all five methods achieved a good segmentation accuracy, which was spatially consistent and accurate to the ground truth segmentation.
3.2 |. Quantitative analysis
Here, we present visual demonstrations of quantitative analysis for each patient in cross-validation dataset in Figure 3 and hold-out dataset in Figure S3. The performance of our proposed approach against four different methods is compared across five evaluation metrics with corresponding average and standard deviation over breathing phases of each patient (Figure 3). In terms of metric performance, the closer the DSC value to 1, the better the performance, with DSC = 1 representing the perfect segmentation. The lower the HD95 and MSD, the better the segmentation accuracy. On individual patient basis (Figure 3), our proposed method (Figure 3 blue) yielded the best segmentation performance across all four evaluation metrics amongst the five methods studied in this work. Figure 3 shows the importance of adding global and local network, and attention gate strategy in our DL pipeline, as removing these two components degraded the segmentation performance (Figure 3 magenta and green). Our method also performs better than VoxelMorph approach, especially for tumors >10 cm3 for both validation and hold-out datasets. In terms of tumor volumes, all five methods typically yielded DSC >0.85 for tumors >10 cm3 in this cohort, whereas their performances were slightly compromised (ranging from DSC = 0.6 to 0.8) for smaller tumors <1 cm3 in the cohort (Figure 3). For tumor volumes 0.41, 0.44, and 0.81, our method was able to achieve DSC of 0.74, 0.86, and 0.86, respectively (Figure 3). For tumors between 1 and 5 cm3, our proposed method achieved better segmentation performance than all four competing methods (Figure 3).
FIGURE 3.

Average ± standard deviation values of CMD, DSC, HD95, and MSD achieved from the proposed (blue), state-of-the-art U-Net architecture (red), proposed without global and local networks (magenta), proposed without attention gate strategy (green), and VoxelMorph (cyan) from breathing phases of each patient in cross-validation 4D CT datasets. The horizontal axis represents ground truth tumor volumes of each of the 20 patients separated by the vertical dotted line
Table 1 shows qualitative results of five evaluation metrics averaged over all breathing phases of all 20 patients in cross-validation datasets. Here, we statistically compared the performance of our proposed approach against four different methods, respectively, across five evaluation metrics. Statistical analysis shows that our method achieved significantly (p < 0.05) better segmentation results than four competing methods across all evaluation metrics except volume difference between our method and U-Net method (p ≥ 0.05).
TABLE 1.
Average and standard deviation over validation and hold-out datasets for all metrics for the five methods,a and corresponding p-values from paired t-test statistical analysis
| Dataset | Method | CMD (mm) | DSC | HD95 (mm) | MSD (mm) | VD (cm3) |
|---|---|---|---|---|---|---|
| Validation dataset | A | 1.47 ± 0.94 | 0.79 ± 0.11 | 3.23 ± 1.23 | 1.08 ± 0.41 | 0.86 ± 0.91 |
| B | 1.36 ± 0.66 | 0.78 ± 0.11 | 3.19 ± 1.11 | 1.05 ± 0.34 | 0.57 ± 0.25 | |
| C | 1.37 ± 0.84 | 0.83 ± 0.10 | 3.03 ± 1.30 | 0.87 ± 0.40 | 0.71 ± 0.80 | |
| D | 1.15 ± 0.72 | 0.86 ± 0.10 | 2.74 ± 1.16 | 0.72 ± 0.39 | 0.67 ± 0.77 | |
| E | 0.91 ± 0.56 | 0.87 ± 0.08 | 2.19 ± 0.78 | 0.59 ± 0.27 | 0.36 ± 0.15 | |
| p-Value (E vs. A) | <0.05 | <0.05 | <0.05 | <0.05 | <0.05 | |
| p-Value (E vs. B) | <0.05 | <0.05 | <0.05 | <0.05 | 0.065 | |
| p-Value (E vs. C) | <0.05 | <0.05 | <0.05 | <0.05 | <0.05 | |
| p-Value (E vs. D) | <0.05 | <0.05 | <0.05 | <0.05 | <0.05 | |
| Hold-out Dataset | A | 1.51 ± 1.26 | 0.82 ± 0.17 | 4.16 ± 7.19 | 2.07 ± 7.17 | 0.85 ± 0.82 |
| B | 1.58 ± 1.13 | 0.75 ± 0.16 | 3.67 ± 1.41 | 1.34 ± 0.69 | 1.33 ± 1.27 | |
| C | 1.43 ± 1.11 | 0.81 ± 0.20 | 3.78 ± 5.71 | 1.65 ± 5.61 | 0.80 ± 0.74 | |
| D | 1.35 ± 0.92 | 0.81 ± 0.19 | 3.50 ± 4.68 | 1.42 ± 4.58 | 0.77 ± 0.67 | |
| E | 1.02 ± 0.69 | 0.86 ± 0.10 | 2.73 ± 1.24 | 0.77 ± 0.52 | 0.50 ± 0.42 | |
| p-Value (E vs. A) | <0.05 | <0.05 | <0.05 | <0.05 | <0.05 | |
| p-Value (E vs. B) | <0.05 | <0.05 | <0.05 | <0.05 | <0.05 | |
| p-Value (E vs. C) | <0.05 | <0.05 | <0.05 | <0.05 | <0.05 | |
| p-Value (E vs. D) | <0.05 | <0.05 | <0.05 | <0.05 | <0.05 |
Abbreviations: CMD, center of mass distance; DSC, Dice similarity coefficient; HD95, 95th percentile Hausdorff distance; MSD, mean surface distance.
A: VoxelMorph method; B: U-Net; C: without global and local networks; D: without attention gate strategy; and E: proposed method.
Figure S2 shows the performance of these five methods for each patient in hold-out datasets. Overall results show that our proposed method resulted in the best segmentation performance amongst the five methods studied in this work (Figure S2). In Figure S2, we also observe that removing global and local network (magenta), and attention gate strategy (green) from our proposed (blue) DL pipeline compromises its performance. In terms of tumor volumes, all five methods yielded DSC >0.8 for cases with tumor volumes >10 cm3, with our method achieving the leading values of evaluation metrics. For tumor volumes <1 cm3 (Figure S2), our method achieved better segmentation results than competing methods (e.g., for tumor volumes = 0.19 ± 0.01 cm3 [Figure S2],the values of DSCs were 0.46, 0.31, 0.26, 0.54, and 0.69 for U-net, without global and local network, without attention gate strategy, VoxelMorph, and proposed method, respectively).
Table 1 shows the statistical results comparing our method to four different methods on hold-out dataset. Statistical results show that proposed method yielded significantly (p < 0.05) better results than four competing methods across all five measurement metrics. Our method improved CMDs by 46%, 28%, 28%, and 35%, and DSCs by 21%, 4%, 5%, and 2%, and HD95 by 48%, 30%,47%,and 37% compared to U-Net, network without global and local architectures, network without attention gate strategy, and VoxelMorph, respectively. The trends of statistical results and qualitative results on unseen hold-out datasets are comparable to cross-validation results, which is indicative of absence of overfitting.
In the second set of experiment, we used 40 patients’ 4D CT datasets during training and evaluated trained models on additional nine hold-out patients’ 4D CT datasets that were not used during the training. Figure S4 shows the average and standard deviation of CMD, DSC, HD95, and MSD over breathing phases of each patient in hold-out datasets.The statistical comparison of our methods against four competing methods is shown in Table S2. Our method significantly (p < 0.05) improved segmentation performance compared to other four methods for CMD, MSD, and VD. For DSC and HD95, our method achieved comparable (p ≥ 0.05) values to the ones achieved by network without attention gate strategy and VoxelMorph (Table S2).
4 |. DISCUSSION
In contrast to segmentation of a static tumor, lung tumors introduce variations in shape and spatial location due to respiratory motion. Several registration algorithms (i.e., VoxelMorph) have been proposed to account for this variation in tumor shapes and spatial locations between different breathing phases of a respiratory cycle. However, it would still require user to manually locate and identify tumor on one of the phases so that tumors in remaining phases can be registered to this one. Furthermore, they may not be perfect to be considered as an ultimate solution, similar to the manually contoured ground truth due to susceptibility of subjective errors. Given recent technical and algorithmic advancements, new fully automated approaches should be explored to perform fully automatic segmentation of tumors directly on all breathing phases of 4D CT. A previous study has also recommended that tumor should be segmented on all the phases of breathing cycle to ensure optimal PTV coverage.9 However, manual segmentation of a lung tumor on a 4D CT dataset can be a very time-consuming and exhaustive task. Furthermore, with 3V (volume, variety, and velocity) of a large dataset, there is also a possibility for subjective errors in analysis and delineation of structures. To facilitate and ease the task of segmenting tumor on all breathing phases, we have presented a method based on motion R-CNN to automatically detect and segment the lung tumor on all breathing phases in a 4D CT dataset. By integrating attention gate strategy, and global and local motion head networks into the traditional mask R-CNN architecture, our method can utilize the features of the 4D CT dataset to remove unreasonable predicted location of VOIs and improve tumor segmentation efficiency.
To evaluate, we compared the performance of our proposed method against four different methods: VoxelMorph, U-Net,23 the network without global and local networks, and the network without attention gate strategy by qualitatively and quantitatively comparing five different evaluation metrics. Figure 2 (worst case) shows that only our proposed method was able to remove unwanted VOIs between the two tumors segmented as ground truth, whereas remaining four methods (VoxelMorph, U-Net, network without attention gate strategy, and network without global and local motion networks) merged both tumors and generated as a single segmentation. Overall quantitative and statistical analysis suggested a significantly improved (p < 0.05) segmentation performance by our method over four competing methods in both experiments. We presented the results as a function of tumor volumes (Figure 3, and Figures S3 and S4) to study the effectiveness of different methods on different tumor volumes. All five methods performed well for tumors larger than 10 cm3, with our method yielding the best values across all evaluation metrics (Figure 3, and Figures S3 and S4). This is presumably due to presence of more defined lesion boundaries in large-size tumors. While all five methods struggled for tumors <1.00 cm3, our method outperformed competing methods by a higher margin (Figure S3). For tumor volume = 0.18, our method yielded DSC values of 0.69 compared to 0.53, 0.46, 0.34, and 0.26 yielded by VoxelMorph, U-Net, network without global and local networks, and network without attention gate strategy, respectively (Figure S3). Hence, this demonstrates the contribution of Global and Local networks and attention gate strategy to overall success of our proposed DL pipeline.
Beside DL-based methods, different iterative algorithms have been reported in the literature for automatic segmentation of lung tumors.38–42 A previous study achieved the DSC between manual and automatic segmentation on test datasets to be 0.855 ± 0.048, 0.763 ± 0.072, and 0.831 ± 0.068 for graph cut algorithm, level set method, and the graph cut with star shape prior, respectively.39 Speight et al.41 achieved segmentation accuracy with DSC = 0.856 ± 0.045 by using B-spline method. Gaede et al.42 achieved a mean DSC of 0.80 between automatic and manual segmentation processes. Though it is not suitable to directly compare our results with results previously reported in the literature, it is important to note that our model performed well even on unseen 4D CT datasets (DSC = 0.86 ± 0.1), suggesting good generalizability of our model (Table 1). A major drawback of iterative methods is computation time, which may vary between studies due to different algorithms. Such methods often have to be repeated all over for each new case. In the study conducted by Speight et al.,41 the total time required for auto-contouring was still greater than manual contouring, presumably due to long computation time required for several cases. In contrast, our proposed method can segment a 4D CT dataset in less than a minute by using the trained network. Therefore, our proposed automatic lung tumor segmentation method can potentially facilitate this time-consuming manual segmentation work as it was able to achieve comparable accuracy to the manual contours.
Although several ML methods have been proposed for tumor tracking,43,44 they require users to manually extract features to be used in the mathematical models. In a study by Shen et al., physicians had to select object and background seeds in the image of one phase to begin automatic contouring.39 It is also important to note that VoxelMorph required segmentation of tumor in one phase in order to bring tumors in remaining phases to this one. In contrast, our proposed network requires neither the first frame’s tumor annotation nor derived features to learn the differences amongst different labels, allowing the fully automatic segmentation of lung tumor on 4D CT. Deep learning-based methods often lead to misclassification for small tumor volumes.45 Our method was able to appropriately classify small tumor volumes, as shown in Figure S3. Our current work presents an improved network architecture design compared to the one presented in our proof-of-concept cross-validation study.28 For instance, in this work, we integrated a self-attention strategy into the mask head architecture to automatically highlight the informative features that can well represent the tumor region and diminish the noisy features (i.e., feature extracted from blur region of vessel), possibly compromising the segmentation performance. This contributes to an improved segmentation performance in the current work (DSC = 0.87 ± 0.08) compared to the one achieved by the network in a previous study (DSC = 0.76 ± 0.25).28 Furthermore, we have compared our method against four different methods as opposed to comparison against U-Net only in our previous work.28
This study has a few challenges.While the goal of this work was to assess the performance of our approach on 4D CT dataset as acquired in clinic, the performance of our method could be affected if the images themselves contain image artifacts introduced by irregular respiratory motion during CT scan acquisition. Another challenge of this study is the large amount of data involved per patient. Typically, deep learning methods require a large set of data to train the network. However, it is important to note here that each 4D CT consists of eight to 10 respiratory phases, each with different tumor segmentation. Due to the much larger amount of image data involved in 4D CT scans, we useddata of 20 patient cases to train our network architecture in this preliminary study. Each 4D CT consists of breathing phases with approximately 200 3D image volumes in our training cohort in experiment 1 and approximately 400 3D image volumes in our training cohort of experiment 2. To reduce the computational requirements of the overall inference process, we utilized RPN architecture that can quickly and efficiently identify the potential tumor regions from feature maps within the patch. In addition to a large number of images in a dataset, additional subnetworks such as backbone architectures also increase the number of trainable parameters and enlarge the computational complexity. Recently, a retina network is proposed to both perform object segmentation with small number of trainable parameters as compared to Mask R-CNN. Applying such a method to reduce computational complexity will be studied in our future work.While the proposed framework was focused only on 4D CT datasets, its applicability to other 4D datasets such as MRI or ultrasound data will be tested in future investigations.
5 |. CONCLUSIONS
An accurate, fast, and automatic segmentation technique can benefit the 4D CT treatment planning workflow by relieving physicians from the exhaustive workload of performing manual delineation on all breathing phases and minimizing variations in tumor delineation. This work presents a novel DL framework, motion R-CNN, to simultaneously detect tumor location and segment tumor contour on 4D CT lung images without the need of the first frame’s tumor annotation. Overall results of both experiments suggest a significant improvement in segmentation by our method compared to four competing methods. The promising results of this work widen the scope of its potential application for both real-time on-board volumetric imaging to further enhance efficacy of lung radiotherapy.
Supplementary Material
ACKNOWLEDGMENTS
This research is supported in part by the National Cancer Institute of the National Institutes of Health under Award Number R01CA215718, and Dunwoody Golf Club Prostate Cancer Research Award, a philanthropic award provided by the Winship Cancer Institute of Emory University.
Footnotes
CONFLICT OF INTEREST
Kristin Higgins is consulting for Astra Zeneca and Varian, is on the advisory board for Genentech, and receiving research funding from RefleXion Medical.
SUPPORTING INFORMATION
Additional supporting information may be found in the online version of the article at the publisher’s website.
REFERENCES
- 1.Hoisak JD, Sixel KE, Tirona R, Cheung PC, Pignol J-P. Prediction of lung tumour position based on spirometry and on abdominal displacement: accuracy and reproducibility. Radiother Oncol. 2006;78(3):339–346. [DOI] [PubMed] [Google Scholar]
- 2.Ma L, Herrmann C, Schilling K. Modeling and prediction of lung tumor motion for robotic assisted radiotherapy: Proceedings of the 2007 IEEE/RSJ International Conference on Intelligent Robots and Systems, San Diego, CA; 2007. [Google Scholar]
- 3.Onishi H, Shirato H, Nagata Y, et al. Stereotactic body radiotherapy (SBRT) for operable stage I non-small-cell lung cancer: can SBRT be comparable to surgery? Int J Radiat Oncol Biol Phys. 2011;81(5):1352–1358. [DOI] [PubMed] [Google Scholar]
- 4.Britton KR, Starkschall G, Tucker SL, et al. Assessment of gross tumor volume regression and motion changes during radiotherapy for non-small-cell lung cancer as measured by four-dimensional computed tomography. Int J Radiat Oncol Biol Phys. 2007;68(4):1036–1046. [DOI] [PubMed] [Google Scholar]
- 5.Donnelly ED, Parikh PJ, Lu W, et al. Assessment of intrafraction mediastinal and hilar lymph node movement and comparison to lung tumor motion using four-dimensional CT. Int J Radiat Oncol Biol Phys. 2007;69(2):580–588. [DOI] [PMC free article] [PubMed] [Google Scholar]
- 6.Underberg RW, Lagerwaard FJ, Slotman BJ, Cuijpers JP, Senan S. Use of maximum intensity projections (MIP) for target volume generation in 4DCT scans for lung cancer. Int J Radiat Oncol Biol Phys. 2005;63(1):253–260. [DOI] [PubMed] [Google Scholar]
- 7.Park K, Huang L, Gagne H, Papiez L. Do maximum intensity projection images truly capture tumor motion? Int J Radiat Oncol Biol Phys. 2009;73(2):618–625. [DOI] [PubMed] [Google Scholar]
- 8.Borm KJ, Oechsner M, Wiegandt M, Hofmeister A, Combs SE, Duma MN. Moving targets in 4D CTs versus MIP and AIP: comparison of patients data to phantom data. BMC Cancer. 2018;18(1):760. [DOI] [PMC free article] [PubMed] [Google Scholar]
- 9.Rietzel E, Liu AK, Doppke KP, et al. Design of 4D treatment planning target volumes. Int J Radiat Oncol Biol Phys. 2006;66(1):287–295. [DOI] [PubMed] [Google Scholar]
- 10.Cui H, Wang X, Fulham M, Feng DD. Prior knowledge enhanced random walk for lung tumor segmentation from low-contrast CT images. Paper presented at: 2013 35th Annual International Conference of the IEEE Engineering in Medicine and Biology Society (EMBC); 2013. [DOI] [PubMed] [Google Scholar]
- 11.Gu Y, Kumar V, Hall LO, et al. Automated delineation of lung tumors from CT images using a single click ensemble segmentation approach. Pattern Recognit. 2013;46(3):692–702. [DOI] [PMC free article] [PubMed] [Google Scholar]
- 12.Vivanti R, Joskowicz L, Karaaslan OA, Sosna J. Automatic lung tumor segmentation with leaks removal in follow-up CT studies. Int J Comp Ass Radiol Surg. 2015;10(9):1505–1514. [DOI] [PubMed] [Google Scholar]
- 13.Plajer IC, Richter D. A new approach to model based active contours in lung tumor segmentation in 3D CT image data: Proceedings of the 10th IEEE International Conference on Information Technology and Applications in Biomedicine2010; 2010.
- 14.Awad J,Wilson L,Parraga G,Fenster A. Lung tumours segmentation on CT using sparse field active model: Proceedings of SPIE - The International Society for Optical Engineering; 2011.
- 15.Zhang X, Homma N, Ichiji K, et al. A kernel-based method for markerless tumor tracking in kV fluoroscopic images. Phys Med Biol. 2014;59(17):4897. [DOI] [PubMed] [Google Scholar]
- 16.Rottmann J, Aristophanous M, Chen A, Berbeco R. A multi-region algorithm for markerless beam’s-eye view lung tumor tracking. Phys Med Biol. 2010;55(18):5585. [DOI] [PubMed] [Google Scholar]
- 17.Teo PT, Guo K, Ahmed B, et al. Evaluating a potential technique with local optical flow vectors for automatic organ-at-risk (OAR) intrusion detection and avoidance during radiotherapy. Phys Med Biol. 2019;64(14):145008. [DOI] [PubMed] [Google Scholar]
- 18.Fu Y, Lei Y, Wang T, Curran WJ, Liu T, Yang X. Deep learning in medical image registration: a review. Phys Med Biol. 2020;65(20): 20TR01. [DOI] [PMC free article] [PubMed] [Google Scholar]
- 19.Lei Y, Dong X, Tian Z, et al. CT prostate segmentation based on synthetic MRI-aided deep attention fully convolution network. Med Phys. 2020;47(2):530–540. [DOI] [PMC free article] [PubMed] [Google Scholar]
- 20.Wang T,Lei Y,Tang H,et al. A learning-based automatic segmentation and quantification method on left ventricle in gated myocardial perfusion SPECT imaging: a feasibility study. J Nucl Cardiol. 2020;27(3):976–987. [DOI] [PMC free article] [PubMed] [Google Scholar]
- 21.Yamashita R, Nishio M, Do RKG, Togashi K. Convolutional neural networks: an overview and application in radiology. Insights Imaging. 2018;9(4):611–629. [DOI] [PMC free article] [PubMed] [Google Scholar]
- 22.Yang Z-Y, Chang Y, Liu H-Y, Liu G, Li Q. Target margin design for real-time lung tumor tracking stereotactic body radiation therapy using CyberKnife Xsight Lung Tracking System. Sci Rep. 2017;7(1):10826. [DOI] [PMC free article] [PubMed] [Google Scholar]
- 23.Ronneberger O, Fischer P, Brox T. U-net: convolutional networks for biomedical image segmentation: International Conference on Medical Image Computing and Computer-Assisted Intervention; 2015.
- 24.Momin S,Lei Y,Wang T,et al. Learning-based dose prediction for pancreatic stereotactic body radiation therapy using dual pyramid adversarial network. Phys Med Biol. 2021;66(12). 10.1088/1361-6560/ac0856 [DOI] [PMC free article] [PubMed] [Google Scholar]
- 25.Yang X,Kwitt R,Styner M,Niethammer M.Quicksilver: fast predictive image registration–a deep learning approach. Neuroimage. 2017;158:378–396. [DOI] [PMC free article] [PubMed] [Google Scholar]
- 26.Balakrishnan G, Zhao A, Sabuncu M, Guttag J, Dalca AV. VoxelMorph: a learning framework for deformable medical image registration. IEEE Trans Med Imaging. 2019;38:1788–1800. [DOI] [PubMed] [Google Scholar]
- 27.Edmunds D, Sharp G, Winey B. Automatic diaphragm segmentation for real-time lung tumor tracking on cone-beam CT projections:a convolutional neural network approach. Biomed Phys Eng Exp. 2019;5(3):035005. [DOI] [PMC free article] [PubMed] [Google Scholar]
- 28.Lei Y, Tian Z, Wang T, et al. Mask R-CNN-based tumor localization and segmentation in 4D Lung CT. Paper presented at: Medical Imaging 2021: Biomedical Applications in Molecular, Structural, and Functional Imaging 2021; 2021.
- 29.He K, Zhang X, Ren S, Sun J. Deep residual learning for image recognition. Paper presented at: Proceedings of the IEEE conference on computer vision and pattern recognition 2016; 2016. [Google Scholar]
- 30.Mao X,Shen C,Yang Y-B. Image restoration using very deep convolutional encoder-decoder networks with symmetric skip connections:Proceedings of the Advances in neural information processing systems (NIPS’16); 2016.
- 31.Ren S, He K, Girshick R, Sun J. Faster R-CNN: towards real-time object detection with region proposal networks. IEEE Trans Pattern Anal Mach Intell. 2016;39(6):1137–1149. [DOI] [PubMed] [Google Scholar]
- 32.Fu Y, Lei Y, Wang T, Curran WJ, Liu T, Yang X. A review of deep learning based methods for medical image multi-organ segmentation. Phys Med. 2021;85:107–122. [DOI] [PMC free article] [PubMed] [Google Scholar]
- 33.Lei Y, He X, Yao J, et al. Breast tumor segmentation in 3D automatic breast ultrasound using Mask scoring R-CNN. Med Phys. 2021;48(1):204–214. [DOI] [PubMed] [Google Scholar]
- 34.Lei Y, Fu Y, Harms J, et al. 4D CT deformable image registration using an unsupervised deep convolutional neural network. Paper presented at: Workshop on Artificial Intelligence in Radiation Therapy; 2019. [Google Scholar]
- 35.Fu Y, Lei Y, Wang T, et al. LungRegNet: an unsupervised deformable image registration method for 4D CT lung. Med Phys. 2020;47(4):1763–1774. [DOI] [PMC free article] [PubMed] [Google Scholar]
- 36.Jesorsky O, Kirchberg KJ, Frischholz RW. Robust face detection using the Hausdorff distance. Paper presented at: International conference on audio-and video-based biometric person authentication; 2001. [Google Scholar]
- 37.Huttenlocher DP, Klanderman GA, Rucklidge WJ. Comparing images using the Hausdorff distance. IEEE Trans Pattern Anal Mach Intell. 1993;15(9):850–863. [Google Scholar]
- 38.Ezhil M, Choi B, Starkschall G, Bucci MK, Vedam S, Balter P. Comparison of rigid and adaptive methods of propagating gross tumor volume through respiratory phases of four-dimensional computed tomography image data set. Int J Radiat Oncol Biol Phys. 2008;71(1):290–296. [DOI] [PubMed] [Google Scholar]
- 39.Shen Z, Wang H, Xi W, Deng X, Chen J, Zhang Y. Multi-phase simultaneous segmentation of tumor in lung 4D CT data with context information. PLoS One. 2017;12(6):e0178411. [DOI] [PMC free article] [PubMed] [Google Scholar]
- 40.Martin S, Johnson C, Brophy M, et al. Impact of target volume segmentation accuracy and variability on treatment planning for 4D CT-based non-small cell lung cancer radiotherapy. Acta Oncol. 2015;54(3):322–332. [DOI] [PubMed] [Google Scholar]
- 41.Speight R, Sykes J, Lindsay R, Franks K, Thwaites D. The evaluation of a deformable image registration segmentation technique for semi-automating internal target volume (ITV) production from 4DCT images of lung stereotactic body radiotherapy (SBRT) patients. Radiother Oncol. 2011;98(2):277–283. [DOI] [PubMed] [Google Scholar]
- 42.Gaede S, Olsthoorn J, Louie AV, et al. An evaluation of an automated 4D CT contour propagation tool to define an internal gross tumour volume for lung cancer radiotherapy. Radiother Oncol. 2011;101(2):322–328. [DOI] [PubMed] [Google Scholar]
- 43.Sakata Y, Hirai R, Kobuna K, Tanizawa A, Mori S. A machine learning-based real-time tumor tracking system for fluoroscopic gating of lung radiotherapy. Phys Med Biol. 2020;65(8):085014. [DOI] [PubMed] [Google Scholar]
- 44.Hirai R, Sakata Y, Tanizawa A, Mori S. Real-time tumor tracking using fluoroscopic imaging with deep neural network analysis. Phys Med. 2019;59:22–29. [DOI] [PubMed] [Google Scholar]
- 45.Pang S, Du A, He X, Díez J, Orgun MA. Fast and accurate lung tumor spotting and segmentation for boundary delineation on CT slices in a coarse-to-fine framework. Paper presented at: International Conference on Neural Information Processing; 2019. [Google Scholar]
Associated Data
This section collects any data citations, data availability statements, or supplementary materials included in this article.