

Abstract
Background:
Clinical evidence has demonstrated that proton therapy can achieve comparable tumor control probabilities compared to conventional photon therapy but with the added benefit of sparing healthy tissues. However, proton therapy is sensitive to inter-fractional anatomy changes. Online prefraction evaluation can effectively verify proton dose before delivery to patients, but there is a lack of guidelines for implementing this workflow.
Purpose:
The purpose of this study is to develop a cone-beam CT-based (CBCT) online evaluation framework for proton therapy that enables knowledge transparency and evaluates the efficiency and accuracy of each essential component.
Methods:
Twenty-three patients with various lesion sites were included to conduct a retrospective study of implementing the proposed CBCT evaluation framework for the clinic. The framework was implemented on the RayStation 11B Research platform. Two synthetic CT (sCT) methods, corrected CBCT (cCBCT), and virtual CT (vCT), were used, and the ground truth images were acquired from the same-day deformed quality assurance CT (dQACT) for the comparisons. The evaluation metrics for the framework include time efficiency, dose-difference distributions (gamma passing rates), and water equivalent thickness (WET) distributions.
Results:
The mean online CBCT evaluation times were 1.6 ± 0.3 min and 1.9 ± 0.4 min using cCBCT and vCT, respectively. The dose calculation and deformable image registration dominated the evaluation efficiency, and accounted for 33% and 30% of the total evaluation time, respectively. The sCT generation took another 19% of the total time. Gamma passing rates were greater than 91% and 97% using 1%/1 mm and 2%/2 mm criteria, respectively. When the appropriate sCT was chosen, the target mean WET difference from the reference were less than 0.5 mm. The appropriate sCT method choice determined the uncertainty for the framework, with the cCBCT being superior for head-and-neck patient evaluation and vCT being better for lung patient evaluation.
Conclusions:
An online CBCT evaluation framework was proposed to identify the use of the optimal sCT algorithm regarding efficiency and dosimetry accuracy. The framework is extendable to adopt advanced imaging methods and has the potential to support online adaptive radiotherapy to enhance patient benefits. It could be implemented into clinical use in the future.
Keywords: CBCT-based evaluation, online adaptation, proton therapy
1 |. INTRODUCTION
Intensity modulated proton therapy (IMPT) has been clinically proven to achieve equivalent tumor control probabilities to conventional radiotherapy, while reducing radiation toxicities and risks for unplanned hospitalizations.1–3 The physical characteristics of the proton integral depth dose peak (Bragg peak) enable highly conformal dose delivery to targets while sparing healthy tissues. However, compared to photon therapy, the highly modulated IMPT plans are significantly more sensitive to patient anatomy changes, such as tumor shrinkage due to treatment and normal-tissue shrinkage due to weight loss. The current clinical practice is to monitor the patient’s anatomy changes with weekly or bi-weekly quality assurance CT (QACT) images and re-plan when necessary. Modern proton treatment delivery systems usually include cone-beam CT (CBCT) to detect potential patient anatomy variations and setup uncertainty. Such anatomical uncertainty can be decomposed into inter-fractional and intra-fractional uncertainties. The former includes morphological changes in tumor shapes and patient weight loss during radiation treatment. The latter involves respiratory motion and patient adjustment such as bladder/rectum filling/releasing and breast expander positioning. These uncertainties can invalidate a nominal treatment plan if the variation exceeds the tolerance criteria of clinical goals, for instance, if the 95% clinical target volume receives insufficient prescription doses. Accordingly, two strategies, offline and online evaluations, are used to determine the necessity of plan modifications. The online evaluation is especially promising since it can be applied to quantify the plan quality change due to inter-fractional anatomical and patient positioning uncertainties in real time.
Implementing an online CBCT evaluation for IMPT requires several components, including image acquisition, synthetic CT (sCT) generation, image registration, contour mapping, and dose calculation. The evaluation has high demands regarding time efficiency, which impacts patient comfort, staff time, infrastructure, and financial resources. The machine limits the CBCT acquisition time. For instance, Varian ProBeam (Varian Medical System, Palo Alto) requires approximately 35/60 s for full-fan and half -fan (unsymmetric imaging panel position) scans. Deformable image registration (DIR) methods4–6 have been implemented in many clinical treatment planning systems to generate sCT to quantify the impact of anatomical uncertainty. Machine learning-based DIR algorithms7–9 have been used to accelerate image generation. Meanwhile, Shan et al.10 proposed the virtual particle Monte Carlo method to significantly accelerate patient plan calculation. However, there is still a lack of frameworks to integrate all advanced developments for proton online CBCT evaluation.
This work aims to develop an online CBCT evaluation framework to standardize the essential components for efficient analyses and support proton therapy. Two sCT generation algorithms, the corrected CBCT (cCBCT) and virtual CT (vCT), were adopted to demonstrate the usability of the proposed framework. We further investigated how sCT algorithms could efficiently, robustly, and accurately reveal patient anatomy changes to support clinical decision-making, such as the need for re-planning. The originality of the proposed framework includes the following three aspects to conduct the clinical implementation of radiation therapy.
The proposed framework decomposes uncertainties in sCT algorithms to enable divide-and-conquer strategies to further improve the efficacy of the online evaluation workflow for clinical decision-making and potential online adaptive treatment planning.
The proposed framework, for the first time, systematically streamlines the online CBCT evaluation and validation workflow, enabling knowledge transparency, which enhances the credibility of institutional approval procedures for clinical implementation.
The proposed framework can achieve assumable predictions by adopting multiple sCT algorithms to achieve site-specific evaluations regarding image quality, anatomy conservation, and dosimetry accuracy.
The proposed framework is solely based on a commercial treatment planning system (RayStation) and is intended to be clinically available in an upcoming release.
2 |. MATERIALS AND METHODS
2.1 |. Patient data, treatment plans, and treatment delivery system
We identified eight head-and-neck (HN), seven lung, and eight prostate cancer with lymph nodes patients to investigate which sCT methods are superior for online patient evaluation. Patient images were acquired from a Siemens SOMATOM Definition Edge scanner for nominal treatment planning. The quality assurance CT (QACT) images were obtained from the identical CT scanner on the same treatment day. The treatment planning system (TPS), RayStation 11B research version (RaySearch Lab., Stockholm, Sweden), was used for Monte Carlo robust optimization. Table 1 gives the plan characteristics including numbers of beams for treatment plans at different sites. The treatment plans for six HN patients were optimized using five proton beams, including left posterior oblique (LPO), left anterior oblique (LAP), anteroposterior (AP), right anterior oblique (RAO), and right posterior oblique (RPO). The remaining two HN plans used the beam sets of LAO/AP/RAO/RPO and LPO/LAO/AP/RAO/RPO/PA. Lung treatment planning included two to five proton beams based on the spread of lesions. The prostate patients were all treated with proton beams at 90°, 180°, and 270° gantry angles. The posteroanterior beam is only used to cover the pelvic lymph nodes while sparing the femoral heads, and this beam does not penetrate through the rectum to avoid complications. RayStation is running on a clinical server with dual Intel® Xeon® Gold 6136 CPU (2017 model year), 256GB RAM. The system includes an NVIDIA Quadro RTX 8000 for GPU-based Monte Carlo dose calculation and deformable image registration. The treatment deliver system (TDS) is Varian ProBeam™ (Varian Medical Systems, Palo Alto) with proton energies11 ranging from 70 to 242 MeV. The TDS includes two orthogonal flat imaging panels (Paxscan 4030CB) attached to the gantry. The preset image protocols include the spectra of 100 and 125 kVp for HN/thoracic, and pelvic treatment sites. All lung patients included in this study were treated with free breathing since the motion amplitude was less than 5 mm. Table 1 summarizes the plan characteristics for patients with various treatment sites with a dose grid of 0.3 cm and statistical uncertainty of 0.5% per beam.
TABLE 1.
Summary of mean clinical target volumes and mean numbers of spots and simulated particles for patients with different treatment sites.
| Head and neck | Lung | Prostate | |
|---|---|---|---|
| Clinical target volume (CTV) | 164.1 ± 209.9 cm3 | 302.2 ± 114.3 cm3 | 48.1 ± 23.5 cm3 |
| Numbers of beams | 5a | 3b | 3c |
| Numbers of spots | 2119 ± 1274 | 3036 ± 1554 | 3368 ± 1304 |
| Numbers of simulated particles | 2.03 × 10⁸ ± 9.28 × 10⁷ | 1.43 × 10⁸ ± 2.96× 10⁷ | 1.68 × 10⁸ ± 7.50 × 10⁷ |
| Range uncertainty | 3.5% | 5.0% | 3.5% |
| Positional uncertainty | 3 mm | 5 mm | 5 mm |
Median number. For HN treatment, six plans used five beams and the other two plans used four and six beams.
Median number. For lung treatment, three plans used three beams and two plans used four beams. The remaining two plans used two and five beams.
Median number. For prostate treatment, all plans used three beams.
2.2 |. Online CBCT evaluation framework
Figure 1 depicts that the framework integrates data from image-guided and treatment planning systems to achieve online patient evaluation using on-board CBCT using two sCT generation algorithms, cCBCT and vCT, both provided by the TPS. The cCBCT is created using an iterative algorithm12 that contains two main steps.13 The first step consists of utilizing a deformable registration (Element 3 in the framework) between the CBCT and planning CT to construct a 2D histogram. A “Body” structure is generated automatically for the CBCT image and used as the ‘Focus ROI’ in this DIR. By finding the peaks in this histogram a piecewise linear CBCT-to-CT value conversion function can be used to convert the CBCT values to HU. The second step uses the converted CBCT and a deformed version of the planning CT to construct a correction map which corrects for low-frequency artifacts in the CBCT. These steps are iterated until the correction map converges.
FIGURE 1.
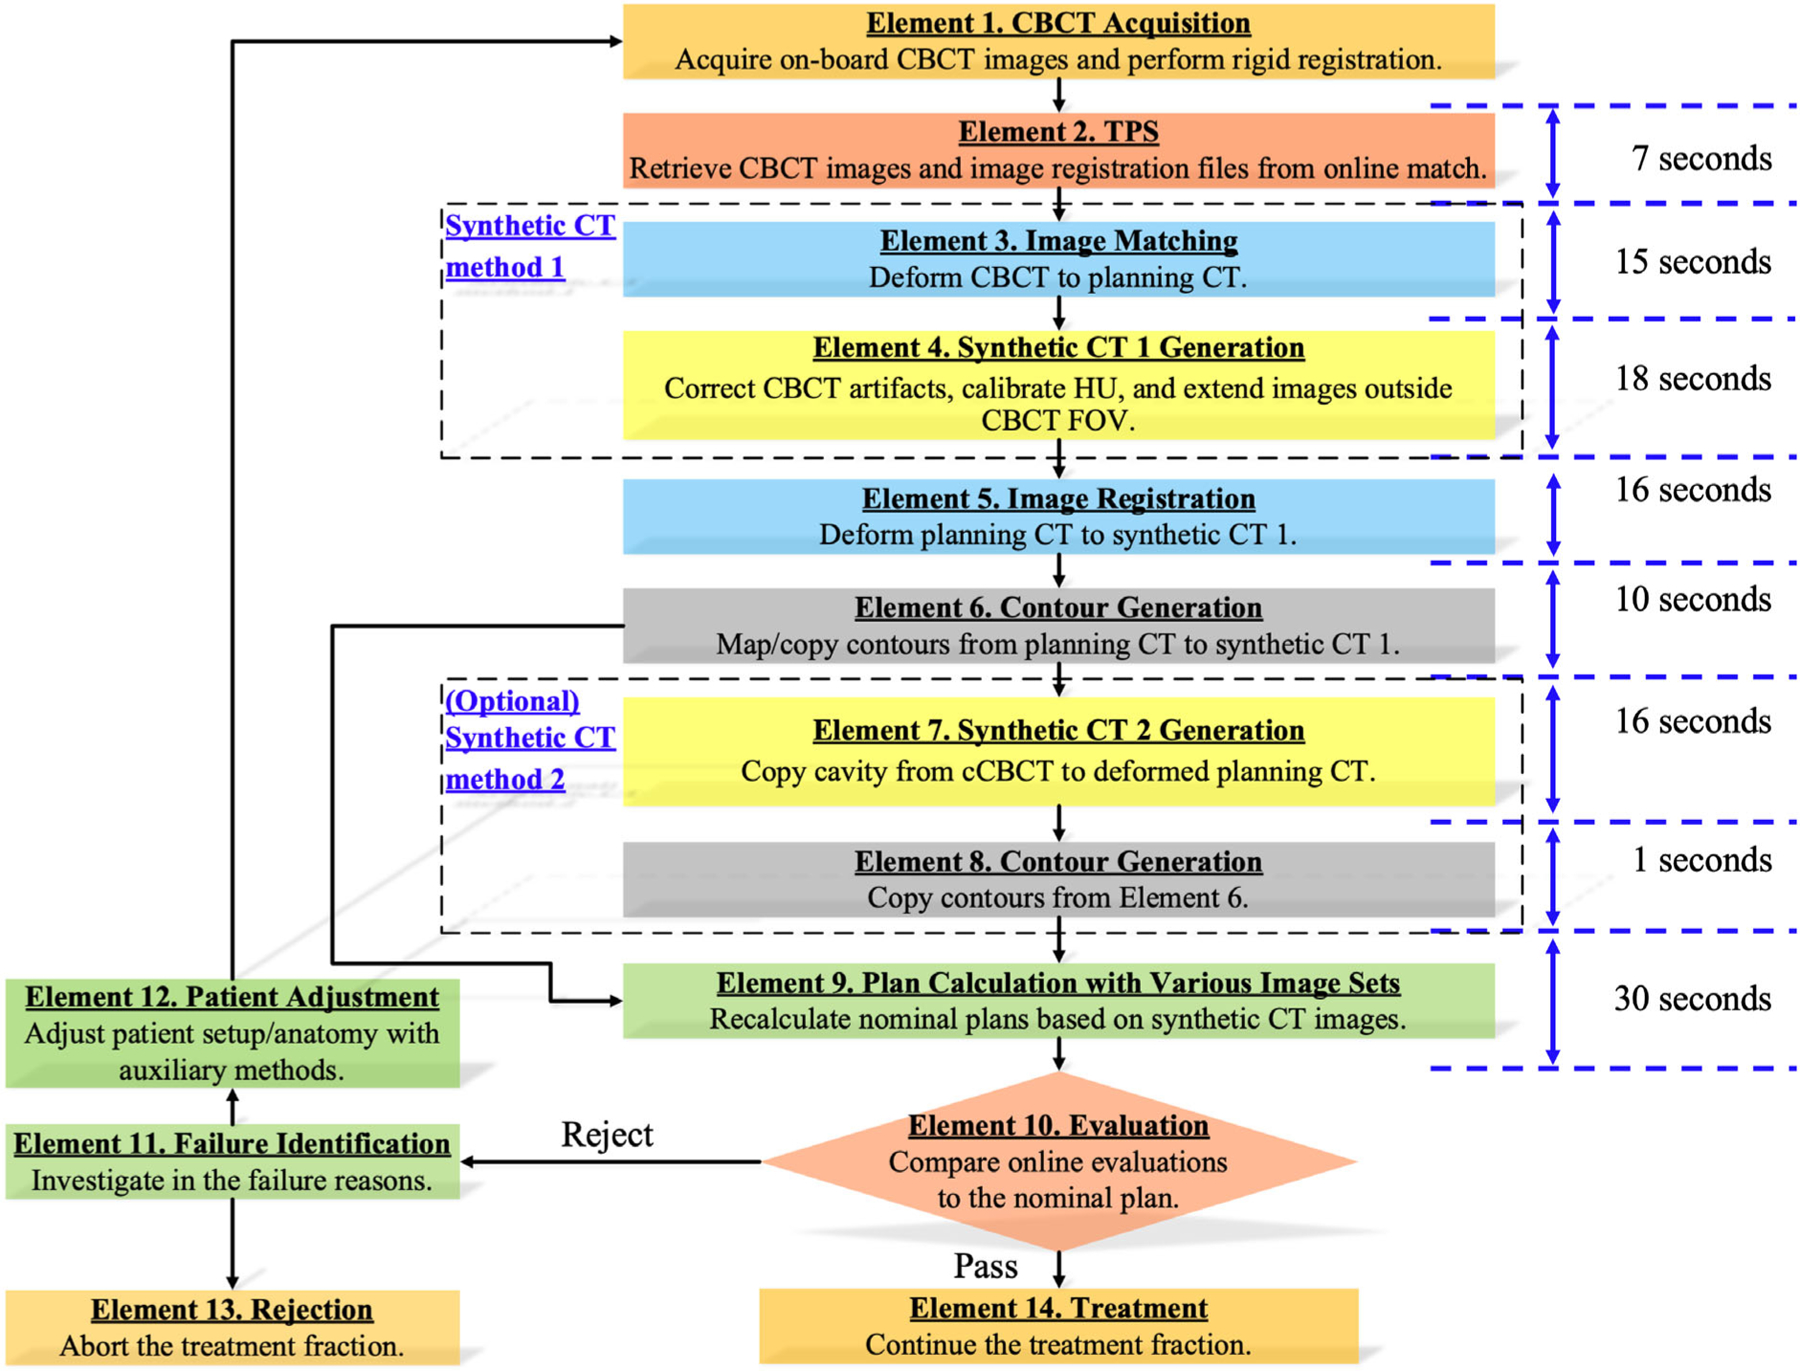
Online CBCT evaluation framework for proton therapy using sCT. The framework takes the information from pre-treatment onboard CBCT images to support clinical decision-making through dosimetry comparisons to the nominal treatment plan. Note that in Element 9, the dose calculation time also includes some other prerequisite process time, like contour integrity check, material overlap check, and so forth, which is hard to be timed separately.
The virtual CT13 is created by first deforming the planning CT to the CBCT (Element 5 in the framework). By default, the script utilizes Body and target ROIs as the “focus ROI” in this DIR. However, users can add additional structures to the configuration file if needed. Then this image is compared to a cCBCT image (created on the fly), and any differences in air pockets or lung tissue between the CT and the CBCT are replaced by the values found in the cCBCT. Hence, most of the vCT consist of the deformed planning CT, but it has been corrected for incorrect low-density anatomical changes.
To account for the limited field-of -view in the CBCT (an optional setting), we utilized a Focus ROI that contracted the field-of -view by 2 cm in all directions. This helps provide more reasonable dose volume histogram (DVH) presentations. However, since we lack information outside the field-of -view, evaluations in those regions should be scrutinized.
Monte Carlo dose calculations were performed based on each generated sCT image set at various patient sites for physicians and physics to review and determine if a treatment requires plan modification. In-house Python scripts were developed to automatically streamline the workflow in the TPS environment. The total evaluation time can be carried out within 1.7 min using cCBCT images. The proposed framework includes the essential elements given as follows.
Element 1. Acquire the on-board CBCT images. It takes approximately 35 and 60 s for full-fan (200°) and half -fan (360°) scans. However, patient setups can be complicated depending on treatment sites. We exclude this CBCT acquisition time from the online evaluation, as it is part of the routine patient setup process.
Element 2. Retrieve CBCT images and online image registration files from the ARIA® oncology information system (V16.1, Varian Co., Palo Alto, CA) through an internal network, typically taking 6.8 s. This process ensures that the TPS uses actual patient anatomy for dose calculation.
Element 3. Deform the CBCT to planning CT to establish a connection between the planning CT and CBCT, primarily for CBCT intensity conversion and artifact correction purposes.
Element 4. Generate sCT 1. We adopted a synthetic cCBCT method13 to demonstrate the framework. The cCBCT method first corrects image artifacts from CBCT with the data from Element 3. We refer to the total time required by Element 3 and Element 4 as cCBCT generation time. The region outside the CBCT field of view (FOV) is extended by planning CT. To handle the edges of CBCT FOV, a focus region of interest (ROI) is created by contracting 2 cm in super-inferior directions. The parts outside the focus ROI have been deformably mapped from the planning to the cCBCT.
Element 5. Deform planning CT to sCT 1, focusing on the “Body” and target structures to conserve the patient geometry and lesion volume to obtain accurate deformed contour structures from planning CT images later.
Element 6. Copy surgical implants and marker contours rigidly from planning CT to sCT 1 as needed, and map other contours to cCBCT using the deformable registration generated from Element 5. The user has the flexibility to override the default setting to specify contours for either rigid copy or mapping.
Element 7. Generate sCT 2. Copy cavities from cCBCT to deformed planning CT (Element 3) to generate vCT. The region outside the CBCT field of field (FOV) is extended by planning CT. We adopted a synthetic vCT method13 to demonstrate the advantage of model selection based on different treatment sites.
Element 8. Rigidly copy contour structures from cCBCT (Element 6) to vCT.
Element 9. Recalculate nominal plans using Monte Carlo dose calculation based on sCT images. We refer to the total execution time from Element 9 and Element 10 as the Monte Carlo dose calculation time.
Element 10. Evaluate the nominal plan dose calculated on the sCT images in Element 9. The treatment can continue if the dose evaluation metrics satisfy clinical tolerances. Otherwise, patient adjustment or plan modification is required to ensure optimal patient outcomes. At our institution, the evaluation metrics were adapted from the specific QACT criteria established by the institution. For patients undergoing normal fractionation, there are several scenarios that may trigger rejection based on our institutional guidelines. These include: (1) If the target D95 coverage falls below the worst-case scenario identified during the treatment plan’s robust evaluation and D95 is less than 95% of the prescription; (2) If the volume receiving 110% of the prescription exceeds 1cc; and (3) If the dose delivered to critical organs of high priority, such as the brain stem, optic chiasm/nerve, or spinal cord, surpasses the worst-case scenario from their respective robust evaluations. For hypofractionation cases, the criteria are typically more stringent, and often the decision-making process becomes a combination of clinical judgment and a patient-specific approach.
Element 11. Investigate why the evaluation plan cannot meet clinical goals and determine if the current treatment is possible. In some cases, the reasons may be readily apparent, such as obvious anatomy mismatches like differences in bladder or rectum filling. However, there are instances where pinpointing the exact cause is not straightforward, and multiple factors can contribute to inferior dosimetry. To address these situations, various parameters such as beam dose, line dose, and other relevant factors can be analyzed. This analysis helps identify the beam that may be the principal contributor to the observed dosimetric issues. This step is crucial in determining whether the problem can be resolved through different setups, addressing bowel movement, encouraging water intake, or employing other appropriate measures. Alternatively, based on the severity of the dosimetric discrepancies and the feasibility of resolution, a final decision may be made that the patient cannot proceed with the planned treatment (proceed to Element 13).
Element 12. Adjust patient setup and anatomy with auxiliary methods. For instance, patients may be requested to fill the bladder or empty the rectum.
Element 13. Abort the treatment fraction since an auxiliary method is not feasible to meet clinical goals or it is not safe or clinically unacceptable to continue the treatment.
Element 14. Continue the treatment fraction since the evaluation metrics achieve clinical goals within tolerance intervals or based on clinical decisions.
2.3 |. Synthetic CT model selection
2.3.1 |. Evaluation metrics
The reference images were acquired from the sameday QACT scans. Then, QACT images were deformed to cCBCT to obtain deformed QACT (dQACT)14 using the built-in function of RayStation. We compared the dose distributions obtained by Monte Carlo calculation using dQACT and sCT images, cCBCT and vCT. The dQACT served as the reference, and the optimal model should result in consistent dose statistics with dQACT. However, direct comparisons in high-dose gradient regions are challenging since a slight change in spatial dose distributions can cause significant uncertainty between the two dose distributions. We used gamma index15 as an evaluation metric to compare dose distributions based on the distance-to-agreement concept16,17 and dose difference within an acceptance interval. The dose comparison is acceptable if a voxel gamma index is smaller than one. The three-dimensional (3D) gamma passing rate (%GP) is defined by the voxels with gamma indexes smaller than one divided by the total voxel number. We used a dose threshold from 10% of the maximum dose to focus the comparisons on the treatment regions, and the gamma indexes were calculated based on 3D dose distributions. The gamma criteria of 1%/1 mm and 2%/2 mm was used to investigate the differences between dQACT and sCTs.
Water equivalent thickness (WET) was used as another evaluation metric. We compared the mean WET of all voxels within clinical target volumes (CTV) between dQACT and sCTs to determine potential range uncertainty at the distal end of CTV. We implemented the WET calculation algorithm from OpenREGGUI (openreggui.org)18 in the RayStation Scripting environment. The reference WET was obtained from dQACT using the institutional Hounsfield lookup table for material characterization.
2.3.2 |. Validation workflow
Figure 2 depicts the validation workflow used to identify the optimal sCT for the proposed online CBCT evaluation framework. The QACT was deformed to cCBCT to preserve the patient anatomy, and the contour structures were copied from Element 6 in the proposed framework, as shown in Figure 1. We calculated the reference WET from dQACT images, and the reference dose distributions for gamma comparisons were derived from Monte Carlo dose calculation using dQACT images. The optimal sCT should achieve minimum errors in WET and gamma comparisons simultaneously to ensure coverage for the CTV and sparing for healthy tissues. The optimal results from the validation workflow were analyzed based on different treatment sites and documented as prior knowledge for sCT selection in the proposed framework (Figure 1) when QACT is unavailable.
FIGURE 2.
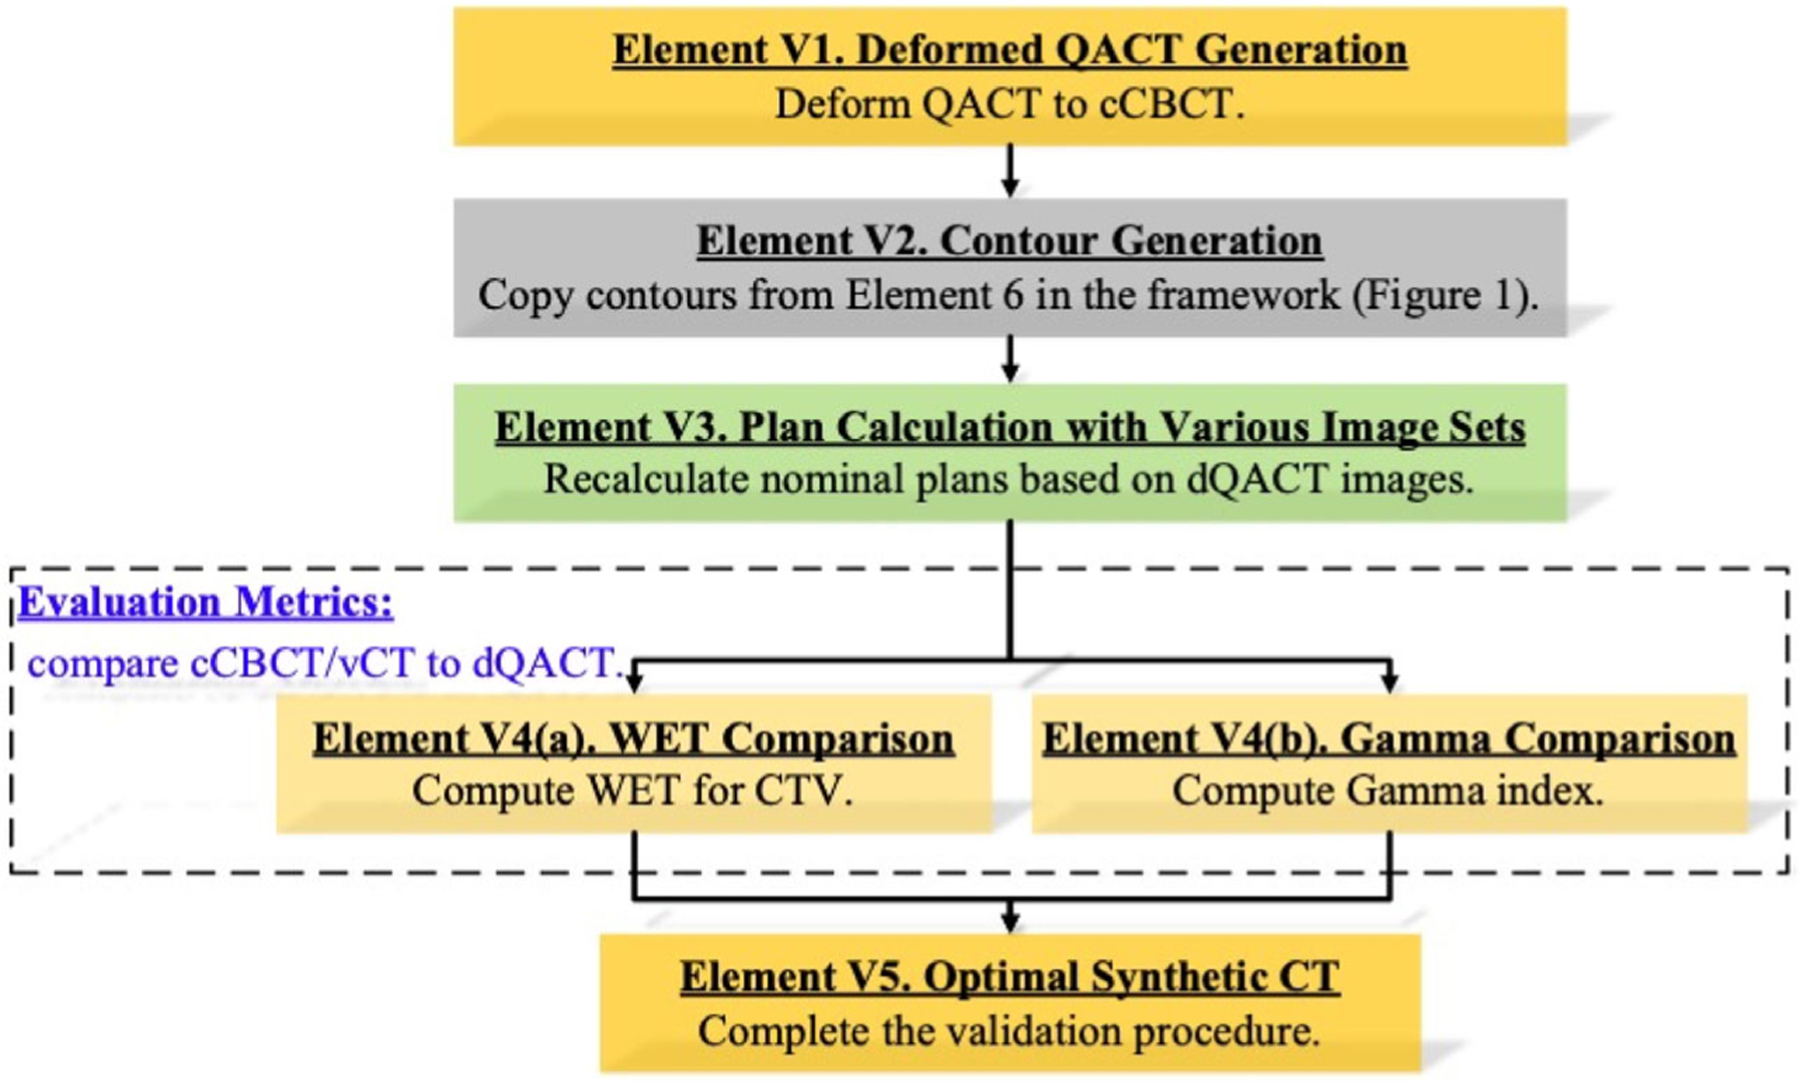
Validation workflow to evaluate the accuracy of the different sCT generation methods for online CBCT evaluation framework (Figure 1) using QACT.
3 |. RESULTS
3.1 |. Timing analysis of the online evaluation framework
Table 2 summarizes the mean execution time for each component of proposed framework (Figure 1). Monte Carlo dose calculation dominated the evaluation time, and the computational time varied by treatment site. The means and standard deviations of dose calculation time for lung patients were approximately 25% less than those for HN and prostate patients. The generation of sCT and deformable image registration required approximately 17 and 16 s for all patients, respectively. The HN plans required contour mapping time 40% less than that of lung and prostate patients.
TABLE 2.
Efficiency analysis of each framework component using the mean execution time. Note that in Element 9–10, the dose calculation time also includes some other prerequisite process time, such as contour integrity check, material overlap check, and so forth, which is hard to time separately.
| Component | Action | HN (sec) | Lung (sec) | Prostate (sec) |
|---|---|---|---|---|
| Element 2 | Import CBCT to TPS | 7.1 ± 0.2 | 7.4 ± 0.3 | 7.5 ± 0.2 |
| Element 3 | Deform CBCT to planning CT | 16.6 ± 2.8 | 15.6 ± 1.8 | 15.5 ± 4.0 |
| Element 4 | Generate cCBCT | 18.0 ± 2.1 | 17.6 ± 1.6 | 18.6 ± 2.0 |
| Element 5 | Find CTVs | 0.5 ± 0.06 | 0.3 ± 0.04 | 0.3 ± 0.06 |
| Find body structure | 0.3 ± 0.05 | 0.1 ± 0.01 | 0.1 ± 0.02 | |
| Deform planning CT to cCBCT | 16.6 ± 2.8 | 15.6 ± 1.8 | 15.5 ± 4.0 | |
| Element 6 | Find contour structures | 2.6 ± 0.7 | 2.4 ± 1.7 | 1.6 ± 0.2 |
| Map contour structures | 6.2 ± 2.9 | 10.2 ± 2.6 | 9.9 ± 6.4 | |
| Element 7 | Generate vCT | 15.5 ± 1.6 | 15.5 ± 0.8 | 17.2 ± 2.3 |
| Element 8 | Copy contour structures | 1.6 ± 0.5 | 1.1 ± 0.2 | 1.0 ± 0.2 |
| Element 9- | Compute Monte Carlo dose using cCBCT | 30.9 ± 10.1 | 25.9 ± 2.4 | 33.9 ± 9.1 |
| 10 | Compute Monte Carlo dose using vCT | 30.6 ± 11.0 | 25.8 ± 2.4 | 34.3 ± 9.2 |
| Total time | Use cCBCT for online evaluation | 1.6 ± 0.4 (min) | 1.6 ± 0.2 (min) | 1.7 ± 0.4 (min) |
| Use vCT for online evaluation | 1.9 ± 0.4 (min) | 1.9 ± 0.2 (min) | 2.0 ± 0.5 (min) |
3.2 |. Evaluation of cCBCT and vCT
Figure 3 depicts the percentage 3D gamma passing rate (%GP) for patients with different treatment sites. Figure 3a shows that cCBCT results in a higher %GP than vCT for HN treatment sites. However, for lung patients, Figure 3b shows that vCT is more consistent with dQACT than cCBCT. Both sCT images show similar performance for prostate patients.
FIGURE 3.

Variation of 3D gamma passing rates (%GP) for different treatment plans from (a1-a2) HN, (b1-b2) lung, and (c1-c2) prostate patients using 1%/1 mm (a1, b1, c1) and 2%/2 mm (a2, b2, c2) gamma criteria with a 10% dose threshold. The reference dose was computed using dQACT images, while the target was calculated using cCBCT or vCT images.
Table 3 summarizes the mean and standard deviation for %GP from all patients using two gamma criteria, 1%/1 mm and 2%/2 mm. Table 3 also shows the mean WET values for CTVs in HN, lung, and prostate patients, which are 44.8 ± 19.0, 85.9 ± 22.5, and 166.1 ± 12.2 mm, respectively, in the reference dQACT images. WET analyses exhibited that cCBCT predicted significantly more accurate WET than those from vCT for HN (0.1 ± 0.4 mm vs. 0.5 ± 0.6 mm, p = 0.02) and prostate patients (0.3 ± 1.1 mm vs. 1.7 ± 1.4 mm, p < 0.001), but not for the lung patients (0.0 ± 0.4 mm vs. 0.7 ± 0.5 mm, p = 0.18).
TABLE 3.
Averaged 3D gamma passing rates (%GP) and mean WET for cCBCT and vCT at different treatment sites. The better of the two algorithms are highlighted in bold font.
| HN | Lung | Prostate | |
|---|---|---|---|
| %GP (1%/1 mm), cCBCT | 95.4% ± 2.3% | 91.7% ± 4.3% | 97.9% ± 1.4% |
| %GP (1%/1 mm), vCT | 93.9% ± 1.5% | 94.6% ± 4.3% | 98.3% ± 1.0% |
| %GP (2%/2 mm), cCBCT | 98.6% ± 0.9% | 97.5% ± 1.8% | 99.4% ± 0.6% |
| %GP (2%/2 mm), vCT | 97.8% ± 0.7% | 98.1% ± 2.0% | 99.5% ± 0.4% |
| WETdQACT (mm) | 44.8 ± 19.0 | 85.9 ± 22.5 | 166.1 ± 12.2 |
| ∆WETcCBCTa (mm) | 0.1 ± 0.4 | 0.0 ± 0.4 | 0.3 ± 1.1 |
| ∆WETvCTb (mm) | 0.5 ± 0.6 | 0.7 ± 0.5 | 1.7 ± 1.4 |
| p-value (∆WET) | p = 0.02 | p = 0.18 | p = 0.0002 |
WETcCBCT-WETdQACT.
WETvCT-WETdQACT.
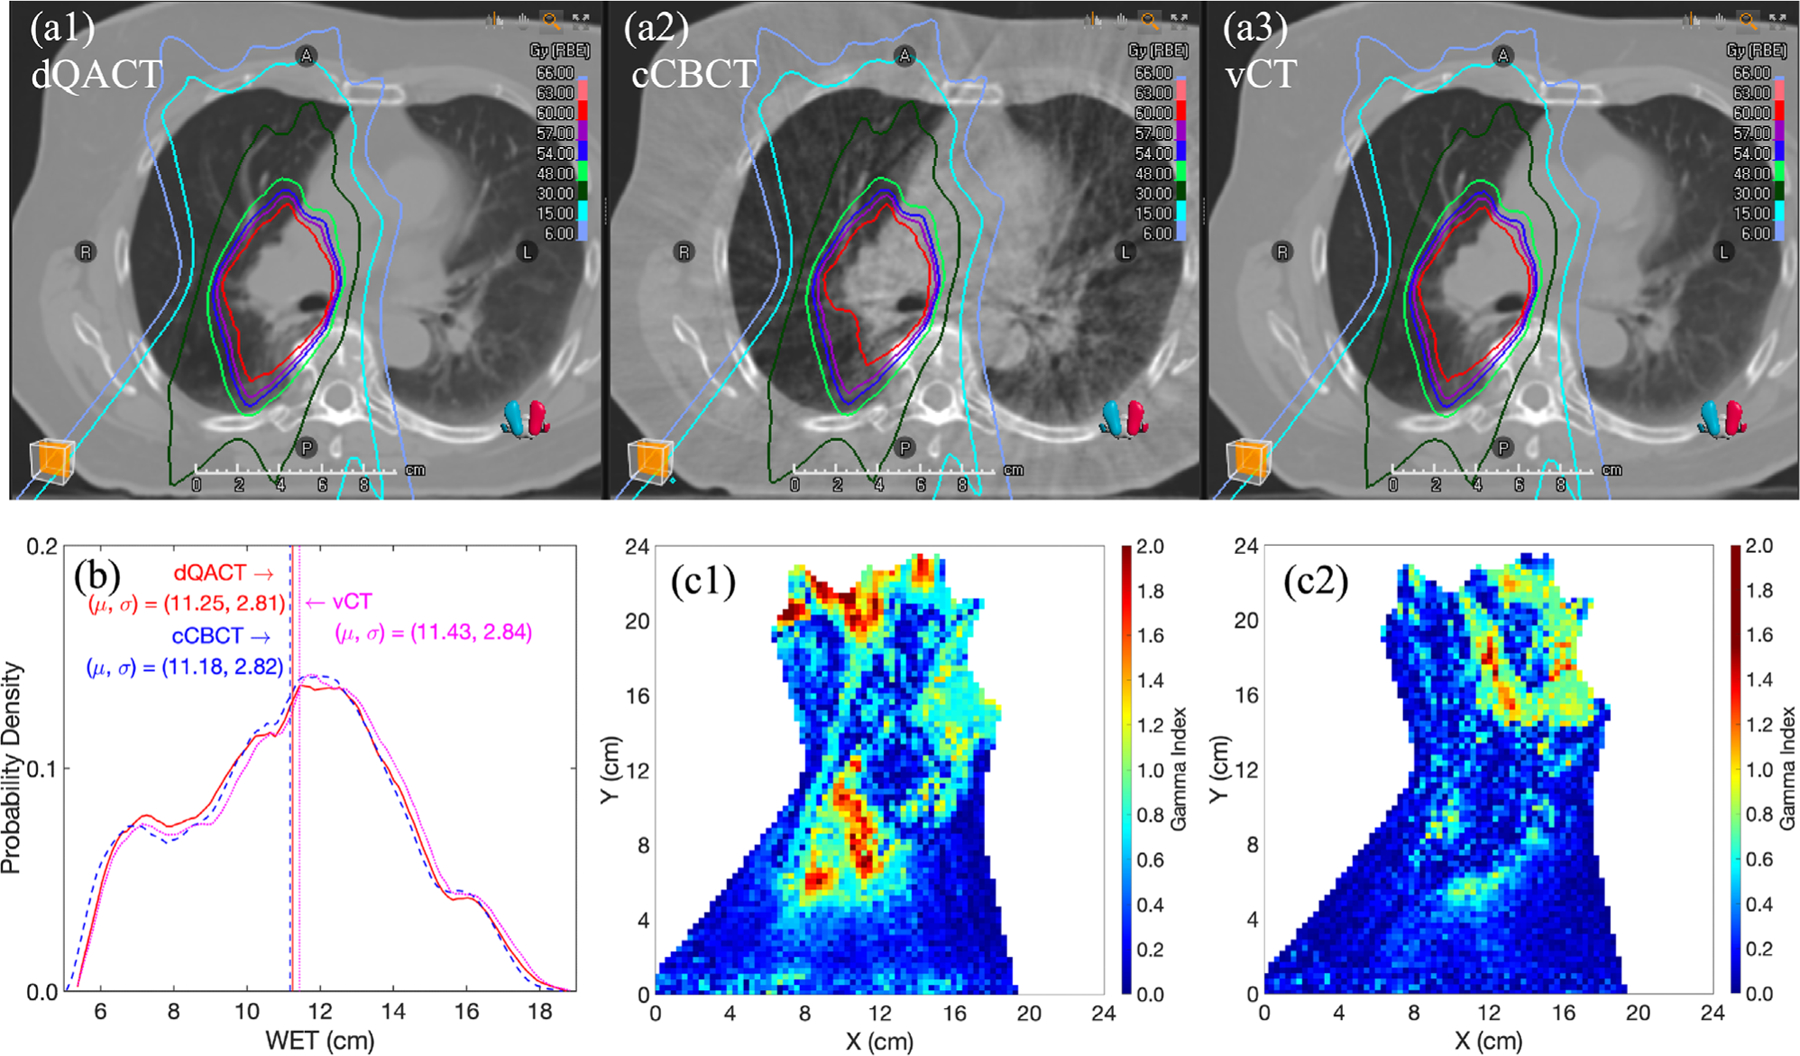
Figure 4 shows transversal HN images with isodose lines, one beam WET distribution for CTV, and gamma analysis from patient 2 in Figure 3a. The white dashed lines in Figure 4a1,a3 show the range discrepancies between dQACT and vCT. The white arrows also point out the missing tissue in both the dQACT and cCBCT, but not in the vCT. Figure 4c2 shows that vCT results in local gamma failures at multiple regions.
FIGURE 4.

Transversal CT images of (a1) dQACT, (a2) cCBCT, and (a3) vCT from HN patient 2 in Figure 3a, with isodose lines and white dashed lines to indicate the proton range discrepancies using different CT image sets for dose calculation. (b) WET histograms obtained from dQACT (solid red line), vCT (dotted pink line), and cCBCT (blue dashed line) images. Gamma index maps (1%/1 mm) for dose distributions computed from (c1) cCBCT and (c2) vCT, using dQACT as the reference. (a1)-(a3) and (b) are beam dose for proton beams from the gantry at 50°.
In Figure 5, the dose maps, beam WET distributions in CTV, and gamma comparison maps for patient 4 in Figure 3b are presented. Figure 5a1–a3 shows that, compared to dQACT, both cCBCT and vCT result in similar isodose distributions at the peripheral regions. Figure 5b indicates that the WET distributions in both the cCBCT and vCT are close to that in the dQACT. However, more local gamma failures are shown in the cCBCT than those in the vCT due to residual shading or motion artifacts in the cCBCT.
FIGURE 5.
Transversal CT images of (a1) dQACT, (a2) cCBCT, and (a3) vCT from lung patient 4 in Figure 3b, with plan isodose lines. (b) WET histograms for dQACT, vCT, and cCBCT images at the gantry angle of 165°. Gamma index maps (1%/1 mm) for dose distributions computed from (c1) cCBCT and (c2) vCT, using dQACT as the reference.
4 |. DISCUSSION
Although the synthetic CBCT methods19–23 have been widely investigated and validated, the developments of actual clinical implementation for proton clinic are still in infancy. This work focuses on developing an online CBCT evaluation framework to assist medical decision-making for proton therapy. On-board, online evaluation can benefit the quality of radiotherapy treatment by ensuring that patients receive the expected coverage for their targets, especially when using charge particles with higher linear energy transfer. The evaluation can assist radiation oncologists and physicists with online decision making by answering questions such as: (1) is it safe to treat the patient? (2) How can the patient setup or anatomy be adjusted if there is a concern? and (3) Is a plan modification needed? However, there is currently no guideline for efficiently and effectively implementing this evaluation for the benefit of patients. The proposed framework is instrumental in providing a transparent workflow to enable knowledge transparency. The framework systematically includes the essential elements for online evaluation to further improve time efficiency and reduce potential uncertainties caused by image registration and the selection of sCT algorithms. This work demonstrates that the proposed framework can identify the optimal sCT method based on different treatment sites and achieve a total evaluation time of less than 2 min. The method can potentially support online adaptive treatment planning to benefit patients who have undergone significant anatomy changes.
The most time-consuming processes are dose calculation, sCT generation, DIR, and contour mapping. Although the GPU based MC dose engine is very fast,24 the dose calculation requires prerequisite checks such as contour integrity check and material overlap checks, which can significantly increase the processing time. Furthermore, the dose calculation time also dependents on the dose grid resolution and size. To reduce the dose calculation time, only necessary structures should be mapped or copied to the sCT, and the plan should be optimized with a reasonable dose grid size and resolution. Creating the vCTs relies on information from cCBCT, which is always generated before the vCT, and may take a little bit longer. Two DIR steps are necessary: the first is for CBCT image correction, but not optimal for contour mapping; the second is from planning CT mapping to the cCBCT with fewer artifacts, which is more accurate for contour mapping. Contour mapping can also take a significant amount of time. Minimizing the contours needed for mapping, simplifying the contour geometries, and other similar approaches could improve the efficiency. The current speed is based on a relatively old CPU from 2017 while the GPU is relatively new. Therefore, the actual speed may differ substantially depending on the system configuration.
The previous studies indicated that the DIR algorithms25,26 implemented in RayStation include performance uncertainty regarding different clinical parameter settings and deformations of images, doses, and contours. In our study, we employed the default RayStation clinical settings, as reported in the ANA-CONDA algorithm study implemented by RayStation.6 The first DIR serves to establish a connection between the treatment planning CT and CBCT, primarily for intensity conversion and artifact correction purposes.
For the second DIR, based on our experience, the RayStation DIR algorithm generally performs well in overlaying the cCBCT and planning CT image sets for body and bone structures, which have the most significant impact on dose calculation. However, the algorithm may not perform as well for air cavities and changes in bowel filling. Nevertheless, this is not a major concern for the cCBCT, as the DIR (the first one) is only used to provide a rough mapping of the CBCT and planning CT shapes for histogram-based artifact correction. The air cavity/bowel filling regions in the cCBCT are copied to the vCT to address any DIR-related issues in those regions. As a result, the dose calculation is less dependent on the DIR. While the contour mapping that relies on the second DIR is reasonably accurate for DVH parameters, it remains the user’s responsibility to verify them on the cCBCT and make modifications as necessary. Additionally, users have the option to add interested ROIs to the focus ROI list, allowing the algorithm to prioritize those ROIs.
The acquisition of same-day QACT images typically occurs immediately after the treatment session. In most cases, the anatomy depicted in these images closely resembles that of the pretreatment CBCT images. However, inherent setup uncertainties during the QACT scan can introduce some mismatches between the QACT and CBCT images.14 To mitigate this, deformable registration (DIR) is employed to align the QACT with the CBCT, resulting in the creation of the deformed QACT (dQACT). Previous literature has demonstrated that DIR offers the best possible means to minimize mismatches between the QACT and CBCT.27 Nevertheless, it is important to acknowledge that due to the uncertainty associated with DIR, there may still exist slight mismatches between the dQACT and the CBCT. To ensure the highest level of alignment between the QACT and CBCT, the “Body” contour is utilized as a “control ROI” for all cases included in this study. This approach helps to optimize the matching accuracy between the QACT and CBCT. While discrepancies in bowel, rectum, bladder filling, tongue position, and other factors may be present between the QACT and CBCT, which can pose challenges for DIR in certain cases, we have meticulously examined each dQACT to minimize their impact on the evaluation process.
Generally, vCT images are known to have lower noise levels. However, the accuracy of vCT images may be compromised by the remaining DIR mismatch at the body surface and cavity filling. This issue is particularly prevalent at the HN treatment site due to various factors such as random nasal and oral cavity filling changes, tongue position variations, and target shrinkage. The DIR may not accurately implement these changes during vCT generation, resulting in decreased evaluation accuracy. On the other hand, cCBCT is not affected by this issue and is therefore recommended for the HN site. Figure 3a1 shows that out of eight HN patients, seven have a better %GP for the cCBCT compared to vCT, and the mean WET for the targets is also more precise in the cCBCT. In Figure 4, cCBCT is shown to be superior to vCT for a HN patient as cCBCT can preserver the anatomical geometry, as pointed out by the white arrows in Figure 4a2. However, vCT can misrepresent missing tissues (white arrows) due to an imperfect DIR, resulting in shorter distal ranges than dQACT and causing local gamma failures. The WET histogram may also not be able to capture minor surface cavity variations on images since the WET for air is negligible. Two potential issues to consider are CBCT FOV limitations and dental filling artifacts. Due to the limited CBCT FOV in the superior-inferior direction for the onboard CBCT systems, CTVs, especially nodal CTVs at the shoulder region, may not be within the FOV. Dental filling could result in severe artifacts in CBCT reconstruction that are difficult to removed, requiring manual contouring and overriding to appropriate tissue types. However, implementing these changes during the online evaluation process may be challenging due to timing constraints.
In Figure 3b and Table 3, we observe that lung vCT has better agreement to dQACT regarding gamma passing rate compared to cCBCT. This difference may be due to strong shading and motion artifacts that occur in cCBCT, compromising the image quality and resulting in significant uncertainty compared to vCT. Additionally, the HU of lung tissue in vCT is theoretically more accurate than that in cCBCT. Although the mean WET difference is slightly higher (but not significant) than that of cCBCT, the gamma analysis shows better dose agreement associated with vCT evaluations for most lung patients. Moreover, the DIR algorithms perform well at the body surface in the chest region and larger lung volumes. Thus, vCT is recommended for lung patients. However, caution is necessary when fluid is present in the lung, as most DIR algorithms may fail when there is significant change in fluid level. If the tumor shrinks substantially, the accuracy of DIR must be checked.
For prostate and pelvic patients, both methods are suitable. One should be mindful that bowel/rectum filling may not be adequately accounted for, which may result in inaccuracies for some patients (higher WET difference for vCT in Table 3). However, this effect may not necessarily have an actual impact on clinical judgement, as the filling is random and typically accounted for during the planning process. As a result, both cCBCT and vCT could be used for prostate patients.
The decision-making process involved in Element 10 and 11 holds significant importance within the workflow and often requires clinical experience and judgment. In Element 10, accurate mapping of contours to the vCT is crucial, particularly for dosimetric parameters such as DVH parameters concerning targets and critical organs. Given the time constraints in the online evaluation process, it is essential to prioritize critical and high-priority parameters. Several key factors influence the decision-making process, including the total number of treatment fractions (hypofractionation vs. normal fractionation), the treatment goal (palliative vs. definitive), and the nature of anatomical changes (random vs. systematic). For hypofractionation cases, such as stereotactic body radiation therapy, every effort should be made to achieve optimal dosimetry at each fraction, as there is limited opportunity to compensate for variations between fractions. Conversely, in normal fractionation, slight variations at specific fractions may be tolerated as long as the consistency of the variation does not extend across multiple fractions. In cases where palliative treatment or rapid tumor growth is involved, delivering treatment to control pain or tumor growth may take precedence over ideal coverage. Some random anatomy mismatches may be resolved through interventions such as increasing water intake to fill the bladder, emptying the rectum, or adjusting the patient’s posture. However, certain challenges may require a new treatment plan to address the issue adequately. In all situations, effective communication with other staff members and physicians is crucial to reach a comprehensive decision. A potential application of the technique is its use in online adaptation processes. The concept involves creating multiple backup plans based on knowledge gained from previous data and selecting the most suitable plan for each treatment day using this technique. This area represents a focus of our future study, aiming to enhance the adaptive capabilities of the workflow.
The proposed online evaluation framework offers flexible structures that can accommodate various sCT methods. In cases where multiple sCT generation methods are available, the framework can use QACT to identify the optimal model based on the treatment site. The framework consists of systematic components that can be improved individually to reduce the total uncertainty associated with online patient evaluation. This hierarchical structure enhances knowledge transparency, making the framework more credible and expediting the approval process for the benefits of patients.
The current work aims to develop an online evaluation framework that can be divided into manageable units to reduce uncertainty regarding accuracy and time. Efficiency analyses show that Monte Carlo dose calculation, which relies on GPU acceleration, accounts for roughly 33% of evaluation time. The dose calculation time depends on various factors such as proton spot numbers, beam energies, dose grid details, anatomy heterogeneities, and contour complexities. Meanwhile, the cCBCT and vCT generation each require approximately 19% evaluation time and deformable registrations (steps 3 and 5 in Figure 1) for these methods takes an additional 30% of evaluation time. To improve efficiency, deep learning-based sCT methods28,29 and auto-segmentation30–32 can be employed. Future research should focus on identifying the optimal parameters for treatment planning to accelerate Monte Carlo dose calculation. The state-of -the-art GPU development33,34 could be leveraged for the state-of -the-art deep learning frameworks,35 auto-contour, and material characterization to enhance the efficiency and efficacy of the framework.
5 |. CONCLUSIONS
This study presents the development of an online CBCT evaluation framework that is designed to identify the optimal sCT algorithms for different treatment sites and reduce the efficiency uncertainty in the evaluation process. The framework is structured to facilitate online adaptive radiotherapy and enable easy evaluation of newly developed sCT methods using onboard CBCT. Furthermore, the framework’s modular design allows for individual improvement of each component, and the proposed structure provides knowledge transparency, making it easier to review and verify the results. Overall, the framework shows promising results when used with the evaluating TPS, and it is anticipated that it will be ready for use in clinical settings in the near future.
ACKNOWLEDGMENTS
The research version RayStation 11B was provided by RaySearch Laboratory for evaluation purpose only.
Footnotes
CONFLICT OF INTEREST STATEMENT
The second and third author are employees of Ray-Search Laboratory. There is no financial or funding support from RaySearch Laboratory.
REFERENCES
- 1.van de Water TA, Lomax AJ, Bijl HP, et al. Potential benefits of scanned intensity-modulated proton therapy versus advanced photon therapy with regard to sparing of the salivary glands in oropharyngeal cancer. Int J Radiat Oncol Biol Phys 2011;79(4):1216–1224. [DOI] [PubMed] [Google Scholar]
- 2.Baumann M, Krause M, Overgaard J, et al. Radiation oncology in the era of precision medicine. Nat Rev Cancer. 2016;16(4):234–249. [DOI] [PubMed] [Google Scholar]
- 3.Baumann BC, Mitra N, Harton JG, et al. Comparative effectiveness of proton vs photon therapy as part of concurrent chemoradiotherapy for locally advanced cancer. JAMA Oncol 2020;6(2):237–246. [DOI] [PMC free article] [PubMed] [Google Scholar]
- 4.Thirion JP. Image matching as a diffusion process: an analogy with Maxwell’s demons. Med Image Anal 1998;2(3):243–260. [DOI] [PubMed] [Google Scholar]
- 5.Ashburner J, Friston KJ. Diffeomorphic registration using geodesic shooting and Gauss–Newton optimisation. Neuroimage. 2011;55(3):954–967. [DOI] [PMC free article] [PubMed] [Google Scholar]
- 6.Weistrand O, Svensson S. The ANACONDA algorithm for deformable image registration in radiotherapy. Med Phys 2015;42(1):40–53. [DOI] [PubMed] [Google Scholar]
- 7.Balakrishnan G, Zhao A, Sabuncu MR, Guttag J, Dalca AV. VoxelMorph: a learning framework for deformable medical image registration. IEEE Trans Med Imaging. 2019;38(8):1788–1800. [DOI] [PubMed] [Google Scholar]
- 8.Harms J, Lei Y, Wang T, et al. Paired cycle-GAN-based image correction for quantitative cone-beam computed tomography. Med Phys 2019;46(9):3998–4009. [DOI] [PMC free article] [PubMed] [Google Scholar]
- 9.Sun K, Simon S. FDRN: a fast deformable registration network for medical images. Med Phys 2021;48(10):6453–6463. [DOI] [PubMed] [Google Scholar]
- 10.Shan J, Feng H, Morales DH, et al. Virtual particle Monte Carlo: a new concept to avoid simulating secondary particles in proton therapy dose calculation. Med Phys 2022;49(10):6666–6683. [DOI] [PMC free article] [PubMed] [Google Scholar]
- 11.Chang C-W, Huang S, Harms J, et al. A standardized commissioning framework of Monte Carlo dose calculation algorithms for proton pencil beam scanning treatment planning systems. Med Phys 2020;47(4):1545–1557. [DOI] [PubMed] [Google Scholar]
- 12.Thing RS, Nilsson R, Andersson S, Berg M, Lund MD. Evaluation of CBCT based dose calculation in the thorax and pelvis using two generic algorithms. Physica Medica: Eur J Med Phys 2022;103:157–165. [DOI] [PubMed] [Google Scholar]
- 13.RayPhysics. RayStation 11B Reference Manual. RaySearch Laboratories AB; 2020. [Google Scholar]
- 14.Stanforth A, Lin L, Beitler JJ, et al. Onboard cone-beam CT-based replan evaluation for head and neck proton therapy. J Appl Clin Med Phys 2022;23(5):e13550. [DOI] [PMC free article] [PubMed] [Google Scholar]
- 15.Low DA, Harms WB, Mutic S, Purdy JA. A technique for the quantitative evaluation of dose distributions. Med Phys 1998;25(5):656–661. [DOI] [PubMed] [Google Scholar]
- 16.Hogstrom KR, Mills MD, Eyer JA, et al. Dosimetric evaluation of a pencil-beam algorithm for electrons employing a two-dimensional heterogeneity correction. Int J Radiat Oncol Biol Phys 1984;10(4):561–569. [DOI] [PubMed] [Google Scholar]
- 17.ICRU42. Use of Computers in External Beam Radiotherapy Procedures with High-Energy Photons and Electrons. ICRU Publication 42. 1987. [Google Scholar]
- 18.Niepel K, Kamp F, Kurz C, et al. Feasibility of 4DCBCT-based proton dose calculation: an ex vivo porcine lung phantom study. Zeitschrift für Medizinische Physik 2019;29(3):249–261. [DOI] [PubMed] [Google Scholar]
- 19.Hou J, Guerrero M, Chen W, D’Souza WD. Deformable planning CT to cone-beam CT image registration in head-and-neck cancer. Med Phys 2011;38(4):2088–2094. [DOI] [PubMed] [Google Scholar]
- 20.Nithiananthan S, Schafer S, Uneri A, et al. Demons deformable registration of CT and cone-beam CT using an iterative intensity matching approach. Med Phys 2011;38(4):1785–1798. [DOI] [PMC free article] [PubMed] [Google Scholar]
- 21.Zhen X, Gu X, Yan H, Zhou L, Jia X, Jiang SB. CT to cone-beam CT deformable registration with simultaneous intensity correction. Phys Med Biol 2012;57(21):6807. [DOI] [PMC free article] [PubMed] [Google Scholar]
- 22.Onozato Y, Kadoya N, Fujita Y, et al. Evaluation of on-board kV cone beam computed tomography–based dose calculation with deformable image registration using Hounsfield unit modifications. Int J Radiation Oncology*Biology*Physics. 2014;89(2):416–423. [DOI] [PubMed] [Google Scholar]
- 23.Amit G, Purdie TG. Automated planning of breast radiotherapy using cone beam CT imaging. Med Phys 2015;42(2):770–779. [DOI] [PubMed] [Google Scholar]
- 24.Fracchiolla F, Engwall E, Janson M, et al. Clinical validation of a GPU-based Monte Carlo dose engine of a commercial treatment planning system for pencil beam scanning proton therapy. Physica Med 2021;88:226–234. [DOI] [PubMed] [Google Scholar]
- 25.Zhang L, Wang Z, Shi C, Long T, Xu XG. The impact of robustness of deformable image registration on contour propagation and dose accumulation for head and neck adaptive radiotherapy. J Appl Clin Med Phys 2018;19(4):185–194. [DOI] [PMC free article] [PubMed] [Google Scholar]
- 26.Nenoff L, Matter M, Amaya EJ, et al. Dosimetric influence of deformable image registration uncertainties on propagated structures for online daily adaptive proton therapy of lung cancer patients. Radiother Oncol 2021;159:136–143. [DOI] [PubMed] [Google Scholar]
- 27.Landry G, Nijhuis R, Dedes G, et al. Investigating CT to CBCT image registration for head and neck proton therapy as a tool for daily dose recalculation. Med Phys 2015;42(3):1354–1366. [DOI] [PubMed] [Google Scholar]
- 28.Chen L, Liang X, Shen C, Jiang S, Wang J. Synthetic CT generation from CBCT images via deep learning. Med Phys 2020;47(3):1115–1125. [DOI] [PMC free article] [PubMed] [Google Scholar]
- 29.Chen L, Liang X, Shen C, Nguyen D, Jiang S, Wang J. Synthetic CT generation from CBCT images via unsupervised deep learning. Phys Med Biol 2021;66(11):115019. [DOI] [PubMed] [Google Scholar]
- 30.Lenchik L, Heacock L, Weaver AA, et al. Automated segmentation of tissues using CT and MRI: a systematic review. Acad Radiol 2019;26(12):1695–1706. [DOI] [PMC free article] [PubMed] [Google Scholar]
- 31.Pan S, Chang C-W, Wang T, et al. Abdomen CT multi-organ segmentation using token-based MLP-Mixer. Med Phys 2022;50(5):3027–3038. [DOI] [PMC free article] [PubMed] [Google Scholar]
- 32.Pan S, Lei Y, Wang T, et al. Male pelvic multi-organ segmentation using token-based transformer Vnet. Phys Med Biol 2022;67(20):205012. [DOI] [PMC free article] [PubMed] [Google Scholar]
- 33.Gajewski J, Garbacz M, Chang C-W, et al. Commissioning of GPU–accelerated Monte Carlo code FRED for clinical applications in proton therapy. Front Phys 2021;8. [Google Scholar]
- 34.Feng H, Patel SH, Wong WW, et al. GPU-accelerated Monte Carlo-based online adaptive proton therapy: a feasibility study. Med Phys 2022;49(6):3550–3563. [DOI] [PubMed] [Google Scholar]
- 35.Chang C-W, Dinh NT. Classification of machine learning frameworks for data-driven thermal fluid models. Int J Therm Sci 2019;135:559–579. [Google Scholar]