

Summary
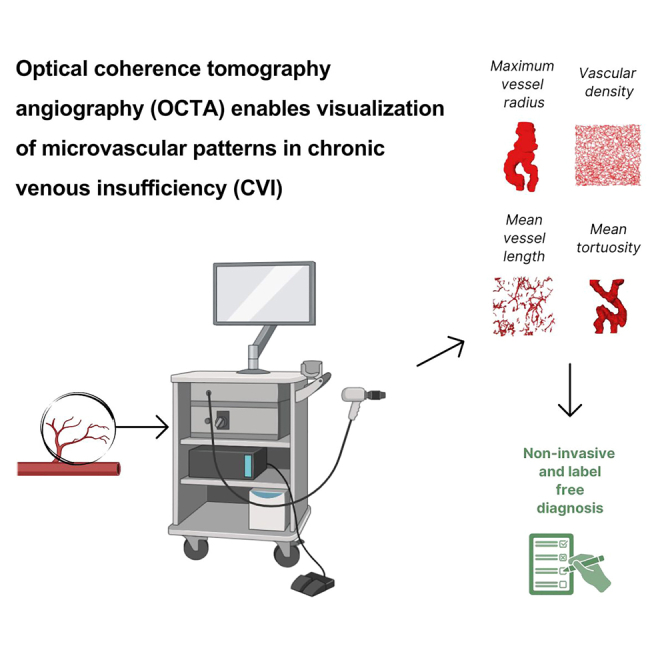
Chronic venous insufficiency (CVI) is a global health concern with significant public health and individual impact. Currently available diagnostic methods cannot visualize microvenous pathologies that have shown to result in severe forms of CVI and also affect the skin. Optical coherence tomography angiography (OCTA) may close the CVI diagnostic gap by providing a fast, label-free, and non-invasive solution to visualize cutaneous microvasculature. The study enlisted 66 subjects, including 53 CVI patients spanning all clinical-etiology-anatomic-pathophysiologic (CEAP) C stages and 13 healthy controls. The high spatial resolution OCTA system used was specifically designed for skin imaging. Significant microangiographic pattern variations emerged, both in qualitative and quantitative terms. OCTA provided valuable insights into cutaneous microvascular changes among different CVI stages. Thereby, OCTA may enable the selection of patient populations at risk for disease progression in the future.
Subject areas: Health sciences, Optical imaging, Vascular anatomy
Graphical abstract
Highlights
-
•
OCTA has been successfully used for CVI imaging
-
•
Results from a cohort of 66 patients show characteristic patterns in CVI patients
-
•
Quantitative analysis demonstrated a link between microvasculature patterns and CVI stages
-
•
OCTA offers clinicians and researchers a powerful tool to study microvasculature’s role in CVI
Health sciences; Optical imaging; Vascular anatomy
Introduction
Chronic venous insufficiency (CVI) ranks among the most common global health issues.1,2,3 For instance, varicose veins, a manifestation of CVI, were reported to be present in 50.5% of women and 30.1% of men in France.4 In Germany, the prevalence of reported symptoms increased from 45.4% for the 18–29 year old age group to 73.9% for the 70–79 year old age group.2 Therewith come the staggering costs dealing with the high prevalence of this disease. In the US alone, more than 3 billion USD per year was spent on CVI management.1
Early diagnosis, staging, and intervention are crucial to address these challenges. Currently, the clinical-etiology-anatomic-pathophysiologic (CEAP) system is the preferred classification to triage CVI’s severity, anatomic distribution, and etiology.5 The clinical CEAP stages range from C1-C6 and correspond to various lesion types observed in CVI. C1 stage includes telangiectasias, C2 involves varices, and C3 is associated with edema. Stages C4a and C4b encompass skin changes such as purpura jaune d’ocre and lipodermatosclerosis, respectively, while C5 refers to healed ulcers and C6 to active ulcers. Stages C2r and C6r refer to recurrent varicose veins and ulcers, respectively.5
Diagnostic procedures primarily encompass patient history, physical examination, and duplex ultrasound.6 However, evaluation of the involvement of the superficial cutaneous microvasculature remains an under-researched territory. CVI involves a complex interplay between valvular incompetence and venous hypertension. While the exact sequence of events leading to CVI can vary, evidence suggests that valvular incompetence often precedes and contributes to the development of venous hypertension.7 Persistently elevated venous hydrostatic pressure can in the end lead to lower extremity pain, edema, and changes in the structure of microvasculature, which is termed as venous hypertensive microangiopathy (VHM).8 VHM is characterized by capillary enlargement and increased capillary permeability. As the conditions progress, microcirculation disturbances and dermal weakening finally lead to skin changes and the formation of ulcers.9
Valvular dysfunction can extend to veins as small as 100 μm in diameter, which has shed light on the etiology of skin alterations in individuals with minor insufficiency and vice versa. The spatial configuration and alignment of microvascular valves (MVVs) suggest their pivotal role in averting blood reflux within small veins and preventing retrograde flow from postcapillary venules into the capillary bed, thus exerting substantial influence on venous hemodynamics. This suggests that MVVs play a crucial role in determining susceptibility to cutaneous manifestations.8
Despite VHM’s pivotal role in CVI and ulcer development, existing diagnostic tools in dermatology, such as duplex ultrasound, cannot visualize the structural changes necessary for assessing VHM. Optical coherence tomography angiography (OCTA) is proposed as a solution, offering a fast, label-free, non-invasive, high-resolution, and volumetric imaging approach for investigating cutaneous microvasculature. Briefly speaking, OCTA relies on scanning the sample arm beam over the same region of the sample repeatedly. Because blood flow perturbs the backreflection of the sample arm beam whereas static tissue does not, by properly setting a threshold of signal variation, either in terms of intensity or phase, the distribution of blood vessels can be mapped in 3D. This technique was originally developed as a functional extension of optical coherence tomography (OCT), and has found clinical success in ophthalmology for high-resolution, label-free retinal blood vessel imaging.10 Inspired by the success of OCTA in ophthalmology, increasing efforts are being made using OCTA in dermatology.11 Thus far, OCTA has been shown to image basal cell carcinoma,12 surgical scars, nevus araneus,13 Bowen’s disease, melanoma, actinic keratosis, and scleroderma, etc.14,15 Applied to image the lower extremities, venous leg ulcers were studied using OCTA by analyzing the blood vessels from the peri-wound skin.16 After analyzing the vessel morphologies, it was indicated that OCTA can serve as a potential tool for venous leg ulcer monitoring.17 Despite the growing applications and demonstrations of OCTA in dermatology, its use for imaging CVI remains poorly investigated. In this work, we demonstrate a homemade OCTA device and its translational application in CVI imaging.
Results
The study included a total of 66 participants, comprising 53 patients diagnosed with CVI and 13 healthy control subjects. Three CVI patients were excluded from the imaging analysis due to uncorrectable motion artifacts and poor image quality, resulting in a final eligible sample size of 63 subjects. For these eligible subjects, a total of 283 OCTA volumes were acquired. Out of the 63 eligible subjects, 10 had a different CEAP classification for each leg, leading to an increase of the total number of analyzed cases equal to 73. Since hair can negatively impact image quality by scattering and absorbing the OCTA signal, the imaging area was shaved whenever possible. Table 1 shows the detailed information about the number of cases for each stage and the corresponding number of OCTA volumes. The age of the participants ranged from 18 to 90 years. The gender distribution was balanced, with 32 male and 31 female subjects.
Table 1.
The study was approved by the Ethics Committee of the Medical
| CEAP classification | Number of cases | Number of OCTA acquisitions |
|---|---|---|
| C0 | 13 | 30 |
| C1 | 4 | 15 |
| C2 | 13 | 54 |
| C3 | 13 | 67 |
| C4a | 7 | 32 |
| C4b | 4 | 15 |
| C4c | 6 | 25 |
| C5 | 4 | 12 |
| C6 | 9 | 33 |
| TOTAL | 73 | 283 |
OCTA pattern analysis
Qualitative analysis revealed significant variations in microangiographic patterns. Healthy skin exhibited a uniform vasculature (Figure 1A). Telangiectasias were characterized by large, convoluted vessels whereas vessels in its periphery appeared to be unaffected (Figure 1B). For large varicose veins, since they were distributed beyond the imaging depth of OCTA, no specific vascular pattern could be observed (Figure 1C). It is evident that vessels in areas of purpura jaune d’ocre and lipodermatosclerosis tend to be broken and tortuous (Figure 1D and 1E). Poorly vascularized patches supplied by a few convoluted vessels could be observed. For corona phlebectatica, serpiginous and thick vessels were the most prominent feature (Figure 1F).
Figure 1.

OCTA volumes of CEAP C0-C4 showing distinct microvascular patterns
Depth-color-coded en face images of (A) three individuals with healthy skin, (B) three individuals with telangiectasias, (C) three individuals with varices, (D) three individuals with purpura jaune d’ocre, (E) three individuals with lipodermatosclerosis, and (F) three individuals with corona phlebectatica. Each OCTA en face image corresponds to the squared region on the photo of the patient’s lower extremity. Scale bar represents 1 mm.
It can be noticed that active ulcers showed dense glomerulus vessels in the lesion borders whereas healed ulcers had a dense vascular network composed of thin vessels (Figure 2). Note that for Figures 1 and 2, each photo and its corresponding OCTA image represent a different subject. Figure 3 shows our efforts to track vessel pattern changes at varying distances to the lesion region. For patients who had venous leg ulcers (C6 stage), imaging was conducted at varying distances from the ulcer, revealing denser, dot-like vasculature at the periphery of the ulcer and sparser, tortuous vessels at locations further away from the lesion.
Figure 2.

OCTA volumes of skin at the border of healed and active venous leg ulcers
Depth-color-coded OCTA en face images showing the cutaneous microvasculature at the border of (A) three individuals with healed venous leg ulcers and (B) three individuals with active ulcers. Each OCTA en face image corresponds to the squared region on the photo of the patient’s lower extremity. Scale bar represents 1 mm.
Figure 3.

OCTA volumes of venous leg ulcers showing distinct microvascular patterns
Depth-color-coded OCTA en face images showing locations at varying distances from the lesion of venous leg ulcers. Each OCTA en face image corresponds to the squared region on the photo of the patient’s lower extremity. Scale bar represents 1 mm.
Quantitative analysis of OCTA volumes
As described in the STAR Methods section, four parameters were extracted from every OCTA volume. While the vessel radii of healthy subjects were 155.16 ± 50.54 μm, telangiectasias and corona phlebectatica exhibited significantly larger vessel radii, which were 276.89 ± 91.97 μm and 275.61 ± 71.09 μm, respectively (two sample t test, p < 0.01) (Figure 4A). In general, the higher the CVI stages are, the shorter the vessels become, which is explainable if we consider that we noticed a reduction in capillary density for higher stages. However, an augmentation in vascular density was observed in venous leg ulcers (two sample t test, p < 0.01) (Figure 4B). The more fragmented vascular networks in varices and purpura jaune d’ocre had vessels of medium length of 360.32 ± 30.86 μm and 367.72 ± 37.12 μm while the mean vessel length in the control group was 385.16 ± 35.87 μm (two sample t test, p < 0.01 and p < 0.02) (Figure 4C). By definition, the inflection count metric (ICM) is a dimensionless number, which provides information about the tortuosity of a curve. We can observe that tortuosity increased with CVI severity (Figure 4D). Knowing that for a straight line, the ICM is 1, the mean ICM for purpura jaune d’ocre was 27.56 ± 9.51 as well as 28.89 ± 7.8 for corona phlebectatica, 28.98 ± 7.72 for lipodermatosclerosis, and 34.00 ± 15.18 for venous leg ulcers. Those values were compared to the mean ICM of the healthy control group (24.15 ± 6.43) (two sample t test, p < 0.04). To better illustrate our findings, videos showing the 3D renderings of the blood vessels in different CEAP C stages are available in the supplementary material. The videos also show the radii of the vessels in the OCTA volumes using a heatmap (Videos S1, S2, S3, S4, S5, S6, S7, and S8).
Figure 4.

Quantitative analysis of OCTA volumes
(A) maximum vessel radius, (B) vascular density, (C) mean vessel length, (D) mean inflection count metric measuring vessel tortuosity. Each box of the boxplot displays the median at its center, whereas its lower and upper boundaries represent the 25th and 75th percentiles. Extended from the box are whiskers that reach the maximum and minimum values of the distribution. Only the statistically significant CVI stages for each extracted parameter are reported and considered in the quantitative analysis. ∗ = statistically significant (two-sample t test).
Discussion
CVI poses a global health concern, imposing substantial burdens on both public health and affected individuals. Dysfunction of venous valves and venous hypertension manifest in vessels as small as 100 μm, eluding detection by the conventional gold standard—duplex sonography. Numerous patients exhibit cutaneous alterations indicative of venous insufficiency, even without signs of substantial truncal venous insufficiency. Consequently, we hypothesize that these patients predominantly experience micro-venous hypertension or insufficiency. Addressing this diagnostic gap, OCTA emerges as a valuable tool for visualizing microvascular pathologies, particularly in such cases. By employing OCTA, we aim to discern and classify patients with microvascular insufficiency, identifying those at risk of skin changes and potential ulcer development. This, in turn, lays the groundwork for initiating early interventions in patient at risk.
From the OCTA and quantitative analysis results, distinct microvascular patterns emerged, which correspond to specific skin manifestations related to CVI. From a descriptive perspective, the imaging results clearly show that telangiectasias presents larger and convoluted vessels whereas vessels in its periphery appeared to be unaffected, while corona phlebectatica bears densely packed tortuous, thick vessels. The quantitative analysis confirms the qualitative observations. Both telangiectasias and corona phlebectatica presented markedly increased vessel diameters compared with those in healthy controls. The higher the CVI stages were, the more the length of the vessels decreased and the more fragmented the vascular network became, which is explainable if we consider the reduction in capillary density from stage C0 to C5. This is consistent with the findings using video-capillaroscopy.18 In venous leg ulcers, a significant increase in vascular density could be observed. Additionally, tortuosity gradually increased from C4 to C6.
This study’s findings revealed a significant disparity in both vessel morphology and density when comparing wound edges to healthy skin. Wound edges exhibited dense clusters of glomuleri-like vessels, while linear branching vessels were notably absent. These vessel configurations are acknowledged to be linked with tissue growth processes.16 Additionally, it has been shown that vascular endothelial growth factor (VEGF) expression is markedly higher in venous leg ulcers than in healthy skin, indicating increased angiogenesis.19 Importantly, venous hypervolemia could serve as the primary driving force behind the emergence of venous hypoxia, consequently leading to microvascular ischemia and a subsequent increase in angiogenesis.9 It is suggested that the rise in vascular density could be a compensatory response to impaired venous return, aiming to ensure tissue oxygenation. This finding is in line with studies that highlight the adaptive remodeling of microvasculature under chronic hemodynamic stress.20
Throughout the study, no adverse event was reported by the participants, proving that OCTA can be well-tolerated by all age groups. Because OCTA is a non-invasive and label-free imaging method, the patients feel nothing more than a glass slide touching the skin during the imaging session. The infrared wavelength used in the OCTA system causes no temperature changes in tissue and no side effect has ever been reported. Featuring a few hundred kHz sweep rate, one volume scan takes less than 10 s. Although positioning the probe and storing the data may take some time, the actual volume acquisition time is relatively short, therefore, there is no need for prolonged waiting time during which the patient must be stationary. Ideally, the complete procedure from disinfection, patient briefing, probe positioning, and patient discharge only takes a few minutes.
In this study, the analysis was done in a parametric and quantitative manner. In recent years, however, we can see that artificial intelligence has been widely studied for OCTA, mostly in ophthalmology.21,22,23 With continuous recruitment of CVI patients, our research will be naturally a good fit to explore deep learning in the automatic analysis of OCTA volumes acquired for dermatology applications as well.
In summary, OCTA offers high-resolution imaging that can enhance our understanding of microvascular changes in CVI, facilitate early diagnosis through non-invasive assessment of vascular structures, and enable precise monitoring of disease progression and treatment response. These capabilities highlight the significant promise of OCTA for advancing both research and clinical management of CVI.
Conclusion
This study provides valuable insights into cutaneous microvascular changes in CVI patients using OCTA. Distinct vascular patterns across different CEAP C stages are observed and quantitatively evaluated, thereby enhancing our grasp of microvascular involvement in CVI. In the future, OCTA can be used to identify patient populations that are at the risk of CVI progression into higher stages. This identification can further serve as a guidance for treatment strategies that can potentially prevent skin ulceration.
Limitations of study
Knowing that a large proportion of CVI patients are elderly and are either housebound or living in care homes, making the OCTA device portable, robust, and not too expensive is the priority of future development of this technique. In Figure 1, it is noticeable that the scanning head is still relatively bulky and heavy. A more compact design using state-of-the-art structured 3D printing technology and small aperture optical components can significantly reduce the size and weight of the probe for clinicians to operate the device much more easily. The other parts of the OCTA system, using photonic integrated circuits, may also have a much-reduced size along with a potential reduction in unit price.24 Another direction we can go is to employ high-speed sources featuring several MHz A-line rate25 so that the image acquisition time can be reduced to 1 s. Finally, a portable, robust, fast, and less expensive OCTA device with a handheld probe can be envisaged, capable of scanning 1 cm2 in just 1 s, therefore making OCTA scan into the CVI clinical workflow.
Resource availability
Lead contact
Further information and requests for resources and information should be directed to and will be fulfilled by Mengyang Liu, mengyang.liu@meduniwien.ac.at.
Materials availability
There are restrictions to the availability of the OCT system used in this study due to medical device regulations and ethics protocols.
Data and code availability
-
•
OCTA raw data reported in this paper will be shared by the lead contact upon request.
-
•
This paper does not report original code.
-
•
Any additional information required to reanalyze the data reported in this paper is available from the lead contact upon request.
Acknowledgments
This research is funded by the H2020-ICT-2020-2 project REAP with grant agreement ID 101016964. It is also funded by the Φocus XL grant MUSE and Φocus M grant COCTAIL by the Center for Medical Physics and Biomedical Engineering at the Medical University of Vienna. M.L. is funded by the H2020-MSCA-IF-2019 project SkinOptima with grant agreement ID 894325. B.W. and J.D.were supported by the Austrian Science Fund (P30615) and the Vienna Science and Technology Fund (LS18-080).
Author contributions
Conceptualization, M.L., B.W., W.D., K.M.M. and R.L.; methodology, M.L., J.D., and B.W.; software, G.R. and L.B.; formal analysis, G.R., J.D., and K.M.M.; resources, M.L. and B.W.; data curation, J.D., G.R., L.K., V.H., R.H., and C.S.; writing—original draft, G.R. and J.D.; writing—review and editing, M.L. and R.L.; visualization, G.R., L.K., and L.B.; supervision, B.W., M.L., K.M.M., and L.S.; project administration, M.L. and W.D.; funding acquisition, W.D., B.W., and M.L.
Declaration of interests
The authors declare no competing interests.
STAR★Methods
Key resources table
| REAGENT or RESOURCE | SOURCE | IDENTIFIER |
|---|---|---|
| Software and algorithms | ||
| MATLAB (R2022a) | Mathworks Inc., US | |
| Amira (2020) | Thermo Fisher Scientific Inc., US | |
| Other | ||
| OCT System | ||
Experimental model and study participant details
Patients with CVI across all CEAP C stages (C1-6) were recruited at the Department of Dermatology at the Medical University of Vienna. For statistical purposes, stages C2 and C2r were combined into one group, and stages C6 and C6r were combined into another group. To ensure a comprehensive evaluation, each patient underwent a physical examination and venous duplex ultrasound of both legs. Subsequently, OCTA imaging was performed on various positions of the lower extremities.
Ethics approval
The study was approved by the Ethics Committee of the Medical University of Vienna with the approval number 1246/2013. Informed consent was obtained from all participants, who were also insured for this study by Zürich Versicherungs-Aktiengesellschaft with the policy number 07229622-2.
Method details
The study was conducted at the Department of Dermatology and at the Center for Medical Physics and Biomedical Engineering at the Medical University of Vienna and adhered to ethical guidelines, including approval from the Ethics Committee of the Medical University of Vienna and adherence to the Declaration of Helsinki.26 Informed consent was obtained from all participants.
OCTA imaging
The detailed working principles of the homemade OCTA system have been described in our previous works.27,28,29 The schematic of the system is given in Figures S1A and S1C in the supplementary material. In brief, an akinetic swept source (SS-OCT-1310, Insight Photonic Solutions, US) at 1310 nm with 29 nm bandwidth was used as the OCT source. The output from the swept source goes through a fiber coupler (TW1300R5A2, Thorlabs, US) and is split into the reference arm and the sample arm. Each arm goes through a circulator (CIR1310-APC, Thorlabs, US) before getting backreflected. The interference takes place in a second fiber coupler of the same model and is then captured using a dual balanced detector (BPD-1, Insight Photonic Solutions, US). Using a sweep rate of 222.22 kHz, one volume covering 10 mm (length) × 10 mm (width) × 1.3 mm (depth) could be scanned in less than 10 s. Each B-scan has 512 A-lines and each volume has 512 B-scans. The lateral resolution was measured to be 19.5 μm and the axial resolution of 13.7 μm in air was obtained, which corresponds to 9.8 μm in tissue taking 1.4 as the refractive index for soft tissues.
A customized probe was designed for this study to adapt the OCTA system for lower extremity imaging. It can translate in three orthogonal directions and rotate around two reference axes, bestowing it 5 degrees of freedom. For each imaging session, the probe could be precisely positioned to the selected region of interest on the subjects’ lower extremity. Moreover, the probe included an integrated glass holder to interface the subject’s skin to a 1 mm glass slide. The transparent glass slide enabled the undisturbed optical beam propagation. It also allowed for easy disinfection before each imaging session and could be disposed of after each imaging session. A drop of distilled water was used between the glass slide and skin for refractive index matching. A video that visually describes the probe design is available in the supplementary material. To ensure the large field of view, a scan lens (LSM54-1310, Thorlabs, US) was used in combination with a conjugated scanning system enabled by a pair of concave mirrors (CM508-050-P01, Thorlabs, US) and an XY scanning system (Saturn 9B, ScannerMax, US). For visual effect, Figure S1B in the supplementary material set the probe cover to be transparent. However, for the real setup, after optical alignment is achieved, the whole probe is covered in opaque plastic housing for safety reasons as shown in Figure S1A in the supplementary material. The patient would wear a pair of suitable laser safety goggles throughout the imaging session. In most cases, patients would lie in a patient bed for imaging. Depending on the exact location, the probe could also be used when the patient would sit in a chair. Figure S1B in the supplementary material is a visual rendering of lower extremity imaging using the probe and Figure S1D in the supplementary material illustrates how the OCT sample arm is scanned over the skin.
Data processing
The intensity-based algorithm proposed by Huang et al.30 was coded in MATLAB (R2022a, Mathworks Inc., US) to reconstruct the vasculature from the OCT images. In particular, 4 subsequent OCT B-scans were performed at the exact same position. The OCTA algorithm then checked the intensity variations within the 4 scans. Because blood flow was the major contributor to the intensity changes, by sifting out the pixels with above-threshold variations, we then mapped the distribution of microvasculature in 3D. To further improve the image quality, we used pixel intensity normalization on each B-scan to suppress the line artifacts from the en face OCTA images. Indeed, patient’s motion during the imaging session and the OCT system’s source power instability, might lead to a variation of the mean pixel intensity of the different B-scans acquired. By normalizing between 0 and 1 the pixel values of each B-scan, the whole OCTA volumes are standardized. Shadow artifacts were mitigated by the implementation of a step-down exponential filtering method.31 A 3D median filter was then applied to smooth the image and finally we boosted the image contrast. Median intensity projection was utilized for en face image generation, being less sensitive to extreme values caused by noise or artifacts in respect to a maximum intensity projection. Finally, to enable easier interpretation of the OCTA volumes, depth color coding was used to represent depth information in 2D OCTA en face projections. The processing steps are demonstrated in Figure S2 in the supplementary material.
Feature extraction
Representative parameters were extracted from the OCTA resolved vascular networks. The detailed feature extraction procedure is.
3D semi-automatic segmentation of the volumes
Segmenting the blood vessels from the OCTA volumes is critical for meaningful analysis. We developed a CVI specific workflow in Amira (Amira 2020, Thermo Fisher Scientific Inc., US) to perform the segmentation task. A controlled global threshold was applied prior to the application of an adaptive filter. The segmentation was finally achieved by removing small and disconnected objects, smoothing the segmented vessels, and manually removing unresolved artifacts.
Skeletonization of the vascular network
In this step, the mask obtained in the segmentation step was further refined by reducing blood vessel structures to their essential one-pixel-wide representations. The skeletonization process was performed using a 3D medial axis thinning algorithm32 integrated in a MATLAB function.
Parameter extraction
This is the final step, in which the representative parameters were calculated. MATLAB coding, together with Amira tools, enabled us to automatically calculate the maximum vessel radii, the vascular density, the mean length of segments and the mean inflection count metric (ICM) which is an index of vessel tortuosity.12,23
Details on the computation of vessel parameters are provided below.
Maximum vessel radii
In some of the acquired OCTA volumes, we observed significantly thicker vessels. This suggests that the vessel with the maximum radius could potentially serve as a distinctive feature for identifying these particular volumes. First of all, the perimeters of the objects in the segmented mask were extracted. Then, the vessel radii were extracted by computing the geodesic distance transform33 using a quasi-Euclidean distance metric, given the perimeter pixels and the skeleton pixels. The maximum value found in the entire volume represents the quantitative information of the thickest vessel.
Vascular density
The vascular density refers to the amount of blood vessels within a specific area of tissue. For this work, the numerical value was assessed by dividing the number of pixels belonging to the skeletonized volume by the total number of pixels in the volume.
Mean length
For each object of the volume, each vessel branch was considered separately. The lengths of each vessel branch’s line were calculated and the mean value was resolved.
Mean ICM
The mean ICM34 provides information about the tortuosity of a curve. It quantifies the number of inflection points within a curve. An inflection point within a three-dimensional space along a given curve signifies a moment when the curve changes from being concave in one direction to concave in the opposite direction. Specifically, when passing through an inflection point, the orientation of the Normal and Binormal axes in the Frenet frame shifts by nearly 180°. The Frenet frame itself is an orthonormal basis in three-dimensional Euclidean space, formed by combining the unit vectors for the tangent (T), normal (N), and binormal (B). At every point along the curve’s skeleton, there is a unique Frenet frame. The inflection count metric focuses on the behavior of the normal vector. At an inflection point, the A vector becomes null, rendering the N vector undefined at that precise location. In fact, the orientations of the N vector immediately before and after the inflection point are nearly diametrically opposed.
To quantify this, we introduce ΔN, which represents the difference between two consecutive normal vectors. ΔN·ΔN attains its maximum values precisely at the inflection points. In mathematical terms, inflection points are located where the function ΔN·ΔN reaches its maxima. However, our interest lies not in pinpointing the location of these inflection points, but rather in determining their quantity along each vessel path. This is why we calculate the ICM as follows:
| (Equation 1) |
where Ninf is the number of inflection points obtained as the maxima in the function ΔN·ΔN, and the distance metric (DM) is the ratio between the actual vessel length and the linear distance between its endpoints. The addition of 1 to the value of Ninf is introduced to avoid a null value of ICM in case of a vessel that follows a large arc with no inflection points. Knowing that for a straight line the DM is 1, and that ICM will consistently be a multiple of the DM, we can interpret its values accordingly. The ICM of each vessel branch’s line were calculated and the mean value was resolved.
Data analysis
Obtained OCTA volumes were classified based on the clinical manifestation of CVI observed within the field of view during each imaging session. We identified seven distinct groups based on CVI associated skin changes, which included healthy skin, telangiectasias, varicose veins, purpura jaune d’ocre, lipodermatosclerosis, corona phlebectatica, and venous leg ulcers.
Quantification and statistical analysis
We again used MATLAB for statistical analysis. A one-sample Kolmogorov-Smirnov test was performed for normal distribution test. For statistical comparisons between the quantitative parameters obtained on specific CVI stages and healthy subjects, two-sample t-tests were applied for continuous variables if the distribution was found to be normal, and the Wilcoxon rank-sum test if not. p-values <0.05 were considered as statistically significant and p-values <0.01 were considered as statistically highly significant. Results are given as mean (± standard deviation) if not otherwise indicated.
Published: September 20, 2024
Footnotes
Supplemental information can be found online at https://doi.org/10.1016/j.isci.2024.110998.
Supplemental information
References
- 1.Kim Y., Png C.Y.M., Sumpio B.J., DeCarlo C.S., Dua A. Defining the human and health care costs of chronic venous insufficiency. Semin. Vasc. Surg. 2021;34:59–64. doi: 10.1053/j.semvascsurg.2021.02.007. [DOI] [PubMed] [Google Scholar]
- 2.Wrona M., Jöckel K.H., Pannier F., Bock E., Hoffmann B., Rabe E. Association of venous disorders with leg symptoms: Results from the Bonn vein study 1. Eur. J. Vasc. Endovasc. Surg. 2015;50:360–367. doi: 10.1016/j.ejvs.2015.05.013. [DOI] [PubMed] [Google Scholar]
- 3.Robertson L., Evans C., Fowkes F.G.R. Epidemiology of chronic venous disease. Phlebology. 2008;23:103–111. doi: 10.1258/phleb.2007.007061. [DOI] [PubMed] [Google Scholar]
- 4.Carpentier P.H., Maricq H.R., Biro C., Ponçot-Makinen C.O., Franco A. Prevalence, risk factors, and clinical patterns of chronic venous disorders of lower limbs: A population-based study in France. J. Vasc. Surg. 2004;40:650–659. doi: 10.1016/j.jvs.2004.07.025. [DOI] [PubMed] [Google Scholar]
- 5.Lurie F., Passman M., Meisner M., Dalsing M., Masuda E., Welch H., Bush R.L., Blebea J., Carpentier P.H., De Maeseneer M., et al. The 2020 update of the CEAP classification system and reporting standards. J. Vasc. Surg. Venous Lymphat. Disord. 2020;8:342–352. doi: 10.1016/j.jvsv.2019.12.075. [DOI] [PubMed] [Google Scholar]
- 6.Gloviczki P., Comerota A.J., Dalsing M.C., Eklof B.G., Gillespie D.L., Gloviczki M.L., Lohr J.M., McLafferty R.B., Meissner M.H., Murad M.H., et al. The care of patients with varicose veins and associated chronic venous diseases: Clinical practice guidelines of the Society for Vascular Surgery and the American Venous Forum. J. Vasc. Surg. 2011;53:2S–48S. doi: 10.1016/j.jvs.2011.01.079. [DOI] [PubMed] [Google Scholar]
- 7.Santler B., Goerge T. Chronic venous insufficiency – a review of pathophysiology, diagnosis, and treatment. JDDG J. der Deutschen Dermatol. Gesellschaft. 2017;15:538–556. doi: 10.1111/ddg.13242. [DOI] [PubMed] [Google Scholar]
- 8.Caggiati A., Phillips M., Lametschwandtner A., Allegra C. Valves in small veins and venules. Eur. J. Vasc. Endovasc. Surg. 2006;32:447–452. doi: 10.1016/j.ejvs.2006.04.021. [DOI] [PubMed] [Google Scholar]
- 9.Mutlak O., Aslam M., Standfield N.J. Chronic venous insufficiency: A new concept to understand pathophysiology at the microvascular level - a pilot study. Perfusion. 2019;34:84–89. doi: 10.1177/0267659118791682. [DOI] [PubMed] [Google Scholar]
- 10.Spaide R.F., Fujimoto J.G., Waheed N.K., Sadda S.R., Staurenghi G. Optical coherence tomography angiography. Prog. Retin. Eye Res. 2018;64:1–55. doi: 10.1016/j.preteyeres.2017.11.003. [DOI] [PMC free article] [PubMed] [Google Scholar]
- 11.Liu M., Drexler W. Optical coherence tomography angiography and photoacoustic imaging in dermatology. Photochem. Photobiol. Sci. 2019;18:945–962. doi: 10.1039/c8pp00471d. [DOI] [PubMed] [Google Scholar]
- 12.Meiburger K.M., Chen Z., Sinz C., Hoover E., Minneman M., Ensher J., Kittler H., Leitgeb R.A., Drexler W., Liu M. Automatic skin lesion area determination of basal cell carcinoma using optical coherence tomography angiography and a skeletonization approach: Preliminary results. J. Biophot. 2019;12 doi: 10.1002/jbio.201900131. [DOI] [PMC free article] [PubMed] [Google Scholar]
- 13.Zabihian B., Weingast J., Liu M., Zhang E., Beard P., Pehamberger H., Drexler W., Hermann B. In vivo dual-modality photoacoustic and optical coherence tomography imaging of human dermatological pathologies. Biomed. Opt Express. 2015;6:3163–3178. doi: 10.1364/BOE.6.003163. [DOI] [PMC free article] [PubMed] [Google Scholar]
- 14.Schuh S., Holmes J., Ulrich M., Themstrup L., Jemec G.B.E., De Carvalho N., Pellacani G., Welzel J. Imaging blood vessel morphology in skin: dynamic optical coherence tomography as a novel potential diagnostic tool in dermatology. Dermatol. Ther. 2017;7:187–202. doi: 10.1007/s13555-017-0175-4. [DOI] [PMC free article] [PubMed] [Google Scholar]
- 15.Perwein M.K.E., Welzel J., De Carvalho N., Pellacani G., Schuh S. Dynamic optical coherence tomography: A non-invasive imaging tool for the distinction of nevi and melanomas. Cancers. 2022;15:20. doi: 10.3390/cancers15010020. [DOI] [PMC free article] [PubMed] [Google Scholar]
- 16.Holmes J., Schuh S., Bowling F.L., Mani R., Welzel J. Dynamic optical coherence tomography is a new technique for imaging skin around lower extremity wounds. Int. J. Low. Extrem. Wounds. 2019;18:65–74. doi: 10.1177/1534734618821015. [DOI] [PubMed] [Google Scholar]
- 17.Mani R., Holmes J., Rerkasem K., Papanas N. Blood vessel density measured using dynamic optical coherence tomography is a tool for wound healers. Int. J. Low. Extrem. Wounds. 2023;22:235–240. doi: 10.1177/15347346211017334. [DOI] [PubMed] [Google Scholar]
- 18.Carpentier P.H., Trolliet C., Cornu-Thénard A., Chamberod R., Laurès J., Noilhetas J., Chauvin E. Video-capillaroscopy, a promising tool for the clinical evaluation of patients with chronic venous insufficiency. Front. Med. 2023;10 doi: 10.3389/fmed.2023.1144102. [DOI] [PMC free article] [PubMed] [Google Scholar]
- 19.Kolano P., Bednarski I.A., Lesiak A., Skibińska M., Stasikowska-Kanicka O., Danilewicz M., Narbutt J. Overexpression of cathepsin K and vascular endothelial growth factor in chronic venous ulcerations. Postepy Dermatol. Alergol. 2020;37:234–239. doi: 10.5114/ada.2020.94840. [DOI] [PMC free article] [PubMed] [Google Scholar]
- 20.Santamaría R., González-Álvarez M., Delgado R., Esteban S., Arroyo A.G. Remodeling of the microvasculature: May the blood flow be with you. Front. Physiol. 2020;11 doi: 10.3389/fphys.2020.586852. [DOI] [PMC free article] [PubMed] [Google Scholar]
- 21.Alexopoulos P., Madu C., Wollstein G., Schuman J.S. The development and clinical application of innovative optical ophthalmic imaging techniques. Front. Med. 2022;9 doi: 10.3389/fmed.2022.891369. [DOI] [PMC free article] [PubMed] [Google Scholar]
- 22.Sampson D.M., Dubis A.M., Chen F.K., Zawadzki R.J., Sampson D.D. Towards standardizing retinal optical coherence tomography angiography: A review. Light Sci. Appl. 2022;11:63. doi: 10.1038/s41377-022-00740-9. [DOI] [PMC free article] [PubMed] [Google Scholar]
- 23.Meiburger K.M., Salvi M., Rotunno G., Drexler W., Liu M. Automatic segmentation and classification methods using optical coherence tomography angiography (OCTA): A review and handbook. Appl. Sci. 2021;11:9734. [Google Scholar]
- 24.Rank E.A., Sentosa R., Harper D.J., Salas M., Gaugutz A., Seyringer D., Nevlacsil S., Maese-Novo A., Eggeling M., Muellner P., et al. Toward optical coherence tomography on a chip: in vivo three-dimensional human retinal imaging using photonic integrated circuit-based arrayed waveguide gratings. Light Sci. Appl. 2021;10:6. doi: 10.1038/s41377-020-00450-0. [DOI] [PMC free article] [PubMed] [Google Scholar]
- 25.Niederleithner M., Sisternes L., Stino H., Sedova A., Schlegl T., Bagherinia H., Britten A., Matten P., Schmidt-Erfurth U., Pollreisz A., Drexler W. Ultra-widefield OCT angiography. IEEE Trans. Med. Imag. 2022;42:1009–1020. doi: 10.1109/TMI.2022.3222638. [DOI] [PubMed] [Google Scholar]
- 26.Association W.M. World medical association declaration of Helsinki: Ethical principles for medical research involving human subjects. JAMA. 2013;310:2191–2194. doi: 10.1001/jama.2013.281053. [DOI] [PubMed] [Google Scholar]
- 27.Veselka L., Krainz L., Mindrinos L., Drexler W., Elbau P. A quantitative model for optical coherence tomography. Sensors. 2021;21:6864. doi: 10.3390/s21206864. [DOI] [PMC free article] [PubMed] [Google Scholar]
- 28.Chen Z., Rank E., Meiburger K.M., Sinz C., Hodul A., Zhang E., Hoover E., Minneman M., Ensher J., Beard P.C., et al. Non-invasive multimodal optical coherence and photoacoustic tomography for human skin imaging. Sci. Rep. 2017;7 doi: 10.1038/s41598-017-18331-9. [DOI] [PMC free article] [PubMed] [Google Scholar]
- 29.Chen Z., Liu M., Minneman M., Ginner L., Hoover E., Sattmann H., Bonesi M., Drexler W., Leitgeb R.A. Phase-stable swept source OCT angiography in human skin using an akinetic source. Biomed. Opt Express. 2016;7:3032–3048. doi: 10.1364/BOE.7.003032. [DOI] [PMC free article] [PubMed] [Google Scholar]
- 30.Huang Y., Zhang Q., Thorell M.R., An L., Durbin M.K., Laron M., Sharma U., Gregori G., Rosenfeld P.J., Wang R.K. Swept-source OCT angiography of the retinal vasculature using intensity differentiation-based optical microangiography algorithms. Ophthalmic Surg. Lasers Imaging Retina. 2014;45:382–389. doi: 10.3928/23258160-20140909-08. [DOI] [PMC free article] [PubMed] [Google Scholar]
- 31.Mahmud M.S., Cadotte D.W., Vuong B., Sun C., Luk T.W.H., Mariampillai A., Yang V.X.D. Review of speckle and phase variance optical coherence tomography to visualize microvascular networks. J. Biomed. Opt. 2013;18 doi: 10.1117/1.JBO.18.5.050901. [DOI] [PubMed] [Google Scholar]
- 32.Lee T.-C., Kashyap R.L., Chu C.-N. Building skeleton models via 3-D medial surface/axis thinning algorithms. CVGIP Graph. Models Image Process. 1994;56:462–478. [Google Scholar]
- 33.Soille P. Springer; 2013. Morphological Image Analysis: Principles and Applications. [Google Scholar]
- 34.Bullitt E., Gerig G., Pizer S.M., Lin W., Aylward S.R. Measuring tortuosity of the intracerebral vasculature from MRA images. IEEE Trans. Med. Imag. 2003;22:1163–1171. doi: 10.1109/TMI.2003.816964. [DOI] [PMC free article] [PubMed] [Google Scholar]
Associated Data
This section collects any data citations, data availability statements, or supplementary materials included in this article.
Supplementary Materials
Data Availability Statement
-
•
OCTA raw data reported in this paper will be shared by the lead contact upon request.
-
•
This paper does not report original code.
-
•
Any additional information required to reanalyze the data reported in this paper is available from the lead contact upon request.