

Summary
In the field of steady-state visual evoked potential (SSVEP), stimulus paradigms are regularly arranged or mimic the style of a keyboard with the same size. However, stimulation paradigms have important effects on the performance of SSVEP systems, which correlate with the electroencephalogram (EEG) signal amplitude and recognition accuracy. This paper provides MP dataset that was acquired using a 12-target BCI speller. MP dataset contains 9-channel EEG signals from the occipital region of 24 subjects under 5 stimulation paradigms with different stimulus sizes and arrangements. Stimuli were encoded using joint frequency and phase modulation (JFPM) method. Subjects completed an offline prompted spelling task using a speller under 5 paradigms. Each experiment contains 8 blocks, and each block contains 12 trials. Designers can use this dataset to test the performance of algorithms considering “stimulus size” and “stimulus arrangement”. EEG data showed SSVEP features through amplitude-frequency analysis. FBCCA and TRCA confirmed its suitability.
Subject areas: Health sciences, Natural sciences, computer science
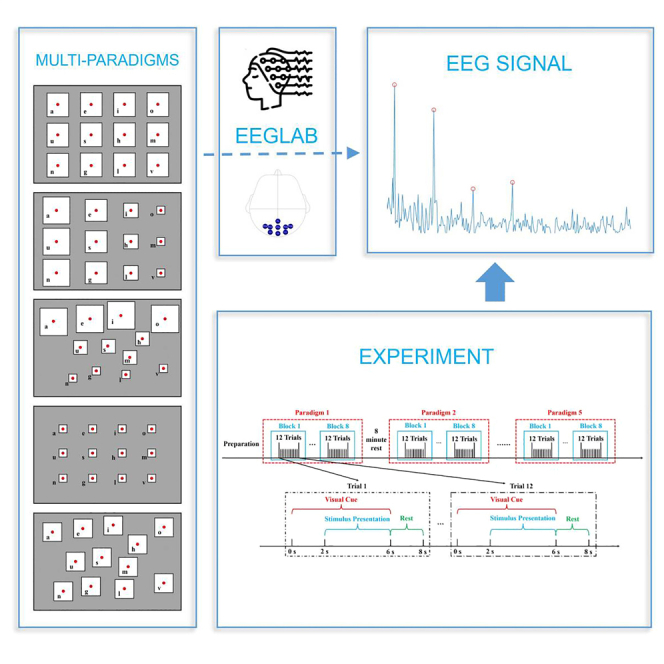
Graphical abstract
Highlights
-
•
A steady-state visual evoked potential dataset based on multiple stimulus paradigms
-
•
Effects of stimulus size and arrangement on the SSVEP system performance
-
•
Algorithm performance test, FBCCA and TRCA as examples
-
•
Availability and improvement potential of dataset
Health sciences; Natural sciences; Computer science
Introduction
Brain-computer interface (BCI) technology builds a pathway between the brain and peripheral devices.1 The technology uses specific electroencephalogram (EEG) signal acquisition devices to detect neural activity in the brain, analyze the signals and convert them into control commands. After the device is in operation, it feeds the results back to the human brain and induces the generation of new EEG signals that enable interaction between the human brain and the machine.
Steady-state visual evoked potential (SSVEP) is a kind of periodic evoked potential induced by rapid repetitive visual stimulation, which is a special kind of EEG signal.2 When a visual stimulus is repeated at a certain frequency, such as a flashing light source or a vibrating pattern, this frequency-specific stimulus is able to produce a potential response in the visual areas of the brain that matches the frequency of the stimulus. Compared with other common BCI systems, such as P300 and motor imagery (MI), SSVEP-based BCI systems have higher signal-to-noise ratios (SNRs), SSVEP-based BCI systems enhance signal-to-noise ratios (SNR), elevate the recognition accuracy and broaden the classification capabilities. Besides, they are easy to achieve high information transfer rates (ITR) without training data of the users in advance.3,4 Benefit by its high accuracy, fast response and robust reliability, SSVEP is widely used in the field for recognizing and decoding the subjects intention. In turn, humans are empowered to manipulate and control external devices through the mere act of gazing at visual stimuli, thereby facilitating seamless interaction with computers and other intelligent systems.
There have been many studies conducted on SSVEP. Experts and scholars have studied various aspects of coding algorithms,5 feature recognition algorithms,6,7,8,9 and stimulation presentation10 for SSVEP-based BCI systems. Throughout these research processes, the SSVEP-based datasets play an irreplaceable role. With SSVEP-based datasets, algorithm designers can directly measure the performance of their algorithms through offline simulations instead of acquiring online EEG signals, which greatly improves the efficiency of their research. Currently, there are a number of research groups that have made their datasets available.11,12,13,14 Since the speller system can fully utilize the maximum number of target identifications that can be used by the paradigm compared to other application directions, most SSVEP-based datasets employ a speller as a way of obtaining EEG datasets.
For example, a benchmark dataset with a BCI speller with 40 targets is provided in,11 providing a platform to compare the performance of different algorithms. In,13 an available dataset is designed and acquired to meet the needs of real-world applications, using the real keyboard style in designing the stimulation paradigm.
In the field of SSVEP, academics have not yet systematically investigated the effect of different stimulation styles. In previous datasets of speller systems, the stimulation paradigms used to acquire EEG signals were either regularly arranged15,16,17 or mimics the style of a keyboard13,18 with the same stimulus size. While the effect of the stimulation paradigm on the performance of the SSVEP system cannot be ignored.19 Known as a common sense in the field SSVEP, the medium frequency band is the most obvious range of SSVEP response.20 Systematic discussion and adequate public dataset are recently provided to prove it.21 Furthermore, existing studies on different paradigms mainly adjust different frequency ranges and frequency combinations,22 and explore the optimal frequency range20 and potential multi frequency combinations.22 Besides, Benda23 have shown that the stimulus size affects the final recognition accuracy. The larger the stimulus size, the larger the amplitude of the EEG signal that can be excited.24 MP dataset is set to support research in this direction.
In the field of human-computer interaction, setting the size and spatial position of targets based on the reuse rate and importance of control instructions can effectively improve the spatial utilization of the interaction interface and enhance the user experience. Considering flexibility and reality, the targets in BCI system are not necessarily regularly arranged. They can be adjusted according to the user’s preference, practical needs, and other factors. Therefore, algorithm designers should optimize their algorithms by considering the stimulus size and stimulus arrangement to achieve the matching of paradigms and algorithms, so as to improve the performance of BCI system.
To support this research, this study provides a BCI dataset based on SSVEP. Our dataset can not only be used to study the effects of stimulus size and stimulus arrangement on EEG signals, but also improve the feature recognition algorithms. FBCCA and TRCA are recognized as conventional techniques. This research chose to use these two algorithms to verify the reliability and versatility of our dataset, After simple algorithm adaptation, our dataset demonstrates their effective performance and robust reliability when subjected to analysis using these methods. Algorithm designers can use this dataset to test the performance of their algorithms.
Compared with other existing datasets,25,26,27,28,29,30 our study provides a multiple paradigm SSVEP (MP SSVEP) dataset. MP SSVEP dataset was recorded from a total of 24 subjects, including 2 experienced subjects and 22 novices. It has the following characteristics: (1) 5 stimulation paradigms with different stimulus sizes and arrangements were used. (2) 12 targets were set up with a stimulation frequency range of 8–13.5 Hz at 0.5 Hz intervals, and phase coding was also used. The duration of each frequency was 4 s and the recording was repeated 8 times. (3) EEG signals from nine electrodes in the occipital region were collected and recorded using a wireless EEG signaling device. (4) Stimulus events were accurately synchronized with EEG data. Based on above characteristics, this dataset is of great use in helping to evaluate SSVEP detection algorithms, especially those that take into account stimulus size, stimulus arrangement.
The rest of the paper is organized as follows: Section II describes the experimental setup for data recording, including participants information, stimulation presentation, experimental design, data acquisition, data preprocessing, and performance evaluation. Section III gives the information about the dataset records. Section IV demonstrates the usability of the dataset from the evaluation results of both the amplitude-frequency analysis and the feature recognition algorithm. Section V summarizes the article and discusses where the dataset can be improved.
Results
Participants
24 healthy subjects with normal or corrected-to-normal vision participated in the experiment (22 young adults aged 19–23 years, 2 middle-aged adults aged 44 and 46 years, and 5 females). Of all subjects, 2 had experience with SSVEP-based BCI spellers in our previous study, and the other 22 subjects were new to SSVEP-based BCI spellers. Each participant was asked to read and sign an informed consent form before the experiment. Subjects received a $27.5 financial reward for their participation in this study. This study was approved by the Research Ethics Committee of Shanghai University.
Stimulation presentation
The present study was designed as an offline BCI experiment using a 12-target BCI speller. It is commonly recognized that BCI paradigms with more than four targets are considered complex. For instance, a BCI control UAV typically requires only six target commands for up, down, left, right, forward, and backward movements. When comparing with a standard database,13 they involve only one kind of paradigms, 40 targets with 35 subjects, 5 s of signal length, and 6 blocks, totally 8400 tasks (1 kind × 40 targets × 35 subjects × 6 blocks). In contrast, MP dataset involves 5 distinct paradigms, 12 targets, 24 subjects, 8 s of signal length, and 8 blocks, totally 11520 tasks (5 kinds × 12 targets × 24 subjects × 8 blocks), demonstrating a more sophisticated setup.
The objective of this research is to analyze the effects of different stimulus sizes and arrangements within BCI systems on user interaction and system response. Figure 1 illustrates the five stimulation paradigms used in this experiment. The five stimulation paradigms have different stimulus sizes and arrangements, and all are 3 × 4 stimulus matrices in terms of their general structure. The stimuli were displayed on an LCD internal display of size 14.1 inches (brand “DELL Latitude 5430", resolution 1920 × 1080 pixels, refresh rate 60 Hz, max luminance 250nits).
Figure 1.

The 5 stimulation paradigms for which the experiment was designed
(A) Paradigm 1: The squares are of the same size, with large square dimensions and regular arrangement.
(B) Paradigm 2: The squares are of the same size, with small square dimensions and regular arrangement.
(C) Paradigm 3: The squares are decreasing in size by columns and regularly arranged.
(D) Paradigm 4: The squares are of the same size, with large square dimensions and irregular arrangement.
(E) Paradigm 5: The squares are irregularly arranged in decreasing size by row.
The stimuli are all shaped as squares with a red dot in the center of the square, making it easy for the user to gaze at the stimulus square. The experiment also had separate characters for each stimulus, located in the lower left corner of the stimulus, in order from left to right and top to bottom: a, e, i, o, u, s, h, m, n, g, l, v, the size of the characters was 75 × 75 pixels square, and the color of the characters was black.
The specific designs of the 5 paradigms are as follows.
-
(1)
Paradigm 1: The squares are of the same size, with large square dimensions and regular arrangement. The sides of the stimulus squares are 216 pixel dots long, and the stimulus squares are regularly spaced with the same spacing between rows and columns.
-
(2)
Paradigm 2: The squares are of the same size, with small square dimensions and regular arrangement. The sides of the stimulus squares are 50 pixel dots long. The stimulus squares are regularly spaced with the same spacing from row to row and column to column.
-
(3)
Paradigm 3: The squares are decreasing in size by columns and regularly arranged. The side lengths of the stimulus squares are set to 275, 200, 150, and 50 pixel dots, respectively. and the distance between rows decreasing as the stimulus squares increased, but the centers of the stimulus squares are located at the same horizontal line, and the distance between the horizontal lines of the two rows is the same.
-
(4)
Paradigm 4: The squares are of the same size, with large square dimensions and irregular arrangement. The stimulus square side length is set to 216 pixel dots. The stimulus squares are presented in a more irregular position, with each stimulus square having varying spacing relative to neighboring stimulus squares.
-
(5)
Paradigm 5: The squares are irregularly arranged in decreasing size by row. The side lengths of the stimulus squares are set to 300, 150, and 70 pixel dots, respectively. Stimulus squares are presented in a more irregular position, with each stimulus square having a different spacing relative to neighboring stimulus squares.
The stimulation program was developed using Psychophysics Toolbox Ver. 3 (PTB-3)31 under MATLAB (MathWorks, Inc.). Using the joint frequency and phase modulation (JFPM) method5, following a left-to-right, top-to-bottom coding sequence for the visual blinks of the speller, the frequency and phase values for each character can be calculated as
| (Equation 1) |
| (Equation 2) |
where indicates the starting frequency, i.e., 8 Hz, and and indicate the row and column indexes of the stimulus square, respectively. and are 8 Hz and 0.5 Hz, respectively, making the frequency range of the 12 characters [8–13.5 Hz]. and are 0 and 0.35 π, respectively, making the range of the additional phases of the 12 characters [0–3.85 π].
Figure 2 illustrates the frequency and phase values set for the target in each paradigm. In this study, a sampled sinusoidal stimulation method32,33 was used to present visual flicker on an LCD monitor. To obtain an accurate SSVEP response, by modulating the screen luminance, a stimulation sequence corresponding to the stimulation frequency can be generated
| (Equation 3) |
where denotes the generation of a sine wave, denotes the frame index in the stimulation sequence, is the refresh rate of the display, which was experimentally set to 60, and is the additional phase. 0 and 1 denote the highest and lowest luminance in the stimulation sequence.
Figure 2.

Frequency and phase of 5 stimulation paradigms
(A–E) Following a left-to-right, top-to-bottom coding sequence, the stimulation frequencies ranged from 8 Hz to 13.5 Hz at intervals of 0.5 Hz, and the additional phase ranged from 0 to 3.85 π at intervals of 0.35 π.
Experimental design
The experimental environment was a dimly lit (light intensity of approximately 10 Lux), noiseless room. Subjects were required to sit comfortably in a chair at an eye distance of 60 cm from the screen in which the stimulation were presented.
The experiment required subjects to complete an offline prompted spelling task using a BCI speller. Figure 3 illustrates the flow of the experiment, which consisted of 5 paradigms of the task, each containing 8 blocks, and each block containing 12 trials corresponding to all 12 characters indicated in random order. The duration of each trail was 8 s, and the stimulation presentation process was divided into 3 steps.
-
(1)
Visual Cue: Before the arrival of the stimulation, a cue red dot was displayed on the screen for 2 s to assist with the cuing, which was used to prompt the user where to look when the next round of stimulation was displayed, corresponding to the red dot in the center of the stimulus;
-
(2)
Stimulation Presentation: At the end of the cuing time, all stimuli started to flash for 4 s, and subjects were required to gaze at the stimulus corresponding to the cued red dot appeared in Visual Cue period at this time;
-
(3)
Rest: After the stimulation presentation, there was a 2-s rest period, at which time the screen was grayed out and the countdown to the next stimulus was displayed in the upper right.
Figure 3.

Process of the experiment to be completed by each subject, which consisted of 5-paradigm task
Each paradigm task contained 8 blocks, and each block contained 12 trials lasting 8 s. The trail was divided into 3 steps: (1) Visual Cue (6 s), (2) Stimulation Presentation (4 s) and (3) Rest (2 s).
After the 8 blocks of each paradigm, subjects were given 8 min to rest.
Data acquisition
In this system, the device used for EEG signal acquisition was a NeuroHUB from Neuracle (Neuracle, Inc.), which acquired EEG signals at a sampling rate of 1000 Hz, showed in Figure 4. The placement of electrodes followed the extended 10–20 system, and Figure 5 shows the nine electrodes in the occipital region selected for the experiments, namely Pz, PO5, Oz, O1, PO3, O2, PO4, POz and PO6 (ordered according to the number of the channels in the dataset). Besides, the electrodes were placed in the CPz and AFz positions as reference and ground. During the recording process, all electrode resistances were kept below 10 kΩ. Stimulation events were generated by the stimulation program and were recorded on the event channel synchronized with the EEG data.
Figure 4.

The acquisition device
NeuroHUB from Neuracle.
Figure 5.

Nine electrodes in the occipital region
In the preparation stage before the experiment, the subjects were required to wash their scalps and wear a wet electrode EEG signal acquisition cap. The electrode channels were injected with conductive paste to acquire the EEG signals in a non-invasive manner. Then the principle of SSVEP, the style of the five stimulation paradigms used in the experiment were introduced, and the first block of Paradigm 1 was played to make the subjects understand the experiment. Subjects were also told to avoid blinking during the 5-s stimulation duration and to minimize thinking about other things as much as possible.
Data preprocessing
Data epochs were extracted from the recorded continuous EEG signals based on the stimulation response from the event channel. For each trial, data for the stimulation presentation period of 4 s were extracted. In order to reduce the storage and computational cost, all epochs are downsampled to 250 Hz11. For the raw EEG data, an EEGLAB34 was used applying a 50 Hz FIR notch filter to remove the power line noise, and data epochs were extracted from the filtered continuous data.
Performance evaluation
Recognition accuracy and are commonly used to evaluate the performance of SSVEP-based BCI systems. ITR (in bits/min) can be estimated as35
| (Equation 4) |
where is the number of targets, is the recognition accuracy, and (seconds/selection) is the average time for selection. In order to estimate the actual , we add a gaze transfer time of 2 s to in the actual calculation.
Data records
Dataset information
The dataset contains 120 MATLAB MAT files corresponding to the data under the 5-paradigm experiment for all 24 subjects (about 450 MB in total). The data were stored as double precision floating point values in MATLAB. The naming scheme is combined according to the subject index as well as the paradigm index, i.e., S1-1.mat, …, S24-1.mat; S1-2.mat, …, S24-2.mat; S1-3.mat, …, S24-3.mat; S1-4.mat, …, S24-4.mat; S1-5.mat, …, S24-5.mat. When loaded, each file generates a 4-D matrix named “data” in the MATLAB workspace with dimensions [9, 1000, 12, 8]. The four dimensions respectively indicate “Electrode index”, “Time points”, “Target index”, and “Block index”. For the experiments under a single paradigm, the data matrix consists of 96 trials (12 targets × 8 blocks), and each trial consists of 9 channels of 4 s data length (4 × 250 = 1000 points). Among the publicly available files, a file named “Readme.txt” explains the data structure and other task-related information.
Subject information
The “Sub_info.txt” file gives information about all subjects. There are 4 parameters for each subject, including “Subject Index”, “Gender”, “Age” and “Group (with or without training)”. Subjects were categorized into “experienced” group (2 subjects, S1-X-S2-X) and “naive” group (22 subjects, S3-X-S24-X) based on their experience in SSVEP-based BCI.
Technical validations
Amplitude-frequency analysis
In order to assess the signal quality of the dataset, this study analyzed the SSVEP feature of all subjects under the experiments of Paradigm 1 to Paradigm 5. Figure 6 shows the targets selected for the analysis: all targets in the first row and column of the 3 × 4 stimulus array were selected, totaling 6, at the following frequencies: 8 Hz, 8.5 Hz, 9 Hz, 9.5 Hz, 10 Hz, and 12 Hz.
Figure 6.

Six targets selected for amplitude-frequency analysis
Figures 7, 8, 9, 10 and 11 show the amplitude spectra of the Oz electrodes for 6 targets under 5 paradigms of the experiment. These amplitude spectra were obtained by band-pass filtering the EEG data of all subjects between 7 Hz and 70 Hz11, averaging the data over 8 blocks for a specific target in a specific paradigm, and finally applying the fast Fourier transform (FFT). The magnitude values at the SSVEP frequencies are marked by red circles in the figure.
-
(1)
For “Paradigm 1: The squares are of the same size, with large square dimensions and regular arrangement.”, as shown in Figure 7, among the six targets, except for the one at 8 Hz, distinct peak amplitudes can be observed at both the fundamental frequency and the first harmonic frequency. The values of the peak amplitudes at the SSVEP frequencies of the six targets are relatively similar.
-
(2)
For “Paradigm 2: The squares are of the same size, with small square dimensions and regular arrangement.", as shown in Figure 8, the peaks of all six targets can be observed at the position of the first harmonic of the SSVEP frequency, but the peaks are not obvious. At the same time, the values of the peak amplitude of the SSVEP frequency were relatively similar for all six targets. For Paradigm 2, the size of its stimulus is much smaller than that of Paradigm 1. Accordingly, the peak amplitude values of the SSVEP frequencies in the amplitude spectra are significantly smaller than those in Paradigm 1.
-
(3)
For “Paradigm 3: The squares are decreasing in size by columns and regularly arranged.”, as shown in Figure 9, peaks are observed at the fundamental and first harmonic frequency positions for all six targets. For the four targets, 8.0 Hz, 8.5 Hz, 9.0 Hz, and 9.5 Hz, which had decreasing stimulus square sizes, the amplitude of the SSVEP frequency conformed to the trend of decreasing with decreasing stimulus size, and the peaks became less pronounced. For the three targets with the same stimulus size of 8.0 Hz, 10.0 Hz, and 12.0 Hz, the peak amplitudes of their SSVEP frequencies were more similar.
-
(4)
For “Paradigm 4: The squares are of the same size, with large square dimensions and irregular arrangement.”, as shown in Figure 10, obvious peak amplitudes can be observed at both the fundamental and the first harmonic for all six targets. The peak amplitudes are relatively similar for all six targets. Compared with Paradigm 1, the peak amplitude values at the SSVEP frequency are relatively similar for both.
-
(5)
For “Paradigm 5: The squares are irregularly arranged in decreasing size by row.”, as shown in Figure 11, all six targets observe peaks at the fundamental and first harmonic frequency positions. For the four targets, 8.0 Hz, 8.5 Hz, 9.0 Hz, and 9.5 Hz, which have the same stimulus square size and more similar peak amplitudes, the peaks are clearly observed at both the fundamental and first harmonic frequency locations. For the three targets with decreasing stimulus sizes, 8.0 Hz, 10.0 Hz, and 12.0 Hz, their peak amplitude values at the SSVEP frequency also tend to a decrease with decreasing stimulus size. The peak frequency become less pronounced compared to the other frequencies.
Figure 7.

Amplitude spectra of the six targets in Paradigm 1
(A–F) Except for the one at 8 Hz, distinct peak amplitudes can be observed at both the fundamental frequency and the first harmonic frequency. The values of the peak amplitudes at the SSVEP frequencies of the six targets are relatively similar.
Figure 8.

Amplitude spectra of the six targets in Paradigm 2
(A–F) The peaks of all six targets can be observed at the position of the first harmonic of the SSVEP frequency, but the peaks are not obvious. The values of the peak amplitude of the SSVEP frequency were relatively similar for all six targets.
Figure 9.

Amplitude spectra of the six targets in Paradigm 3
(A–F) Peaks are observed at the fundamental and first harmonic frequency positions for all six targets. For the four targets, 8.0 Hz, 8.5 Hz, 9.0 Hz, and 9.5 Hz, which had decreasing stimulus square sizes, the amplitude of the SSVEP frequency conformed to the trend of decreasing with decreasing stimulus size, and the peaks became less pronounced. For the three targets with the same stimulus size of 8.0 Hz, 10.0 Hz, and 12.0 Hz, the peak amplitudes of their SSVEP frequencies were more similar.
Figure 10.

Amplitude spectra of the six targets in Paradigm 4
(A–F) Obvious peak amplitudes can be observed at both the fundamental and the first harmonic for all six targets. The peak amplitudes are relatively similar for all six targets. Compared with Paradigm 1, the peak amplitude values at the SSVEP frequency are relatively similar for both.
Figure 11.

Amplitude spectra of the six targets in Paradigm 5
(A–F) All six targets observe peaks at the fundamental and first harmonic frequency positions. For the four targets, 8.0 Hz, 8.5 Hz, 9.0 Hz, and 9.5 Hz, which have the same stimulus square size and more similar peak amplitudes, the peaks are clearly observed at both the fundamental and first harmonic frequency locations. For the three targets with decreasing stimulus sizes, 8.0 Hz, 10.0 Hz, and 12.0 Hz, their peak amplitude values at the SSVEP frequency also tend to a decrease with decreasing stimulus size, and their peak frequency become less pronounced compared to the other frequencies.
These results all show that the SSVEP features in the EEG signals in this dataset are identifiable.
Evaluation of paradigms using FBCCA and TRCA method
Filter bank canonical correlation analysis (FBCCA)7 and task-related component analysis (TRCA)8 were two commonly used algorithms for SSVEP classification. FBCCA aims to enhance SSVEP detection by integrating both fundamental and harmonic frequency elements. The application of TRCA-based spatial filters resulted in a notable superiority over the extended CCA-based approach concerning both classification accuracy and ITR. The study used these two algorithms to classify SSVEP signals for all subjects in the dataset for 12 targets in 5 paradigms to analyze the effect of the different designs of the paradigms on the results. EEG data from all 9 electrode channels were used as input signals for filter bank analysis.
Figure 12 shows the average accuracy and average ITR of all 24 subjects for FBCCA, TRCA algorithms under 5 paradigms and different data lengths, respectively. In terms of parameterization of the algorithms, the number of FBCCA filter banks is 5 and up to the 3rd harmonic is analyzed. TRCA algorithm also uses 5 filter banks for the sub-band decomposition.
Figure 12.

Cross-sectional comparison of accuracy and ITR of five paradigms using FBCCA method and TRCA method
(A–D) Accuracy and ITR for all 5 paradigms both show the trend: Paradigm 1 ≈ Paradigm 4 > Paradigm 5 ≈ Paradigm 3 > Paradigm 2.
Comparing the performance of FBCCA with TRCA for the five paradigms, it is found that the recognition accuracy and ITR under different paradigms conforms to the following trend: Paradigm 1 ≈ Paradigm 4 > Paradigm 5 ≈ Paradigm 3 > Paradigm 2. Paradigm 1, the widely adopted paradigm for common SSVEP datasets, showed more similar results to the other datasets with regularly arranged stimuli when they were analyzed for performance. And Paradigm 4 was ordered more irregularly based on Paradigm 1, but demonstrated performance similar to it. Paradigm 2 largely reduces the size of the stimulus from 214 × 214 pixel points to 50 × 50 pixel points based on Paradigm 1, and the analysis shows that this paradigm has less satisfactory results. Paradigm 3 and Paradigm 5, 2 paradigms with different stimulus sizes under the same stimulation paradigm, both show lower performance than Paradigm 1 and Paradigm 4, but the FBCCA, TRCA results under different stimulation times prove that the paradigm is still usable and their performance can be improved through algorithmic improvements. Cross-sectional comparison results show that different paradigms are designed to perform differently and that similar paradigms have similar performance.
Evaluating FBCCA and TRCA method
The dataset also has the capability to analyze the performance of the algorithms. Here we use FBCCA and TRCA methods to show how the dataset can be used.
The impact of time on accuracy and ITR: Figure 13 shows that the accuracy of both FBCCA and TRCA increases with increasing data length in all five SSVEP paradigms. Comparing FBCCA with TRCA, the accuracy of TRCA from Paradigm 1 to Paradigm 5 is higher than that of FBCCA at the moments before 1 s. The recognition accuracy of TRCA algorithm is better than that of FBCCA method in a short period of time (<1 s). For FBCCA algorithm, with a data length of 4s, Figure 13A shows Paradigm 1 can achieve a classification accuracy of 91.32%, Paradigm 2 only 49.52%, Paradigm 3 79.99%, Paradigm 4 90.84%, followed by Paradigm 5 79.08%, respectively. As for TRCA algorithm, Paradigm 1 to Paradigm 5 can achieve 78.43%, 32.81%, 64.54%, 78.82%, and 64.11% accuracy in the case of 4 s, respectively.
Figure 13.

Accuracy of FBCCA and TRCA methods over time
(A–E) Under the five SSVEP paradigms, the accuracy of both FBCCA and TRCA increases with increasing data length in all five SSVEP paradigms. The recognition accuracy of TRCA algorithm is better than that of FBCCA method in a short period of time (<1 s). The error bars indicate standard errors.
Figure 14 shows the variation of ITR over time. Except for Paradigm 2, the ITR of the remaining four paradigms significantly increased and the ITR of Paradigm 2 increases slightly with accuracy over time. TRCA method showed superior ITR to FBCCA method for shorter stimulation duration (<1 s). In the study, a 2-s sight transfer time was considered in the ITR calculation. Under the five SSVEP paradigms, TRCA method showed superior ITR to FBCCA method for shorter stimulation. Figure 12 shows the ITR of FBCCA method for Paradigms 1 through 5 peaked at moments of 2.0 s, 4.0 s, 2.8 s, 2.0 s, 2.4 s and were able to achieve 38.18, 12.35, 26.43, 39.14, and 27.29 bits/min, respectively. While TRCA method peaks at 1.6 s, 2.8 s, 2.4 s, 1.6 s, and 1.6 s moments, and is able to achieve 28.75, 5.22, 17.89, 30.82, and 18.87 bits/min, respectively.
Figure 14.

ITR of FBCCA and TRCA methods over time
(A–E) Except for Paradigm 2, the ITR of the remaining four paradigms significantly increased and the ITR of Paradigm 2 increases slightly with accuracy over time. TRCA method shows superior ITR to FBCCA method for shorter stimulation duration (<1 s). The error bars indicate standard errors.
The influence of sub-bands number and time on accuracy: Since both FBCCA and TRCA decompose the data into sub-bands,7,8 Figures 15 and 16 show the accuracy and ITR of FBCCA and TRCA for five paradigms under the number of sub-bands of 3, 4, and 5, respectively, and the length of the data of 4 s and 2 s. The results show that the number of sub-bands of FBCCA algorithm and TRCA algorithm are not better with a larger number of sub-bands.
Figure 15.

Accuracy of FBCCA and TRCA under sub-bands number of 3, 4, 5 for 5 paradigms with data length of 4 s and 2 s respectively
(A) FBCCA result of 4 s data length.
(B) TRCA result of 4 s data length.
(C) FBCCA result of 2 s data length.
(D) TRCA result of 2 s data length.
Figure 16.

ITR of FBCCA and TRCA under sub-bands number of 3, 4, 5 for 5 paradigms with data length of 4 s and 2 s respectively
(A) FBCCA result of 4 s data length.
(B) TRCA result of 4 s data length.
(C) FBCCA result of 2 s data length.
(D) TRCA result of 2 s data length.
For FBCCA algorithm, under the stimulation duration of 4 s, the accuracy and ITR of Paradigm 1 decreased with the increase of the number of sub-bands; the accuracy and ITR of Paradigm 2 and Paradigm 5 increased with the increase of the number of sub-bands; the accuracy of Paradigm 3 and Paradigm 4 was less affected by the change of the number of sub-bands, while the ITR of Paradigm 3 increased with the increase of the number of sub-bands and that of Paradigm 4 was highest under the number of 4 sub-bands.
At a stimulation duration of 2 s, Paradigm 1, Paradigm 2, and Paradigm 4 had the highest accuracy at a number of 4 sub-bands, while the accuracy of Paradigm 2 and Paradigm 5 increased with the number of sub-bands. In TRCA method, for two different stimulation duration of 4 s and 2 s, the accuracy of the 5 paradigms with ITR decreases with increasing number of sub-bands.
Discussion
The present study provides the dataset used to study SSVEP-based BCIs that were encoded for stimuli using the JFPM method. Unlike other datasets, the proposed dataset was acquired using a wireless EEG signaling device to record 9-channel SSVEP signals in the occipital region, capturing five 12-target stimulation paradigms with different stimulus sizes and arrangements: (1) Paradigm 1: The squares are of the same size, with large square dimensions and regular arrangement. (2) Paradigm 2: The squares are of the same size, with small square dimensions and regular arrangement. (3) Paradigm 3: The squares are decreasing in size by columns and regularly arranged. (4) Paradigm 4: The squares are of the same size, with large square dimensions and irregular arrangement. (5) Paradigm 5: The squares are irregularly arranged in decreasing size by row. The dataset collected using these five paradigms can be used to study the effect of stimulus size and arrangement on the EEG signal in the stimulation paradigm. Designers can improve the algorithms based on the two factors of “stimulus size” and “stimulus arrangement” and test the performance of the algorithms with the help of this dataset. This study demonstrates the usability of the dataset in terms of amplitude-frequency analysis, paradigm analysis, and classification algorithm analysis.
After processing the data using the FFT, the results showed that significant peak amplitudes were observed at the fundamental and first harmonic positions in all five paradigms, especially at the first harmonic. The amplitudes of the fundamental and harmonic components decreased as the response frequency increased. The value of the peak amplitude of the SSVEP decreased with the decrease in the size of the stimulus. The results in the amplitude spectra demonstrate that the EEG data from all subjects in this dataset possess SSVEP properties.
FBCCA and TRCA algorithms were used for cross-sectional evaluation of the paradigms. Under the same feature recognition algorithm, the comparison between different paradigms shows that the differences in paradigm design have different performance, and similar paradigms have similar performance. It indicates that MP dataset can be used to measure and compare the performance of algorithms, especially helpful for improving the algorithms that consider “stimulus size” and “stimulus arrangement”.
FBCCA and TRCA methods are used to explore the effect of time and number of sub-bands on the recognition results. It demonstrates that this dataset also has the capability to analyze the performance of the algorithms.
Under the five SSVEP paradigms, the accuracy of both FBCCA and TRCA increases with the data length. The ITR peaks at 2.0 s, 4.0 s, 2.8 s, 2.0 s, and 2.4 s moments for FBCCA method in Paradigm 1 to Paradigm 5, and for TRCA method at 1.6 s, 2.8 s, 2.4 s, 1.6 s, and 1.6 s moments. TRCA accuracy of Paradigm 1 to Paradigm 5 was higher than that of FBCCA at moments before 0.8 s, 1.2 s, 0.8 s, 0.8 s, 0.8 s, 0.8 s, and 0.8 s, respectively. TRCA method showed superior recognition accuracy than FBCCA method for shorter stimulation duration. Coherently, ITR of TRCA method was higher than that of the FBCCA method in the same period.
Limitations of the study
There is potential for further enhancement in this dataset. First, SSVEP paradigms with a larger number of targets could be designed, in which there are more diverse settings for stimulus size and arrangement. Second, more subjects could be recruited for the experiment to obtain a wide sample of data. In addition, other details of the paradigm can be explored to study the impact on the system performance. For example, similarly shaped letters in the BCI speller, such as “m” and “n”, may cause the subjects to make errors during the free spelling process if their stimuli are set too close to each other.
In addition, the current paradigm-based frequency stimulation is prone to cause eye fatigue of subjects, and later work are planned in the direction of SSPVEP (steady-state peripheral visual evoked potential) and MCVEP (multi-color visual evoked potential) to improve comfort of BCI user. The collected data mode is single EEG, and the Neurahub device can also collect EOG, EMG, ECG, blood oxygen, and heart rate; the subsequent data collection will supplement the data of these physiological modes.
Resource availability
Lead contact
Further information and requests for resources should be directed to and will be fulfilled by the lead contact, Ting Zhou (zhouting@shu.edu.cn).
Materials availability
This study did not generate new materials.
Data and code availability
-
•
De-identified data, permanently unlinked from all personal identifiable information (PII), were used in the present study. These data is publicly accessible at GitHub: https://github.com/MULT-SA-SSVEP-Paradigm.
-
•
All original code has been deposited at GitHub: https://github.com/MULT-SA-SSVEP-Paradigm, and is publicly available as of the date of publication.
-
•
Any additional information required to reanalyze the data reported in this paper is available from the lead contact upon request.
Acknowledgments
The authors would like to thank all subjects who participated in this experiment. This work was supported in part by the Shanghai Industrial Collaborative Innovation Project under Grant XTCX-KJ-2023-05, and in part by Shanghai Pudong Industry-University-Research Special Project (Electronic Information) (PKX2023-D05).
Author contributions
Conceptualization, X.Z., Z.W., T.Z., and H.H.; Methodology, X.Z., S.X., K.G., T.X., and T.Z.; Investigation, X.Z., S.X., K.G., and Z.W.; Formal analysis, T.Z., T.X., Z.W., and S.F.; Software, X.Z., S.X., and K.G.; Resources, T.Z., S.F., and H.H.; Visualization, K.G. and S.X.; Writing – original draft, X.Z., S.X., K.G., and T.Z.; Writing – review and editing, X.Z., K.G., and T.Z.; Supervision, T.Z., T.X., H.H., and S.F.; Funding acquisition, T.Z., T.X., and H.H.
Declaration of interests
The authors declare no competing interests.
STAR★Methods
Key resources table
| REAGENT or RESOURCE | SOURCE | IDENTIFIER |
|---|---|---|
| Deposited data | ||
| MP Dataset | This paper | GitHub: https://github.com/MULT-SA-SSVEP-Paradigm. |
| Software and algorithms | ||
| MATLAB R2023b | The Mathworks, Natick, MA, USA | https://www.mathworks.com/products/matlab.html |
| EEGLAB | Delorme and Makeig | https://sccn.ucsd.edu/eeglab/index.php |
| Original code | This paper | GitHub:https://github.com/MULT-SA-SSVEP-Paradigm |
| Other | ||
| Neurahub | Neuracle | http://www.neuracle.cn/productinfo/1643986.html |
| DELL Latitude 5430 | DELL | https://www.dell.com/en-us/shop/dell-laptops/latitude-5430-laptop/spd/latitude-5430-laptop |
Experimental model and study participant details
Participants
24 healthy subjects with normal or corrected-to-normal vision participated in the experiment (22 young adults aged 19-23 years, 2 middle-aged adults aged 44 and 46 years, and 5 females, all Chinese). Of all subjects, 2 had experience with SSVEP-based BCI spellers in our previous study, and the other 22 subjects were new to SSVEP-based BCI spellers. Each participant was asked to read and sign an informed consent form before the experiment. This study was approved by the Research Ethics Committee of Shanghai Universi.
Method details
Stimulation presentation
The present study was designed as an offline BCI experiment using a 12-target BCI speller. It is commonly recognized that brain-computer interface (BCI) paradigms with more than four targets are considered complex.
The objective of this research is to analyze the effects of different stimulus sizes and arrangements within BCI systems on user interaction and system response. The five stimulation paradigms have different stimulus sizes and arrangements, and all are 3 × 4 stimulus matrices in terms of their general structure. The stimuli were displayed on an LCD internal display of size 14.1 inches (brand “DELL Latitude 5430", resolution 1920×1080 pixels, refresh rate 60 Hz,max luminance 250nits).
The stimuli are all shaped as squares with a red dot in the center of the square, making it easy for the user to gaze at the stimulus square. The experiment also had separate characters for each stimulus, located in the lower left corner of the stimulus, in order from left to right and top to bottom: a, e, i, o, u, s, h, m, n, g, l, v, the size of the characters was 75 × 75 pixels square, and the color of the characters was black. The specific designs of the 5 paradigms are as follows:
-
(1)
Paradigm 1: The squares are of the same size, with large square dimensions and regular arrangement. The sides of the stimulus squares are 216 pixel dots long, and the stimulus squares are regularly spaced with the same spacing between rows and columns.
-
(2)
Paradigm 2: The squares are of the same size, with small square dimensions and regular arrangement. The sides of the stimulus squares are 50 pixel dots long. The stimulus squares are regularly spaced with the same spacing from row to row and column to column.
-
(3)
Paradigm 3: The squares are decreasing in size by columns and regularly arranged. The side lengths of the stimulus squares are set to 275, 200, 150, and 50 pixel dots, respectively. The stimulus squares are arranged in a regular pattern, with the same spacing between columns and the same distance between rows, and the distance between rows decreasing as the stimulus squares increased, but the centers of the stimulus squares are located at the same horizontal line, and the distance between the horizontal lines of the two rows is the same.
-
(4)
Paradigm 4: The squares are of the same size, with large square dimensions and irregular arrangement. The stimulus square side length is set to 216 pixel dots. The stimulus squares are presented in a more irregular position, with each stimulus square having varying spacing relative to neighboring stimulus squares.
-
(5)
Paradigm 5: The squares are irregularly arranged in decreasing size by row. The side lengths of the stimulus squares are set to 300, 150, and 70 pixel dots, respectively. Stimulus squares are presented in a more irregular position, with each stimulus square having a different spacing relative to neighboring stimulus squares.
The stimulation program was developed using Psychophysics Toolbox Ver. 3 (PTB-3) under MATLAB (MathWorks, Inc.).
Experimental design
The experimental environment was a dimly lit (light intensity of approximately 10 Lux), noiseless room. Subjects were required to sit comfortably in a chair at an eye distance of 60 cm from the screen in which the stimulation were presented.
The experiment required subjects to complete an offline prompted spelling task using a BCI speller. The flow of the experiment is consisted of 5 paradigms of the task, each containing 8 blocks, and each block containing 12 trials corresponding to all 12 characters indicated in random order. The duration of each trail was 8 s, and the stimulation presentation process was divided into 3 steps:
-
(1)
Visual Cue: Before the arrival of the stimulation, a cue red dot was displayed on the screen for 2 s to assist with the cuing, which was used to prompt the user where to look when the next round of stimulation was displayed, corresponding to the red dot in the center of the stimulus;
-
(2)
Stimulation Presentation: At the end of the cuing time, all stimuli started to flash for 4 s, and subjects were required to gaze at the stimulus corresponding to the cued red dot appeared in Visual Cue period at this time;
-
(3)
Rest: after the stimulation presentation, there was a 2 s rest period, at which time the screen was grayed out and the countdown to the next stimulus was displayed in the upper right.
After the 8 blocks of each paradigm, subjects were given 8 minutes to rest.
Data acquisition
In this system, the device used for EEG signal acquisition was a NeuroHUB from Neuracle (Neuracle, Inc.), which acquired EEG signals at a sampling rate of 1000 Hz. The placement of electrodes followed the extended 10-20 system, and the experiments selected nine electrodes in the occipital region, namely Pz, PO5, Oz, O1, PO3, O2, PO4, POz and PO6 (ordered according to the number of the channels in the dataset). Besides, the electrodes were placed in the CPz and AFz positions as reference and ground. During the recording process, all the electrode resistance were kept below 10 kΩ. Stimulation events were generated by the stimulation program and were recorded on the event channel synchronized with the EEG data.
In the preparation stage before the experiment, the subjects were required to wash their scalp and wear a wet electrode EEG signal acquisition cap. The electrode channels were injected with conductive paste to acquire the EEG signals in a non-invasive manner. Then the principle of SSVEP, the style of the five stimulation paradigms used in the experiment were introduced, and the first block of Paradigm 1 was played to make the subjects understand the experiment. Subjects were also told to avoid blinking during the 5-second stimulation duration and to minimize thinking about other things as much as possible.
Data preprocessing
Data epochs were extracted from the recorded continuous EEG signals based on the stimulation response from the event channel. For each trial, data for the stimulation presentation period of 4 s were extracted. In order to reduce the storage and computational cost, all epochs are downsampled to 250 Hz11. For the raw EEG data, an EEGLAB was used applying a 50 Hz FIR notch filter to remove the power line noise, and data epochs were extracted from the filtered continuous data.
Quantification and statistical analysis
Amplitude-frequency analysis
In order to assess the signal quality of the dataset, this study analyzed the SSVEP feature of all subjects under the experiments of Paradigm 1 to Paradigm 5. In the targets selected for the analysis, all targets in the first row and column of the 3 × 4 stimulus array were selected, totaling 6, at the following frequencies: 8 Hz, 8.5 Hz, 9 Hz, 9.5 Hz, 10 Hz, and 12 Hz. The amplitude spectra were obtained by band-pass filtering the EEG data of all subjects between 7 Hz and 70 Hz, averaging the data over 8 blocks for a specific target in a specific paradigm, and finally applying the fast Fourier transform (FFT). The results show that the SSVEP features in the EEG signals in this dataset are identifiable.
Evaluation of paradigms using FBCCA and TRCA method
Filter bank canonical correlation analysis (FBCCA) and task-related component analysis (TRCA) were two commonly used algorithms for SSVEP classification. FBCCA aims to enhance SSVEP detection by integrating both fundamental and harmonic frequency elements. The application of TRCA-based spatial filters resulted in a notable superiority over the extended CCA-based approach concerning both classification accuracy and ITR. The study used these two algorithms to classify SSVEP signals for all subjects in the dataset for 12 targets in 5 paradigms to analyze the effect of the different designs of the paradigms on the results. EEG data from all 9 electrode channels were used as input signals for filter bank analysis.
In terms of parameterization of the algorithms, the number of FBCCA filter banks is 5 and up to the 3rd harmonic is analyzed. TRCA algorithm also uses 5 filter banks for the sub-band decomposition.
Evaluating FBCCA and TRCA method
The dataset also has the capability to analyze the performance of the algorithms. Here we use FBCCA and TRCA methods to show how the dataset can be used.
Published: September 25, 2024
References
- 1.Mridha M.F., Das S.C., Kabir M.M., Lima A.A., Islam M.R., Watanobe Y. Brain-computer interface: Advancement and challenges. Sensors. 2021;21:5746. doi: 10.3390/s21175746. [DOI] [PMC free article] [PubMed] [Google Scholar]
- 2.Chen Y., Yang C., Ye X., Chen X., Wang Y., Gao X. Implementing a calibration-free ssvep-based bci system with 160 targets. J. Neural. Eng. 2021;18 doi: 10.1088/1741-2552/ac0bfa. [DOI] [PubMed] [Google Scholar]
- 3.Wang Y., Gao X., Hong B., Jia C., Gao S. Brain-computer interfaces based on visual evoked potentials. IEEE Eng. Med. Biol. Mag. 2008;27:64–71. doi: 10.1109/MEMB.2008.923958. [DOI] [PubMed] [Google Scholar]
- 4.Vialatte F.-B., Maurice M., Dauwels J., Cichocki A. Steady-state visually evoked potentials: Focus on essential paradigms and future perspectives. Prog. Neurobiol. 2010;90:418–438. doi: 10.1016/j.pneurobio.2009.11.005. [DOI] [PubMed] [Google Scholar]
- 5.Zhang Y., Xu P., Cheng K., Yao D. Multivariate synchronization index for frequency recognition of SSVEP- based brain–computer interface. J. Neurosci. Methods. 2014;221:32–40. doi: 10.1016/j.jneumeth.2013.07.018. [DOI] [PubMed] [Google Scholar]
- 6.Bin G., Gao X., Yan Z., Hong B., Gao S. An online multi-channel SSVEP-based brain–computer interface using a canonical correlation analysis method. J. Neural. Eng. 2009;6 doi: 10.1088/1741-2560/6/4/046002. [DOI] [PubMed] [Google Scholar]
- 7.Chen X., Wang Y., Gao S., Jung T.-P., Gao X. Filter bank canonical correlation analysis for implementing a high-speed SSVEP-based brain–computer interface. J. Neural. Eng. 2015;12 doi: 10.1088/1741-2560/12/4/046008. [DOI] [PubMed] [Google Scholar]
- 8.Nakanishi M., Wang Y., Chen X., Wang Y.-T., Gao X., Jung T.-P. Enhancing detection of SSVEPs for a high-speed brain speller using task-related component analysis. IEEE Trans. Biomed. Eng. 2018;65:104–112. doi: 10.1109/TBME.2017.2694818. [DOI] [PMC free article] [PubMed] [Google Scholar]
- 9.Nakanishi M., Wang Y.-T., Wei C.-S., Chiang K.-J., Jung T.-P. Facilitating calibration in high-speed BCI spellers via leveraging cross-device shared latent responses. IEEE Trans. Biomed. Eng. 2020;67:1105–1113. doi: 10.1109/TBME.2019.2929745. [DOI] [PubMed] [Google Scholar]
- 10.Punsawad Y., Wongsawat Y. A multi-command SSVEP-based bci system based on single flickering frequency half-field steady-state visual stimulation. Med. Biol. Eng. Comput. 2017;55:965–977. doi: 10.1007/s11517-016-1560-3. [DOI] [PubMed] [Google Scholar]
- 11.Wang Y., Chen X., Gao X., Gao S. A benchmark dataset for SSVEP-based brain–computer interfaces. IEEE Trans. Neural Syst. Rehabil. Eng. 2017;25:1746–1752. doi: 10.1109/TNSRE.2016.2627556. [DOI] [PubMed] [Google Scholar]
- 12.Lee M.-H., Kwon O.-Y., Kim Y.-J., Kim H.-K., Lee Y.-E., Williamson J., Fazli S., Lee S.-W. EEG dataset and OpenBMI toolbox for three BCI paradigms: An investigation into BCI illiteracy. GigaScience. 2019;8:giz002. doi: 10.1093/gigascience/giz002. [DOI] [PMC free article] [PubMed] [Google Scholar]
- 13.Liu B., Huang X., Wang Y., Chen X., Gao X. BETA: A large benchmark database toward SSVEP-BCI application. Front. Neurosci. 2020;14:627. doi: 10.3389/fnins.2020.00627. [DOI] [PMC free article] [PubMed] [Google Scholar]
- 14.Zhu F., Jiang L., Dong G., Gao X., Wang Y. An open dataset for wearable SSVEP-based brain-computer interfaces. Sensors. 2021;21:1256. doi: 10.3390/s21041256. [DOI] [PMC free article] [PubMed] [Google Scholar]
- 15.Chen X., Wang Y., Nakanishi M., Jung T.-P., Gao X. IEEE EMBC. 2014. Hybrid frequency and phase coding for a high-speed SSVEP-based BCI speller; pp. 3993–3996. [DOI] [PubMed] [Google Scholar]
- 16.Volosyak I., Moor A., Gräser A. In: Advances in Computational Intelligence, Part I. Cabestany J., Rojas I., Joya G., editors. 2011. A dictionary-driven SSVEP speller with a modified graphical user interface; pp. 353–361. [Google Scholar]
- 17.Cecotti H. A self-paced and calibration-less SSVEP- based brain–computer interface speller. IEEE Trans. Neural Syst. Rehabil. Eng. 2010;18:127–133. doi: 10.1109/TNSRE.2009.2039594. [DOI] [PubMed] [Google Scholar]
- 18.Hwang H.-J., Lim J.-H., Jung Y.-J., Choi H., Lee S.W., Im C.-H. Development of an SSVEP-based bci spelling system adopting a QWERTY-style LED keyboard. J. Neurosci. Methods. 2012;208:59–65. doi: 10.1016/j.jneumeth.2012.04.011. [DOI] [PubMed] [Google Scholar]
- 19.Li M., He D., Li C., Qi S. Brain–computer interface speller based on steady-state visual evoked potential: A review focusing on the stimulus paradigm and performance. Brain Sci. 2021;11:450. doi: 10.3390/brainsci11040450. [DOI] [PMC free article] [PubMed] [Google Scholar]
- 20.Choi G.-Y., Han C.-H., Jung Y.-J., Hwang H.-J. A multi-day and multi-band dataset for a steady-state visual-evoked potential–based brain-computer interface. GigaScience. 2019;8 doi: 10.1093/gigascience/giz133. [DOI] [PMC free article] [PubMed] [Google Scholar]
- 21.Gu M., Pei W., Gao X., Wang Y. An open dataset for human ssveps in the frequency range of 1-60 hz. Sci. Data. 2024;11:196. doi: 10.1038/s41597-024-03023-7. [DOI] [PMC free article] [PubMed] [Google Scholar]
- 22.Mu J., Liu S., Burkitt A.N., Grayden D.B. Multi-frequency steady-state visual evoked potential dataset. Sci. Data. 2024;11:26. doi: 10.1038/s41597-023-02841-5. [DOI] [PMC free article] [PubMed] [Google Scholar]
- 23.Benda M., Volosyak I. Comparison of different visual feedback methods for SSVEP-based BCIs. Brain Sci. 2020;10:240. doi: 10.3390/brainsci10040240. [DOI] [PMC free article] [PubMed] [Google Scholar]
- 24.Wu C.-H., Lakany H. The Fourth International Conference on Advanced Cognitive Technologies and Applications: COGNITIVE 2012. 2012. Impact of stimulus configuration on steady state visual evoked potentials (SSVEP) response; pp. 77–82. [Google Scholar]
- 25.Zheng W.L., Lu B.L. Investigating critical frequency bands and channels for eeg-based emotion recognition with deep neural networks. IEEE Trans. Auton. Ment. Dev. 2015;7:162–175. [Google Scholar]
- 26.Zheng W.-L., Liu W., Lu Y., Lu B.-L., Cichocki A. Emotionmeter: A multimodal framework for recognizing human emotions. IEEE Trans. Cybern. 2019;49:1110–1122. doi: 10.1109/TCYB.2018.2797176. [DOI] [PubMed] [Google Scholar]
- 27.Katsigiannis S., Ramzan N. Dreamer: A database for emotion recognition through eeg and ecg signals from wireless low-cost off-the-shelf devices. IEEE J. Biomed. Health Inform. 2018;22:98–107. doi: 10.1109/JBHI.2017.2688239. [DOI] [PubMed] [Google Scholar]
- 28.Koelstra S., Muhl C., Soleymani M., Lee J.-S., Yazdani A., Ebrahimi T., Pun T., Nijholt A., Patras I. Deap: A database for emotion analysis; using physiological signals. IEEE Trans. Affect. Comput. 2012;3:18–31. [Google Scholar]
- 29.Soleymani M., Lichtenauer J., Pun T., Pantic M. A multimodal database for affect recognition and implicit tagging. IEEE Trans. Affect. Comput. 2012;3:42–55. [Google Scholar]
- 30.Miranda-Correa J.A., Abadi M.K., Sebe N., Patras I. Amigos: A dataset for affect, personality and mood research on individuals and groups. IEEE Trans. Affect. Comput. 2021;12:479–493. [Google Scholar]
- 31.Brainard D.H., Vision S. The psychophysics toolbox. Spatial Vis. 1997;10:433–436. [PubMed] [Google Scholar]
- 32.Chen X., Chen Z., Gao S., Gao X. A high-ITR SSVEP-based BCI speller. Brain Comput. Interfaces. 2014;1:181–191. [Google Scholar]
- 33.Manyakov N.V., Chumerin N., Robben A., Combaz A., van Vliet M., Van Hulle M.M. Sampled sinusoidal stimulation profile and multichannel fuzzy logic classification for monitor- based phase-coded SSVEP brain–computer interfacing. J. Neural. Eng. 2013;10 doi: 10.1088/1741-2560/10/3/036011. [DOI] [PubMed] [Google Scholar]
- 34.Delorme A., Makeig S. EEGLAB: an open source toolbox for analysis of single-trial EEG dynamics including independent component analysis. J. Neurosci. Methods. 2004;134:9–21. doi: 10.1016/j.jneumeth.2003.10.009. [DOI] [PubMed] [Google Scholar]
- 35.Wolpaw J.R., Birbaumer N., McFarland D.J., Pfurtscheller G., Vaughan T.M. Brain–computer interfaces for communication and control. Clin. Neurophysiol. 2002;113:767–791. doi: 10.1016/s1388-2457(02)00057-3. [DOI] [PubMed] [Google Scholar]
Associated Data
This section collects any data citations, data availability statements, or supplementary materials included in this article.
Data Availability Statement
-
•
De-identified data, permanently unlinked from all personal identifiable information (PII), were used in the present study. These data is publicly accessible at GitHub: https://github.com/MULT-SA-SSVEP-Paradigm.
-
•
All original code has been deposited at GitHub: https://github.com/MULT-SA-SSVEP-Paradigm, and is publicly available as of the date of publication.
-
•
Any additional information required to reanalyze the data reported in this paper is available from the lead contact upon request.