

Summary
Plastic changes in the brain are primarily limited to early postnatal periods. Recovery of adult brain plasticity is critical for the effective development of therapies. A brief (1–2 weeks) duration of visual deprivation (dark exposure, DE) in adult mice can trigger functional plasticity of thalamocortical and intracortical circuits in the primary auditory cortex suggesting improved sound processing. We tested if DE enhances the ability of adult mice to detect sounds. We trained and continuously evaluated the behavioral performance of mice in control and DE conditions using automated home-cage training. Consistent with age-related peripheral hearing loss present in C57BL/6J mice, we observed decreased performance for high-frequency sounds with age, which was reduced by DE. In CBA mice with preserved peripheral hearing, we also found that DE showed modest auditory performance improvements in low and mid frequencies over time compared to the control.
Subject areas: Behavioral neuroscience, Cellular neuroscience, Sensory neuroscience
Graphical abstract
Highlights
-
•
Dark exposure boosts performance on auditory detection in both CBA/CaJ and C57BL/6J mice
-
•
In CBA/CaJ mice DE facilitates the improvement across low to mid frequency ranges
-
•
In C57BL/6J mice DE attenuates the progressive age-dependent high-frequency hearing loss
Behavioral neuroscience; Cellular neuroscience; Sensory neuroscience
Introduction
Plastic changes in the brain are primarily limited to early postnatal periods and have been mainly studied within the same modality. Crossmodal plasticity refers to neural plasticity that allows adaptation to the loss of a sensory modality. Sensory modality loss can occur during pathological states of the peripheral sensory systems, such as loss of hair cells in the cochlea, resulting in deafness, or damage of the eyes resulting in blindness.1,2,3,4 Crossmodal plasticity is thought to underlie the enhanced auditory abilities of the early- 1,5,6,7,8 and late-blind.7,9 Several circuit-level plasticity changes have been observed in adult mice with temporary visual deprivation (dark exposure, DE). DE in adult mice has profound effects on the primary auditory cortex, such as strengthening of thalamocortical synapses,10 refinement of excitatory and inhibitory intracortical circuits,11,12,13 and selective reduction of thalamic-reticular nucleus-mediated inhibition of the auditory thalamus.14 These circuit changes correlate with changes in the sound-evoked responses, such as reduced thresholds, increased gain, increased frequency selectivity,10 and decorrelation of spatiotemporal population responses,15 which together should lead to increased coding fidelity. We thus investigated if DE leads to improved auditory ability.
To understand the effects of DE on auditory processing, we placed 48 C57BL/6J and 48 CBA/CaJ mice in home cages fitted with an automated auditory behavior system (“ToneBox”) that allowed continuous long-term observation (Figure 1A).16,17 To test the effects of DE, we take advantage of both the C57BL/6J mouse strain that develops progressive hearing loss with age as well as CBA/CaJ mice that retain normal hearing.18,19,20,21,22,23,24 Using the C57BL/6J strain enables us to test the effects of DE on hearing frequency bands with normal (low and mid frequencies) and reduced complement of hair cells (high-frequencies) as it occurs with normal aging.
Figure 1.

DE reduces loss of detection performance for high-frequency tones
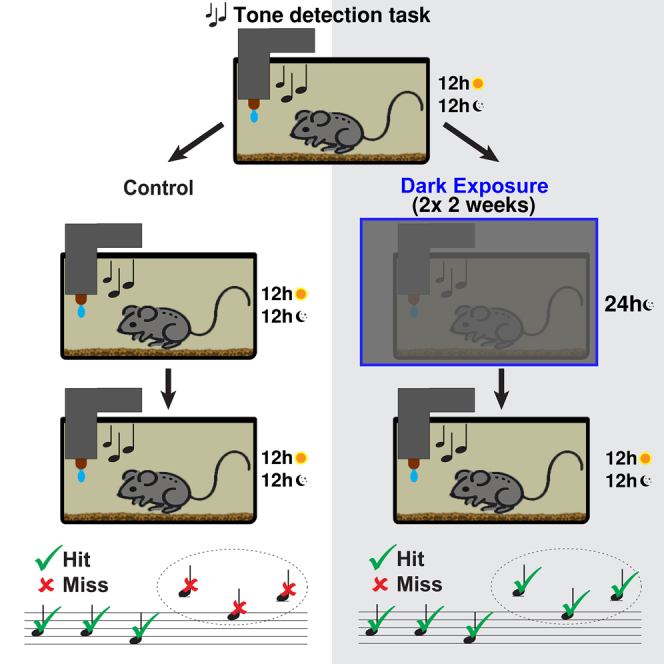
(A) Automated home-cage training system with ToneBox. Tones are randomly presented from 4 to 40 kHz and 30–65 dB amplitude. Three animals were placed in each training cage, either C57BL/6J or CBA/CaJ mice. These groups are labeled with a crossed-out ear pictogram accompanied by text C57 for the C57BL/6J group and a non-crossed-out ear pictogram accompanied by text CBA/CaJ to label the CBA/CaJ group. This notation is used for all figures.
(B) Example performance during one week. Gray bars indicate the hit rate within each hourly time bin.
(C) 8 ToneBoxes under control 12h/12h light/dark conditions or during DE.
(D) Experimental timeline. DE cohort receives two 2-week DE periods (II & IV). Animals begin the Habituation and Shaping phase at postnatal day 63 (P63).
(E and F) Moving average hit rates for 40 kHz or all other tones for C57BL/6J CT and DE groups (N = 8 for both) Thick lines show group mean, shaded areas represent SEM. The black line in (E) on day 70 shows the difference between the two observed means and this difference is statistically significant (t-test, p < 0.05). Data averaged over all sound amplitude levels (G and H) same as in (E, F) but for CBA/CaJ CT and DE groups (N = 8 for both).
Once placed in the ToneBox, mice received a water reward for detecting tones from the ToneBox speaker. After the tone was presented, mice had a reward window to lick the ToneBox water spout. Licking was detected with a capacitive sensor. By placing multiple animals in the cage, we avoided the effects of social isolation. Mice lived and performed the task in the cage with no interaction with humans for the duration of the experiment, except for biweekly bedding change. In the ToneBox, we continuously presented 88 different combinations of different sound frequencies (11 total tones) and sound amplitudes (8 total amplitudes), which enabled us to construct long-term “performance audiograms.” Figure 1B shows an example of a typical week-long timeline of hit activity showing, as expected, that mice were active in the dark cycle.
Results
DE reduces the decline in performance in the high-frequency band of C57BL/6J mice
Mice were 63 days old at the start of the experiment. We divided the mice of both C57BL/6J and CBA/CaJ lines into two groups respectively: Control (CT) and DE (8 ToneBoxes, 24 mice per group) (Figure 1C). Male and female cages were distributed equally in each experimental group. Sex differences were not investigated due to low statistical power yielding from 4 cages per group per sex. Mice were placed into the ToneBoxes for an initial 14-day habituation and shaping phase to stabilize their performance (Figure 1D). We divided the following 70-day-long experiment timeline into five periods. Period I was 7 days-long while Periods II, III, IV, and V were 14 days-long. Periods I, III, and V were under a typical 12-h light/dark cycle for both experimental groups. In periods II and IV, the DE group was hermetically sealed from the room light, while the CT group remained in the normal Light/Dark cycle. Normal circadian rhythm was present throughout the experiment, including DE periods. Example recordings of hit rates from the complete 77-day-long timeline are shown for all four groups: the C57BL/6J CT, CBA/CaJ CT, C57BL/6J DE, and CBA/CaJ DE groups (Figure S1).
In CT C57BL/6J ToneBoxes, we noticed that the hourly hit rates show a decrease in performance for the highest frequency band (40 kHz) with increasing age (Figure 1E). We performed a spot test on day 70 of the 40 kHz band against performance from all other frequency bands and the difference was statistically significant (t-test, p = 0.0273). This decreased performance is consistent with the development of age-related hearing loss in these mice due to peripheral hearing loss.18,19,20 Based on ABR measurements,18,19,20 the onset of hearing loss in C57BL/6J mice in the high frequencies is approximately at the start of Period II (Postnatal day 84, P84), consistent with the decreased performance we observed. In contrast, DE C57BL/6J ToneBoxes did not show decreased performance at high frequencies and only showed a slight decline later in the experimental timeline (Figure 1F). This delay in decline will be described below in detail. At day 70 performance was similar between groups (t-test, p = 0.65). Consistent with preserved peripheral hearing in CBA/CaJ mice, the 40 kHz band did not show any decline with age, and groups performed similarly at day 70 (t-test, p = 0.82 for CBA/CaJ CT, p = 0.98 for CBA/CaJ DE) (Figures 1G and 1H). These observations suggest that the DE periods in visually deprived animals reduced the decline of the processing of high-frequency sounds in C57BL/6J mice.
DE increases tone detection performance in CBA/CaJ and C57BL/6J mice
To first identify how animal performance varied with frequency and amplitude and to investigate whether DE affected the frequency and amplitude (FxA)-dependent hit rate, we calculated the ratio of hit rates between the first vs. last period hit rates for each FxA bin. We first plotted these heatmaps for C57BL/6J CT and DE groups (Figure 2A). In the CT C57BL/6J group, the hit rates decreased for the whole high-frequency band across sound amplitudes (Figure 2A, black arrows, 32 & 40 kHz all SPL levels). This decline in performance occurs in a similar frequency band as age-related hearing loss reported in C57BL/6J mice of this age.19 In contrast, such decreased performance was not present in the C57BL/6J DE group. These results suggest that DE attenuates the high-frequency-specific decline of detection performance in C57BL/6J mice.
Figure 2.

DE causes broad increases in performance in CBA/CaJ and C57BL/6J mice
(A) Rate-of-change audiograms for the CT (Left) and DE (Right) C57BL/6J groups. Black arrows indicate the area of high-frequency band performance which significantly deteriorated throughout the experiment.
(B) Bar plot showing the average change of total period hit rates between periods I and V. Red C57BL/6J CT, Blue DE C57BL/6J group. Bar plots show group means, while black lines indicate SEM. ‘n.s’, ‘∗’, indicate statistical significance (t-test, non-significant, p < 0.05 respectively).
(C) Rate-of-change audiograms for the CT (Left) and DE (Right) CBA/CaJ groups.
(D) Same as in B, but for CBA/CaJ CT and CBA/CaJ DE groups.
(E) Scatter points show hit rate ratios for 8 kHz and 40 kHz as a function of amplitude in the C57BL/6J CT (red) and DE (blue) groups between Periods I and V. Scatter points indicate group means, while vertical lines show SEM. Scatter points are overlapped with linear regression model fit in matching colors. Shaded areas are 95% confidence intervals of the fit. Intercept (IC) or slope (SL) Difference appears if the p-value of the F-test showed significance for either parameter of the group difference linear fit model (F-test, Benjamini-Hochberg false discovery rate procedure applied. Only statistically significant p-values are annotated: ∗ for p < 0.05, & ∗∗ for p < 0.01). Dashed black horizontal lines outline an NHR level of 1 (Where mean performance in both periods was the same) (F) Same as in (E) but for CBA/CaJ CT and DE groups.
We next investigated if there was an overall decreased performance in CT C57BL/6J mice compared to DE mice. We calculated the total hit rates by merging all FxA bins in a given period, which gave us a rough measure of change in overall tone detection performance, independent of the tested stimulus (Figure 2B). The changes in total hit rates in CT and DE C57BL/6J mice were similar (CT: −0.53% ± 10.06% SEM, DE: +2.91% ± 2.19% SEM, t-test, p = 0.7428). This indicates that the overall performance of CT and DE mice was similar. Given that hit rates decreased for high frequencies in CT mice, this suggests that CT mice have relatively more hits at lower frequencies. In contrast, in C57BL/6J DE mice high-frequency performance is preserved.
We next analyzed the rate-of-change audiograms for the CBA/CaJ CT and DE groups (Figure 2C). In contrast to C57BL/6J mice, CT CBA/CaJ mice do not show decreased performance at high frequencies. Frequency-level hit rate change functions suggested hit rates may have increased in the DE group in the low to mid frequencies (Figure 2C). Group hit rates increased by +9.00% ± 4.60% SEM while in the CBA/CaJ CT group hit rates decreased by −4.15% ± 6.49% (Figure 2D; t-test, p = 0.1205). While this difference is not significant when summed over the whole frequency spectrum, qualitative inspection suggests that the frequency band-specific performance in low and mid frequencies is enhanced by DE.
To examine band-specific performance for both C57BL/6J and CBA/CaJ groups in detail we analyzed the relationship between sound amplitude and hit rates in each frequency band. All trials for the C57BL/6J CT group were first binned based on the sound amplitude parameter, and the global correlation coefficient was calculated to be 0.9679 ± 0.0058 SEM, while the remaining three groups followed a similar pattern. We thus used linear regression analysis to test whether the slope (gain, abbr. SL) of this relationship and/or baseline performance (intercept, abbr. IC) is changed after DE for C57BL/6J mice (Figure 2E) and CBA/CaJ mice (Figure 2F). We used linear regression model fitting to estimate the parameters of the linear fit for each frequency band and each group. These linear fit estimates, together with 95% confidence intervals (CI) are shown as lines in respective colors (fit) and 95% CI as shaded areas for plots in both subpanels. To determine if these model estimates differ, the difference between the two groups was also fitted and tested for the significance of parameters using a Multiple comparison correction (Bejnamini & Hochberg false discovery rate procedure25). In Figures 2E and 2F, we plot results for 8 kHz and 40 kHz bands, and the statistics for the remaining frequency bands are given in Table S1. First, this analysis confirms our visual observation of a major decline in the 40 kHz band for the C57BL/6J group in Figure 2A where IC of CT and DE fits differed significantly (F-test, p = 0.0027). Secondly, the frequency band-specific comparisons for CBA/CaJ mice show differences in the intercept parameter between the two groups for several low- and mid-frequency bands (4 kHz: p = 0.0115; 6.3 kHz: p = 0.0014; 8 kHz shown in Figure 3B: p = 0.0079; 10 kHz: p = 0.0005; 12.5 kHz: p = 0.0107; 16 kHz: p = 0.0071; 25.0 kHz: p = 0.0107; all other n.s. bands in Table S1). These rate-of-change audiograms suggest that DE increased the total period hit rate across a broad frequency range in CBA/CaJ mice.
Figure 3.

Rescuing effects of DE emerge in Period 3 of the C57BL/6J group
(A) (Left axis) Normalized hit rates for 4 kHz, 8 kHz, and 40 kHz tones for CT C57BL/6J (red) and DE C57BL/6J (blue) ToneBoxes. Data averaged over all SPL levels. Thick lines show the group mean, while the shaded error bar represents the SEM. Red and blue arrowheads in the right panel for 40 kHz mark the point in the timeline (days 45 and 57) where mean NHR deviated from the baseline by two standard deviations for CT and DE groups respectively. (Right axis) The absolute value of t-statistic from a two-sample t-test, if the t-test was performed at a given point in time. Green bars show data points of statistical significance (t-test, p < 0.05).
(B) Same as in (A), but for the CBA/CaJ CT and DE groups.
Together, these results suggest that DE increases performance on an auditory detection task in both CBA/CaJ and C57BL/6J mice. However, the details in which DE benefits audition seem to differ between the two models: We hypothesize that in CBA/CaJ mice with preserved hearing DE facilitates the improvement of tone detections across low to mid frequency ranges where 7 out of 11 measured frequencies showed significant improvement, while in C57BL/6J DE allows compensation to attenuate the age-dependent high-frequency hearing loss.
DE delays the effects of age-related hearing loss in C57BL/6J mice by 12 days
Our results suggest that C57BL/6J DE mice have higher behavioral performance at high sound frequencies compared to CT at the end of our experimental time window. We next aimed to identify the detailed behavioral time courses of these performance differences. We thus analyzed the changes in the sound-frequency-dependent performance in the CT and DE groups over time. For each ToneBox we calculated the normalized hit rate (NHR) for each stimulus (frequency & amplitude, FxA) condition in each hourly time bin for the entire 63 days of the experiment. We normalized the stimulus-specific (FxA) hit rates to the total hit rate of a given ToneBox for the same period across all conditions, meaning that the ToneBox with the normalized hit rate of 1 for a given FxA band had the same hit rate as all the FxA bands combined. This normalization enabled us to investigate the distribution of hit preference and ability across the sound spectrum. To minimize the effects of the 24-h circadian rhythm, we averaged these normalized hit rates for both the CT and DE groups with a moving 168-h window. NHR activity for C57BL/6J mice is shown for 4, 8, and 40 kHz bands (Figure 3A) and all remaining frequency bands (Figure S2A). In C57BL/6J CT cages, a drop of the NHR for the 40 kHz band is present starting around Day 40. In the C57BL/6J DE group, a much weaker drop is present at much older ages (Figure 3A, right). To better define this difference in the onsets of performance decline for CT and DE groups, we defined the onset of decline as the first day when mean performance drops two standard deviations below baseline performance from period I. Respective days are labeled with colored arrows on the x axis. This difference turned out to be 12 days (Day 45 vs. 57). For the 4 kHz and 8 kHz bands, no decreases in NHR were observed. Thus, DE delays the development of the behavioral effects of high-frequency hearing loss in C57BL/6J mice. Notably, significant differences in the 8 kHz band were observed during period one around days 14–20. This was likely due to group fluctuations in the shaping phase and these differences ceased after day 20. Lastly, there was an increased preference for 4 and 6.3 kHz bands in the CT group (Figure S2) that occurred at the same time as the decline of the 40 kHz band of this group. As discussed above, these increases were likely the compensation for lost ability in the 40 kHz band.
In contrast to C57BL/6J mice, CBA/CaJ mice do not suffer from any systemic peripheral hearing loss at this age. Consistent with this, our analysis shows that CBA/CaJ CT and DE mice do not show differences in NHR in the 4, 8, and 40 kHz bands (Figure 3B) and all other frequencies (Figure S2B). These results confirm that frequency preferences in CBA/CaJ mice did not change with DE as was the case in the C57BL/6J group. Thus, the increase in absolute hit rates we observe in CBA/CaJ mice (Figures 2C and 2D) is relatively widespread across the frequency spectrum.
Together, these results support our hypothesis that DE selectively increases the relative performance of C57BL/6J mice at high frequencies while providing a more general benefit across a range of low to mid frequency spectra in CBA/CaJ mice.
The effect of DE on performance is present across sound amplitudes
So far, we have lumped the performance at all sound amplitudes. We next evaluated if the increased performance of C57BL/6J DE mice was present at all sound amplitudes. We thus computed performance audiograms. We averaged cage NHRs for each period and plotted smoothed heatmaps for Period I and V of the C57BL/6J CT and DE groups (Figure 4A; see Figure S3 for data from all periods). The interquartile range (IQR) contours for high-frequency bands differ between C57BL/6J CT and C57BL/6J DE, and the CT group shows a shift of the IQR contours toward lower frequencies. To evaluate this further, we plotted the ratios of C57BL/6J DE vs. CT NHR (Figure 4A bottom). The results from the C57BL/6J group indicate that DE effects are present across high-frequency bands (32 and 40 kHz). A similar analysis from the CBA/CaJ group shows very stable audiograms where the contours of the audiograms of the NHRs are nearly identical for Periods I and V (Figure 4B; see Figure S4 for data from all periods). This is also visible in the ratios of CBA/CaJ DE vs. CBA/CaJ CT NHR (Figure 4B bottom) where only minor differences are observed. We will next quantify these differences in detail.
Figure 4.

Frequency-amplitude-dependent performance is not altered by DE in CBA/CaJ mice
(A) Normalized mean hit rate audiograms for all stimulus conditions for periods I (left) and V (right) of the C57BL/6J CT group (upper row) and C57BL/6J DE group (middle row). Dashed lines indicate quartiles of smoothed NHR. Red IQR lines for the DE group are plotted as CT reference. (lower row) The ratio of normalized mean hit rates between CT and DE C57BL/6J.
(B) Same as in (A) but for the CBA/CaJ CT and DE groups.
DE enhancement across performance levels suggested that DE had effects across tone amplitudes. We thus next investigated the DE enhancement effect in the amplitude domain by plotting the NHRs of the FxA bands along the amplitude dimension for two frequency bands of the C57BL/6J group from the period I and V: 8 and 40 kHz, comparing the relationship between sound amplitude and NHR with our linear regression model as previously done on raw hit rate rations in Figures 2E and 2F (Figure 5A; see Figure S5A for data from all periods and frequencies).
Figure 5.

DE performance increases are multiplicative across levels
(A) Scatter points show normalized hit rates for 8 kHz and 40 kHz as a function of amplitude in the C57BL/6J CT (red) and DE (blue) group during Period I (left column) and Period V (right column). Scatter points indicate group means, while vertical lines show SEM. Scatter points are overlapped with linear regression model fit in matching colors. Shaded areas are 95% confidence intervals of the fit. Intercept (IC) or slope (SL) Difference appears if the p-value of the F-test showed significance for either parameter of the group difference linear fit model (F-test, Benjamini-Hochberg false discovery rate procedure applied. Only statistically significant p-values are annotated: ∗ for p < 0.05, & ∗∗ for p < 0.01). Dashed black horizontal lines outline an NHR level of 1.
(B) Same as in (A) but for CBA/CaJ CT and DE groups.
As can be seen from Figure S5A and Table S1, the significance of the difference between CT and DE groups for C57BL/6J mice is restricted to only 4 cases, 8 kHz band in Period I that likely originated in group-wide fluctuations of performance in late days of the training (F-test, p = 0.0465), 40 kHz band for Period IV and V that signifies the rescuing effects of DE on 40 kHz band (F-test, P.IV: p = 0.0003; P.V: p < 0.0001, and, lastly, 4 kHz band in Period V which is compensatory effect of lost performance in the 40 kHz band during the same period. For the last case, the slope parameter was also significant, meaning that CT mice increased their 4 kHz band performance with increased gain compared to the DE group (F-test, IC: p = 0.0082; SL: p = 0.0117). In contrast, the CBA/CaJ group revealed no significant differences between the two models (Figures 5B and S5) for any frequency band or period (See Table S1).
The effect of DE emerges gradually
We next investigated in detail the time course of the effects of DE. We thus generated NHR across the experimental periods for all stimulus combinations for both the C57BL/6J CT, C57BL/6J DE, CBA/CaJ CT, and CBA/CaJ DE groups and consequently plotted the ratios of CT vs. DE for both the C57BL/6J group (Figure 6A) and CBA/CaJ group (Figure 6B). This analysis shows that the onset of DE enhancement for the C57BL/6J group emerged around day 40 for the softest high-frequency sounds and that improvements in the 32 kHz bin emerged at around day 60. Given that day 40 was between our first and second DE periods, these data suggest that the first DE period could already have a long-lasting effect on tone detection performance.
Figure 6.

DE performance for quietest high-frequency tones increases after the first DE period
(A) The ratio of mean hit rates between CT and DE for all stimulus combinations of the C57BL/6J group. Arrows: Differences for 40 kHz emerge after day 40, while differences for 32 kHz emerge around day 65. Dashed vertical lines mark the individual periods.
(B) Same as in (A) but for the CBA/CaJ group.
To test if a single period of DE could have a preventative effect, we trained an additional cohort of C57BL/6J animals starting at P84 up to P140 (4 cages). Then, we performed two weeks of DE timed to match Period IV in a postnatal reference. A single period of DE also resulted in preventing the decreased performance in the 40 kHz band (Figure S6). Thus, a single period of DE was able to reduce the effect of age-related hearing loss.
Discussion
Our results show that temporary visual deprivation via DE in adults enhances the behavioral performance of C57BL/6J mice in tone detection tasks in high-frequency bands where the effects of age-related hearing loss are usually evident. Additionally, we observed modest increases in the performance of low and mid frequencies in CBA/CaJ mice that do not suffer from any systemic hearing loss at this age.
Our automated design allowed us to gather hundreds of thousands of trials per cage. Because of the minimalistic impact of the experiment design on mice’s daily routine, we eliminated several confounds commonly appearing in rodent behavior studies, such as repeated handling of animals.26 The hearing of both C57BL/6J and CBA/CaJ mouse lines was previously studied extensively by several methods, most notably auditory brainstem response (ABR).19,20,22 Threshold intensity shifts caused by age-related hearing loss in C57BL/6J mice were observed as early as P30.27 While we did not measure the ABRs of individual mice, our experimental design minimized variability. First, we used large cohorts of animals enabled by our automatic system. Second, all animals were subject to the same developmental conditions until they were distributed to two experimental groups at the same age (P63) before the start of the experiment. Third, animals were group-housed in the ToneBox, thus each ToneBox recording represents a composite of the performances of the three individual mice within a given cage. This within-cage averaging further reduced the effect of the population variability on the hearing capabilities of individual animals.
While we here use a tone-detection task, the circuit and functional changes of DE are widespread and include the sharpening of tuning curves.10 We predict that DE affects a variety of auditory tasks. Indeed, training on auditory temporal discrimination tasks can also improve spectral tuning,28 suggesting that mechanisms engaged by training are affecting general sound processing. Given that DE has an effect on thalamic,14 thalamocortical,10 and intracortical11,12,13 auditory circuits we expect that performance in a variety of auditory tasks is improved. Our data show an enhancement of the performance at high frequencies in C57BL/6J mice. This enhancement is consistent with the increased number of neurons responsive to high frequencies after DE in C57BL/6J mice.15
C57BL/6J mice have early onset of age-related hearing loss – gradual age-related hearing loss, evident in ABRs, otoacoustic emissions, and startle behavior for the high-frequency range starting around 10 weeks of age.18,19,20 When mice reached an age corresponding to when high-frequency ABR hearing threshold shifts were evident in this strain,19 we observed a decline in performance in our operand conditioning task in the high-frequency band. We noted that control mice show an increase in the relative amount of hits to low frequencies, indicating that they shift their behavior to relatively “easier” stimuli to keep their water consumption constant. In contrast, DE mice showed better performance at high frequencies. What mechanism could underlie this improved performance? Hearing loss in C57BL/6J is caused by degeneration of the cochlea and this degeneration starts at high frequencies.22,23,24 Such degeneration results in reduced ascending sound-evoked activity and subsequently reduced activation of the auditory cortex for high-frequency stimuli.29 Mechanistically, our behavioral data could be explained by the circuit-level plasticity we reported in previous studies. DE induces an increase in the strength of auditory thalamocortical synapses,10 which can counteract the reduced afferent drive which leads to enhanced sensitivity and increased responsiveness to sound stimuli in the thalamocortical recipient layers of the auditory cortex.10 Consistent with the increase in thalamocortical synaptic gain, we observed that DE leads to a steep increase in firing rates with changes in sound amplitudes.10 Intracortical circuits and thalamic circuits can alter gain and adult DE has been shown to affect both. After DE, ascending and recurrent intracortical circuits change synaptic strength,11,12,13 and refine their connections, leading to a more efficient information transmission.12 In addition to changes on the cortical and thalamocortical level, DE reduces inhibition from the thalamic reticular nucleus to the auditory thalamus, enhancing the ascending transmission of sound information through the thalamus.14 DE could also have effects on spectral contrast tuning sensitivity.30 As previously shown, DE induces decorrelation of the sound-evoked population activity in A1 which can lead to increased encoding fidelity of represented stimuli in the cortex.15,31 Together, all these circuit changes, both at the thalamic and cortical levels, enhance the transmission of the weakened high-frequency ascending signals to the auditory cortex and lead to an increased representation of high-frequency tones in the auditory cortex after DE.15 This potentiation of the feedforward circuit and refinement of the intracortical circuit could allow better detection and sharper tuning needed to allow the processing of reduced auditory signals arising from age-related peripheral hearing loss. We reason that these extensive circuit changes compensate for decreased ascending drive and lead to the observed reduced behavioral performance declines after DE.
Studies investigating early and life-long visual deprivations have shown various functional and circuit changes that can give rise to improved auditory performance.32,33,34 We find that DE can also induce such changes in adult animals. The changes we see here with DE improved auditory behavior in a model of age-related hearing loss is consistent with the idea that the behavioral deficits in age-related hearing loss are not solely due to loss of inner hair cells in the cochlea but also due to changes in the brain. Indeed, the aging auditory cortex in CBA/CaJ mice that do not suffer from peripheral hearing loss also shows altered sound-evoked activity, such as increased correlations and reduced ability to control activity correlations.35,36 Our observation of increased hit rates in DE CBA/CaJ mice across low- and mid-frequencies is consistent with these findings.
In conclusion, this study suggests that the changes in central auditory processing lead to the increased ability of animals to perform auditory tasks after DE. Furthermore, our data collectively suggests that DE could be a potential method to reduce some of the effects of central aging and enhance the efficacy of auditory performance with cochlear implants. Subjecting human patients to visual deprivation for two weeks would be difficult and would require close monitoring to ensure safety. To improve translational impact, repeated short-term visual deprivation (e.g., blindfolding, or partial visual deprivation) spread out across longer periods could yield similarly impactful results. Whether our results translate to human subjects will require further investigation on the parametric space of visual deprivation.
Limitations of the study
This study was performed on mice. We do not know the exact protocol to visually deprive patients to achieve similar results in humans. We use a specific type of auditory task, tone detection, and are unable to determine whether and how the effects of DE translate when using different tasks for performance measurement. Our study is unable to evaluate sex-dependent effects due to an insufficiently large number of samples in each sex group.
Resource availability
Lead contact
Further information and requests for resources should be directed to and will be fulfilled by the lead contact, Patrick O. Kanold (pkanold@jhu.edu).
Materials availability
This study did not generate new unique reagents.
Data and code availability
-
•
Behavioral data have been deposited at the JHU Research Data Repository and are publicly available as of the date of publication. The DOI is listed in the key resources table.
-
•
All original code has been deposited at the JHU Research Data Repository and is publicly available as of the date of publication. The DOI is listed in the key resources table.
-
•
Any additional information required to reanalyze the data reported in this paper is available from the lead contact upon request.
Acknowledgments
We thank members of the Kanold lab for their comments on the manuscript.
We thank Dr. Behtash Babadi for his advice regarding interpreting the results of the manuscript.
Funding: Supported by NIH R01DC018790 (P.O.K., H.K.L.).
Author contributions
Conceptualization: P.O.K., H.K.L., and P.J.
Methodology: P.J. and P.O.K.
Software: P.J.
Validation: P.J. and P.O.K.
Formal Analysis: P.J.
Investigation: P.J.
Resources: P.O.K. and H.K.L.
Data Curation: P.J.
Writing – original draft: P.J. and P.O.K.
Writing – review and editing: P.J., H.K.L., and P.O.K.
Visualization: P.J. and P.O.K.
Supervision: P.O.K.
Project administration: P.J. and P.O.K.
Funding Acquisition: P.O.K. and H.K.L.
Declaration of interests
The authors declare no competing financial interests.
STAR★Methods
Key resources table
| REAGENT or RESOURCE | SOURCE | IDENTIFIER |
|---|---|---|
| Deposited data | ||
| Behavioral Data | This paper | https://doi.org/10.7281/T1/FQYJHJ |
| Experimental models: Organisms/strains | ||
| Mouse: C57Bl/6J | The Jackson Laboratory | Jax# 000664 |
| Mouse: CBA/CaJ | The Jackson Laboratory | Jax# 000654 |
| Software and algorithms | ||
| MATLAB | MathWorks | https://www.mathworks.com/ |
| Data analysis code | This paper | https://doi.org/10.7281/T1/FQYJHJ |
| Other | ||
| ToneBox behavioral chamber | Francis at al.16,17 | https://doi.org/10.1523/ENEURO.0121-19.2019 |
Experimental model and study participant details
Animals
60 (30m/30f) C57Bl/6J mice (Jackson Laboratory strain #000664) and 48 (24m/24f) CBA/CaJ mice (Jackson Laboratory strain #000654) were raised in a 12h light /12h dark cycle. At the beginning of postnatal week 10, mice were randomly allocated to the same-sex cages by the count of 3, and cages were placed in behavioral chambers for the initial training. Cage distribution to DE and CT groups was performed randomly and was done before the beginning of the experiment. All animals survived for the duration of the whole experiment. Food was provided ad libitum. The weight of the animals remained nominal throughout the duration of the experiment, similar to our previous studies.16,17 The bedding was changed before every period during the experiment (once every 14 days). Mice were checked for any injuries or effects of water restriction, such as skin turgor with no reports for the duration of the experiment. All protocols and procedures were approved by the Johns Hopkins Institutional Care and Use Committee.
Method details
ToneBox & sound calibration
We based our home-caged based behavior station on our previously published ToneBox design.16,17 The ToneBox is a device composed of a behavioral interface (BI) comprised of a 3D printed housing containing a speaker (PUI Audio, Inc., AS02708CO-WR-R), its amplifier (Adafruit, Mono 2.5W Class D Audio Amplifier, PAM8302), 3d printed lick spout, and the wiring cables for the delivery of the DC power supply, speaker analog signal, and the capacitance signal which is connected to the licking spout. This device is connected to the central control unit (CCU) outside of the enclosure box, composed of a Raspberry Pi computer (Raspberry Pi 3 Model B+), a custom-made GPIO PCB interface, including a capacitance sensor (Adafruit, AT42QT1010), and a USB sound card (Steinberg, UR12, 192 kHz sampling rate). The system operation is controlled by a Python script executed on the Raspberry PI. 8 ToneBoxes are located on a ToneBox rack, and the cluster of 8 Raspberry PIs is connected to a monitoring PC via an Ethernet switch. Once every 24 hours, data is transferred to the monitoring PC to evaluate the animals’ performance. Mice receive a water reward after successfully activating the capacitance sensor within 3 seconds of the tone onset. This is the only source of water, except for a burst of free water (equivalent to 50 hit trials) occurring every 17-19 hours. This free reward is intentionally desynchronized from the Circadian cycle and secures minimal survival water intake. The water burst also prevents clogging of the water lines and ensures reliable long-term water delivery.
The BI, CCU, and home cage were individually placed within a sound-attenuating chamber composed of a cabinet with a clear door and a ventilation fan. The chambers provide >20 dB attenuation between ToneBoxes for tones >1 kHz, allowing simultaneous auditory training.
Tones were generated and calibrated for each ToneBox using a custom-written Python script. There were 11 frequency levels between 4 and 40 kHz (1/3rd octave spacing: 4, 5, 6.3, 8, 10, 12.5, 16, 20, 25, 32, 40 kHz) and eight amplitude levels between 65 and 30dB SPL (5dB spacing), resulting in 88 different sound stimuli randomly presented through the speaker. Tones were calibrated using a pre-polarized ¼ inch microphone (Brüel and Kjær, TYPE 4944) and signal preamplifier (Brüel and Kjær, TYPE 1704-A-002). During calibration, a microphone was placed directly under the main axis of the ToneBox speaker, approximately at the height where mice heads would be located if standing under the device. A signal from the preamplifier was routed to the UR12 sound card and further processed in Raspberry Pi by a custom-written Python script. 65dB tones of each frequency were calibrated with a precision of ± 1dB SPL compared to the 1 kHz 94dB sound calibrator. The rest of the amplitude levels were attenuated by 5dB levels. A bandpass filter was applied to the recorded waveform before calculating sound RMS (root mean square) amplitude. The bandpass filter had high-pass and low-pass frequencies of 0.95 and 1.05 times the frequency of the tone currently calibrated.
The base Inter-trial interval was randomized between 17 and 21 seconds. However, if mice licked the water spout before the onset of the sound, the inter-trial timer reset to 0. This setting forces mice from random licking towards tone-detection behavior. Our behavioral system does not detect the performance of individual mice. Events from the Tonebox devices were saved as time-stamped events (30ms resolution, ∼33Hz sampling rate) locally to the flash drive of Raspberry PI. Sound ID, trial result, trial inter-trial intervals, and capacitance licking data were recorded for the duration of the experiment.
Next, we will clarify different values of raw hit rates in Figures 1B, 1E–1H, and S1. Figures 1B and S1 reported hit rates of ∼20-40/hour because they report a full performance, while Figures 1E–1H show frequency-dependent performance, thus on average these values are 1/11 of the full performance since 11 different frequencies are being tested.
Visual deprivation settings
On the day of switching from the 12h Light / 12h Dark setting to the 24h Dark Exposure setting, chambers were sealed from any light source by a triple barrier of blackout curtains made of high-density fabric material. First, chamber windows were sealed with the initial layer; then, a second layer was placed over the entire row of 4 chambers in each rack, followed by a final layer covering both rows combined and finally covering up the whole rack. Mice's licking behavior was monitored remotely, and no anomalies were detected in our experiments.
Quantification and statistical analysis
For the “continuous” timeline figures, we calculated histograms with 1h bins of hit counts () and trial counts () for each frequency x amplitude tone stimulus. We calculate the raw hit rate as
for a given time bin. Additionally, for the same 1h time bins, we calculate total hit counts () and total trial counts (), irrespective of the sound stimulus. We then calculate the normalization factor () for each bin as
The normalized hit rate () is then calculated as:
means that the cage performs at a given frequency x amplitude on average same as the time interval total hit rate. Values show increased frequency x amplitude performance, while values show performance that is lower than the total performance. To remove oscillations caused by the circadian rhythm, a moving average with a window of 168h (7 days) was applied. A similar computation was performed for the calculation of audiograms, except that time bins were increased to the duration of the whole period, which was 336h (7 days for Period I, 14 days for Period II-V).
For testing of statistical significance, we used a two-sample, two-tailed t-test, a=0.05, p>=0.05, p<0.05, p<0.01 labeled as “n.s.”, “∗”, and “∗∗” respectively, unless otherwise specified.
We used linear regression model fitting to estimate the parameters of the linear fit for each frequency band and each group in Figures 2, 5, and S5. These linear fit estimates, together with 95% confidence intervals (CI) are shown as lines in respective colors (fit) and 95% CI as shaded areas for plots in both subpanels. To determine if these model estimates differ, the difference between the two groups was also fitted and tested for the significance of parameters using a Multiple comparison correction (Benjamini-Hochberg false discovery rate procedure25). We list these FDR-corrected p-values in the Table S1.
Published: September 21, 2024
Footnotes
Supplemental information can be found online at https://doi.org/10.1016/j.isci.2024.110936.
Supplemental information
References
- 1.Ashmead D.H., Wall R.S., Ebinger K.A., Eaton S.B., Snook-Hill M.M., Yang X. Spatial hearing in children with visual disabilities. Perception. 1998;27:105–122. doi: 10.1068/p270105. [DOI] [PubMed] [Google Scholar]
- 2.Sabourin C.J., Merrikhi Y., Lomber S.G. Do blind people hear better? Trends Cognit. Sci. 2022;26:999–1012. doi: 10.1016/j.tics.2022.08.016. [DOI] [PubMed] [Google Scholar]
- 3.Singh A.K., Phillips F., Merabet L.B., Sinha P. Why Does the Cortex Reorganize after Sensory Loss? Trends Cognit. Sci. 2018;22:569–582. doi: 10.1016/j.tics.2018.04.004. [DOI] [PMC free article] [PubMed] [Google Scholar]
- 4.Teichert M., Bolz J. How Senses Work Together: Cross-Modal Interactions between Primary Sensory Cortices. Neural Plast. 2018;2018 doi: 10.1155/2018/5380921. [DOI] [PMC free article] [PubMed] [Google Scholar]
- 5.Dufour A., Gérard Y. Improved auditory spatial sensitivity in near-sighted subjects. Brain Res. Cogn. Brain Res. 2000;10:159–165. doi: 10.1016/s0926-6410(00)00014-8. [DOI] [PubMed] [Google Scholar]
- 6.Lessard N., Paré M., Lepore F., Lassonde M. Early-blind human subjects localize sound sources better than sighted subjects. Nature. 1998;395:278–280. doi: 10.1038/26228. [DOI] [PubMed] [Google Scholar]
- 7.Voss P., Lassonde M., Gougoux F., Fortin M., Guillemot J.P., Lepore F. Early- and late-onset blind individuals show supra-normal auditory abilities in far-space. Curr. Biol. 2004;14:1734–1738. doi: 10.1016/j.cub.2004.09.051. [DOI] [PubMed] [Google Scholar]
- 8.Gougoux F., Lepore F., Lassonde M., Voss P., Zatorre R.J., Belin P. Neuropsychology: pitch discrimination in the early blind. Nature. 2004;430:309. doi: 10.1038/430309a. [DOI] [PubMed] [Google Scholar]
- 9.Holig C., Focker J., Best A., Roder B., Buchel C. Crossmodal plasticity in the fusiform gyrus of late blind individuals during voice recognition. Neuroimage. 2014;103:374–382. doi: 10.1016/j.neuroimage.2014.09.050. [DOI] [PubMed] [Google Scholar]
- 10.Petrus E., Isaiah A., Jones A.P., Li D., Wang H., Lee H.K., Kanold P.O. Crossmodal induction of thalamocortical potentiation leads to enhanced information processing in the auditory cortex. Neuron. 2014;81:664–673. doi: 10.1016/j.neuron.2013.11.023. [DOI] [PMC free article] [PubMed] [Google Scholar]
- 11.Petrus E., Rodriguez G., Patterson R., Connor B., Kanold P.O., Lee H.K. Vision loss shifts the balance of feedforward and intracortical circuits in opposite directions in mouse primary auditory and visual cortices. J. Neurosci. 2015;35:8790–8801. doi: 10.1523/JNEUROSCI.4975-14.2015. [DOI] [PMC free article] [PubMed] [Google Scholar]
- 12.Meng X., Kao J.P.Y., Lee H.K., Kanold P.O. Visual Deprivation Causes Refinement of Intracortical Circuits in the Auditory Cortex. Cell Rep. 2015;12:955–964. doi: 10.1016/j.celrep.2015.07.018. [DOI] [PMC free article] [PubMed] [Google Scholar]
- 13.Meng X., Kao J.P.Y., Lee H.K., Kanold P.O. Intracortical Circuits in Thalamorecipient Layers of Auditory Cortex Refine after Visual Deprivation. eNeuro. 2017;4 doi: 10.1523/ENEURO.0092-17.2017. [DOI] [PMC free article] [PubMed] [Google Scholar]
- 14.Whitt J.L., Ewall G., Chakraborty D., Adegbesan A., Lee R., Kanold P.O., Lee H.K. Visual Deprivation Selectively Reduces Thalamic Reticular Nucleus-Mediated Inhibition of the Auditory Thalamus in Adults. J. Neurosci. 2022;42:7921–7930. doi: 10.1523/JNEUROSCI.2032-21.2022. [DOI] [PMC free article] [PubMed] [Google Scholar]
- 15.Solarana K., Liu J., Bowen Z., Lee H.K., Kanold P.O. Temporary Visual Deprivation Causes Decorrelation of Spatiotemporal Population Responses in Adult Mouse Auditory Cortex. eNeuro. 2019;6 doi: 10.1523/ENEURO.0269-19.2019. [DOI] [PMC free article] [PubMed] [Google Scholar]
- 16.Francis N.A., Bohlke K., Kanold P.O. Automated Behavioral Experiments in Mice Reveal Periodic Cycles of Task Engagement within Circadian Rhythms. eNeuro. 2019;6 doi: 10.1523/ENEURO.0121-19.2019. [DOI] [PMC free article] [PubMed] [Google Scholar]
- 17.Francis N.A., Kanold P.O. Automated Operant Conditioning in the Mouse Home Cage. Front. Neural Circ. 2017;11:10. doi: 10.3389/fncir.2017.00010. [DOI] [PMC free article] [PubMed] [Google Scholar]
- 18.Parham K. Distortion product otoacoustic emissions in the C57BL/6J mouse model of age-related hearing loss. Hear. Res. 1997;112:216–234. doi: 10.1016/s0378-5955(97)00124-x. [DOI] [PubMed] [Google Scholar]
- 19.Ison J.R., Allen P.D., O'Neill W.E. Age-related hearing loss in C57BL/6J mice has both frequency-specific and non-frequency-specific components that produce a hyperacusis-like exaggeration of the acoustic startle reflex. J. Assoc. Res. Otolaryngol. 2007;8:539–550. doi: 10.1007/s10162-007-0098-3. [DOI] [PMC free article] [PubMed] [Google Scholar]
- 20.Zhang Q., Liu H., McGee J., Walsh E.J., Soukup G.A., He D.Z.Z. Identifying microRNAs involved in degeneration of the organ of corti during age-related hearing loss. PLoS One. 2013;8 doi: 10.1371/journal.pone.0062786. [DOI] [PMC free article] [PubMed] [Google Scholar]
- 21.Willott J.F., Carlson S., Chen H. Prepulse inhibition of the startle response in mice: relationship to hearing loss and auditory system plasticity. Behav. Neurosci. 1994;108:703–713. doi: 10.1037//0735-7044.108.4.703. [DOI] [PubMed] [Google Scholar]
- 22.Johnson K.R., Tian C., Gagnon L.H., Jiang H., Ding D., Salvi R. Effects of Cdh23 single nucleotide substitutions on age-related hearing loss in C57BL/6 and 129S1/Sv mice and comparisons with congenic strains. Sci. Rep. 2017;7 doi: 10.1038/srep44450. [DOI] [PMC free article] [PubMed] [Google Scholar]
- 23.Park S.N., Back S.A., Park K.H., Kim D.K., Park S.Y., Oh J.H., Park Y.S., Yeo S.W. Comparison of cochlear morphology and apoptosis in mouse models of presbycusis. Clin. Exp. Otorhinolaryngol. 2010;3:126–135. doi: 10.3342/ceo.2010.3.3.126. [DOI] [PMC free article] [PubMed] [Google Scholar]
- 24.Spongr V.P., Flood D.G., Frisina R.D., Salvi R.J. Quantitative measures of hair cell loss in CBA and C57BL/6 mice throughout their life spans. J. Acoust. Soc. Am. 1997;101:3546–3553. doi: 10.1121/1.418315. [DOI] [PubMed] [Google Scholar]
- 25.Benjamini Y., Hochberg Y. Controlling the False Discovery Rate: A Practical and Powerful Approach to Multiple Testing. J. Roy. Stat. Soc. B. 1995;57:289–300. doi: 10.1111/j.2517-6161.1995.tb02031.x. [DOI] [Google Scholar]
- 26.Balcombe J.P., Barnard N.D., Sandusky C. Laboratory routines cause animal stress. Contemp. Top. Lab. Anim. Sci. 2004;43:42–51. [PubMed] [Google Scholar]
- 27.Allan S., Rémy P. Age-related changes in the C57BL/6J mouse cochlea. I. Physiological findings. Dev. Brain Res. 1981;2:65–75. doi: 10.1016/0165-3806(81)90059-6. [DOI] [PubMed] [Google Scholar]
- 28.Cheng Y., Jia G., Zhang Y., Hao H., Shan Y., Yu L., Sun X., Zheng Q., Kraus N., Merzenich M.M., Zhou X. Positive impacts of early auditory training on cortical processing at an older age. Proc. Natl. Acad. Sci. USA. 2017;114:6364–6369. doi: 10.1073/pnas.1707086114. [DOI] [PMC free article] [PubMed] [Google Scholar]
- 29.Willott J.F. Effects of aging, hearing loss, and anatomical location on thresholds of inferior colliculus neurons in C57BL/6 and CBA mice. J. Neurophysiol. 1986;56:391–408. doi: 10.1152/jn.1986.56.2.391. [DOI] [PubMed] [Google Scholar]
- 30.Barbour D.L., Wang X. Contrast tuning in auditory cortex. Science. 2003;299:1073–1075. doi: 10.1126/science.1080425. [DOI] [PMC free article] [PubMed] [Google Scholar]
- 31.Averbeck B.B., Latham P.E., Pouget A. Neural correlations, population coding and computation. Nat. Rev. Neurosci. 2006;7:358–366. doi: 10.1038/nrn1888. [DOI] [PubMed] [Google Scholar]
- 32.Rauschecker J.P., Korte M. Auditory compensation for early blindness in cat cerebral cortex. J. Neurosci. 1993;13:4538–4548. doi: 10.1523/JNEUROSCI.13-10-04538.1993. [DOI] [PMC free article] [PubMed] [Google Scholar]
- 33.Henschke J.U., Oelschlegel A.M., Angenstein F., Ohl F.W., Goldschmidt J., Kanold P.O., Budinger E. Early sensory experience influences the development of multisensory thalamocortical and intracortical connections of primary sensory cortices. Brain Struct. Funct. 2018;223:1165–1190. doi: 10.1007/s00429-017-1549-1. [DOI] [PMC free article] [PubMed] [Google Scholar]
- 34.Rauschecker J.P., Kniepert U. Auditory localization behaviour in visually deprived cats. Eur. J. Neurosci. 1994;6:149–160. doi: 10.1111/j.1460-9568.1994.tb00256.x. [DOI] [PubMed] [Google Scholar]
- 35.Shilling-Scrivo K., Mittelstadt J., Kanold P.O. Altered Response Dynamics and Increased Population Correlation to Tonal Stimuli Embedded in Noise in Aging Auditory Cortex. J. Neurosci. 2021;41:9650–9668. doi: 10.1523/JNEUROSCI.0839-21.2021. [DOI] [PMC free article] [PubMed] [Google Scholar]
- 36.Shilling-Scrivo K., Mittelstadt J., Kanold P.O. Decreased Modulation of Population Correlations in Auditory Cortex Is Associated with Decreased Auditory Detection Performance in Old Mice. J. Neurosci. 2022;42:9278–9292. doi: 10.1523/JNEUROSCI.0955-22.2022. [DOI] [PMC free article] [PubMed] [Google Scholar]
Associated Data
This section collects any data citations, data availability statements, or supplementary materials included in this article.
Supplementary Materials
Data Availability Statement
-
•
Behavioral data have been deposited at the JHU Research Data Repository and are publicly available as of the date of publication. The DOI is listed in the key resources table.
-
•
All original code has been deposited at the JHU Research Data Repository and is publicly available as of the date of publication. The DOI is listed in the key resources table.
-
•
Any additional information required to reanalyze the data reported in this paper is available from the lead contact upon request.