


Summary
Identifying factors that affect treatment response is a central objective of clinical research, yet the role of common genetic variation remains largely unknown. Here, we develop a framework to study the genetic architecture of response to commonly prescribed drugs in large biobanks. We quantify treatment response heritability for statins, metformin, warfarin, and methotrexate in the UK Biobank. We find that genetic variation modifies the primary effect of statins on LDL cholesterol (9% heritable) as well as their side effects on hemoglobin A1c and blood glucose (10% and 11% heritable, respectively). We identify dozens of genes that modify drug response, which we replicate in a retrospective pharmacogenomic study. Finally, we find that polygenic score (PGS) accuracy varies up to 2-fold depending on treatment status, showing that standard PGSs are likely to underperform in clinical contexts.
Keywords: gene-environment interactions, genetic heterogeneity, heritability, heteroskedasticity, pharmacogenomics, genetic testing, personalized medicine
Graphical abstract
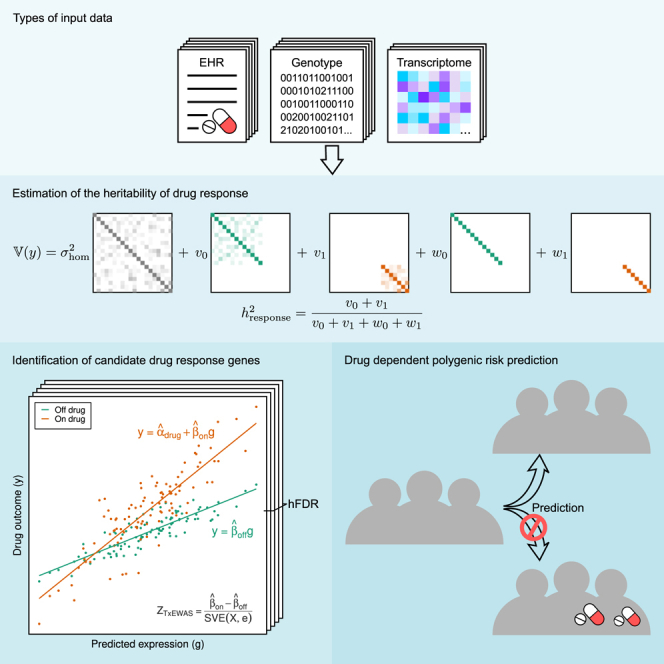
Highlights
-
•
Large biobank data provides insights into the genetic architecture of drug response
-
•
Genome-wide genetic variation broadly modifies drug response
-
•
Hundreds of genes associated with drug response are identified
-
•
Drug use information should be accounted for in genetic risk prediction
Sadowski et al. propose a framework to study the genetics of response to commonly prescribed drugs in large biobanks. They quantify the heritability of response to statins, metformin, warfarin, and methotrexate, and identify associated genes. Their analysis also shows the importance of accounting for drug use in genetic risk prediction.
Introduction
Initiation of drug treatment poses a risk for adverse reactions and long-term side effects, sometimes without guaranteed effectiveness for an individual patient.1,2,3,4,5,6 Genetic testing holds promise for safer and more effective treatment by predicting each individual’s specific drug response.7,8,9,10 To date, several large-effect pharmacogenomic genes have been identified11,12,13,14,15,16,17; these genes are commonly tested in the clinic to guide administration and dosing of certain medications,18,19,20,21 which reduces the incidence of certain severe adverse drug reactions.15,17,22,23 More recently, additional pharmacogenomic genes have been identified by genome-wide association studies (GWASs) in randomized controlled trials (RCTs), pharmacogenomic studies nested within large epidemiological cohort studies, or meta-analyses of both.24,25 For example, the Clinical Pharmacogenetics Implementation Consortium (CPIC)26—which curates gene-drug pairs and publishes corresponding clinical practice guidelines—currently lists 119 unique pharmacogenomic genes for 293 drugs with variable levels of evidence or actionability. Additionally, pharmacogenomic studies have reported significant heritability of drug response phenotypes,27,28 that most variants and genes discovered in pharmacogenomic GWASs differ from candidate genes,29 and that large-effect variants likely contribute little to the heritability of pharmacogenomic phenotypes.30 However, access to genetic data from RCTs is limited, nested pharmacogenomic studies are rare, and both have much smaller sample sizes than those available in biobanks, so they are generally underpowered to investigate the genetic architecture of drug response.
Even more recently, genome-wide genetic data have been considered for clinical biomarkers of disease risk in the form of polygenic scores (PGSs).31,32,33,34,35 PGSs predict disease risk by aggregating many risk alleles identified by GWASs.36 For some diseases, PGSs have comparable performance to current clinical risk-prediction algorithms, at least in European ancestry individuals.37,38,39 However, very few genome-wide predictions for treatment response have been developed,40,41 even though their potential benefits have been discussed extensively.42,43,44,45
Here, we build a framework to study genome-wide genetic effects on the primary and side effects of common drugs. Our approach leverages recent and novel methods for gene-environment interaction (GxE). Crucially, our methods apply to passively obtained electronic health records (EHRs), enabling analyses of sample sizes far exceeding randomized controlled trials. We apply our approach to some of the most common drugs in the UK Biobank: statins, metformin, warfarin, and methotrexate. Our methods quantify genome-wide heritability of drug response, identify specific genes modifying drug response, and characterize the implications for clinical use of PGSs. We replicate many of the gene-drug interactions in a longitudinal pharmacogenomic study of statins’ effects on LDL cholesterol.46,47 Overall, our framework characterizes the genetic architecture of individual-level response to modifiable risk factors in passively obtained EHRs.
Results
Study overview
We apply our framework to 342,257 unrelated white British individuals in the UK Biobank48 (STAR Methods). We focus on four commonly prescribed drugs in this dataset: statins, metformin, warfarin, and methotrexate. For each drug, we study phenotypes related to its primary effect as well as phenotypes related to its possible side effects (Table 1).
Table 1.
Drug exposures and responses examined in this work
| Drug exposure | Number of users (non-users) | Description | Primary effects | Side effects |
|---|---|---|---|---|
| Statins | 56,169 (286,088) | low-density lipoprotein (LDL) cholesterol-lowering therapy prescribed to prevent atherosclerotic cardiovascular disease (ASCVD) events | LDL cholesterol, cardiovascular disease (CVD)49,50 | glucose, hemoglobin A1c, type 2 diabetes (T2D)51,52,53,54 |
| Metformin | 8,606 (333,651) | antidiabetic therapy | glucose, A1c55,56,57,58 | body mass index (BMI),59,60 LDL cholesterol, CVD61,62 |
| Warfarin | 3,753 (338,504) | anticoagulant therapy | reticulocyte count, hematocrit, plateletcrit, venous thromboembolism (VTE)63,64,65 | none examined |
| Methotrexate | 1,865 (340,392) | antirheumatic therapy | C-reactive protein (CRP)66,67 | none examined |
We first define and develop a novel approach to estimate the aggregate impact of common genetic variation on treatment response (). is the SNP heritability of the phenotype change after treatment (Figure 1A, STAR Methods). We estimate this parameter by post-processing results from GxEMM,68 which was developed to estimate GxE-based heritability. GxEMM explicitly models treatment-dependent heteroscedasticity, which is essential for unbiased estimates of treatment-dependent heritability. Because this approach aggregates genetic effects across the genome, it is powerful but does not identify specific genes.
Figure 1.

Schematic of the GxE framework to analyze treatment response in cross-sectional data
(A) We use GxEMM to estimate the heritability of treatment response () based on the genetic (v) and nongenetic (w) variances specific to treatment status (STAR Methods).
(B) We identify genes that modify treatment response using TxEWAS, a new method to estimate gene-level GxE interaction. TxEWAS genetically imputes gene expression and tests if this gene’s effect interacts with some “E.”
(C) Statistical interactions with treatment status induce treatment-dependent heteroscedasticity that must be modeled in GxEMM and TxEWAS.
Next, we develop a new method called TxEWAS to identify specific genes that modify drug response. TxEWAS is a GxE extension of the transcriptome-wide association study (TWAS69,70) framework. It genetically imputes gene expression levels using reference transcriptomics data, as in a TWAS, and then tests whether the imputed expression interacts with an environmental (“E”) variable (Figure 1B, STAR Methods). A major challenge in TxEWAS is accounting for treatment-dependent heteroscedasticity, which we accomplish using the sandwich variance estimator (SVE)71 (Figures 1C, S1A, and S1B, STAR Methods). Compared to SNP-level tests, TxEWAS improves interpretability by suggesting possible causal genes and can improve power by aggregating multiple SNP effects and therefore reducing the number of statistical tests.69,70
Like all existing gene-environment interaction models, GxEMM and TxEWAS are susceptible to endogeneity bias because individuals’ treatments depend on their baseline phenotypes. We use theory, simulations, and additional data to characterize and account for this bias (Figures S2 and S3, supplemental note). Importantly, we test the gene-statin interaction effects on LDL cholesterol in a retrospective longitudinal pharmacogenomic study, which validates these specific results as well as our cross-sectional approach.
Finally, we study the impact of treatment status, which varies significantly between individuals, on the performance of polygenic scores. We evaluate changes in PGS prediction accuracy by varying the proportion of treated individuals in the training and/or validation data.
Primary effects and side effects of commonly prescribed drugs are heritable
We estimated for statins’ association with LDL cholesterol at 9% (Table 2). This is consistent with a prior estimate of 12% (SE = 9%) derived by comparing first-degree relatives.46 Statin-dependent genetic effects on A1c and blood glucose were estimated at 10% and 11%, respectively (Table 2). For comparison, the statin-independent heritabilities for these traits () are 21%, 29%, and 11% for LDL cholesterol, A1c, and blood glucose, respectively (Table 2).
Table 2.
Statistically significant drug-independent heritability and heritability of drug response estimates
| Drug/response | p value | ||
|---|---|---|---|
| Statins | |||
| LDL cholesterol | 0.21 | 0.089 | 1.13 × 10⁻³⁰ |
| A1c | 0.29 | 0.102 | 1.79 × 10⁻⁶ |
| glucose | 0.11 | 0.111 | 2.26 × 10⁻⁴ |
| Metformin | |||
| LDL cholesterol | 0.11 | 0.023 | 0.016 |
| BMI | 0.28 | 0.170 | 2.51 × 10⁻⁴ |
Corresponding estimates for all tested drug exposures and responses can be found in Table S1.
We next found that the for metformin’s associations with LDL cholesterol and BMI are 2% and 17%, respectively (Table 2), and the metformin-independent heritabilities are 11% and 28%, respectively. However, we did not find significant heritability of response to warfarin or methotrexate, which was expected as we have lower power for less common drugs (Table S1).
We next separately evaluated heritabilities in statin users vs. non-users. We observe that the heritability of LDL cholesterol is much higher in individuals who do not take statins (41% vs. 27%, Tables S2 and S3). This suggests that statins mitigate the genetic effects on LDL cholesterol present in untreated individuals (Table S4). We found a qualitatively different pattern for the side effect of statins on A1c and blood glucose, where statin users had comparable or higher heritability (Table S2). This suggests that statins activate or amplify genetic effects on blood sugar compared to untreated individuals. For metformin users, we found significantly higher heritability for BMI (51% vs. 31%) and lower heritability for LDL cholesterol (11% vs. 23%).
Identifying gene-drug interactions for primary and side effects
We next sought to identify specific genes that modify drug response. We found 156 genes that modify statins’ association with LDL cholesterol (hierarchical FDR72,73: hFDR < 10%, Figures 2A and S4A, Table S5). These genes include APOE, which has been previously implicated in response to statin therapy25 and is listed by CPIC as one of 13 gene-statin pharmacogenes. None of the other 12 CPIC genes overlap our TxEWAS genes, but four of them are within 200 kb of our TxEWAS genes (CYP2C9, HMGCR, CETP, LDLR). Overall, this demonstrates some alignment of our results with existing evidence. Additionally, our discovery of many genes that are not in CPIC further documents the complexity of drug response phenotypes.29,30
Figure 2.

Manhattan plots of gene-statin interactions for low-density lipoprotein cholesterol and for hemoglobin A1c and blood glucose
(A) Manhattan plot of gene-statin interaction effects for LDL cholesterol (primary effect). Each point represents a single gene, with physical position plotted on the x axis and standardized effect size plotted on the y axis. The most extreme effect across tissues is shown for each gene. Significant associations are highlighted in red, and the strongest associations on each chromosome are labeled.
(B and C) Same as (A), but for A1c and blood glucose (side effects).
Of the 156 genes significantly interacting with statins, 131 also have significant additive effects (hFDR < 10%). Interestingly, all 131 interaction effects have opposite signs to the main effects (Figures 3A and S5). That is, statins uniformly buffer these genetic effects on LDL cholesterol. This is consistent with our observation that LDL cholesterol has higher heritability in statin non-users than users (Table S2).
Figure 3.

Gene-statin interaction effect sizes for low-density lipoprotein cholesterol, hemoglobin A1c, and blood glucose
(A) Estimated effect sizes of selected genes on LDL cholesterol in statin users and non-users and from a standard additive model. Color boxes depict standard errors around effect size estimates. Reported p values are for the gene-statin interaction effects. The top 10 genes have significant interaction effects; for comparison, the bottom three genes are only additively significant.
(B and C) Same as (A), but for A1c and blood glucose. See also Figures S5 and S7.
At the time of conducting this study, the NHGRI-EBI GWAS Catalog74 reports 10 unique SNP associations with LDL cholesterol change in response to statin therapy, and 2,766 such associations with LDL cholesterol levels (STAR Methods). These SNP associations were mapped—either by the studies or the GWAS Catalog—to 17 and 1,468 genes, respectively. Of the 156 gene-statin interactions identified in the LDL cholesterol TxEWAS, four overlap the 17 genes reported by GWAS for LDL cholesterol change (SMARCA4, APOE, PCSK9, APOC1). Those four, as well as 51 additional TxEWAS genes, overlap the 1,468 GWAS genes for LDL cholesterol levels (Figure S6A). Compared to a TWAS for LDL cholesterol (STAR Methods), 135 of the 156 TxEWAS genes are shared, and 21 are new (Figure S6B). These 135 shared genes include the 55 shared with GWAS (Figure S6C).
A pathway enrichment analysis with ConsensusPathDB75 of the 156 interacting genes found enrichments mostly in cholesterol and lipoprotein metabolism pathways, as well as regulatory and transcription pathways (Table S6). For example, the two most significant Wikipathways were “Metabolic pathway of LDL, HDL, and TG, including diseases” and “Statin inhibition of cholesterol production,” and the top KEGG and Reactome pathways also included cholesterol-related biology.
We next tested which genes modify the side effects of statins on A1c and blood glucose, and we identified 53 and 6, respectively (Figures 2B, 2C, S4B, and S4C). 28 of the 53 genes with statin-dependent effects on A1c lie in the highly complex MHC region, and it is likely that many of these are not causal.76 One example gene outside the MHC is GIPR, which is known to regulate insulin levels in the presence of elevated glucose in mice77 and is associated with increased risk of hyperinsulinemia after an antipsychotic treatment.78 All six genes that modify statins’ association with glucose overlap the statin-dependent A1c loci (Figure 2C).
Of the 53 genes with statin-dependent effects on A1c, 36 have significant additive effects. However, unlike the genes modifying statins’ association with LDL cholesterol, only four of them have an interaction effect with opposite sign to the main effect (Figures 3B and S7). Similarly, only three of the six genes with statin-dependent effects on glucose exhibit significant additive effects, and all of these effects have the same sign as the corresponding interaction effects (Figure 3C). Broadly, this suggests that some genetic effects on A1c and glucose are amplified by statins, while others are dampened.
We next analyzed metformin, warfarin, and methotrexate for gene-drug interactions. Although these have many fewer users (Table 1), we identified three gene-warfarin interactions effects on reticulocyte count (HIF3A, implicated in the response to hypoxia79; ITGA1, shown to be upregulated at high oxygen levels in the environment80; and AL049542.1) and one gene-methotrexate interaction effect on C-reactive protein levels (C6orf164).
The results are highly concordant if we exclude individuals who take combinations of the aforementioned drugs (Figure S8; Table S5, supplemental note).
Replicating gene-drug interactions in a pharmacogenomic study
The UK Biobank EHR data are passively obtained from an observational cohort and may suffer from confounding due to endogeneity in treatment status—sick individuals are more likely to be on treatments, and this may be driven in part by genetics. Therefore, we validated our approach by replicating the gene-level interactions for statins’ primary effect in a pharmacogenomic study. The replication study analyzed statin-induced LDL cholesterol change in 34,874 statin users from the Kaiser Permanente GERA cohort (Genetic Epidemiology Research on Adult Health and Aging)46,47 (STAR Methods). Of the 156 significant genes that we identified from cross-sectional data, 155 could be studied in the replication cohort (STAR Methods). We found that 36/155 genes replicated (hFDR < 10%, Table S5) and that the remaining genes were significantly enriched for low p values < 0.1 (binomial test p value = 0.002).
Two of the 36 replicated interacting genes (APOE and APOC1) were previously reported in GWASs of LDL cholesterol change in response to statin therapy. These two and 16 more were reported by GWASs for LDL cholesterol levels. We then studied the remaining 18/36 genes using pathway analysis, which revealed enrichments in plasma lipoprotein processes, statin inhibition of cholesterol production, and cholesterol metabolism (Table S7). All of the 36 replicated interacting genes were identified by the standard TWAS for LDL cholesterol levels.
Gene-drug interactions impact polygenic prediction accuracy
Gene-drug interactions may reduce the performance of ordinary PGSs, which are additive genetic predictors and must compromise between optimizing for users and non-users. We assessed the impact of this bias on PGS performance by varying the proportion of individuals on a drug in the training and/or testing cohorts, keeping the training sample size fixed. We focused on statins and metformin because they had treatment response heritability (Table S1, STAR Methods).
First, we evaluated PGSs for A1c as a function of statin use (Table 3). We find that statin users are better predicted by the PGS trained on statin users, and vice versa for statin non-users. Numerically, prediction accuracy of the PGS for A1c in statin users increases by 31% when it is trained in treated vs. untreated individuals. While this is intuitive, it need not hold in general. For example, if two groups share identical genetic effects but have different levels of non-genetic noise, the PGS should always be trained in the less-noisy group. Indeed, we observe this pattern for LDL cholesterol, which has higher heritability in statin non-users than users, and we find that training a PGS in non-users is optimal for predicting in users (Table 3). We performed extensive simulations to confirm these results (Table S8, STAR Methods). Finally, we evaluated an “agnostic” PGS built from a mix of users and non-users without accounting for statins, and we found that this PGS performed worst of all (Table 3). This illustrates an unappreciated limitation of standard approaches to building PGSs in biobanks.
Table 3.
Prediction accuracy of polygenic scores trained in drug users, non-users, and a 50:50 mixture of both agnostic to treatment status
| Training |
Prediction accuracy (incremental [%] [SE]) |
|||||||
|---|---|---|---|---|---|---|---|---|
| Statins |
Metformin |
|||||||
| LDL cholesterol |
A1c |
LDL cholesterol |
BMI |
|||||
| On drug | Off drug | On drug | Off drug | On drug | Off drug | On drug | Off drug | |
| On drug | 7.18 (0.30) | 12.60 (0.36) | 3.36 (0.23) | 2.32 (0.18) | 1.32 (0.37) | 3.24 (0.54) | 0.919 (0.286) | 0.0040 (0.0592) |
| Off drug | 7.98 (0.32) | 14.87 (0.39) | 2.56 (0.20) | 5.79 (0.28) | 2.75 (0.51) | 5.43 (0.67) | 0.041 (0.080) | 0.0077 (0.0636) |
| Agnostic | 5.86 (0.29) | 10.49 (0.36) | 2.60 (0.20) | 3.75 (0.23) | 2.25 (0.44) | 5.00 (0.66) | 0.255 (0.164) | 0.0931 (0.1078) |
See also Table S9.
We found qualitatively similar results for PGSs dependent on metformin, though they had smaller sample size and were weaker: BMI for users were better predicted using the PGS built from users, while LDL cholesterol was always better predicted using non-users (Table 3).
Overall, our results demonstrate that the accuracy of polygenic prediction is significantly affected by the distribution of drug use status in both GWAS and prediction cohorts, and that the optimal approach varies across drugs and phenotypes. In particular, when genetic effects on an outcome are simply buffered by a drug, the optimal PGS for both users and non-users will be trained solely in drug non-users. This is because the genetic effects are perfectly correlated between groups, yet larger in the non-user group. Conversely, if the drug does not simply buffer baseline genetic effects, then the genetic correlation between users and non-users will decrease, and it becomes more important to match drug use status between GWAS and prediction cohorts. We hypothesize that the former scenario will be more frequent when studying the primary effect of a drug, and the latter will be more frequent for side effects; this hypothesis is consistent with our observation for statins’ associations with LDL cholesterol and A1c. In general, the optimal PGS will depend on the net effect of these parameters and the available sample sizes for users and non-users (Table S9).
Discussion
We quantified the genome-wide contribution of genetic variation to drug response () for some of the most commonly prescribed drugs worldwide. We identified specific genes driving this variation, and we validated the gene-statin interaction effects on LDL cholesterol in a longitudinal pharmacogenomic study. We found that such genetic effects on drug response have downstream implications for PGSs, which are moving toward clinical use. In particular, we showed that current PGSs will often underperform in the clinic because they are biased toward untreated individuals. While our paper focuses on drug treatments, we note that our novel framework can characterize the genetic basis of any covariate’s effect, including sex/gender, age, or modifiable risk factors.
Our results suggest that genome-wide genetic variation broadly modifies drug response. This is an important extension of pharmacogenomic studies, which usually focus on large-effect genes directly involved in drug metabolism. This extension is consistent with the overall arc of human genetic studies, where first large-effect genes are identified and then, as sample sizes grow and methods mature, genome-wide signals are identified.81,82
We observe a large, but not complete, overlap between statin-interacting genes identified with TxEWAS for LDL cholesterol and TWAS and GWAS associations with baseline LDL cholesterol (STAR Methods). This result calls for caution, since it could be explained by endogeneity (Figure S2, supplemental note) or model misspecification, which are one of the main concerns in all GxE studies. Nonetheless, reassuringly, many of these genes replicated in a longitudinal study, and some have additional forms of experimental evidence.83,84,85
An interesting finding is PCSK9—an LDL cholesterol-lowering drug target, which we observed to have a stronger effect in statin users than non-users (Figure 3A). This interaction effect did not replicate in our longitudinal study, which could be due to insufficient power in this study, or due to endogeneity in our discovery analysis. There is a possibility of endogeneity bias because PCSK9 has a strong effect on baseline LDL cholesterol (supplemental note). On the other hand, known facts about PCSK9 make it an interesting candidate for a statin pharmacogene: (1) loss-of-function and gain-of-function variants in PCSK9 are known to reduce and elevate LDL cholesterol levels, respectively,86,87 and (2) statin therapy has been shown to increase serum PCSK9 levels, which can buffer statin LDL cholesterol-lowering effects.84,87 Furthermore, a genetic study88 identified loss-of-function variants associated with improved LDL cholesterol response to statins. However, the strongest association reported in this study was estimated with just three carriers, and the effect of a loss-of-function variant is easier to predict than the combined effect of small and moderate effect variants, which we studied. A more recent genetic study89 reported variants with statin-dependent effects on PCSK9 levels, and stronger causal effects of PCSK9 on LDL cholesterol in statin non-users compared to statin users. This is in line with our result. However, this study evaluated statin interactions on small preselected sets of variants and suffered similar limitations as ours in regards to observational data.
Importantly, our results identify an unappreciated limitation of the clinical use of PGSs, which are systematically less predictive in treated individuals than healthy controls. This complements other known limitations of PGSs, including limited transferability across socio-economic status, age, sex,90,91 and ancestry,92,93 which could also be driven in part by gene-environment interactions.94 On the other hand, our results pave a path to developing context-specific PGSs that incorporate context-specific genetic effects, which could directly predict an individual’s response to common drugs by the difference between their on-drug PGS and their off-drug PGS.
Limitations of the study
Our study has several limitations. First, it has focused on the UK Biobank, which is a cross-sectional cohort with non-random allocation of drugs. This raises the possibility of endogeneity biases causing false positives or false negatives, where our results reflect causes of drug prescription rather than its consequences. Nonetheless, we have validated many of our results in a longitudinal pharmacogenomic study, which took steps to reduce biases from dosing and baseline LDL cholesterol levels. Robust replication for one drug-outcome pair does not imply that our results will replicate for every such pair. Nonetheless, it is an important reassurance that our exploratory approach has value to partly recover longitudinal analyses. More importantly, for many traits, the results are inconsistent with simple endogeneity-driven biases because we observed both positive and negative interaction effects (supplemental note). A related limitation is that our cross-sectional approach to estimate heritability provides only a lower bound to (supplemental note). In the future, methods to formally account for such endogeneity would give more precise estimates of treatment response heritability. Second, large-scale projects, like the UK Biobank, measure many shallow phenotypes but often do not measure the most clinically relevant phenotypes for a specific study. For this study, for example, we were unable to extract relevant phenotypes to investigate statin-induced myopathy, and we were only able to extract proxies for the primary clinical measure of warfarin’s effect (international normalized ratio95). If the number of drug users in a large biobank is relatively small, as in our warfarin study, bespoke small-scale studies can have more power to model genetic effects on drug response.96 Third, biobanks often lack detailed information about drug dose for many or all participants. Our study in the UK Biobank did not account for drug dose, which is an important limitation, even though we were able to validate an important part of our discoveries in a pharmacogenomic study that did correct for it. Fourth, patients are often on multiple drugs simultaneously. Results of our secondary analysis, which excluded individuals on combinations of drugs considered in this study, showed high concordance with results of the primary analysis. However, more targeted studies can improve by including information about important drugs taken concurrently. Fifth, statistical genetic interactions need not reflect biochemical interactions between a gene and drug. This contrasts with large-effect pharmacogenomic genes, which typically encode enzymes that directly metabolize the drug. Sixth, the TxEWAS method is liable to detect genes or tissues that are merely correlated with causal genes of tissues. In the future, established TWAS methods to fine-map causal genes76 or tissues97,98,99 could be adapted to the TxEWAS setting. Seventh, due to biases in available data, we analyzed only individuals of European ancestry. For example, GxEMM requires tens of thousands of samples for robustness, and TxEWAS requires reference genomic data which currently is heavily biased to European ancestries.100 More ancestrally diverse data are needed to obtain more generally applicable results. Nonetheless, we expect that our qualitative conclusions about the genetic architecture of treatment response will apply to all individuals. Eighth, since estimated heritability depends on the choice of covariates, and since our analyses always adjust for the main effect of the specific drug being tested, our estimates of for an outcome depend on the drug being tested. Similar issues apply to ordinary additive heritability estimates101 (supplemental note, Table S10). Nonetheless, this does not affect our conclusions about .
Despite these limitations, we provided evidence for substantial polygenic contributions to drug response and showed how large-scale cross-sectional studies like the UK Biobank can be used to estimate genetic effects on drug response. Although validation with randomized controlled trials is needed before drawing definitive conclusions about causal genetic effects on treatment response, our results demonstrate that cross-sectional data can generate compelling hypotheses on genetic modifiers and statistical predictions for treatment response. It is important, as advances in pharmacogenomics cannot be made with sole input from randomized controlled trials,24 which have strict inclusion and exclusion criteria, cannot always be performed due to ethical issues and are limited to small sample sizes due to high cost. Based on these results, we envision that novel PGS approaches incorporating treatment information will provide actionable clinical guidelines for optimizing primary effects and minimizing harmful side effects of drugs.
Resource availability
Lead contact
Further information and requests for resources should be directed to and will be fulfilled by the lead contact, Michal Sadowski (michalsadowski@ucla.edu).
Materials availability
This study did not generate new unique reagents.
Data and code availability
-
•
This paper analyzes existing, publicly available data. These accession numbers for the datasets are listed in the key resources table.
-
•
All original code has been deposited at https://github.com/michalsad/txewas_scripts and is publicly available as of the date of publication. DOIs are listed in the key resources table.
-
•
Any additional information required to reanalyze the data reported in this paper is available from the lead contact upon request.
Acknowledgments
This research was conducted using the UK Biobank Resource under application 33127. We thank the participants of the UK Biobank for making this work possible. This work was funded by the Chan Zuckerberg Initiative grant CZF2019-002449 and National Institutes of Health grants U01HG012079, R01MH125252, 1R01HG011345, R01ES029929, R01MH122688, and 2R01HG006399 to N.Z. and R35GM150822 and K25HL157603 to A.W.D.
Author contributions
Conceptualization, M.S., J.F.A., A.W.D., and N.Z.; methodology, M.S., J.M., A.W.D., and N.Z.; software, M.S., M.T., and A.W.D.; validation, T.H. and A.O.-O.; resources, M.T., T.H., A.O.-O., R.B., A.P., and N.C.; writing—original draft, M.S.; writing—review & editing, M.S., M.T., A.O.-O., R.B., S.S., A.W.D., and N.Z.; supervision, J.F.A., S.S., A.W.D., and N.Z.
Declaration of interests
The authors declare no competing interests.
STAR★Methods
Key resources table
| REAGENT or RESOURCE | SOURCE | IDENTIFIER |
|---|---|---|
| Deposited data | ||
| UK Biobank Resource | UK Biobank | https://www.ukbiobank.ac.uk/ |
| Response to statins (LDL cholesterol percent change) GWAS summary statistics | Oni-Orisan et al.46,47 | GWAS Catalog: GCST009821 |
| GTEx (context-by-context) eQTL weights | Thompson et al.98 | http://gusevlab.org/projects/fusion/#multi-context-content-expression |
| LDL cholesterol change in response to statin therapy GWAS associations | Oni-Orisan et al.,47 Barber et al.,102 Chasman et al.,103 Deshmukh et al.,104 Postmus et al.105 | GWAS Catalog: GCST010338, GCST009821, GCST000635, GCST001408, GCST001425, GCST002675 |
| LDL cholesterol levels GWAS associations | Sollis et al.74 | GWAS Catalog: GCST90002412, GCST008238, GCST008593, GCST90010364, GCST90179477, GCST90025954, GCST90134520, GCST007204, GCST90092883, GCST90255425, GCST90102272, GCST90255492, GCST011683, GCST007141, GCST004541, GCST007131, GCST010245, GCST011417, GCST010204, GCST009757, GCST008990, GCST000234, GCST000866, GCST007442, GCST007689, GCST90319533, GCST003361, GCST006004, GCST008988, GCST90239612, GCST90278638, GCST90278111, GCST90292747, GCST90293039, GCST90140947, GCST90244006, GCST90104175, GCST90134487, GCST90134501, GCST90134504, GCST000131, GCST000151, GCST000134, GCST000283, GCST003303, GCST003216, GCST001645, GCST008935, GCST90019512, GCST90319696, GCST90101741, GCST90101745, GCST009043, GCST000132, GCST006612, GCST90079033, GCST90018961, GCST90018741, GCST90296607, GCST008037, GCST000807, GCST000975, GCST000287, GCST000282, GCST004920, GCST90090990, GCST011347, GCST007848, GCST002898, GCST003662, GCST004233, GCST004236, GCST90244653, GCST008077, GCST000759, GCST002222, GCST002220, GCST009147, GCST009150, GCST008676, GCST90255506, GCST90255507, GCST90255505, GCST90239655, GCST90239659, GCST90239660, GCST90239658, GCST90239656, GCST90239657 |
| Software and algorithms | ||
| TxEWAS | this paper | https://doi.org/10.5281/zenodo.12192083 |
| GxEMM | Dahl et al.68 | https://github.com/andywdahl/gxemm |
| NetworkX | Hagberg et al.106 | https://github.com/networkx/networkx |
| bigstatsr | Prive et al.107,108 | https://privefl.github.io/bigstatsr |
| GCTA | Yang et al.109 | https://yanglab.westlake.edu.cn/software/gcta |
| sandwich | Zeileis et al.110,111 | https://sandwich.r-forge.r-project.org |
| TreeQTL | Peterson et al.72,73 | http://bioinformatics.org/treeqtl |
| FUSION | Gusev et al.70 | http://gusevlab.org/projects/fusion |
| ConsensusPathDB | Kamburov et al.75 | http://cpdb.molgen.mpg.de |
Method details
UK Biobank data
Analyses presented in this work were performed in the UK Biobank population of 342,257 unrelated white British individuals.
Samples
The 342,257 unrelated white British individuals were identified by performing the following steps. From among 488,363 UK Biobank participants, we retained putative “White British” individuals using field 22006–0.0 (n = 409,692). We then filtered out 199 individuals with excess genotype missingness (>0.05), 312 individuals with a mismatch between self-reported and genetic sex, 999 individuals with excess heterozygosity (≥5 standard deviations above the mean), and 90 individuals who requested their data be redacted. We then removed 629 individuals related to ten or more individuals (KING coefficient ≥ ) as a preprocessing step to the application of the maximal_independent_set algorithm implemented in the NetworkX Python package.106
In contrast to Bycroft et al.,112 who estimated kinships using approximately 92,000 common SNPs with small loadings onto the first few principal components (PCs) in the full sample (including multiple ancestries; see S3.7 of Bycroft et al.), we estimated kinships using 561,780 common SNPs in a sample of European ancestry individuals. The close relatives the UK Biobank identified in field 22021–0.0 are a subset of our more conservative approach: we identified all 81,218 related individuals in this subsample identified by the UK Biobank plus an additional 3,261 not identified by Bycroft et al.
Genotypes
For heritability and PGS analyses, we used 579,566 UK Biobank variants with minor allele frequency (MAF) larger than 0.01, Hardy-Weinberg equilibrium (HWE) test p value below 10−10, and imputation INFO score of 1. For the TxEWAS analysis, UK Biobank SNPs that matched eQTLs trained in the GTEx consortium113 were used.
Phenotypes
Individuals who take statins were identified by UK Biobank field 20003-0.0-47 using the following codes: 1140861958, 1140861970, 1141146138, 1140888594, 1140888648, 1140910632, 1140910654, 1141146234, 1141192410, 1141192414, 1141188146, 1140881748 and 1140864592. There were 56,169 such subjects within the UK Biobank population of 342,257 unrelated white British individuals. Individuals who take metformin (n = 8,606) were identified by codes 1140884600 and 1141189090 in the same UK Biobank field. Warfarin users (n = 3,753) were identified by codes 1140888266 and 1140910832; and methotrexate users (n = 1,865) by codes 1140869848 and 1140910036.
LDL cholesterol, glucose, A1c, BMI, hematocrit, plateletcrit, reticulocyte count and C-reactive protein levels were retrieved from UK Biobank fields 30780–0.0, 30740–0.0, 30750–0.0, 21001–0.0, 30030–0.0, 30090–0.0, 30240–0.0 and 30710–0.0, respectively.
C-reactive protein levels were inverse normally transformed before fitting the models. For other traits, we discarded measurements greater than five standard deviations from the mean, with the assumption that such extreme levels were results of non-modeled circumstances.
CVD was defined as in Thompson et al.114 The T2D disease status and the VTE status were extracted from the UK Biobank EHRs. The former was defined using ICD10 code E11. The latter, using ICD10 codes I26, I80.1, I80.2, I81 and I82.0, and OPCS procedure code L90.2.115 For testing associations with drug use, we only retained diagnoses recorded after the date of the initial assessment with the UK Biobank initiative (when the information about medication use was collected), which resulted in 29,393 (278,675), 18,193 (297,399), 7,356 (332,403) cases (controls) for CVD, T2D and VTE, respectively.
Covariates
The main analyses reported in this work were performed using the following covariates: age, sex, birth date, Townsend deprivation index, and the first 16 genetic PCs.92 We additionally accounted for the measuring device type when an outcome required it, which was the case for hematocrit, plateletcrit, and reticulocyte count. All non-binary covariates were standardized (transformed to mean-zero, variance 1) before calculating interaction variables.
Heritability of treatment response
GxEMM quantifies the heritability contributed by genome-wide additive effects and genome-wide GxE effects. The general GxEMM model for phenotype of an individual in environment (i.e., ) is:
In this model, are covariates (indexed by ) with fixed effects , and is a matrix of SNPs (indexed by ), with additive effects . We assume that and the noise, , are i.i.d. standard normal, and the additive heritability is determined by the genetic and noise variances, and . GxEMM additionally captures SNP-environment interaction effects, , which are also assumed i.i.d. standard normal. Further, GxEMM allows environment-specific genetic () and noise () variances. If the phenotype is scaled to variance 1, .
Here, we use treatment status as the “environment” in order to quantify the heritability due to treatment-specific effects. We approximate the heritability of treatment response, , by:
where captures the covariance in effect sizes for unmodeled risk factors between treated/untreated states (Supplemental Note).
For warfarin, methotrexate, and metformin, we studied a sample of 30,000 individuals that included all users of that drug and an accordingly-sized random draw of non-users. To assess stability of our results, we repeated the analysis five times by randomly resampling non-users, and reported results from the sample with median additive heritability (, Figure S9). Because statins are much more common, we instead randomly split all 342,257 individuals into 11 non-overlapping subsets and meta-analyzed the results. This is a common approach employed in biobank-scale datasets to reduce computational complexity.116
Genes responsible for variable drug response
TxEWAS extends the transcriptome-wide association study (TWAS69,70) framework to test gene-environment interactions. The TxEWAS framework involves two major steps: First, gene expression levels of each gene are genetically imputed using a reference dataset. Second, the interaction effect, , between imputed gene expression and the drug is tested in the regression model:
where ; and are the drug use indicator and imputed expression of some gene for individual , respectively, and is a matrix of covariates.
For binary phenotypes, the interaction effect is tested in the logistic regression model with the same covariates (Supplemental Note). In both models, the variance of the effect size estimates is estimated with the sandwich variance estimator to control for heteroskedasticity and/or misspecification of the functional form of the environmental factor117,118 (Figure S1, Supplemental Note).
In this study, we imputed gene expression into the UK Biobank using 48 tissues from the GTEx consortium, and we used hierarchical FDR72,73 (hFDR < 10%) to account for multiple hypothesis testing across genes and tissues. Hierarchical FDR has been shown to properly control the false discovery rate across contexts when there are multiple hypothesis tests being run for a given group, in this case, a gene.72,73,119 It also boosts power in cases where a gene has a significant association in multiple contexts. Finally, since TxEWAS is liable to detect genes that are merely correlated with the causal gene due to the genetic LD structure in the proximity of the causal gene, we define TxEWAS association loci by adding consecutive genes until there is no gene within 500 kb from the last added gene.
Gene expression prediction models
In TxEWAS, gene expression (or rather its genetic component) is imputed as a linear combination of genetic variants (SNPs). The coefficients used for the imputation are referred to as “weights” or “eQTL weights” and are calculated on a per-gene basis by fitting a linear model of gene expression onto the gene’s cis-genotypes in an external reference dataset. We fit each model using the elastic net, as it has been found to be the most robust across a wide range of genetic architectures.120 We used package bigstatsr107 to fit each model using 10-fold cross-validation, and after determining whether the expression of a gene was significantly predicted using cis-genotypes at a nominal p value of 0.05, we retrained the model using the entire set of individuals to generate a final set of weights. The weights has been deposited at http://gusevlab.org/projects/fusion/#multi-context-content-expression under the “GTEx (context-by-context)” download link.
Replication in a pharmacogenomic study
We initially discovered gene-drug associations in cross-sectional data using TxEWAS. To validate these discoveries, we performed an ordinary TWAS on the change in LDL cholesterol after statin initiation in an external pharmacogenomic study (we term this analysis PGx TWAS, Table S11). More concretely, we used data from a longitudinal study of 28,616 individuals with European ancestries from the Kaiser Permanente GERA cohort (Genetic Epidemiology Research on Adult Health and Aging).46,47 In this study, the phenotype was rigorously characterized utilizing electronic health records, and the analysis was adjusted for carefully selected covariates. For every TxEWAS interacting gene identified in the UK Biobank cohort, we calculated the PGx TWAS statistic in all available GTEx tissues, and employed an hFDR correction to call statistically significant genes at FDR < 10%.
Implications for polygenic scores
PGSs are weighted sums of risk alleles optimized to predict some training dataset. This makes PGSs depend on characteristics of the training data, such as ancestry,93 age,90 or sex.91 We assessed the accuracy of PGSs as a function of drug use, including PGSs trained in users and tested in non-users and vice-versa. In the main analysis, we varied the proportion of individuals on a drug in the training cohort, keeping the sample size fixed. We evaluated additional scenarios in the Supplemental Note. We fit PGSs using a fast implementation of penalized linear regression with the lasso penalty92,108 and we measured prediction accuracy by the incremental over baseline covariates. Standard errors around the estimates were calculated using bootstrap.
Simulating polygenic scores
We performed realistic simulations to examine two scenarios observed in real data. Scenario 1 mimicked statin-LDL, where “on” genetic effects are buffered to be half the size of “off” effects. As expected, we found that training a PGS in “off” individuals is optimal regardless of the test set (Table S8). Scenario 2 mimicked statin-A1c, where “on” and “off” effects are highly correlated but vary randomly in magnitude. As expected, we found that training a PGS in training samples matching the test samples is optimal in this scenario. These simulations show how prediction accuracy of a PGS depends on the genetic correlation and heritability between the train and test dataset and explain the discordant results for statins’ effects on A1c and LDL cholesterol (Table S9). In both cases, we simulated the unexposed population to have 40% heritability. In the exposed population, we either (Scenario 1) divided all genetic effect sizes by two, reflecting systemic buffering of the unexposed effects, or (Scenario 2) randomly deflated (with probability 0.4) or inflated (with probability 0.6) each individual genetic effect by a random fraction between 0.2 and 1. We then performed PGS analyses as in the real data by varying the distribution of drug use in the train and test populations.
GWAS data
GWAS associations with LDL cholesterol change in response to statin therapy, and LDL cholesterol levels were collected from the NHGRI-EBI GWAS Catalog74 on 04/17/2024.
Associations with LDL cholesterol change in response to statin therapy were identified using the following names of traits: “Response to statin therapy”, “Response to statins (LDL cholesterol change)”, “Response to statins (LDL cholesterol percent change)”.102,103,104,105
Associations with LDL cholesterol levels were identified using the following names of traits: “LDL cholesterol levels”, “Low-density lipoprotein cholesterol levels”, “Direct low-density lipoprotein cholesterol levels”, “LDL cholesterol”, “Direct low-density lipoprotein levels (UKB data field 30780)”.
Only associations that reached the genome-wide significance level of p value < 5 × 10⁻⁸ were considered. For gene-level comparisons, lists of associated genes were created for each of the above phenotypes by taking the union of the “reported genes” and “mapped genes” columns of a given summary table.
TWAS for LDL cholesterol levels
TWAS for LDL cholesterol levels was performed in the UK Biobank analogously to the TxEWAS for statins' association with LDL cholesterol (see above), only no interaction terms were included in the model. TWAS tests were performed in 48 tissues from the GTEx consortium, and significant genes were called at hFDR < 10%.
Quantification and statistical analysis
General statistical analysis
Unless otherwise specified, all analyses were conducted using custom scripts implemented in the R programming language.
Heritability estimation with GxEMM
GxEMM heritability estimates and their standard errors were calculated using the GxEMM package.68 Specifically, we fit the GxEMM’s Free model using REML. p values for were obtained by testing for non-additive heritability, i.e., by testing whether the off-drug () and on-drug () genetic variances are both zero. Because GxEMM does not scale to the whole UK Biobank, we perform meta-analysis across 11 non-overlapping subsets of data (method details). More specifically, we use inverse variance weighting to meta-analyze heritabilities and Fisher’s method to meta-analyze p values.
Heritability estimation with GCTA
Estimates of the additive heritability and their standard errors reported in Table S3 were calculated using the GCTA software.109 Sample sizes of metformin users who were not statin users were: 1,584 for LDL cholesterol, 1,337 for A1c, and 1,243 for blood glucose. Sample sizes of the rest of the drug user groups were matched to those available for users of statins and metformin: 6,572 for LDL cholesterol, 5,800 for A1c, and 5,157 for blood glucose.
Estimates of the additive heritability and their standard errors reported in Table S10 were calculated using the GCTA software. Similarly to GxEMM, GCTA only scales up to tens of thousands samples. Thus, for the analyses that did not include drug use as covariates or included statin use (which has high frequency of ∼16% in our dataset), we randomly split all 342,257 individuals into 11 non-overlapping subsets and meta-analyzed the results, as described above for GxEMM. For the analyses which included metformin use as a covariate, we estimated the additive heritability in a sample of 30,000 individuals that included all users of the drug and an accordingly-sized random draw of non-users. As in the corresponding GxEMM analysis, we repeated the analysis five times by randomly resampling non-users, and reported results from the sample with median estimate.
GxE tests with TxEWAS
The TxEWAS model of a continuous response is fitted using R’s lm() function, and the model of a binary response using the glm() function with the parameter family = "binomial" and logit link function. For both models, robust standard errors are calculated using White’s estimator implemented in the vcovHC() function from R package sandwich.110,111 p values are obtained from a two-sided Wald test. Hierarchical FDR correction from package TreeQTL72,73 is applied to p values across genes tested for multiple tissues, and significant genes are called at 10% FDR.
Replication analysis
TWAS on summary statistics from our replication pharmacogenomic study (method details) was performed using FUSION70 and the LD reference data for individuals of European ancestry provided with the software. The LD reference was calculated based on genotypes from the 1000 Genomes Project, which provided fewer SNPs than the UK Biobank. As a result, FUSION could not build expression models for some of the genes that were identified with TxEWAS using the individual-level UK Biobank data. This is why, in the main analysis, we report replication rate relative to 155 genes, and not all 156 genes identified in the statin-LDL TxEWAS.
Pathway enrichment analysis
All pathway enrichment analyses presented in this work were performed with ConsensusPathDB.75
Published: December 4, 2024
Footnotes
Supplemental information can be found online at https://doi.org/10.1016/j.xgen.2024.100722.
Contributor Information
Michal Sadowski, Email: michalsadowski@ucla.edu.
Noah Zaitlen, Email: nzaitlen@ucla.edu.
Supplemental information
Columns 12 and 20 indicate if a given association was found significant (1) or not significant (0) in the main or restricted analyses, respectively. For example, there are 170 statin-interacting genes for LDL cholesterol in this table: 156 are significant in the main analysis (and indicated with 1 in column 12); the additional 14 genes are identified by the restricted analysis (all the genes identified in this analysis are indicated with 1 in column 20). Columns 13 and 21 indicate associations that replicated in each study
TWAS for the change in LDL cholesterol after statin initiation in individuals of European ancestry from the Kaiser Permanente GERA cohort.S14
References
- 1.Exner D.V., Dries D.L., Domanski M.J., Cohn J.N. Lesser Response to Angiotensin-Converting–Enzyme Inhibitor Therapy in Black as Compared with White Patients with Left Ventricular Dysfunction. N. Engl. J. Med. 2001;344:1351–1357. doi: 10.1056/NEJM200105033441802. [DOI] [PubMed] [Google Scholar]
- 2.Mega J.L., Simon T., Collet J.-P., Anderson J.L., Antman E.M., Bliden K., Cannon C.P., Danchin N., Giusti B., Gurbel P., et al. Reduced-Function CYP2C19 Genotype and Risk of Adverse Clinical Outcomes Among Patients Treated With Clopidogrel Predominantly for PCI: A Meta-analysis. JAMA. 2010;304:1821–1830. doi: 10.1001/jama.2010.1543. [DOI] [PMC free article] [PubMed] [Google Scholar]
- 3.Riaz N., Havel J.J., Kendall S.M., Makarov V., Walsh L.A., Desrichard A., Weinhold N., Chan T.A. Recurrent SERPINB3 and SERPINB4 mutations in patients who respond to anti-CTLA4 immunotherapy. Nat. Genet. 2016;48:1327–1329. doi: 10.1038/ng.3677. [DOI] [PMC free article] [PubMed] [Google Scholar]
- 4.Pirmohamed M. Personalized Pharmacogenomics: Predicting Efficacy and Adverse Drug Reactions. Annu. Rev. Genom. Hum. Genet. 2014;15:349–370. doi: 10.1146/annurev-genom-090413-025419. [DOI] [PubMed] [Google Scholar]
- 5.Spear B.B., Heath-Chiozzi M., Huff J. Clinical application of pharmacogenetics. Trends Mol. Med. 2001;7:201–204. doi: 10.1016/S1471-4914(01)01986-4. [DOI] [PubMed] [Google Scholar]
- 6.Lazarou J., Pomeranz B.H., Corey P.N. Incidence of Adverse Drug Reactions in Hospitalized PatientsA Meta-analysis of Prospective Studies. JAMA. 1998;279:1200–1205. doi: 10.1001/jama.279.15.1200. [DOI] [PubMed] [Google Scholar]
- 7.Burke W. Genetic Testing. N. Engl. J. Med. 2002;347:1867–1875. doi: 10.1056/NEJMoa012113. [DOI] [PubMed] [Google Scholar]
- 8.Evans W.E., Relling M.V. Moving towards individualized medicine with pharmacogenomics. Nature. 2004;429:464–468. doi: 10.1038/nature02626. [DOI] [PubMed] [Google Scholar]
- 9.Jameson J.L., Longo D.L. Precision Medicine — Personalized, Problematic, and Promising. N. Engl. J. Med. 2015;372:2229–2234. doi: 10.1056/NEJMsb1503104. [DOI] [PubMed] [Google Scholar]
- 10.Grossman D.C., Larson E.B., Sox H.C. Integrating Personalized Medicine With Population Health Management: The Path Forward. JAMA. 2020;324:631–632. doi: 10.1001/jama.2020.1406. [DOI] [PubMed] [Google Scholar]
- 11.Wilkinson G.R. Drug Metabolism and Variability among Patients in Drug Response. N. Engl. J. Med. 2005;352:2211–2221. doi: 10.1056/NEJMra032424. [DOI] [PubMed] [Google Scholar]
- 12.Nebert D.W., Russell D.W. Clinical importance of the cytochromes P450. Lancet. 2002;360:1155–1162. doi: 10.1016/S0140-6736(02)11203-7. [DOI] [PubMed] [Google Scholar]
- 13.SEARCH Collaborative Group. Link E., Parish S., Armitage J., Bowman L., Heath S., Matsuda F., Gut I., Lathrop M., Collins R. SLCO1B1 Variants and Statin-Induced Myopathy — A Genomewide Study. N. Engl. J. Med. 2008;359:789–799. doi: 10.1056/NEJMoa0801936. [DOI] [PubMed] [Google Scholar]
- 14.Schwarz U.I., Ritchie M.D., Bradford Y., Li C., Dudek S.M., Frye-Anderson A., Kim R.B., Roden D.M., Stein C.M. Genetic Determinants of Response to Warfarin during Initial Anticoagulation. N. Engl. J. Med. 2008;358:999–1008. doi: 10.1056/NEJMoa0708078. [DOI] [PMC free article] [PubMed] [Google Scholar]
- 15.Mallal S., Phillips E., Carosi G., Molina J.M., Workman C., Tomažič J., Jägel-Guedes E., Rugina S., Kozyrev O., Cid J.F., et al. HLA-B∗5701 Screening for Hypersensitivity to Abacavir. N. Engl. J. Med. 2008;358:568–579. doi: 10.1056/NEJMoa0706135. [DOI] [PubMed] [Google Scholar]
- 16.McCormack M., Alfirevic A., Bourgeois S., Farrell J.J., Kasperavičiūtė D., Carrington M., Sills G.J., Marson T., Jia X., de Bakker P.I.W., et al. HLA-A∗3101 and Carbamazepine-Induced Hypersensitivity Reactions in Europeans. N. Engl. J. Med. 2011;364:1134–1143. doi: 10.1056/NEJMoa1013297. [DOI] [PMC free article] [PubMed] [Google Scholar]
- 17.Chen P., Lin J.J., Lu C.S., Ong C.T., Hsieh P.F., Yang C.C., Tai C.T., Wu S.L., Lu C.H., Hsu Y.C., et al. Carbamazepine-Induced Toxic Effects and HLA-B∗1502 Screening in Taiwan. N. Engl. J. Med. 2011;364:1126–1133. doi: 10.1056/NEJMoa1009717. [DOI] [PubMed] [Google Scholar]
- 18.Tutt A.N.J., Garber J.E., Kaufman B., Viale G., Fumagalli D., Rastogi P., Gelber R.D., de Azambuja E., Fielding A., Balmaña J., et al. Adjuvant olaparib for patients with BRCA1-or BRCA2-mutated breast cancer. N. Engl. J. Med. 2021;384:2394–2405. doi: 10.1056/NEJMoa2105215. [DOI] [PMC free article] [PubMed] [Google Scholar]
- 19.Lynparza approved in the EU as adjuvant treatment for patients with germline BRCA-mutated HER2-negative high-risk early breast cancer. 2022. https://www.astrazeneca.com/media-centre/press-releases/2022/lynparza-approved-in-eu-for-early-breast-cancer.html
- 20.Pirmohamed M., Burnside G., Eriksson N., Jorgensen A.L., Toh C.H., Nicholson T., Kesteven P., Christersson C., Wahlström B., Stafberg C., et al. A Randomized Trial of Genotype-Guided Dosing of Warfarin. N. Engl. J. Med. 2013;369:2294–2303. doi: 10.1056/NEJMoa1311386. [DOI] [PubMed] [Google Scholar]
- 21.Roberts J.D., Wells G.A., Le May M.R., Labinaz M., Glover C., Froeschl M., Dick A., Marquis J.-F., O’Brien E., Goncalves S., et al. Point-of-care genetic testing for personalisation of antiplatelet treatment (RAPID GENE): a prospective, randomised, proof-of-concept trial. Lancet. 2012;379:1705–1711. doi: 10.1016/S0140-6736(12)60161-5. [DOI] [PubMed] [Google Scholar]
- 22.Swen J.J., van der Wouden C.H., Manson L.E., Abdullah-Koolmees H., Blagec K., Blagus T., Böhringer S., Cambon-Thomsen A., Cecchin E., Cheung K.-C., et al. A 12-gene pharmacogenetic panel to prevent adverse drug reactions: an open-label, multicentre, controlled, cluster-randomised crossover implementation study. Lancet. 2023;401:347–356. doi: 10.1016/S0140-6736(22)01841-4. [DOI] [PubMed] [Google Scholar]
- 23.Mushiroda T., Takahashi Y., Onuma T., Yamamoto Y., Kamei T., Hoshida T., Takeuchi K., Otsuka K., Okazaki M., Watanabe M., et al. Association of HLA-A∗31:01 Screening With the Incidence of Carbamazepine-Induced Cutaneous Adverse Reactions in a Japanese Population. JAMA Neurol. 2018;75:842–849. doi: 10.1001/jamaneurol.2018.0278. [DOI] [PMC free article] [PubMed] [Google Scholar]
- 24.Pirmohamed M. Pharmacogenomics: current status and future perspectives. Nat. Rev. Genet. 2023;24:350–362. doi: 10.1038/s41576-022-00572-8. [DOI] [PubMed] [Google Scholar]
- 25.Nelson M.R., Johnson T., Warren L., Hughes A.R., Chissoe S.L., Xu C.-F., Waterworth D.M. The genetics of drug efficacy: opportunities and challenges. Nat. Rev. Genet. 2016;17:197–206. doi: 10.1038/nrg.2016.12. [DOI] [PubMed] [Google Scholar]
- 26.Relling M.V., Klein T.E. CPIC: Clinical Pharmacogenetics Implementation Consortium of the Pharmacogenomics Research Network. Clin. Pharmacol. Ther. 2011;89:464–467. doi: 10.1038/clpt.2010.279. [DOI] [PMC free article] [PubMed] [Google Scholar]
- 27.Shuldiner A.R., O’Connell J.R., Bliden K.P., Gandhi A., Ryan K., Horenstein R.B., Damcott C.M., Pakyz R., Tantry U.S., Gibson Q., et al. Association of Cytochrome P450 2C19 Genotype With the Antiplatelet Effect and Clinical Efficacy of Clopidogrel Therapy. JAMA. 2009;302:849–857. doi: 10.1001/jama.2009.1232. [DOI] [PMC free article] [PubMed] [Google Scholar]
- 28.Massey J., Plant D., Hyrich K., Morgan A.W., Wilson A.G., Spiliopoulou A., Colombo M., McKeigue P., Isaacs J., Cordell H., et al. Genome-wide association study of response to tumour necrosis factor inhibitor therapy in rheumatoid arthritis. Pharmacogenomics J. 2018;18:657–664. doi: 10.1038/s41397-018-0040-6. [DOI] [PMC free article] [PubMed] [Google Scholar]
- 29.Linskey D.W., Linskey D.C., McLeod H.L., Luzum J.A. The need to shift pharmacogenetic research from candidate gene to genome-wide association studies. Pharmacogenomics. 2021;22:1143–1150. doi: 10.2217/pgs-2021-0108. [DOI] [PMC free article] [PubMed] [Google Scholar]
- 30.Muhammad A., Aka I.T., Birdwell K.A., Gordon A.S., Roden D.M., Wei W.-Q., Mosley J.D., Van Driest S.L. Genome-Wide Approach to Measure Variant-Based Heritability of Drug Outcome Phenotypes. Clin. Pharmacol. Ther. 2021;110:714–722. doi: 10.1002/cpt.2323. [DOI] [PMC free article] [PubMed] [Google Scholar]
- 31.Patel A.P., Khera A.V. Advances and Applications of Polygenic Scores for Coronary Artery Disease. Annu. Rev. Med. 2023;74:141–154. doi: 10.1146/annurev-med-042921-112629. [DOI] [PMC free article] [PubMed] [Google Scholar]
- 32.Klarin D., Natarajan P. Clinical utility of polygenic risk scores for coronary artery disease. Nat. Rev. Cardiol. 2022;19:291–301. doi: 10.1038/s41569-021-00638-w. [DOI] [PMC free article] [PubMed] [Google Scholar]
- 33.Wray N.R., Lin T., Austin J., McGrath J.J., Hickie I.B., Murray G.K., Visscher P.M. From Basic Science to Clinical Application of Polygenic Risk Scores: A Primer. JAMA Psychiatr. 2021;78:101–109. doi: 10.1001/jamapsychiatry.2020.3049. [DOI] [PubMed] [Google Scholar]
- 34.Hao L., Kraft P., Berriz G.F., Hynes E.D., Koch C., Korategere V Kumar P., Parpattedar S.S., Steeves M., Yu W., Antwi A.A., et al. Development of a clinical polygenic risk score assay and reporting workflow. Nat. Med. 2022;28:1006–1013. doi: 10.1038/s41591-022-01767-6. [DOI] [PMC free article] [PubMed] [Google Scholar]
- 35.Adeyemo A., Balaconis M.K., Darnes D.R., Fatumo S., Granados Moreno P., Hodonsky C.J., Inouye M., Kanai M., Kato K., Knoppers B.M., et al. Responsible use of polygenic risk scores in the clinic: potential benefits, risks and gaps. Nat. Med. 2021;27:1876–1884. doi: 10.1038/s41591-021-01549-6. [DOI] [PubMed] [Google Scholar]
- 36.Khera A.V., Chaffin M., Aragam K.G., Haas M.E., Roselli C., Choi S.H., Natarajan P., Lander E.S., Lubitz S.A., Ellinor P.T., Kathiresan S. Genome-wide polygenic scores for common diseases identify individuals with risk equivalent to monogenic mutations. Nat. Genet. 2018;50:1219–1224. doi: 10.1038/s41588-018-0183-z. [DOI] [PMC free article] [PubMed] [Google Scholar]
- 37.Mavaddat N., Michailidou K., Dennis J., Lush M., Fachal L., Lee A., Tyrer J.P., Chen T.-H., Wang Q., Bolla M.K., et al. Polygenic Risk Scores for Prediction of Breast Cancer and Breast Cancer Subtypes. Am. J. Hum. Genet. 2019;104:21–34. doi: 10.1016/j.ajhg.2018.11.002. [DOI] [PMC free article] [PubMed] [Google Scholar]
- 38.Khera A.V., Emdin C.A., Drake I., Natarajan P., Bick A.G., Cook N.R., Chasman D.I., Baber U., Mehran R., Rader D.J., et al. Genetic Risk, Adherence to a Healthy Lifestyle, and Coronary Disease. N. Engl. J. Med. 2016;375:2349–2358. doi: 10.1056/NEJMoa1605086. [DOI] [PMC free article] [PubMed] [Google Scholar]
- 39.Hindy G., Aragam K.G., Ng K., Chaffin M., Lotta L.A., Baras A., Regeneron Genetics Center. Drake I., Orho-Melander M., Melander O., et al. Genome-Wide Polygenic Score, Clinical Risk Factors, and Long-Term Trajectories of Coronary Artery Disease. Arterioscler. Thromb. Vasc. Biol. 2020;40:2738–2746. doi: 10.1161/ATVBAHA.120.314856. [DOI] [PMC free article] [PubMed] [Google Scholar]
- 40.Lanfear D.E., Luzum J.A., She R., Gui H., Donahue M.P., O’Connor C.M., Adams K.F., Sanders-van Wijk S., Zeld N., Maeder M.T., et al. Polygenic Score for β-Blocker Survival Benefit in European Ancestry Patients With Reduced Ejection Fraction Heart Failure. Circ. Heart Fail. 2020;13 doi: 10.1161/CIRCHEARTFAILURE.119.007012. [DOI] [PMC free article] [PubMed] [Google Scholar]
- 41.Lanfear D.E., Luzum J.A., She R., Li J., Sabbah H.N., Zeld N., Liu B., Peterson E., Keoki Williams L. Validation of a Polygenic Score for Beta-Blocker Survival Benefit in Patients With Heart Failure Using the United Kingdom Biobank. Circ Genom Precis Med. 2023;16 doi: 10.1161/CIRCGEN.121.003835. [DOI] [PMC free article] [PubMed] [Google Scholar]
- 42.Oni-Orisan A., Tuteja S., Hoffecker G., Smith D.M., Castrichini M., Crews K.R., Murphy W.A., Nguyen N.H.K., Huang Y., Lteif C., et al. An Introductory Tutorial on Cardiovascular Pharmacogenetics for Healthcare Providers. Clin. Pharmacol. Ther. 2023;114:275–287. doi: 10.1002/cpt.2957. [DOI] [PMC free article] [PubMed] [Google Scholar]
- 43.Hunter D.J., Drazen J.M. Has the Genome Granted Our Wish Yet? N. Engl. J. Med. 2019;380:2391–2393. doi: 10.1056/NEJMp1904511. [DOI] [PubMed] [Google Scholar]
- 44.International Consortium on Lithium Genetics ConLi+Gen. Amare A.T., Schubert K.O., Hou L., Clark S.R., Papiol S., Heilbronner U., Degenhardt F., Tekola-Ayele F., Hsu Y.H., et al. Association of Polygenic Score for Schizophrenia and HLA Antigen and Inflammation Genes With Response to Lithium in Bipolar Affective Disorder: A Genome-Wide Association Study. JAMA Psychiatr. 2018;75:65–74. doi: 10.1001/jamapsychiatry.2017.3433. [DOI] [PMC free article] [PubMed] [Google Scholar]
- 45.Sigström R., Kowalec K., Jonsson L., Clements C.C., Karlsson R., Nordenskjöld A., Pålsson E., Sullivan P.F., Landén M. Association Between Polygenic Risk Scores and Outcome of ECT. Am. J. Psychiatr. 2022;179:844–852. doi: 10.1176/appi.ajp.22010045. [DOI] [PMC free article] [PubMed] [Google Scholar]
- 46.Oni-Orisan A., Hoffmann T.J., Ranatunga D., Medina M.W., Jorgenson E., Schaefer C., Krauss R.M., Iribarren C., Risch N. Characterization of Statin Low-Density Lipoprotein Cholesterol Dose-Response Using Electronic Health Records in a Large Population-Based Cohort. Circ Genom Precis Med. 2018;11 doi: 10.1161/CIRCGEN.117.002043. [DOI] [PMC free article] [PubMed] [Google Scholar]
- 47.Oni-Orisan A., Haldar T., Ranatunga D.K., Medina M.W., Schaefer C., Krauss R.M., Iribarren C., Risch N., Hoffmann T.J. The impact of adjusting for baseline in pharmacogenomic genome-wide association studies of quantitative change. NPJ Genom. Med. 2020;5 doi: 10.1038/s41525-019-0109-4. [DOI] [PMC free article] [PubMed] [Google Scholar]
- 48.Border R., Athanasiadis G., Buil A., Schork A.J., Cai N., Young A.I., Werge T., Flint J., Kendler K.S., Sankararaman S., et al. Cross-trait assortative mating is widespread and inflates genetic correlation estimates. Science. 2022;378:754–761. doi: 10.1126/science.abo2059. [DOI] [PMC free article] [PubMed] [Google Scholar]
- 49.Stone N.J., Robinson J.G., Lichtenstein A.H., Bairey Merz C.N., Blum C.B., Eckel R.H., Goldberg A.C., Gordon D., Levy D., Lloyd-Jones D.M., et al. 2013 ACC/AHA Guideline on the Treatment of Blood Cholesterol to Reduce Atherosclerotic Cardiovascular Risk in Adults: A Report of the American College of Cardiology/American Heart Association Task Force on Practice Guidelines. J. Am. Coll. Cardiol. 2014;63:2889–2934. doi: 10.1016/j.jacc.2013.11.002. [DOI] [PubMed] [Google Scholar]
- 50.Chou R., Cantor A., Dana T., Wagner J., Ahmed A.Y., Fu R., Ferencik M. Statin Use for the Primary Prevention of Cardiovascular Disease in Adults: Updated Evidence Report and Systematic Review for the US Preventive Services Task Force. JAMA. 2022;328:754–771. doi: 10.1001/jama.2022.12138. [DOI] [PubMed] [Google Scholar]
- 51.Sattar N., Preiss D., Murray H.M., Welsh P., Buckley B.M., de Craen A.J.M., Seshasai S.R.K., McMurray J.J., Freeman D.J., Jukema J.W., et al. Statins and risk of incident diabetes: a collaborative meta-analysis of randomised statin trials. Lancet. 2010;375:735–742. doi: 10.1016/S0140-6736(09)61965-6. [DOI] [PubMed] [Google Scholar]
- 52.Corrao G., Ibrahim B., Nicotra F., Soranna D., Merlino L., Catapano A.L., Tragni E., Casula M., Grassi G., Mancia G. Statins and the Risk of Diabetes: Evidence From a Large Population-Based Cohort Study. Diabetes Care. 2014;37:2225–2232. doi: 10.2337/dc13-2215. [DOI] [PubMed] [Google Scholar]
- 53.Preiss D., Seshasai S.R.K., Welsh P., Murphy S.A., Ho J.E., Waters D.D., DeMicco D.A., Barter P., Cannon C.P., Sabatine M.S., et al. Risk of Incident Diabetes With Intensive-Dose Compared With Moderate-Dose Statin Therapy: A Meta-analysis. JAMA. 2011;305:2556–2564. doi: 10.1001/jama.2011.860. [DOI] [PubMed] [Google Scholar]
- 54.Collins R., Reith C., Emberson J., Armitage J., Baigent C., Blackwell L., Blumenthal R., Danesh J., Smith G.D., DeMets D., et al. Interpretation of the evidence for the efficacy and safety of statin therapy. Lancet. 2016;388:2532–2561. doi: 10.1016/S0140-6736(16)31357-5. [DOI] [PubMed] [Google Scholar]
- 55.UK Prospective Diabetes Study (UKPDS) Group Effect of intensive blood-glucose control with metformin on complications in overweight patients with type 2 diabetes (UKPDS 34) Lancet. 1998;352:854–865. doi: 10.1016/S0140-6736(98)07037-8. [DOI] [PubMed] [Google Scholar]
- 56.UK Prospective Diabetes Study (UKPDS) Group United Kingdom Prospective Diabetes Study 24: A 6-Year, Randomized, Controlled Trial Comparing Sulfonylurea, Insulin, and Metformin Therapy in Patients with Newly Diagnosed Type 2 Diabetes That Could Not Be Controlled with Diet Therapy. Ann. Intern. Med. 1998;128:165–175. doi: 10.7326/0003-4819-128-3-199802010-00001. [DOI] [PubMed] [Google Scholar]
- 57.Maruthur N.M., Tseng E., Hutfless S., Wilson L.M., Suarez-Cuervo C., Berger Z., Chu Y., Iyoha E., Segal J.B., Bolen S. Diabetes medications as monotherapy or metformin-based combination therapy for type 2 diabetes: a systematic review and meta-analysis. Ann. Intern. Med. 2016;164:740–751. doi: 10.7326/M15-2650. [DOI] [PubMed] [Google Scholar]
- 58.Ma T., Tian X., Zhang B., Li M., Wang Y., Yang C., Wu J., Wei X., Qu Q., Yu Y., et al. Low-dose metformin targets the lysosomal AMPK pathway through PEN2. Nature. 2022;603:159–165. doi: 10.1038/s41586-022-04431-8. [DOI] [PMC free article] [PubMed] [Google Scholar]
- 59.Lachin J.M., Christophi C.A., Edelstein S.L., Ehrmann D.A., Hamman R.F., Kahn S.E., Knowler W.C., Nathan D.M., DDK Research Group Factors Associated With Diabetes Onset During Metformin Versus Placebo Therapy in the Diabetes Prevention Program. Diabetes. 2007;56:1153–1159. doi: 10.2337/db06-0918. [DOI] [PMC free article] [PubMed] [Google Scholar]
- 60.Coll A.P., Chen M., Taskar P., Rimmington D., Patel S., Tadross J.A., Cimino I., Yang M., Welsh P., Virtue S., et al. GDF15 mediates the effects of metformin on body weight and energy balance. Nature. 2020;578:444–448. doi: 10.1038/s41586-019-1911-y. [DOI] [PMC free article] [PubMed] [Google Scholar]
- 61.DeFronzo R.A., Goodman A.M. Efficacy of metformin in patients with non-insulin-dependent diabetes mellitus. N. Engl. J. Med. 1995;333:541–549. doi: 10.1056/NEJM199508313330902. [DOI] [PubMed] [Google Scholar]
- 62.Bhat A., Sebastiani G., Bhat M. Systematic review: Preventive and therapeutic applications of metformin in liver disease. World J. Hepatol. 2015;7:1652–1659. doi: 10.4254/wjh.v7.i12.1652. [DOI] [PMC free article] [PubMed] [Google Scholar]
- 63.Daly A.K., King B.P. Pharmacogenetics of oral anticoagulants. Pharmacogenetics. 2003;13:247–252. doi: 10.1097/01.fpc.0000054071.64000.bd. [DOI] [PubMed] [Google Scholar]
- 64.Landefeld C.S., Beyth R.J. Anticoagulant-related bleeding: Clinical epidemiology, prediction, and prevention. Am. J. Med. 1993;95:315–328. doi: 10.1016/0002-9343(93)90285-W. [DOI] [PubMed] [Google Scholar]
- 65.Loebstein R., Yonath H., Peleg D., Almog S., Rotenberg M., Lubetsky A., Roitelman J., Harats D., Halkin H., Ezra D. Interindividual variability in sensitivity to warfarin-Nature or nurture? Clin. Pharmacol. Ther. 2001;70:159–164. doi: 10.1067/mcp.2001.117444. [DOI] [PubMed] [Google Scholar]
- 66.Lopez-Olivo M.A., Siddhanamatha H.R., Shea B., Tugwell P., Wells G.A., Suarez-Almazor M.E. Methotrexate for treating rheumatoid arthritis. Cochrane Database of Systematic Reviews. 2014;q:q. doi: 10.1002/14651858.CD000957.pub2. [DOI] [PMC free article] [PubMed] [Google Scholar]
- 67.Salliot C., van der Heijde D. Long-term safety of methotrexate monotherapy in patients with rheumatoid arthritis: a systematic literature research. Ann. Rheum. Dis. 2009;68:1100–1104. doi: 10.1136/ard.2008.093690. [DOI] [PMC free article] [PubMed] [Google Scholar]
- 68.Dahl A., Nguyen K., Cai N., Gandal M.J., Flint J., Zaitlen N. A Robust Method Uncovers Significant Context-Specific Heritability in Diverse Complex Traits. Am. J. Hum. Genet. 2020;106:71–91. doi: 10.1016/j.ajhg.2019.11.015. [DOI] [PMC free article] [PubMed] [Google Scholar]
- 69.Gamazon E.R., Wheeler H.E., Shah K.P., Mozaffari S.V., Aquino-Michaels K., Carroll R.J., Eyler A.E., Denny J.C., GTEx Consortium. Nicolae D.L., et al. A gene-based association method for mapping traits using reference transcriptome data. Nat. Genet. 2015;47:1091–1098. doi: 10.1038/ng.3367. [DOI] [PMC free article] [PubMed] [Google Scholar]
- 70.Gusev A., Ko A., Shi H., Bhatia G., Chung W., Penninx B.W.J.H., Jansen R., de Geus E.J.C., Boomsma D.I., Wright F.A., et al. Integrative approaches for large-scale transcriptome-wide association studies. Nat. Genet. 2016;48:245–252. doi: 10.1038/ng.3506. [DOI] [PMC free article] [PubMed] [Google Scholar]
- 71.Almli L.M., Duncan R., Feng H., Ghosh D., Binder E.B., Bradley B., Ressler K.J., Conneely K.N., Epstein M.P. Correcting Systematic Inflation in Genetic Association Tests That Consider Interaction Effects: Application to a Genome-wide Association Study of Posttraumatic Stress Disorder. JAMA Psychiatr. 2014;71:1392–1399. doi: 10.1001/jamapsychiatry.2014.1339. [DOI] [PMC free article] [PubMed] [Google Scholar]
- 72.Peterson C.B., Bogomolov M., Benjamini Y., Sabatti C. TreeQTL: hierarchical error control for eQTL findings. Bioinformatics. 2016;32:2556–2558. doi: 10.1093/bioinformatics/btw198. [DOI] [PMC free article] [PubMed] [Google Scholar]
- 73.Peterson C.B., Bogomolov M., Benjamini Y., Sabatti C. Many Phenotypes Without Many False Discoveries: Error Controlling Strategies for Multitrait Association Studies. Genet. Epidemiol. 2016;40:45–56. doi: 10.1002/gepi.21942. [DOI] [PMC free article] [PubMed] [Google Scholar]
- 74.Sollis E., Mosaku A., Abid A., Buniello A., Cerezo M., Gil L., Groza T., Güneş O., Hall P., Hayhurst J., et al. The NHGRI-EBI GWAS Catalog: knowledgebase and deposition resource. Nucleic Acids Res. 2023;51:D977–D985. doi: 10.1093/nar/gkac1010. [DOI] [PMC free article] [PubMed] [Google Scholar]
- 75.Kamburov A., Pentchev K., Galicka H., Wierling C., Lehrach H., Herwig R. ConsensusPathDB: toward a more complete picture of cell biology. Nucleic Acids Res. 2011;39:D712–D717. doi: 10.1093/nar/gkq1156. [DOI] [PMC free article] [PubMed] [Google Scholar]
- 76.Mancuso N., Freund M.K., Johnson R., Shi H., Kichaev G., Gusev A., Pasaniuc B. Probabilistic fine-mapping of transcriptome-wide association studies. Nat. Genet. 2019;51:675–682. doi: 10.1038/s41588-019-0367-1. [DOI] [PMC free article] [PubMed] [Google Scholar]
- 77.Yamada Y., Seino Y. Physiology of GIP - A Lesson from GIP Receptor Knockout Mice. Horm. Metab. Res. 2004;36:771–774. doi: 10.1055/s-2004-826162. [DOI] [PubMed] [Google Scholar]
- 78.Ono S., Suzuki Y., Fukui N., Sugai T., Watanabe J., Tsuneyama N., Someya T. Association between the GIPR gene and the insulin level after glucose loading in schizophrenia patients treated with olanzapine. Pharmacogenomics J. 2012;12:507–512. doi: 10.1038/tpj.2011.28. [DOI] [PubMed] [Google Scholar]
- 79.Ogawa C., Tsuchiya K., Tomosugi N., Maeda K. A Hypoxia-Inducible Factor Stabilizer Improves Hematopoiesis and Iron Metabolism Early after Administration to Treat Anemia in Hemodialysis Patients. Int. J. Mol. Sci. 2020;21:7153. doi: 10.3390/ijms21197153. [DOI] [PMC free article] [PubMed] [Google Scholar]
- 80.Karvas R.M., Yang Y., Ezashi T., Schust D.J., Roberts R.M., Schulz L.C. ITGA1 is upregulated in response to oxygen over time in a BMP4 model of trophoblast. Mol. Reprod. Dev. 2018;85:738–739. doi: 10.1002/mrd.23047. [DOI] [PMC free article] [PubMed] [Google Scholar]
- 81.Claussnitzer M., Cho J.H., Collins R., Cox N.J., Dermitzakis E.T., Hurles M.E., Kathiresan S., Kenny E.E., Lindgren C.M., MacArthur D.G., et al. A brief history of human disease genetics. Nature. 2020;577:179–189. doi: 10.1038/s41586-019-1879-7. [DOI] [PMC free article] [PubMed] [Google Scholar]
- 82.Marderstein A.R., Kulm S., Peng C., Tamimi R., Clark A.G., Elemento O. A polygenic-score-based approach for identification of gene-drug interactions stratifying breast cancer risk. Am. J. Hum. Genet. 2021;108:1752–1764. doi: 10.1016/j.ajhg.2021.07.008. [DOI] [PMC free article] [PubMed] [Google Scholar]
- 83.Medina M.W., Gao F., Ruan W., Rotter J.I., Krauss R.M. Alternative Splicing of 3-Hydroxy-3-Methylglutaryl Coenzyme A Reductase Is Associated With Plasma Low-Density Lipoprotein Cholesterol Response to Simvastatin. Circulation. 2008;118:355–362. doi: 10.1161/CIRCULATIONAHA.108.773267. [DOI] [PMC free article] [PubMed] [Google Scholar]
- 84.Taylor B.A., Thompson P.D. Statins and Their Effect on PCSK9—Impact and Clinical Relevance. Curr. Atherosclerosis Rep. 2016;18:46. doi: 10.1007/s11883-016-0604-3. [DOI] [PubMed] [Google Scholar]
- 85.Gallego-Colon E., Daum A., Yosefy C. Statins and PCSK9 inhibitors: A new lipid-lowering therapy. Eur. J. Pharmacol. 2020;878 doi: 10.1016/j.ejphar.2020.173114. [DOI] [PubMed] [Google Scholar]
- 86.Ference B.A., Robinson J.G., Brook R.D., Catapano A.L., Chapman M.J., Neff D.R., Voros S., Giugliano R.P., Davey Smith G., Fazio S., Sabatine M.S. Variation in PCSK9 and HMGCR and Risk of Cardiovascular Disease and Diabetes. N. Engl. J. Med. 2016;375:2144–2153. doi: 10.1056/NEJMoa1604304. [DOI] [PubMed] [Google Scholar]
- 87.Horton J.D., Cohen J.C., Hobbs H.H. Molecular biology of PCSK9: its role in LDL metabolism. Trends Biochem. Sci. 2007;32:71–77. doi: 10.1016/j.tibs.2006.12.008. [DOI] [PMC free article] [PubMed] [Google Scholar]
- 88.Feng Q., Wei W.Q., Chung C.P., Levinson R.T., Bastarache L., Denny J.C., Stein C.M. The effect of genetic variation in PCSK9 on the LDL-cholesterol response to statin therapy. Pharmacogenomics J. 2017;17:204–208. doi: 10.1038/tpj.2016.3. [DOI] [PMC free article] [PubMed] [Google Scholar]
- 89.Pott J., Kheirkhah A., Gadin J.R., Kleber M.E., Delgado G.E., Kirsten H., Forer L., Hauck S.M., Burkhardt R., Scharnagl H., et al. Sex and statin-related genetic associations at the PCSK9 gene locus: results of genome-wide association meta-analysis. Biol. Sex Differ. 2024;15:26. doi: 10.1186/s13293-024-00602-6. [DOI] [PMC free article] [PubMed] [Google Scholar]
- 90.Mostafavi H., Harpak A., Agarwal I., Conley D., Pritchard J.K., Przeworski M. Variable prediction accuracy of polygenic scores within an ancestry group. Elife. 2020;9 doi: 10.7554/eLife.48376. [DOI] [PMC free article] [PubMed] [Google Scholar]
- 91.Zhu C., Ming M.J., Cole J.M., Edge M.D., Kirkpatrick M., Harpak A. Amplification is the primary mode of gene-by-sex interaction in complex human traits. Cell Genom. 2023;3 doi: 10.1016/j.xgen.2023.100297. [DOI] [PMC free article] [PubMed] [Google Scholar]
- 92.Privé F., Aschard H., Carmi S., Folkersen L., Hoggart C., O’Reilly P.F., Vilhjálmsson B.J. Portability of 245 polygenic scores when derived from the UK Biobank and applied to 9 ancestry groups from the same cohort. Am. J. Hum. Genet. 2022;109:12–23. doi: 10.1016/j.ajhg.2021.11.008. [DOI] [PMC free article] [PubMed] [Google Scholar]
- 93.Martin A.R., Kanai M., Kamatani Y., Okada Y., Neale B.M., Daly M.J. Clinical use of current polygenic risk scores may exacerbate health disparities. Nat. Genet. 2019;51:584–591. doi: 10.1038/s41588-019-0379-x. [DOI] [PMC free article] [PubMed] [Google Scholar]
- 94.Pazokitoroudi A., Liu Z., Dahl A., Zaitlen N., Rosset S., Sankararaman S. A scalable and robust variance components method reveals insights into the architecture of gene-environment interactions underlying complex traits. Am. J. Hum. Genet. 2024;111:1462–1480. doi: 10.1016/j.ajhg.2024.05.015. [DOI] [PMC free article] [PubMed] [Google Scholar]
- 95.Magnús Haraldsson H., Önundarson P.T., Einarsdóttir K.A., Guõmundsdóttir B.R., Pétursson M.K., Pálsson K., Kristinsson Á. Performance of Prothrombin-Proconvertin Time as a Monitoring Test of Oral Anticoagulation Therapy. Am. J. Clin. Pathol. 1997;107:672–680. doi: 10.1093/ajcp/107.6.672. [DOI] [PubMed] [Google Scholar]
- 96.Aquilante C.L., Langaee T.Y., Lopez L.M., Yarandi H.N., Tromberg J.S., Mohuczy D., Gaston K.L., Waddell C.D., Chirico M.J., Johnson J.A. Influence of coagulation factor, vitamin K epoxide reductase complex subunit 1, and cytochrome P450 2C9 gene polymorphisms on warfarin dose requirements. Clin. Pharmacol. Ther. 2006;79:291–302. doi: 10.1016/j.clpt.2005.11.011. [DOI] [PubMed] [Google Scholar]
- 97.Zhou D., Jiang Y., Zhong X., Cox N.J., Liu C., Gamazon E.R. A unified framework for joint-tissue transcriptome-wide association and Mendelian randomization analysis. Nat. Genet. 2020;52:1239–1246. doi: 10.1038/s41588-020-0706-2. [DOI] [PMC free article] [PubMed] [Google Scholar]
- 98.Thompson M., Gordon M.G., Lu A., Tandon A., Halperin E., Gusev A., Ye C.J., Balliu B., Zaitlen N. Multi-context genetic modeling of transcriptional regulation resolves novel disease loci. Nat. Commun. 2022;13:5704. doi: 10.1038/s41467-022-33212-0. [DOI] [PMC free article] [PubMed] [Google Scholar]
- 99.Hu Y., Li M., Lu Q., Weng H., Wang J., Zekavat S.M., Yu Z., Li B., Gu J., Muchnik S., et al. A statistical framework for cross-tissue transcriptome-wide association analysis. Nat. Genet. 2019;51:568–576. doi: 10.1038/s41588-019-0345-7. [DOI] [PMC free article] [PubMed] [Google Scholar]
- 100.Bhattacharya A., García-Closas M., Olshan A.F., Perou C.M., Troester M.A., Love M.I. A framework for transcriptome-wide association studies in breast cancer in diverse study populations. Genome Biol. 2020;21:42. doi: 10.1186/s13059-020-1942-6. [DOI] [PMC free article] [PubMed] [Google Scholar]
- 101.Weissbrod O., Flint J., Rosset S. Estimating SNP-Based Heritability and Genetic Correlation in Case-Control Studies Directly and with Summary Statistics. Am. J. Hum. Genet. 2018;103:89–99. doi: 10.1016/j.ajhg.2018.06.002. [DOI] [PMC free article] [PubMed] [Google Scholar]
- 102.Barber M.J., Mangravite L.M., Hyde C.L., Chasman D.I., Smith J.D., McCarty C.A., Li X., Wilke R.A., Rieder M.J., Williams P.T., et al. Genome-Wide Association of Lipid-Lowering Response to Statins in Combined Study Populations. PLoS One. 2010;5 doi: 10.1371/journal.pone.0009763. [DOI] [PMC free article] [PubMed] [Google Scholar]
- 103.Chasman D.I., Giulianini F., MacFadyen J., Barratt B.J., Nyberg F., Ridker P.M. Genetic determinants of statin-induced low-density lipoprotein cholesterol reduction: the Justification for the Use of Statins in Prevention: an Intervention Trial Evaluating Rosuvastatin (JUPITER) trial. Circ. Cardiovasc. Genet. 2012;5:257–264. doi: 10.1161/CIRCGENETICS.111.961144. [DOI] [PubMed] [Google Scholar]
- 104.Deshmukh H.A., Colhoun H.M., Johnson T., McKeigue P.M., Betteridge D.J., Durrington P.N., Fuller J.H., Livingstone S., Charlton-Menys V., Neil A., et al. Genome-wide association study of genetic determinants of LDL-c response to atorvastatin therapy: importance of Lp(a) J. Lipid Res. 2012;53:1000–1011. doi: 10.1194/jlr.P021113. [DOI] [PMC free article] [PubMed] [Google Scholar]
- 105.Postmus I., Trompet S., Deshmukh H.A., Barnes M.R., Li X., Warren H.R., Chasman D.I., Zhou K., Arsenault B.J., Donnelly L.A., et al. Pharmacogenetic meta-analysis of genome-wide association studies of LDL cholesterol response to statins. Nat. Commun. 2014;5:5068. doi: 10.1038/ncomms6068. [DOI] [PMC free article] [PubMed] [Google Scholar]
- 106.Hagberg A.A., Schult D.A., Swart P.J. Los Alamos National Laboratory (LANL); 2008. Exploring Network Structure, Dynamics, and Function Using NetworkX. [Google Scholar]
- 107.Privé F., Aschard H., Ziyatdinov A., Blum M.G.B. Efficient analysis of large-scale genome-wide data with two R packages: bigstatsr and bigsnpr. Bioinformatics. 2018;34:2781–2787. doi: 10.1093/bioinformatics/bty185. [DOI] [PMC free article] [PubMed] [Google Scholar]
- 108.Privé F., Aschard H., Blum M.G.B. Efficient Implementation of Penalized Regression for Genetic Risk Prediction. Genetics. 2019;212:65–74. doi: 10.1534/genetics.119.302019. [DOI] [PMC free article] [PubMed] [Google Scholar]
- 109.Yang J., Lee S.H., Goddard M.E., Visscher P.M. GCTA: A Tool for Genome-wide Complex Trait Analysis. Am. J. Hum. Genet. 2011;88:76–82. doi: 10.1016/j.ajhg.2010.11.011. [DOI] [PMC free article] [PubMed] [Google Scholar]
- 110.Zeileis A., Köll S., Graham N. Various versatile variances: an object-oriented implementation of clustered covariances in R. J. Stat. Software. 2020;95:1–36. doi: 10.18637/jss.v095.i01. [DOI] [Google Scholar]
- 111.Zeileis A. Econometric Computing with HC and HAC Covariance Matrix Estimators. J Statistical Software. 2004;11:1–17. doi: 10.18637/jss.v011.i10. [DOI] [Google Scholar]
- 112.Bycroft C., Freeman C., Petkova D., Band G., Elliott L.T., Sharp K., Motyer A., Vukcevic D., Delaneau O., O’Connell J., et al. The UK Biobank resource with deep phenotyping and genomic data. Nature. 2018;562:203–209. doi: 10.1038/s41586-018-0579-z. [DOI] [PMC free article] [PubMed] [Google Scholar]
- 113.GTEX Consortium. Ardlie K.G., Deluca D.S., Segrè A.V., Sullivan T.J., Young T.R., Gelfand E.T., Trowbridge C.A., Maller J.B., Tukiainen T., et al. The Genotype-Tissue Expression (GTEx) pilot analysis: multitissue gene regulation in humans. Science. 2015;348:648–660. doi: 10.1126/science.1262110. [DOI] [PMC free article] [PubMed] [Google Scholar]
- 114.Thompson D.J., Wells D., Selzam S., Peneva I., Moore R., Sharp K., Tarran W.A., Beard E.J., Riveros-Mckay F., Giner-Delgado C., et al. A systematic evaluation of the performance and properties of the UK Biobank Polygenic Risk Score (PRS) Release. PLoS One. 2024;19 doi: 10.1371/journal.pone.0307270. [DOI] [PMC free article] [PubMed] [Google Scholar]
- 115.Yuan S., Burgess S., Laffan M., Mason A.M., Dichgans M., Gill D., Larsson S.C. Genetically Proxied Inhibition of Coagulation Factors and Risk of Cardiovascular Disease: A Mendelian Randomization Study. J. Am. Heart Assoc. 2021;10 doi: 10.1161/JAHA.120.019644. [DOI] [PMC free article] [PubMed] [Google Scholar]
- 116.Hivert V., Sidorenko J., Rohart F., Goddard M.E., Yang J., Wray N.R., Yengo L., Visscher P.M. Estimation of non-additive genetic variance in human complex traits from a large sample of unrelated individuals. Am. J. Hum. Genet. 2021;108:786–798. doi: 10.1016/j.ajhg.2021.02.014. [DOI] [PMC free article] [PubMed] [Google Scholar]
- 117.Cornelis M.C., Tchetgen E.J.T., Liang L., Qi L., Chatterjee N., Hu F.B., Kraft P. Gene-Environment Interactions in Genome-Wide Association Studies: A Comparative Study of Tests Applied to Empirical Studies of Type 2 Diabetes. Am. J. Epidemiol. 2012;175:191–202. doi: 10.1093/aje/kwr368. [DOI] [PMC free article] [PubMed] [Google Scholar]
- 118.Tchetgen E.J.T., Kraft P. On the Robustness of Tests of Genetic Associations Incorporating Gene-environment Interaction When the Environmental Exposure is Misspecified. Epidemiology. 2011;22:257–261. doi: 10.1097/EDE.0b013e31820877c5. [DOI] [PMC free article] [PubMed] [Google Scholar]
- 119.Flutre T., Wen X., Pritchard J., Stephens M. A Statistical Framework for Joint eQTL Analysis in Multiple Tissues. PLoS Genet. 2013;9 doi: 10.1371/journal.pgen.1003486. [DOI] [PMC free article] [PubMed] [Google Scholar]
- 120.Wheeler H.E., Shah K.P., Brenner J., Garcia T., Aquino-Michaels K., GTEx Consortium. Cox N.J., Nicolae D.L., Im H.K. Survey of the Heritability and Sparse Architecture of Gene Expression Traits across Human Tissues. PLoS Genet. 2016;12 doi: 10.1371/journal.pgen.1006423. [DOI] [PMC free article] [PubMed] [Google Scholar]
Associated Data
This section collects any data citations, data availability statements, or supplementary materials included in this article.
Supplementary Materials
Columns 12 and 20 indicate if a given association was found significant (1) or not significant (0) in the main or restricted analyses, respectively. For example, there are 170 statin-interacting genes for LDL cholesterol in this table: 156 are significant in the main analysis (and indicated with 1 in column 12); the additional 14 genes are identified by the restricted analysis (all the genes identified in this analysis are indicated with 1 in column 20). Columns 13 and 21 indicate associations that replicated in each study
TWAS for the change in LDL cholesterol after statin initiation in individuals of European ancestry from the Kaiser Permanente GERA cohort.S14
Data Availability Statement
-
•
This paper analyzes existing, publicly available data. These accession numbers for the datasets are listed in the key resources table.
-
•
All original code has been deposited at https://github.com/michalsad/txewas_scripts and is publicly available as of the date of publication. DOIs are listed in the key resources table.
-
•
Any additional information required to reanalyze the data reported in this paper is available from the lead contact upon request.