Abstract
Matrix-assisted laser desorption/ionization (MALDI), surface-assisted laser desorption/ionization (SALDI), and time-of-flight mass spectrometry (TOFMS) imaging are used for visualizing the spatial distribution of analytes. Mass spectrometry (MS) imaging of a sample with a rough surface with a uniform distribution of an analyte does not provide uniform ion intensities in the image. A shift in the m/z value of the analyte ions is also observed. To resolve these issues, we proposed a normalization method for obtaining images based on the actual localization of an analyte. A platinum (Pt) film was used to facilitate ionization in SALDI. The Pt ions obtained from the film and copper(II)-phthalocyanine from a commercial blue pigment were used to evaluate the shift in the m/z values and ion intensities originating from the sample surface placed diagonally. The relationship between the shift in the m/z value and peak area in mass spectra was determined by analyzing the relationship between the shift and irradiated height position, as well as between the peak area and irradiated height position on the sample. The SALDI image can be obtained based on the actual location of the analyte to normalize the raw image data. Thus, the normalization of the ion intensities enables SALDI-MS imaging of samples with rough surfaces using high-resolution TOFMS. The proposed normalization method for SALDI-MS imaging enhances the accuracy and resolution of analyte localization on rough surfaces, benefiting applications in material science, biomedical research, forensic analysis, and industrial quality control.
Keywords: normalization, Pt sputtering, mass spectrometry imaging, SALDI-MS
INTRODUCTION
Matrix-assisted laser desorption/ionization (MALDI) is one of the most useful ionization methods in mass spectrometry (MS).1,2) In MALDI, UV-absorbing organic compounds are required as the matrix to facilitate ionization. A mixed cocrystal of the matrix and samples can be ionized by irradiation with a UV-pulsed laser. High-molecular-weight compounds can be detected without degradation using MALDI-MS. Hence, it is widely used to analyze biomolecules3,4) and polymers.5,6) Mass spectrometry imaging (MSI) is performed by automatically scanning the sample plates for each MALDI-MS measurement. It is important to confirm the accuracy of the localized images of the targeted molecular ions obtained via MALDI-MSI; however, studies evaluating the quantitation of MALDI are limited.7) MALDI images of samples with a rough surface obtained by MALDI-time-of-flight mass spectrometry (TOFMS) imaging demonstrated shifts in m/z values and an increase/decrease in ion yields.8,9) The selection of the matrix and solvent for different types of analyte molecules is critical for MALDI. The state and shape of the analyte/matrix co-crystal affect the reproducibility. Manual matrix spray-coating methods are generally used as pretreatments for MALDI/MSI.10) The method requires a suitable technique for uniformly applying the matrix, which if less uniformly applied, can significantly reduce the surface roughness. Recently, chemical vapor deposition11) and two-step matrix deposition have been reported as matrix coating methods.12,13) Furthermore, an automatic matrix spraying system has been developed.14,15) The small droplets of sprayed matrix aerosols on the sample surface extract analytes reduce the crystal size and improve matrix homogeneity. Surface-assisted laser desorption/ionization (SALDI) utilizing UV-absorbing graphite,16) metal particles,17) and thin metal films18–20) as substrate materials for ionization have also been reported. The metal film produced by sputtering is uniform at the nanometer scale. Although the accumulation of electrical charge on the surface of a sample during analysis can interfere with the accuracy of the measurements, the SALDI-MS with a metal film can be easily formed on the sample to enhance conductivity on the surface and reduce charge-up. Therefore, the SALDI-MS using a metal film is suitable for MS imaging.21) In the SALDI-TOFMS using the metal film, the rough surface of the sample with a uniform distribution of components demonstrated an increase/decrease in the ion yields at each pixel, similar to MALDI. Unevenness was observed in the MALDI images of the homogeneously distributed compounds in the sample. In MSI, the localization image obtained from materials with rough surfaces, which are difficult to process by polishing and slicing, does not correspond to the actual distribution. Therefore, it is important to acquire MALDI and SALDI images that are independent of the surface shape in MS imaging using TOFMS.
High-resolution MALDI-TOFMS can determine variations in m/z for each ion as they reach the detector, based on their respective flight time. Kune et al. reported a shift in the observed m/z value and an increase/decrease in the ion intensity in the MALDI-TOFMS of a sample with a rough surface.8) However, detailed evaluations and improvements of the shift in m/z value and ion yield have not been achieved. We performed SALDI/MS imaging of sloped samples and layered paper samples as standard models of rough surfaces and investigated a calculation procedure to normalize the obtained SALDI images.
EXPERIMENTAL
Reagents
A stainless-steel plate (STA Hydrophobic NF 24 × 16 c) purchased from Hudson Surface Technology (Fort Lee, NJ, USA) was cut into 25 mm squares. A Pt target (purity: 99.99%) for sputtering and double-sided carbon tape were purchased from Furuuchi Chemical Co. (Tokyo, Japan) and Nisshin EM Co. (Tokyo, Japan), respectively. Tetrahydrofuran (THF) with no additives and phthalocyanine were purchased from FUJIFILM WAKO Pure Chemical Co. (Osaka, Japan). Water was purified using a Milli-Q integral system (Merck Millipore, Burlington, MA, USA). A PR-L5800C-13 (NEC, Tokyo, Japan) toner ink for the laser printer was used as the sample containing the blue pigment.
Sample preparation
In the sputtering experiment, a Pt film was fabricated on the surface of a target sample for SALDI-MS imaging at an air pressure of 10 Pa, 100 W power, and 90 s deposition time using a magnetron sputtering system (SVC-700RF I; SANYU ELECTRON, Tokyo, Japan). The Pt-deposited sample was attached to a stainless-steel sample holder (multi-target plate, JEOL, Tokyo, Japan) using conductive carbon tape for MALDI-MS. To evaluate the Pt cluster ions, the Pt film sample deposited on a 25 mm square stainless-steel plate was analyzed via SALDI/MS.
In the analysis of the blue toner ink, the sample solution containing the ink was prepared in H2O/THF = 1/1 (v/v) at a concentration of 100 µg/mL. The prepared solution was uniformly applied onto a 25 mm square stainless-steel plate using an air gun sprayer (Procon Boy WA Double Action Platinum 0.2 mm, GSI Creos Hobby Dept., Tokyo, Japan). Subsequently, the sample was coated with the Pt film and analyzed via SALDI-MS.
Instrumentation
A JMS-S3000 SpiralToFTM-plus (JEOL, Tokyo, Japan) equipped with an Nd:YLF laser (349 nm) was used for the SALDI-MS. All the mass spectra were acquired via SALDI/MS in the positive-ion and spiral modes using msTornadoTM Control (JEOL, Tokyo, Japan). The spot diameter of the laser was approximately 20 µm, and the step size for the raster pattern was set to 200 µm in the imaging experiments. The acceleration voltage, laser frequency, laser intensity, and pulsed-ion extraction delay time of SALDI-MS were set to 20 kV, 250 Hz, 60%, and 150 ns, respectively. Each spectrum was acquired with 125 laser shots. Ten mass spectra were acquired and accumulated for each pixel.
The raw data of SALDI-MS were analyzed using the msTornadoTM Analysis (JEOL, Tokyo, Japan) and msMicroImagerTM (JEOL, Tokyo, Japan) software. Ion images of the selected signals at a width of 1 Da (±0.5 Da) were created in the MS imaging data. In normalization, the values of the peak area observed in the mass spectrum were obtained using software, the values were calculated for normalization, and the localization image was reconstructed.
RESULTS AND DISCUSSION
SALDI-MS imaging of the diagonally placed sample
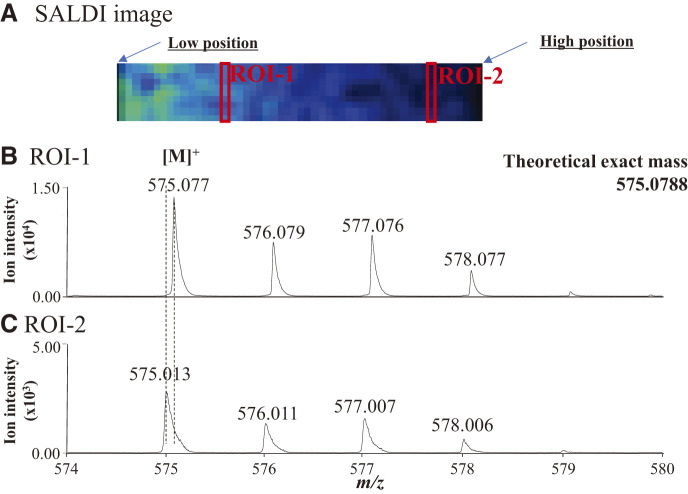
If the height position of the sample irradiated by the laser changes, the m/z values in the resulting mass spectrum will shift. This phenomenon could be demonstrated using a stainless-steel plate coated with blue ink, which was placed diagonally at an arbitrary angle to evaluate its effect on the MALDI images of rough sample surfaces. A SALDI image of the copper(II)-phthalocyanine ion obtained from the blue ink sample using SALDI/MSI is shown in Fig. 1A, demonstrating [M]+ of the copper(II)-phthalocyanine. An ion is produced by receiving an electron from the plate in SALDI. Mass spectra for each pixel were acquired every 200 µm as the raster step size was 200 µm in this SALDI/MSI. The ion intensity of copper(II)-phthalocyanine at the lower position was high.
Fig. 1. SALDI image of (A) copper(II)-phthalocyanine ion in blue toner ink and the mass spectra in (B) ROI-1 and (C) ROI-2. SALDI, surface-assisted laser desorption/ionization.
The ion intensity of phthalocyanine placed at a lower position was high in the SALDI image, despite the uniform distribution of the sample. The average mass spectra of ROI-1 and ROI-2 are shown in Figs. 1B and 1C, respectively. The intensity of the copper(II)-phthalocyanine ion in the average mass spectrum obtained from ROI-1 at a low position was 10 times higher than that from ROI-2. This result was consistent with those of a previous study.8) The m/z value of the ion from ROI-1 was slightly higher for m/z 575.077 than that from ROI-2 for m/z 574.013. This indicates that an actual localized image of the sample for SALDI-MSI can be created by calculating the ion intensity based on the shift in the m/z value.
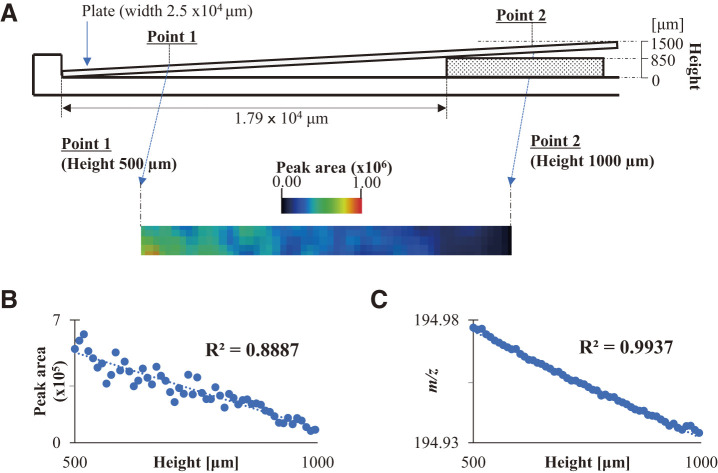
First, the relationship between the shifts in the m/z value and ion intensities was evaluated. A stainless-steel plate with deposited Pt was used as the standard sample. The Pt plate was diagonally placed on the MALDI sample plate with a 1000 μm groove to evaluate the m/z value and ion intensity of the Pt ion produced by the Pt film. The amount of analyte ions in the mass spectrum obtained by imaging analysis was evaluated based on the peak area rather than the ion intensity. The surface height of the sample was 9.3 μm/pixel from the angle and length of the sample plate. The experimental setup is shown in Fig. 2A. The m/z calibration was performed by the Pt ions generated from the sample at a height of 500 μm. The sample was measured by SALDI-MSI at heights ranging from 500 to 1000 μm. In the experiment, the Pt ion of the sample at a height of 500 μm demonstrated the largest peak area. The SALDI image of the Pt ion observed at an m/z value of 195 is shown in Fig. 2A. The samples at a higher position yielded a lesser intensity of the Pt ions. The correlation between the peak area and sample position at heights in the range 500–1000 μm is presented in Fig. 2B, demonstrating a linear relationship. A height difference of 500 µm at the irradiated position resulted in a decrease in the detection sensitivity of the sample. This decrease in detection sensitivity can be attributed to the defocusing of the laser. The results suggest that the laser energy transferred to the sample depends on the irradiated height position on the sample, owing to the movement of the sample plate with a constant laser focus in SALDI-MSI.
Fig. 2. The setup of (A) the SALDI sample plate placed diagonally for SALDI-MSI and the correlation plots (B) between the peak area and sample position at heights, and (C) between the exact m/z values and sample position at heights in the range 500–1000 μm. SALDI-MSI, surface-assisted laser desorption/ionization-mass spectrometry imaging.
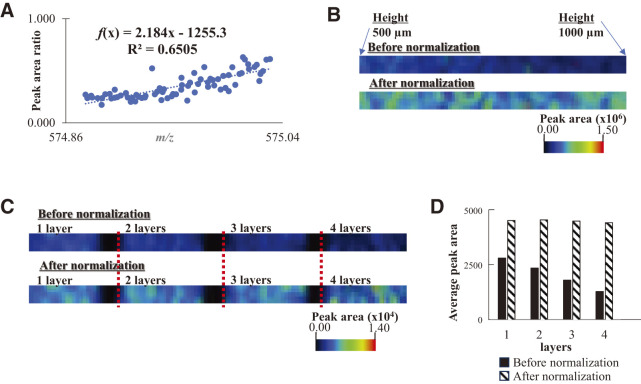
Subsequently, the correlation between the exact m/z values and sample position at heights in the range 500–1000 μm is shown in Fig. 2C. The ions expelled from the ion source are separated according to their velocities in the ion source. The ions reached the detector at a constant velocity in the TOFMS. The time before reaching the detector determined the m/z value of the ions. Therefore, the distance between the detector and the ion source or ion generation position is the most important factor affecting the m/z values. A good linearity between the m/z values and height was observed in the correlation plot shown in Fig. 2C. These results prove that the m/z values and peak areas of the Pt ions are related to the height of the sample. The relationship between the m/z shift and the decrease in peak area due to defocusing caused by the change in irradiated height position was shown. The ratio of this peak area decrease is (the highest peak area obtained at a height position of 500 µm)/(small peak area obtained by defocusing). The highest peak area was set as 1.000, the peak area ratio obtained by defocusing was set as Aref, and a correlation plot was created with the area ratio as the vertical axis. Figure 3A presents a scatter plot demonstrating the direct relationship between the shift in the m/z value and peak area ratio for the Pt ion at an m/z value of 195, indicating linear plots. The vertical axis in the correlation plot is the ratio of peak area obtained at each height related to 1.000 of the highest peak area. The ratio of the decrease in the peak area originating from the height of the sample was calculated from the shift in the m/z value of the target ion. This indicates that the recalculation of the SALDI imaging data with a decreased ratio provides the actual localization of the target sample; f(x) = 18.6855x − 3642.2514 was the linear equation used to calculate the decrease in the peak area from the shift (x: exact mass). The detected and normalized peak areas of the Pt ion are indicated by Sdetected and Scalcud. In this experiment, the detected m/z value was used to estimate Aref, a dimensionless number, using a linear equation. At the sample height determined by the shifted m/z value, the peak area decreases due to defocusing. This reduction ratio is represented as 1/Aref. The following equation was proposed to calculate the normalized peak area (Scalcud) from Sdetected and Aref as follows:
| (1) |
Fig. 3. The correlation plots of Pt ion (A) between the exact m/z values and the peak area ratio and (B) the SALDI image before normalization and after normalization. SALDI, surface-assisted laser desorption/ionization.
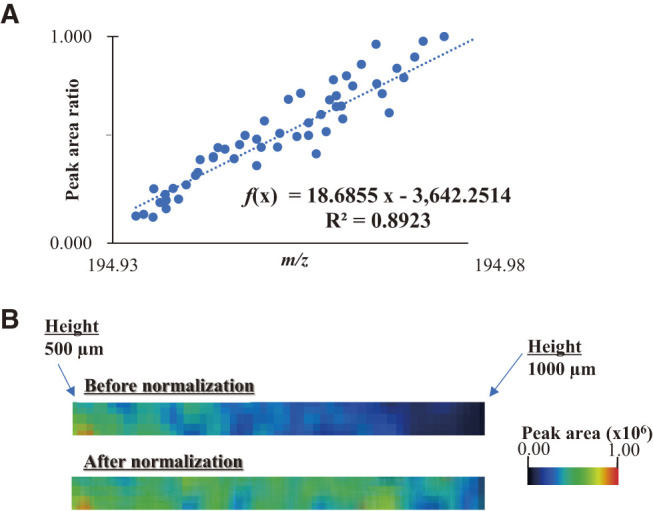
The SALDI images for an m/z value of 195 before and after normalization are shown in Fig. 3B. Before normalization, the image had a color gradient, indicating a misleading impression of the non-uniform distribution of Pt. Conversely, the normalized SALDI image was improved, demonstrating a uniform color.
Relationship between the peak area and m/z values of the Pt cluster ions
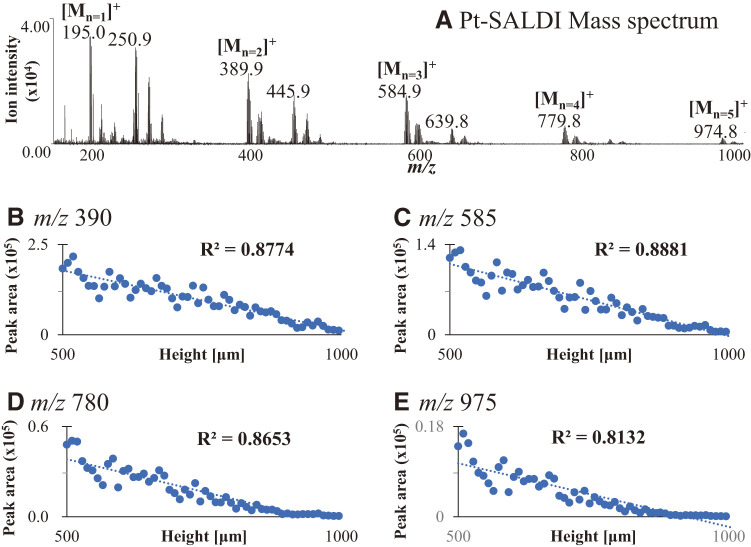
The trends in the shifts for the m/z values of the Pt cluster ions were investigated. Pt ion and Pt cluster ions were observed in the SALDI mass spectrum of Pt film (Fig. 4A). The correlations between the peak area and sample position as height are shown in Figs. 4B–4E. The Pt ions of the dimer, trimer, tetramer, and pentamer at m/z values of 390, 585, 780, and 975, respectively, were verified in this experiment. Scatter plots were obtained for each Pt cluster ion, demonstrating linearities of R2 = 0.877 for m/z 390, R2 = 0.888 for m/z 585, R2 = 0.865 for m/z 780, and R2 = 0.813 for m/z 975. The slope of the equation in the plot for the height position versus the peak area of the Pt cluster ion was lower at high m/z values. The slopes were −331 for m/z 390, −224 for m/z 585, −87 for m/z 780, and −25 for m/z 975. This indicates that the mass shift or decrease in the peak area in the analysis of the Pt cluster ion can be predicted because the m/z value and slope of the equation were proportional. However, this prediction method cannot be applied to other ions that have physicochemical properties significantly different from those of the Pt cluster ions. The efficiencies of the energy transfer, sublimation, and desorption/ionization of the compounds, rather than the m/z values, were important factors in the decreases and shifts.
Fig. 4. SALDI mass spectrum of (A) Pt film and the correlation plots of (B) Pt dimer for m/z 390, (C) trimer for m/z 585, (D) tetramer for m/z 780, and (E) pentamer for m/z 975 between the peak area and sample position at heights. SALDI, surface-assisted laser desorption/ionization.
SALDI image of the pigment for laser printing
The SALDI-MS imaging of pigments in the blue toner for laser printing and normalization of the SALDI image data were performed. Toner ink solution containing copper(II)-phthalocyanine was sprayed onto a stainless-steel plate, which was diagonally placed, as indicated in the aforementioned experiment. The sample was analyzed by SALDI-MS imaging at a sample height ranging from 500 to 1000 μm. The peak area ratio of the copper(II)-phthalocyanine ion versus the m/z values was plotted for heights ranging between 500 and 1000 μm, as shown in Fig. 5A. The plots demonstrate a linear relationship. However, the slope cannot be predicted from the shift in the m/z values of the Pt ions. We normalized the SALDI image using this linear function as a reference (Fig. 5B). The peak area of the copper(II)-phthalocyanine ion was small in the SALDI image before normalization at a higher position in the sample.
Fig. 5. The correlation plots (A) between the exact m/z values and the peak area ratio for the copper(II)-phthalocyanine ion. The SALDI image before and after normalization for the ion from (B) ink-coated plate and (C) layered paper with printing ink, and (D) the comparison of average peak areas before and after normalization for the layered paper. SALDI, surface-assisted laser desorption/ionization.
Printed papers with blue ink by a laser printer were prepared. The papers, each with a thickness of 0.1 mm, were layered with a slight offset from one another. The layering parts of the paper are thicker. The paper sample was attached to the stainless-steel plate with aluminum tape. The layered papers were coated with the Pt film and used as samples. The SALDI image is shown in Fig. 5C. The image data were normalized to acquire the actual localization information. At the corners where the papers overlapped, the intensities of the copper(II)-phthalocyanine were low. The corners of the paper distorted the electric field. It has seemed to result in a decrease in the efficiency of ion transport to the detector. The average peak areas before and after normalization are shown in Fig. 5D. However, the average excludes data from pixels with area values less than 1000. The normalized SALDI image indicates that copper(II)-phthalocyanine was uniformly distributed on the surface of the sample.
CONCLUSION
The MALDI- and SALDI-MSI of the sample with a non-flat surface dispersing the analyte uniformly provided an image of the analyte ion with a non-uniform distribution. This is because the laser energy transferred to the sample depends on the irradiated height position on the sample, owing to the movement of the sample plate with a constant laser focus. In this study, a normalization method was proposed to obtain the roughness-independent SALDI image data using high-resolution TOFMS. The relationship between the shift in the m/z value and peak area was determined from the correlation between the shift and irradiated height position, as well as between the peak area and irradiated height position on the sample. The SALDI image was obtained according to the actual location of the analyte to normalize the raw image data using the relevant equation. Determining the contribution of SALDI-MSI to the conductivity of a sample surface is a useful analytical method in various fields.
ACKNOWLEDGMENTS
This work was supported by JSPS KAKENHI (grant number 23K11323) and the 2024 Ame Hisaharu Foundation.
Mass Spectrom (Tokyo) 2024; 13(1): A0166
REFERENCES
- 1).M. Karas, F. Hillenkamp. Laser desorption ionization of proteins with molecular masses exceeding 10,000 daltons. Anal. Chem. 60: 2299–2301, 1988. [DOI] [PubMed] [Google Scholar]
- 2).K. Tanaka, H. Waki, Y. Ido, S. Akita, Y. Yoshida, T. Yoshida, T. Matsuo. Protein and polymer analyses up to m/z 100000 by laser ionization time-of-flight mass spectrometry. Rapid Commun. Mass Spectrom. 2: 151–153, 1988. [Google Scholar]
- 3).R. Aebersold, D. R. Goodlett. Mass spectrometry in proteomics. Chem. Rev. 101: 269–295, 2001. [DOI] [PubMed] [Google Scholar]
- 4).R. M. Caprioli, T. B. Farmer, J. Gile. Molecular imaging of biological samples: Localization of peptides and proteins using MALDI-TOF MS. Anal. Chem. 69: 4751–4760, 1997. [DOI] [PubMed] [Google Scholar]
- 5).L. Li. MALDI Mass Spectrometry for Synthetic Polymer Analysis. Wiley, 2010. [Google Scholar]
- 6).S. M. Weidner, J. Falkenhagen. Imaging mass spectrometry for examining localization of polymeric composition in matrix-assisted laser desorption/ionization samples. Rapid Commun. Mass Spectrom. 23: 653–660, 2009. [DOI] [PubMed] [Google Scholar]
- 7).I. Osaka, K. Okumura, N. Miyake, T. Watanabe, K. Nozaki, H. Kawasaki, R. Arakawa. Quantitative analysis of an antioxidant additive in insoluble plastics by surface-assisted laser desorption/ionization mass spectrometry (SALDI-MS) using TiO2 nanoparticles. J. Mass Spectrom. Soc. Jpn. 58: 123–127, 2010. [Google Scholar]
- 8).A. McCann, S. Rappe, R. La Rocca, M. Tiquet, L. Quinton, G. Eppe, J. Far, E. De Pauw, C. Kune. Mass shift in mass spectrometry imaging: Comprehensive analysis and practical corrective workflow. Anal. Bioanal. Chem. 413: 2831–2844, 2021. [DOI] [PubMed] [Google Scholar]
- 9).A. Scherl, C. G. Zimmermann-Ivol, J. Di Dio, A. R. Vaezzadeh, P. A. Binz, M. Amez-Droz, R. Cochard, J. C. Sanchez, M. Glückmann, D. F. Hochstrasser. Gold coating of non-conductive membranes before matrix-assisted laser desorption/ionization tandem mass spectrometric analysis prevents charging effect. Rapid Commun. Mass Spectrom. 19: 605–610, 2005. [DOI] [PubMed] [Google Scholar]
- 10).E. Gemperline, S. Rawson, L. Li. Optimization and comparison of multiple MALDI matrix application methods for small molecule mass spectrometric imaging. Anal. Chem. 86: 10030–10035, 2014. [DOI] [PMC free article] [PubMed] [Google Scholar]
- 11).J. A. Hankin, R. M. Barkley, R. C. Murphy. Sublimation as a method of matrix application for mass spectrometric imaging. J. Am. Soc. Mass Spectrom. 18: 1646–1652, 2007. [DOI] [PMC free article] [PubMed] [Google Scholar]
- 12).W. Bouschen, O. Schulz, D. Eikel, B. Spengler. Matrix vapor deposition/recrystallization and dedicated spray preparation for high-resolution scanning microprobe matrix-assisted laser desorption/ionization imaging mass spectrometry (SMALDI-MS) of tissue and single cells. Rapid Commun. Mass Spectrom. 24: 355–364, 2010. [DOI] [PubMed] [Google Scholar]
- 13).S. Shimma, Y. Takashima, J. Hashimoto, K. Yonemori, K. Tamura, A. Hamada. Alternative two-step matrix application method for imaging mass spectrometry to avoid tissue shrinkage and improve ionization efficiency. J. Mass Spectrom. 48: 1285–1290, 2013. [DOI] [PubMed] [Google Scholar]
- 14).M. Schuerenberg, S. O. Deininger. Matrix application with ImagePrep. Imaging Mass Spectrometry: Protocols for Mass Microscopy, Springer, 2010. [Google Scholar]
- 15).L. Meng, J. Han, J. Chen, X. Wang, X. Huang, H. Liu, Z. Nie. Development of an automatic ultrasonic matrix sprayer for matrix-assisted laser desorption/ionization mass spectrometry imaging. Anal. Chem. 94: 6457–6462, 2022. [DOI] [PubMed] [Google Scholar]
- 16).J. Sunner, E. Dratz, Y. C. Chen. Graphite surface-assisted laser desorption/ionization time-of-flight mass spectrometry of peptides and proteins from liquid solutions. Anal. Chem. 67: 4335–4342, 1995. [DOI] [PubMed] [Google Scholar]
- 17).R. Arakawa, H. Kawasaki. Functionalized nanoparticles and nanostructured surfaces for surface-assisted laser desorption/ionization mass spectrometry. Anal. Sci. 26: 1229–1240, 2010. [DOI] [PubMed] [Google Scholar]
- 18).T. Ozawa, I. Osaka, S. Hamada, T. Murakami, A. Miyazato, H. Kawasaki, R. Arakawa. Direct imaging mass spectrometry of plant leaves using surface-assisted laser desorption/ionization with sputter-deposited platinum film. Anal. Sci. 32: 587–591, 2016. [DOI] [PubMed] [Google Scholar]
- 19).T. Ozawa, I. Osaka, T. Ihozaki, S. Hamada, Y. Kuroda, T. Murakami, A. Miyazato, H. Kawasaki, R. Arakawa. Simultaneous detection of phosphatidylcholines and glycerolipids using matrix-enhanced surface-assisted laser desorption/ionization-mass spectrometry with sputter-deposited platinum film. J. Mass Spectrom. 50: 1264–1269, 2015. [DOI] [PubMed] [Google Scholar]
- 20).K. Nozaki, Y. Nakabayashi, T. Murakami, A. Miyazato, I. Osaka. Novel approach to enhance sensitivity in surface-assisted laser desorption/ionization mass spectrometry imaging using deposited organic-inorganic hybrid matrices. J. Mass Spectrom. 54: 612–619, 2019. [DOI] [PubMed] [Google Scholar]
- 21).W. H. Müller, A. Verdin, E. De Pauw, C. Malherbe, G. Eppe. Surface-assisted laser desorption/ionization mass spectrometry imaging: A review. Mass Spectrom. Rev. 41: 373–420, 2022. [DOI] [PMC free article] [PubMed] [Google Scholar]


