



Abstract
Human genetic studies have nominated cadherin-like and PC-esterase domain-containing 1 (CPED1) as a candidate target gene mediating bone mineral density (BMD) and fracture risk heritability. Recent efforts to define the role of CPED1 in bone in mouse and human models have revealed complex alternative splicing and inconsistent results arising from gene targeting, making its function in bone difficult to interpret. To better understand the role of CPED1 in adult bone mass and morphology, we conducted a comprehensive genetic and phenotypic analysis of cped1 in zebrafish, an emerging model for bone and mineral research. We analyzed two different cped1 mutant lines and performed deep phenotyping to characterize more than 200 measures of adult vertebral, craniofacial, and lean tissue morphology. We also examined alternative splicing of zebrafish cped1 and gene expression in various cell/tissue types. Our studies fail to support an essential role of cped1 in adult zebrafish bone. Specifically, homozygous mutants for both cped1 mutant alleles, which are expected to result in loss-of-function and impact all cped1 isoforms, exhibited no significant differences in the measures examined when compared to their respective wildtype controls, suggesting that cped1 does not significantly contribute to these traits. We identified sequence differences in critical residues of the catalytic triad between the zebrafish and mouse orthologs of CPED1, suggesting that differences in key residues, as well as distinct alternative splicing, could underlie different functions of CPED1 orthologs in the two species. Our studies fail to support a requirement of cped1 in zebrafish bone and lean tissue, adding to evidence that variants at 7q31.31 can act independently of CPED1 to influence BMD and fracture risk.
Keywords: cped1, zebrafish, bone, muscle, craniofacial
Introduction
Understanding genetic risk for osteoporosis is important to reduce this massive health burden. It has been estimated that up to 89% of the variation in bone mineral density (BMD), a key indicator for diagnosing osteoporosis and predicting fracture risk, is determined by genetics.1 Over the past several decades, a large number of human genetic studies have nominated cadherin-like and PC-esterase domain-containing 1 (CPED1) as a candidate target gene mediating BMD and fracture risk heritability. In particular, genome-wide association studies (GWAS) have identified human chromosome region 7q31.31, also known as the CPED1-WNT16 locus, to be associated with BMD and fracture.2–9 Of the five genes at this locus (WNT16, CPED1, ING3, FAM3C, and TSPAN12), WNT16 is the most studied and characterized,10 with multiple studies showing that Wnt16 is required for cortical bone mass and strength in mice.5,6,11–17 Intriguingly, in the GWAS by Medina-Gomez et al., two independent signals were identified at this locus, with the second signal mapping to the intronic region of CPED1.5 These two signals were significant even after accounting for genetic linkage. It has been postulated that the presence of multiple independent signals at the CPED1-WNT16 locus could reflect several causal variants that act on distinct genes.5,10 More recently, Chesi et al. performed high-resolution Capture C combined with ATAC-seq in human mesenchymal stem cells (MSCs) undergoing osteoblastic differentiation and found significant interactions between the CPED1 promoter and SNPs linked to variants associated with BMD.18 Thus, there is evidence that CPED1 could function as a target gene at the CPED1-WNT16 locus, possibly in tandem with WNT16.10
The biological function of the encoded protein for CPED1 is poorly characterized. Previously known as C7orf58, CPED1 was identified in a search for homologs of Cas1p, which encodes a fungal protein that has a novel N-terminal globular domain predicted to interact with and modify glycoproteins at the cell surface.19 Named the PC-esterase domain, proteins possessing this feature are found exclusively in the eukaryotic kingdom.20 Metazoan members of the PC-esterase family were found to have three additional predicted domains fused to the N-terminus of the PC-esterase domain: a signaling peptide sequence to target the protein to the secretory pathway at the plasma membrane, a domain related to the tubulin-tyrosine ligase family, and a cadherin-like domain predicted to form a beta-sandwich structure that allows for extracellular interactions such as carbohydrate binding.
Several studies have sought to define the role of CPED1 in bone. Medina-Gomez et al. first explored CPED1’s role in bone by assessing the relationship between CPED1 expression and BMD. These authors found that high CPED1 expression is associated with lower BMD, as evidenced by a strong inverse correlation between CPED1 transcript levels in human iliac crest samples and total body BMD and skull BMD.5 Subsequently, Maynard et al. performed the first in-depth experimental characterization of Cped1 transcription and identified Cped1 transcripts in multiple mouse tissues including bone.1 Interestingly, in addition to identifying full-length transcripts, they observed multiple alternatively spliced isoforms with missing exons, including in-frame exon deletions, as well as a severely truncated transcript predicted to encode proteins missing the cadherin-like and PC-esterase domains. They also identified several alternative transcription start sites predicted to encode for proteins with N-terminal truncations. Despite the apparent relationship between expression of CPED1 in bone and BMD, multiple functional studies examining the consequences of targeted CPED1 knockdown in vitro have failed to show a consistent effect on osteoblastic differentiation.18,21 It is conceivable that non-coding elements regulating CPED1 are active in multiple tissue and/or cell types, and that CPED1 exerts its influence on BMD via its expression in other cell types within bone, or in non-skeletal tissues. Thus, to determine whether CPED1 acts as a causal gene at the CPED1-WNT16 BMD locus, in vivo studies establishing its role in bone mass and morphology are needed.
To better understand the role of CPED1 in adult bone mass and morphology, we conducted a comprehensive genetic and phenotypic analysis of cped1 in zebrafish, an emerging model for bone and mineral research.22–25 Recently, we described a zebrafish cped1 loss of function mutant.26 As described in Watson et al., cped1w1003 harbors a CRISPR/Cas9-induced indel that causes a frameshift and premature stop codon predicted to result in truncation of the Cped1 protein. However, several limitations in the study of Watson et al. prevented the unequivocal determination of the role of cped1 in bone. First, because the primary purpose of analyzing cped1w1003 in Watson et al. was to examine the role of cped1 in lean tissue accrual, an in-depth phenotypic analysis of bone was not performed. Moreover, we observed normal levels of mutant cped1 transcript in cped1w1003 mutants.26 Thus, we could not rule out that truncated Cped1 protein products were functional. In this study, we overcome these limitations by characterizing a new cped1 mutant allele, cped1sa20221, and performing deep skeletal phenotyping in both cped1 mutant lines. We characterized more than 200 measures of adult vertebral, craniofacial, and lean tissue morphology. We also examined alternative splicing of zebrafish cped1 and gene expression in various cell/tissue types. Our studies fail to support an essential role of cped1 in adult zebrafish bone. Specifically, homozygous mutants for both of the analyzed cped1 alleles, which are expected to result in loss-of-function and impact all cped1 isoforms, exhibited no significant differences in the measures examined when compared to their respective wildtype controls, suggesting that cped1 does not significantly contribute to these traits. We identified sequence differences in critical residues of the catalytic triad between the zebrafish and mouse orthologs of CPED1, suggesting that differences in key residues, as well as distinct alternative splicing, could underlie different functions of CPED1 orthologs in the two species. Our studies support accumulating evidence that variants at 7q31.31 can act independently of CPED1 to influence BMD and fracture risk.
Materials and methods
Ethics statement
All studies were performed on an approved protocol in accordance with the University of Washington Institutional Animal Care and Use Committee (IACUC).
Animal care
Zebrafish were housed at 28.5 °C following a 14:10 hr light:dark cycle, and provided with a standard commercial diet. Research was carried out using mixed sex wildtype (AB) and 2 cped1 mutant lines (cped1sa20221, cped1w1003). The cped1sa20221 line was obtained from the Zebrafish International Resource Center (Eugene, OR). For genotyping, tissues were collected by performing 50% fin clip of the caudal fin under anesthesia as previously described.26 We used the following primers for genotyping cped1sa20221: F: 5′–GCCCCTGTGCAAAGTGTTAAG–3′, R: 5′–CACAGAAAGAAAAATGGGCGGT–3′. PCR was performed using standard conditions (35 cycles, annealing temperature of 58 °C),26 and products were run on high-resolution 3% agarose gels. Sanger sequencing was used to identify cped1sa20221 mutant PCR products. cped1w1003 mutants were previously described in Watson et al.26 MicroCT scans of 90 days post fertilization (dpf) cped1w1003 mutants and wildtype clutchmates generated in the study of Watson et al. were reanalyzed for this study; no new experiments in cped1w1003 mutants were performed.
RT-PCR and tissue-specific cped1 expression
Total RNA was harvested from adult AB wildtype and homozygous mutant fish using homogenization in TRIzol (Invitrogen), adhering to the protocol specified by the manufacturer. To analyze cped1 transcript expression in different zebrafish organs, two adult male and two adult female wildtype fish were euthanized in an ice bath and dissected using the methods described by Gupta et al.27 Organs were harvested and preserved in RNALater at −80 °C until RNA isolation was performed. Total RNA was collected from vertebral bone, skeletal muscle, intestine, whole brain, skin, swim bladder, heart, eyes, and testes. cDNA synthesis was performed with the Superscript IV First Strand Synthesis System (ThermoFisher) and 1 μL of each cDNA was used for PCR amplification. All products were electrophoresed on a single 3% agarose gel, and bands of interest were excised from the gel for DNA extraction followed by Sanger sequencing to validate the yielded product. To test for the effects of the cped1sa20221 mutation on transcript expression and splicing, we used the following primers targeting exons 14 and 16 to flank the SNP mutation in exon 15: F: 5′–GCAGAATCAACATTCTGGTGATGGA–3′, R: 5′–CAGGACTGCAGCTGAGGTTGAT–3′.
Single-cell RNA-seq analysis
We obtained the zebrafish embryonic single-cell RNA-seq (scRNA-seq) dataset by Saunders et al.28 from the NCBI Gene Expression Omnibus repository (GSE202639). All analyses were performed using Monocle (v3) and Seurat (v4) in R.29–31 Average expression values were determined using the AverageExpression() function, which exponentiates log normalized count data prior to calculating the average value.
microCT scanning and analysis
Fish were scanned at 90 dpf using a vivaCT40 microCT scanner (Scanco Medical, Switzerland) with the following parameters: 21 μm voxel resolution, 55 kVp, 145 mA, 1024 samples, 500proj/180°, 200 ms integration time.32,33 Four fish were scanned simultaneously in each acquisition. Scanco software was used to generate DICOM files for each fish. Vertebral bone analysis was performed using FishCuT as outlined in Hur et al. and Gomez et al.33,34 Some measures were performed on maximum intensity projections of the DICOM images as described in Watson et al.26
To calculate lean tissue volume, we followed the procedures described in Watson et al.26 Briefly, DICOM files were opened in Fiji35 and a single slice from the midpoint of the stack, adjacent to the posterior swim bladder, was chosen for analysis. Lower and upper thresholds were automatically determined using the Default and MaxEntropy threshold algorithms within Fiji. Subsequently, a custom MATLAB script was used to open DICOM files and perform voxel segmentation based on intensity into three tissue compartments: presumptive adipose (below lower threshold), lean (between lower and upper threshold), and bone (above upper threshold).
Craniofacial analysis
To examine craniofacial shape variation, we employed landmarking methods we have previously described.36,37 Thirteen landmarks (Table S1), derived from Diamond et al. 2022,36 were manually placed on anatomical prominences of the zebrafish skull using the markups module in 3DSlicer (www.slicer.org).38 The distance between specific pairs of points was calculated, providing a total of seven measurements: skull length (from the most anterior point of the frontal bone to the most dorsal part of the first vertebrae), frontal bone length, epiphyseal bar length, distance between anguloarticulars, dorsal skull width (distance between pterotic cartilage bones), midline skull width (distance between the most posterior part of opercles), and ventral skull width (distance between the sutures connecting the opercle and interopercle). We chose these measurements based on past studies showing morphological alterations of the opercular region and frontal and parietal bones in response to mutations in genes associated with human skeletal conditions.36,37 For analysis, we normalized the measurements for each fish based on its standard length and performed a t-test for each measurement using the statistical analysis software, Prism (v8, GraphPad). We excluded fish exhibiting gross deformations to the skull arising from sample processing for microCT scanning, leaving six homozygous cped1w1003 mutants, seven homozygous cped1sa20221 mutants, as well as seven of each of their respective wildtype clutchmates.
Multiple sequence alignment
All amino acid sequences for the multiple sequence alignment were obtained from the NCBI protein database, using the isoforms with the longest annotated sequences. The sequences were aligned using the MUSCLE alignment software (version 3.8.425) on the EMBL-EBI website. We used the ggmsa package (v1.0.3) in R to determine the consensus sequence and to plot the alignment.39
Statistical analysis
For most results, data are reported from a single experiment. Each biological replicate represents one technical replicate. Empirical data are shown as either individual measurements or are reported as mean ± SEM. Group sizes (n) are reported in the figure panels themselves or in respective legends. Outliers were not identified; all data were included in statistical analyses. Multivariate analysis of vertebral data using the global test was performed using the globaltest package in R.33 All other statistical analyses were performed in GraphPad Prism as described in the text. p < .05 was considered statistically significant in all cases.
Results
Alternative splicing of CPED1 orthologs is species-dependent
The zebrafish cped1 gene is located on chromosome 4 and exhibits synteny with the human CPED1-WNT16 locus, with cped1 flanked on the 5′ end by ing3 and on the 3′ end by wnt16. Two alternatively spliced transcripts are annotated in the zebrafish GRCz11 (GCA_000002035.4) genome assembly on ENSEMBL: cped1-201 and cped1-202 (ENSDART00000067251.6 and ENSDART00000143690.4, respectively) (Figure 1A, top). Both transcripts contain 21 exons, with exons 1, 11, 12, 13, 17, 18, 19, and 21 exhibiting differences at the 5′ or 3′ end of the exon likely due to alternative donor and acceptor sites. Notably, whereas transcript isoforms exhibiting exon skipping are annotated for mouse Cped1,1 no such isoforms were annotated for zebrafish cped1.
Figure 1.

Characterization of cped1 expression. (A) Alternative splicing events for cped1. Top: exon-intron maps for the two cped1 transcript isoforms. Bottom: closeup views of exons 12, 17, and 19 show regions of these exons that vary in usage (denoted by the dotted red lines). The top two rows show how these exon regions differ between the two cped1 transcript isoforms. The remaining rows show these exon regions at various stages of zebrafish development, from 2 cell stage up to 5 dpf, and are colored by usage, eg, red indicates 100% usage in the exon, blue indicates 0% usage in the exon. Gray indicates no transcript evidence was detected at the specified developmental stage. Images for the three exonic regions were obtained from the MeDAS database,40 cropped, and assembled into a single image. (B and C) Bar plots showing average cped1 expression in multiple cell/tissue types. (B) cped1 expression in zebrafish embryos/larvae, from the zebrafish scRNA-seq dataset published in28. The top 45 cell populations with the highest cped1 expression are shown. Osteoblasts are highlighted by an arrow. (C) cped1 expression in adult zebrafish, as reported in the VASTDB database.41 Bone is highlighted by an arrow. (D) RT-PCR for cped1 expression in tissues from wildtype adult fish. Primers amplified a region spanning exons 14 through 16. Amplification of β-actin2 was performed in parallel and served as a loading control. Bone, vertebral bone; Brain: whole brain; dpf, days post fertilization; Int, intestine; Mus, muscle; SB, swim bladder, Test, testes.
To examine alternative splice events in zebrafish cped1, we analyzed several public databases. First, to characterize such events in zebrafish embryos and larvae, we queried the MeDAS database, which utilizes public RNA-seq data to characterize alternative splicing events in developmental time course experiments. MeDAS quantifies inclusion of exons as well as exonic regions that contribute to different 5′ or 3′ boundaries.40 Our query identified 3 alternative splicing events in zebrafish cped1 that were detected by the MeDAS pipeline, consisting of alternative exon boundary regions at the 3′ end of exon 12, the 3′ end of exon 17, and the 5′ end of exon 19 (Figure 1A, bottom). None of these alternative splice events showed significant differences in expression across developmental stages (Kruskal–Wallis p > .05 for all 3 events, as determined by the MeDAS pipeline). Next, to identify alternative splice events in adult zebrafish tissues including bone, we analyzed VastDB, a large database of alternative splice events estimated using transcriptomic profiles from different cell/tissue types.41 Alternative splice events characterized by VastDB include cassette exons and microexons, alternative 5′ and 3′ splice site choices, and intron retention. Our query of VastDB revealed no alternative splice events for zebrafish cped1 meeting a minimum threshold of alternative usage. Maynard et al. previously showed that Cped1 exon expression varies during osteoblast differentiation, suggesting that alternative splicing differs during this process.1 Previously, our lab conducted an analysis of alternatively spliced transcripts in sp7+ osteoblasts during zebrafish fin regeneration.42 Using VAST-TOOLS41 and a public RNA-seq dataset,43 we identified 1144 alternative splicing events differentially observed between 0 and 4 days post amputation.42 We searched the results of this analysis and found no alternative splicing events for cped1. Taken together, our analyses fail to support alternative splice events involving exon skipping for zebrafish cped1 that are similar to events that occur for mouse Cped1. Thus, when referring to cped1 gene expression below, we assume results are for transcripts harboring all 21 exons unless otherwise noted.
cped1 is expressed in multiple cell/tissue types
To determine cped1 expression patterns during zebrafish embryonic development, we analyzed a publicly available single-cell RNA-sequencing (scRNA-seq) dataset by Saunders et al.,28 which profiled 1223 zebrafish embryos collected from 19 timepoints between 18 and 96 hours post fertilization (hpf), to assess cped1 gene expression in the 156 annotated cell clusters (Figure 1B). An unknown cluster of cells marked by dcn+/col6+ expression exhibited the highest level of cped1 expression (average expression = 6.24). Moderate cped1 expression in the osteoblast cell cluster was observed (average expression = 1.149). With regard to other annotated cell clusters, we found that cped1 expression was prominent in muscle and muscle progenitor cell clusters, mesenchymal cells, and cells in the pharyngeal arch. Thus, cped1 is broadly expressed in multiple cell types, including moderate expression in osteoblasts.
To determine cped1 expression in adult tissues, we queried the VASTDB database,41 which collates bulk RNA-sequencing for a variety of adult zebrafish tissues. VASTDB reported the highest expression of cped1 in swim bladder (12.80 cRPKM) and heart (10.71 cRPKM), with moderate expression of cped1 in bone (3.15 cRPKM) (Figure 1C). Next, we examined the distribution of cped1 expression in wildtype adult zebrafish using RT-PCR. Primers were designed to amplify a region spanning exons 14 through 16, and RT-PCR was performed on cDNA from nine solid organ tissues (Figure 1D). All PCR products were confirmed by Sanger sequencing. Highest cped1 expression was detected in tissues from the swim bladder, heart, and eyes. We also observed moderate cped1 expression in the skin, intestines, and testes. cped1 expression was only faintly detectable in muscle and brain tissues, and virtually undetectable in vertebral bone. Notably, moderate levels of cped1 were detected in bone by RNA-sequencing in VASTDB, thus it is possible that cped1 transcript levels in vertebral bone, while present, are too low to be detected in our RT-PCR assay. Taken together, our results suggest that cped1 is broadly expressed in multiple adult tissues in zebrafish, with moderate or low expression in bone.
Characterization of the cped1sa20221 allele
To examine whether cped1 is necessary for bone mass and morphology, we analyzed cped1sa20221 mutant zebrafish. The cped1sa20221 allele was generated as part of the Wellcome Sanger Institute’s ENU mutagenesis project.44 The allele harbors a single point mutation in exon 15 that results in a premature stop codon (ENSDART00000143690.1:c.1922C>A; p.Ser641*). Exon 15 maps to a region upstream of the predicted PC-esterase domain of the protein, thus, translation of the predicted truncated transcript should result in loss of the PC-esterase domain (Figure 2A). To determine the effects of the premature stop codon on the transcript, we performed RT-PCR spanning the exons flanking the mutation-harboring exon using tissues from adult homozygous mutants (which we henceforth refer to as cped1sa20221 mutants) and wildtype clutchmates. We found that the expression level of the cped1 transcript was visibly reduced in cped1sa20221 mutants compared to wildtype (Figure 2C), suggesting that the mutant transcript is degraded by nonsense-mediated decay. While CRISPR-induced indels have been shown to generate novel splice variants that can help protect against deleterious mutations,45 we did not observe evidence of exon skipping resulting in loss of exon 15 in cped1sa20221 mutants. Based on the reduced cped1 transcript in cped1sa20221 mutants, as well as the predicted loss of the PC-esterase domain, we conclude that cped1sa20221 is likely to be functioning as a strong hypomorph or null allele.
Figure 2.
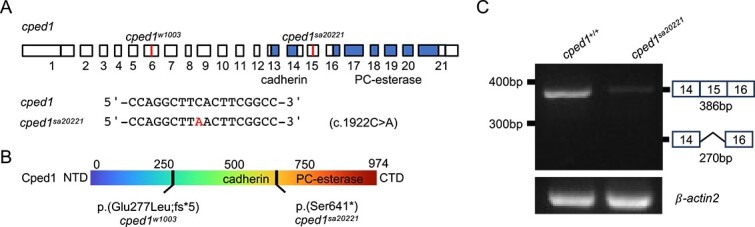
Characterization of the cped1sa20221 allele. (A) Sequence and genomic location of sa20221. Blue highlighted regions indicate the locations of the exonic regions encoding for the cadherin-like domain and PC-esterase domain. (B) Predicted effects of sa20221 on Cped1 amino acid sequence. For (A) and (B), information for w1003, an allele we previously described26, is shown for reference. (C) Mutant mRNA is degraded in cped1sa20221 mutants. RT-PCR for the region spanning exons 14 through 16 of cped1 in adult whole body tissues shows reduced transcript levels in cped1sa20221 mutants compared to controls. Evidence of exon skipping in exon 15 was not observed.
cped1 sa20221 mutants exhibit normal vertebral bone mass and morphology
To determine whether cped1 is necessary for bone mass and morphology, we performed deep vertebral bone phenotyping in adult cped1sa20221 mutants. Adult cped1sa20221 mutants and wildtype clutchmates were collected at 90 dpf and scanned by microCT (n = 8 per group). We used FishCuT to assess 200 measures of vertebral bone mass, morphology, and mineral density.33 Briefly, vertebrae of each fish were divided into three anatomical compartments (centrum, hemal arch, and neural arch) that were analyzed for three measurements (volume, tissue mineral density (TMD), and thickness), resulting in nine distinct vertebral metrics. With the addition of centrum length, we obtained a total of 10 measurements for each analyzed vertebra (20 vertebrae in total). A standard score was computed for each measurement, and the scores were color-coded and arranged into matrices that we call “skeletal barcodes” (Figure 3A). We then plotted the 10 measurements as a function of vertebral number along the axial skeleton and calculated p-values using the global test (Figure 3B-K). No significant differences in any of the measurements were found between cped1sa20221 mutants and their controls. We also did not observe obvious differences in cped1sa20221 mutants and controls when assessing for gross vertebral phenotypes such as vertebrae number, rib fracture calluses, neural arch non-unions, centrum fusions, or centrum compressions (Figure 3L). Thus, our studies in cped1sa20221 fail to support a role of cped1 in adult vertebral bone mass, density, and morphology.
Figure 3.

cped1sa20221 mutants exhibit normal vertebral bone mass and morphology. (A) Skeletal barcodes for cped1+/+ and cped1sa20221 mutants (3 fish/group shown) visually depict individual vertebral phenomes. (B-K) Vertebral phenotypic measures (indicated by the graph title, with units for y axis) plotted as a function of vertebra along the spine. Values are depicted mean ± SEM (n = 8/group). No measures with p < .05 in the global test were detected. (L) Maximum intensity projections of microCT scans. Cent, centrum; Haem, haemal arch; Neur, neural arch; Vol, volume; TMD, tissue mineral density; Th, thickness; Le, length.
Loss of cped1 does not affect vertebral bone mass and morphology in multiple mutant lines
While our studies did not reveal a vertebral phenotype in cped1sa20221 mutants, it is possible that the allele has unintended consequences that might obscure the function of Cped1. In particular, it has previously been shown that transcriptional adaptation caused by mutant mRNA degradation, a form of genetic compensation, can produce mild or even an absence of expected phenotypes.46 Thus, we sought to repeat our analyses using a different cped1 mutant allele in which transcriptional adaptation caused by mutant mRNA degradation was unlikely. For this, we analyzed cped1w1003 mutants.26 As described in Watson et al., cped1w1003 harbors a CRISPR/Cas9-induced net 11 bp deletion (c.831-844delinsACT). This indel mutation causes a frameshift and premature stop codon in exon 6 (ENSDARP00000067250.4, p:Gln278Leu;fs*5) which is predicted to result in truncation of the Cped1 protein and loss of both the cadherin-like and PC-esterase domains (Figure 2B). Notably, normal levels of mutant cped1 transcript are observed in cped1w1003 mutants, suggesting the absence of transcriptional adaptation caused by mutant mRNA degradation.26 While it is possible that truncated Cped1 protein products expressed in cped1w1003 mutants retain biological activity, we surmised that comparing phenotypes with cped1sa20221 mutants might help to rule out this possibility. As mentioned previously, in the prior study of Watson et al., we showed that adult cped1w1003 mutants do not exhibit significant differences in lean tissue-related traits when compared to their wildtype siblings.26 However, deep vertebral phenotyping using FishCuT in cped1w1003 mutants was not performed.26
We therefore conducted FishCuT vertebral analysis in adult (90 dpf) cped1w1003 mutants. We observed no significant differences between cped1w1003 mutants and their wildtype clutchmates (Figure S1). Next, we combined data for cped1w1003 and cped1sa20221 mutant lines in a two-way ANOVA analysis (Figure 4). We surmised that combining data for both lines into a single analysis would increase our power to detect smaller effect sizes. For this, we used the average of each of the 10 FishCuT measurements across the 16 rostral-most measured vertebrae for both mutant alleles (we chose to analyze 16 rather than 20 vertebrae for this analysis because only 16 vertebrae were analyzed for cped1w1003 mutants in 26). The two-way ANOVA allowed us to simultaneously determine whether: (1) there were common phenotypic differences between wildtype and mutants for both alleles (indicated by p-value for genotype), (2) there were baseline phenotypic differences for different alleles due to genetic background and/or environmental conditions when testing each allele (indicated by p-value for allele), and (3) mutants for each cped1 allele exhibited different phenotypic responses when compared to wildtype (indicated by p-value for genotype:allele interaction).
Figure 4.

Loss of cped1 does not affect vertebral bone mass and morphology in multiple mutant lines. (A-J) Combined analysis of vertebral measurements for cped1sa20221 and cped1w1003 mutants compared to their respective wildtype clutchmates. Each point represents a single fish, and the value is the average of 16 measured vertebrae. Bars indicate mean ± SEM. Shown are p-values from Sidak’s multiple comparisons tests; no significant p-values for comparisons between homozygous mutants and respective controls were observed.
The result of the two-way ANOVA indicated that there were no significant effects of genotype (ie, wildtype versus mutant) for any of the vertebral measurements (Table 1). Moreover, Sidak’s multiple comparisons analysis for each allele found no significant differences between wildtype and mutant for either allele. We also observed no statistically significant interactions between allele and genotype, indicating that mutants for each cped1 allele exhibited similar phenotypic responses when compared to wildtype. Several measures had p-values < .05 for the allele factor, indicating there were baseline phenotypic differences for different alleles. Because the cped1w1003 fish was generated in an AB background, whereas the cped1sa20221 fish was generated in a longfin background, significant effects of allele are likely attributable to: (1) background differences between the two lines and/or (2) differences in environmental conditions that equally impacted controls and mutants for each allele (eg, different rates of developmental progress). In sum, our studies in multiple cped1 mutant lines fail to support a role of cped1 in vertebral bone mass and morphology.
Table 1.
p-values from two-way ANOVA of vertebral measures in cped1sa20221 and cped1w1003 mutants and respective wildtype controls.
| Measurement | Genotype | Allele | Interaction |
|---|---|---|---|
| Centrum volume | p = .503 | p = .298 | p = .283 |
| Centrum thickness | p = .3901 | p = .112 | p = .903 |
| Centrum TMD | p = .612 | p = .029a | p = .207 |
| Centrum length | p = .638 | p = .262 | p = .117 |
| Haemal arch volume | p = .3403 | p = .0020a | p = .1966 |
| Haemal arch thickness | p = .5184 | p = .0339a | p = .251 |
| Haemal arch TMD | p = .582 | p = .0816 | p = .1229 |
| Neural arch volume | p = .3609 | p = <.0001a | p = .3076 |
| Neural arch thickness | p = .4067 | p = .027a | p = .8259 |
| Neural arch TMD | p = .5106 | p = .1223 | p = .4574 |
p-value < .05.
Abbreviation: TMD, tissue mineral density.
Loss of cped1 does not affect lean tissue mass and morphology
Because variants at the CPED1-WNT16 locus have been associated with pleiotropic effects on both bone and lean mass-related traits,26,47 we also examined whether cped1sa20221 mutants exhibited any phenotypic differences in lean tissue mass and morphology. For this, we measured the following traits: standard length and fineness ratio to assess body shape; total, anterior and posterior trunk lean volumes; and anterior and posterior swim bladder chamber length.26 We also manually measured centrum length, neural arch length, and neural arch angle, respectively, since these measures are highly correlated to myomere length, height, and angle, respectively.48 We previously found no significant differences in these measures in cped1w1003 mutants.26 We combined data for both cped1sa20221 and cped1w1003 and performed a two-way ANOVA analysis. There were no statistically significant effects of genotype in any of the muscle morphology measures between controls and germline mutants (Figure 5). Furthermore, for each allele, Sidak’s multiple comparisons tests did not detect significant differences between wildtype and mutant. There were also no significant genotype:allele interactions for any of the measures. Finally, statistically significant p-values for the allele factor were detected for several measures, which we again attributed to the different backgrounds of the two lines and/or environmental differences when testing each allele (Table 2). Taken together, our findings fail to support a role of cped1 in lean tissue mass and morphology.
Figure 5.

Loss of cped1 does not affect lean mass morphology. (A-I) Combined analysis of lean mass-related measures for cped1sa20221 and cped1w1003 mutants and their corresponding wildtype clutchmates. Each point represents a single fish. Bars indicate mean ± SEM. Shown are p-values from Sidak’s multiple comparisons tests; no significant p-values for comparisons between homozygous mutants and their respective controls were observed.
Table 2.
p-values from two-way ANOVA of lean mass-related traits in cped1sa20221 and cped1w1003 mutants and respective wildtype controls.
| Measurement | Genotype | Allele | Interaction |
|---|---|---|---|
| Standard length | p = .4611 | p = .7151 | p = .2968 |
| Fineness ratio | p = .8016 | p = <.0001a | p = .7561 |
| Neural arch length | p = .798 | p = .0005a | p = .8302 |
| Neural arch angle | p = .5998 | p = .7910 | p = .7660 |
| Ant. swim bladder chamber | p = .3921 | p = .2103 | p = .9082 |
| Pos. swim bladder chamber | p = .238 | p = .6046 | p = .7150 |
| Ant. trunk lean volume | p = .4556 | p = .0003a | p = .8574 |
| Pos. trunk lean volume | p = .8381 | p = .0011a | p = .6902 |
| Total trunk lean volume | p = .6658 | p = .0005a | p = .7515 |
p-value < .05.
Loss of cped1 does not affect craniofacial morphology
Several GWAS have suggested that variants in the intronic region of CPED1 may influence human craniofacial morphology. For instance, Medina-Gomez et al. found that variants most strongly associated with skull BMD were located in the intronic region of CPED1, with rs7801723 identified as the most significantly associated SNP.5 Moreover, in a GWA study identifying human genomic loci associated with craniofacial morphology in a Latin American population, Bonfante et al. detected a single nucleotide variant in the intronic region of the CPED1 gene (rs6950680) associated with “jaw protrusion.”49 To assess whether cped1 zebrafish mutants exhibited altered craniofacial morphology, we performed landmark-based morphometric analyses using methods we have previously described.36,37 Using the Markups module in 3D Slicer,38 we manually placed 13 markers on distinctive craniofacial landmarks of microCT scans of cped1sa20221 and cped1w1003 mutants and their respective wildtype clutchmates, and measured the distances between 7 pairs of landmarks (Figure 6A and B). From our two-way ANOVA analysis, we did not find any significant effects of genotype for any of the craniofacial measurements (Figure 6C-I and Table 3). In addition, Sidak’s multiple comparisons test did not detect significant differences between homozygous mutants and their respective wildtype controls for either allele. Moreover, no significant interactions were found between genotype and allele. For reasons described previously, statistically significant p-values for the allele factor were detected for several measures similar to previous analyses. In sum, our findings fail to support a role of cped1 in craniofacial morphology.
Figure 6.

Loss of cped1 does not affect craniofacial morphology. (A) Anatomical landmarks used for measurements. Shown are the lateral view (left) and dorsal view (right) of a wildtype zebrafish skull. Landmark positions are labeled in blue. Note that landmark 11 is on the right lateral surface, opposite landmark 6, and landmark 13 is on the right lateral surface, opposite landmark 8. (B) Distances between pairs of landmarks were used as measurements to quantify craniofacial morphology. (C-I) Combined analysis of craniofacial morphological measures for cped1sa20221 and cped1w1003 mutants and their corresponding wildtype clutchmates. Each point represents an individual fish. Shown are p-values from Sidak’s multiple comparisons tests; no significant p-values for comparisons between homozygous mutants and controls were observed.
Table 3.
p-values from two-way ANOVA of craniofacial phenotyping comparison of cped1sa20221 and cped1w1003 and their respective wildtype controls.
| Measurement | Genotype | Allele | Interaction |
|---|---|---|---|
| Skull length | p = .566 | p = .922 | p = .1485 |
| Frontal/parietal bone length | p = .526 | p = .218 | p = .223 |
| Epiphyseal bar length | p = .629 | p = .243 | p = .389 |
| Distance between anguloarticulars | p = .643 | p = .0409a | p = .312 |
| Midline skull width | p = .099 | p = .0009a | p = .177 |
| Dorsal skull width | p = .252 | p = .404 | p = .374 |
| Ventral skull width | p = .976 | p = .0089a | p = .205 |
p-value < .05.
The PC-esterase domain in zebrafish Cped1 lacks a conserved catalytic domain
Our results so far showed negligible effects on bone and lean mass morphology arising from two different nonsense mutations in cped1. This led us to ask whether the functional activity of the PC-esterase domain is conserved in zebrafish. We therefore decided to compare the Cped1 amino acid sequence of zebrafish to CPED1 orthologs in other chordates. We used the MUSCLE alignment software to perform a multiple sequence alignment of CPED1 orthologs identified from the NCBI Orthologs database: human (NP_079189.4), mouse (Mus musculus, NP_001074820.1), chicken (Gallus gallus, XP_416005.4), frog (Xenopus tropicalis, XP_031754845.1), lizard (Sceloporus undulatus, XP_042324422.1), amphioxus (Branchiostoma floridae, XP_035676865.1), little skate (Leucoraja erinacea, XP_055506810.1), and another teleost, Japanese medaka (Oryzias latipes, XP_023808151.1). We also performed a BLASTp search for a Cped1 ortholog in the basal chordate Ciona intestinalis in the non-redundant protein sequences database on NCBI but did not recover any potential orthologs. The alignment showed that, compared to the human and mouse orthologs, zebrafish Cped1 shares 39.87% and 38.92% identity over the entire protein sequence, respectively. Within the predicted PC-esterase domain, zebrafish Cped1 shares 55.6% and 54.28% identity with human and mouse orthologs, respectively (Figure S2), indicating that the PC-esterase domain is more highly conserved between zebrafish and mammals than other regions of the protein.
We then asked whether the predicted enzymatic active site of the PC-esterase domain was intact in zebrafish. To date, the crystal structure and biochemical characterization of only one member of the PC-esterase domain family has been determined, XOAT1 from Arabidopsis thaliana.20,50 The crystal structure of XOAT1 revealed the presence of a canonical “catalytic triad” of amino acids adjacent to the active site (Serine-Aspartate-Histidine), which was required for the enzymatic activity of the protein as determined by site-directed mutagenesis studies. The biochemical mechanism of the catalytic triad is well characterized and typically consists of a serine (S) in a GDS motif, and an aspartate (D) and histidine (H) in a DxxH motif found upstream of the last predicted helix.19,51 Anantharaman and Aravind previously showed that, within this catalytic triad, the serine and histidine (but not aspartate) showed absolute conservation amongst representatives of the PC-esterase family.19 Using the positions of the predicted catalytic residues, we identified the corresponding residues in our alignment (asterisks in Figure S2) and found that the predicted catalytic triad appears to be disrupted in zebrafish. Specifically, we observed that the histidine residue that showed absolute conservation amongst the PC-esterase family in the study of Anantharaman and Aravind19 was substituted with a glutamine (Q) in zebrafish. This substitution was not seen in any other sequence we analyzed. During ester bond cleavage, the histidine in the catalytic triad facilitates the chemical reaction by removing a proton from the serine, thereby activating the serine and allowing it to attack the ester bond.20,52 It is therefore plausible that loss of the histidine in zebrafish disrupts the enzymatic activity of the PC-esterase domain in Cped1.
Discussion
Do CPED1 orthologs have different roles in zebrafish and mouse bone?
Our analyses indicate potential differences between zebrafish and mouse CPED1 orthologs at the gene expression and protein levels. At the level of gene expression, mouse Cped1 exhibits exon skipping as well as expression of N- and C-terminally truncated isoforms.1 In contrast, alternative splicing of zebrafish cped1 appears to primarily consist of alternative donor/acceptor sites. Because our analyses fail to support alternatively spliced cped1 transcripts with missing exons, both mutant alleles in our study are expected to impact all cped1 isoforms, allowing for an unambiguous assessment of the role of cped1 in bone. This is in contrast to exon skipping observed for mouse Cped1, which makes the generation of CRISPR-induced knockout alleles more challenging. We acknowledge that, if exon skipping is critical to CPED1’s regulation of bone in humans, the absence of this in zebrafish cped1 could make it an inappropriate model. In this context, it is worthwhile to note that exon skipping for exon 3 in mouse Cped1, which is cataloged in the VASTDB and MeDAS databases, is not predicted by VASTDB to be conserved in the orthologous human or zebrafish exons. At the level of the encoded protein, we found that zebrafish Cped1 is predicted to harbor an amino acid substitution for a key residue within the catalytic triad of the PC-esterase domain, a substitution which is not observed in mouse, human, or any other representative of the PC-esterase family in the study of Anantharaman and Aravind.19 Even though the functional domains of CPED1 have not yet been determined experimentally, the loss of a putative catalytic amino acid in the predicted PC-esterase domain of zebrafish Cped1 suggests that the protein’s function may have been lost during evolution. Taken together, there are predicted transcriptional and protein differences in CPED1 zebrafish and mouse orthologs that could underlie their different roles in bone.
Does CPED1 influence BMD and fracture risk heritability at the CPED1-WNT16 locus?
While we acknowledge that the role of zebrafish cped1 in bone may be different than the role of CPED1 in mammals, it is worthwhile to note that our findings share some similarities with previous functional studies. In particular, our studies fail to support an essential role of cped1 in bone, which is in agreement with studies by Chesi et al. who found that CPED1 knockdown by targeting multiple exons did not consistently alter BMP2-induced osteoblastic differentiation in primary human MSCs.18 Our studies also support the report of Conery et al. who found that although CRISPRi targeting of a non-coding element nominated by BMD GWAS produced altered CPED1 expression in human fetal osteoblast 1.19 cells (hFOBs), siRNA knockdown of CPED1 did not alter osteoblastic phenotypes in either hFOBs or primary human MSCs.21 In addition, Cped1 mutant mice analyzed by the International Mouse Phenotyping Consortium did not exhibit any significant bone phenotypes (www.mousephenotype.org).53 These mice also did not exhibit any significant differences in lean mass or craniofacial-related measures. The accumulation of functional studies that have failed to support a requirement of CPED1 in bone brings forth the question of whether the CPED1-WNT16 locus could influence BMD and fracture independently of CPED1. Other genes at 7q31.31 (ING3, FAM3C, and WNT16) have previously been shown to have a role in regulating bone morphology and strength and/or osteoblast differentiation. For example, Chesi et al. found that siRNA-mediated knockdown of ING3 in primary hMSCs reduced BMP2-induced osteogenic differentiation, suggesting that ING3 is needed for osteoblast differentiation.18 In studies by Maata et al. and Bendre et al., FAM3C was shown to be important for bone morphology in mouse, and in mediating alkaline phosphatase expression during osteoblastic differentiation.54,55 Finally, a large body of evidence has shown that WNT16 is likely a causal gene at the locus. For example, Wnt16 is required for cortical bone mass and strength in mice,5,6,11–17 in part by suppressing osteoclastogenesis11 and promoting osteoblastogenesis13 in cortical bone. In humans, expression levels of WNT16 from iliac crest samples were positively correlated with measures of BMD at multiple skeletal sites including total body, skull, legs, total hip, and lumbar spine.5 Moreover, functional studies in zebrafish have found that wnt16 is an important regulator of bone formation, fracture susceptibility, and morphogenesis.26,56,57 In addition, higher levels of WNT16 expression were correlated with higher total body lean mass (TBLM) and BMD, suggesting that WNT16 has pleiotropic effects on BMD and lean mass. This finding was supported by a bivariate GWAS meta-analysis in a pediatric cohort that identified the CPED1-WNT16 locus as harboring the lead variant most significantly associated with TBLM and total body less head-BMD. This finding was also supported by our recent study showing that: (1) wnt16 is specifically expressed in dermomyotome and notochord, structures critical for the development of muscle and the spine, respectively, and (2) wnt16−/− zebrafish mutants exhibited altered vertebral bone morphology and lean mass and morphology.26 Thus, although it cannot be ruled out that CPED1 influences bone and lean mass in humans, there are multiple candidate genes in this locus that could play an equal or larger role in influencing musculoskeletal traits.
Limitations
There are some limitations to our study. First, while we found no effects of loss of cped1 in 90 dpf adult bone, it cannot be ruled out that its loss affects bone during a specific temporal window we did not capture (ie, at the late larval/juvenile stage, or in aged animals). Indeed, a previous study of the FTO obesity-associated GWAS locus found evidence of multiple target genes, and that their phenotypic effects were restricted to a time period during development and were not detected in adult tissues.58 Thus, a temporal phenotypic analysis of bone in cped1 mutants may be needed. Second, we did not perform a rigorous examination of the role of cped1 in bone regeneration, therefore it is possible cped1 could have a distinct role in this process that is not apparent in uninjured animals. However, several observations suggest this is unlikely. For instance, our previously published scRNA-seq dataset for zebrafish fin regeneration42 shows relatively modest cped1 expression in the osteoblast cluster (similar to the levels observed in our VASTDB analysis). Moreover, both cped1 mutant lines were genotyped by fin clipping during which 50% of the length of the caudal fin tissue is collected, and we did not observe obvious defects in fin regeneration in the homozygous mutants. Third, as mentioned previously, it is possible that genetic compensation could reduce the effects of cped1 loss in zebrafish. Our studies do not support genetic compensation arising from transcriptional adaptation due to mutant mRNA degradation or removal of the PTC-harboring exon (exon skipping). However, other forms of genetic compensation can occur, for example, through cryptic splice sites, cryptic start sites, or intron inclusion.59–65 While we cannot exclude these possibilities, our analysis of two independent cped1 zebrafish lines harboring mutations in different exons makes it less likely that our results are due to the same compensatory effects. Fourth, although the levels of the cped1 transcript is greatly reduced in the cped1sa20221 mutant, we are unable to directly determine whether the resulting truncated protein is expressed or functional due to the lack of validated antibodies that can detect zebrafish Cped1. However, because of the predicted nature of the truncated protein and the greatly attenuated levels of transcript, we can infer that the function of Cped1 is disrupted. Lastly, our studies were not designed to include sex as a biological variable, precluding us from determining whether results differed with sex. However, it is noteworthy that the association between BMD and the CPED1-WNT16 locus does not show significant evidence of sex-specificity,4 suggesting that if CPED1 acts as a causal gene at the locus, the mechanism by which it contributes to BMD is unlikely to exhibit significant sexual dimorphism.
Conclusion
In conclusion, our studies fail to support a role of cped1 in contributing to adult zebrafish bone mass, lean mass, or bone and lean tissue morphology. Because of differences in key residues as well as distinct alternative splicing in zebrafish and mouse orthologs of CPED1, in-depth bone phenotypic analyses in Cped1 knockout mice are warranted. Moreover, there is evidence that variants at 7q31.31 can act independently of CPED1 to influence BMD and fracture risk, including recent in vitro studies showing that loss of ING3 disrupts osteoblast differentiation in primary human MSCs.18 Thus, further in vivo studies examining the role of other genes at the locus are needed.
Supplementary Material
Contributor Information
Kurtis Alvarado, Department of Orthopaedic Surgery and Sports Medicine, University of Washington School of Medicine, Seattle, WA 98195, United States; Institute for Stem Cell and Regenerative Medicine, University of Washington, Seattle, WA 98109, United States.
W Joyce Tang, Department of Orthopaedic Surgery and Sports Medicine, University of Washington School of Medicine, Seattle, WA 98195, United States; Institute for Stem Cell and Regenerative Medicine, University of Washington, Seattle, WA 98109, United States.
Claire J Watson, Department of Orthopaedic Surgery and Sports Medicine, University of Washington School of Medicine, Seattle, WA 98195, United States; Institute for Stem Cell and Regenerative Medicine, University of Washington, Seattle, WA 98109, United States.
Ali R Ahmed, Department of Orthopaedic Surgery and Sports Medicine, University of Washington School of Medicine, Seattle, WA 98195, United States; Institute for Stem Cell and Regenerative Medicine, University of Washington, Seattle, WA 98109, United States.
Arianna Ericka Gómez, Department of Orthopaedic Surgery and Sports Medicine, University of Washington School of Medicine, Seattle, WA 98195, United States; Institute for Stem Cell and Regenerative Medicine, University of Washington, Seattle, WA 98109, United States.
Rajashekar Donaka, The Azrieli Faculty of Medicine, Bar-Ilan University, Safed, 5290002, Israel.
Chris Amemiya, Department of Molecular and Cell Biology and Quantitative and Systems Biology Program, University of California, Merced, CA 95343, United States.
David Karasik, The Azrieli Faculty of Medicine, Bar-Ilan University, Safed, 5290002, Israel; Hebrew SeniorLife, Hinda and Arthur Marcus Institute for Aging Research, Boston, MA 02131, United States.
Yi-Hsiang Hsu, Hebrew SeniorLife, Hinda and Arthur Marcus Institute for Aging Research, Boston, MA 02131, United States.
Ronald Young Kwon, Department of Orthopaedic Surgery and Sports Medicine, University of Washington School of Medicine, Seattle, WA 98195, United States; Institute for Stem Cell and Regenerative Medicine, University of Washington, Seattle, WA 98109, United States.
Author contributions
Kurtis Alvarado (Formal analysis, Investigation, Methodology, Visualization, Writing—original draft, Writing—review & editing), W. Joyce Tang (Formal analysis, Investigation, Methodology, Visualization, Writing—original draft, Writing—review & editing), Claire J. Watson (Investigation, Methodology, Writing—review & editing), Ali R. Ahmed (Formal analysis, Investigation, Methodology, Software, Writing—review & editing), Arianna Ericka Gómez (Writing—review & editing), Rajashekar Donaka (Formal analysis, Investigation, Writing—review & editing), Chris Amemiya (Methodology, Writing—review and editing), David Karasik (Conceptualization, Writing—review & editing), Yi-Hsiang Hsu (Conceptualization, Writing—review & editing), and Ronald Young Kwon (Conceptualization, Funding acquisition, Project administration, Supervision, Writing—review & editing).
Funding
Research reported in this publication was supported by the National Institute of Arthritis and Musculoskeletal and Skin Diseases of the National Institutes of Health under Award Number AR074417, as well as the Office of the Director (OD) and the Ernest M. Burgess Jr. Endowed Chair for Orthopedic Research. A.E.G. was supported by the National Institute on Aging of the National Institutes of Health, under Award Number AG066574, the Biological Mechanisms for Healthy Aging Training Grant. The content is solely the responsibility of the authors and does not necessarily represent the official views of the National Institutes of Health. The authors have no relevant financial or non-financial interests to disclose.
Conflicts of interest
None declared.
Data availability
The data are available from the corresponding author upon reasonable request.
References
- 1. Maynard RD, Godfrey DA, Medina-Gomez C, Ackert-Bicknell CL. Characterization of expression and alternative splicing of the gene cadherin-like and PC esterase domain containing 1 (Cped1). Gene. 2018;674:127–133. [DOI] [PMC free article] [PubMed] [Google Scholar]
- 2. Cho YS, Go MJ, Kim YJ, et al. A large-scale genome-wide association study of Asian populations uncovers genetic factors influencing eight quantitative traits. Nat Genet. 2009;41(5):527–534. [DOI] [PubMed] [Google Scholar]
- 3. Zhang LS, Hu HG, Liu YJ, et al. A follow-up association study of two genetic variants for bone mineral density variation in Caucasians. Osteoporos Int. 2012;23(7):1867–1875. [DOI] [PMC free article] [PubMed] [Google Scholar]
- 4. Estrada K, Styrkarsdottir U, Evangelou E, et al. Genome-wide meta-analysis identifies 56 bone mineral density loci and reveals 14 loci associated with risk of fracture. Nat Genet. 2012;44(5):491–501. [DOI] [PMC free article] [PubMed] [Google Scholar]
- 5. Medina-Gomez C, Kemp JP, Estrada K, et al. Meta-analysis of genome-wide scans for total body BMD in children and adults reveals allelic heterogeneity and age-specific effects at the WNT16 locus. PLoS Genet. 2012;8(7):e1002718. [DOI] [PMC free article] [PubMed] [Google Scholar]
- 6. Zheng HF, Tobias JH, Duncan E, et al. WNT16 influences bone mineral density, cortical bone thickness, bone strength, and osteoporotic fracture risk. PLoS Genet. 2012;8(7):e1002745. [DOI] [PMC free article] [PubMed] [Google Scholar]
- 7. Koller DL, Zheng HF, Karasik D, et al. Meta-analysis of genome-wide studies identifies WNT16 and ESR1 SNPs associated with bone mineral density in premenopausal women. J Bone Miner Res. 2013;28(3):547–558. [DOI] [PMC free article] [PubMed] [Google Scholar]
- 8. Morris JA, Kemp JP, Youlten SE, et al. An atlas of genetic influences on osteoporosis in humans and mice. Nat Genet. 2019;51(2):258–266. [DOI] [PMC free article] [PubMed] [Google Scholar]
- 9. Kemp JP, Morris JA, Medina-Gomez C, et al. Identification of 153 new loci associated with heel bone mineral density and functional involvement of GPC6 in osteoporosis. Nat Genet. 2017;49(10):1468–1475. [DOI] [PMC free article] [PubMed] [Google Scholar]
- 10. Gómez AE, Addish S, Alvarado K, et al. Multiple mechanisms explain genetic effects at the CPED1-WNT16 bone mineral density locus. Curr Osteoporos Rep. 2023;21(2):173–183. [DOI] [PMC free article] [PubMed] [Google Scholar]
- 11. Movérare-Skrtic S, Henning P, Liu X, et al. Osteoblast-derived WNT16 represses osteoclastogenesis and prevents cortical bone fragility fractures. Nat Med. 2014;20(11):1279–1288. [DOI] [PMC free article] [PubMed] [Google Scholar]
- 12. Gori F, Lerner U, Ohlsson C, Baron R. A new WNT on the bone: WNT16, cortical bone thickness, porosity and fractures. Bonekey Rep. 2015;4:669, 1–6. [DOI] [PMC free article] [PubMed] [Google Scholar]
- 13. Wergedal JE, Kesavan C, Brommage R, Das S, Mohan S. Role of WNT16 in the regulation of periosteal bone formation in female mice. Endocrinology. 2015;156(3):1023–1032. [DOI] [PMC free article] [PubMed] [Google Scholar]
- 14. Movérare-Skrtic S, Wu J, Henning P, et al. The bone-sparing effects of estrogen and WNT16 are independent of each other. Proc Natl Acad Sci USA. 2015;112(48):14972–14977. [DOI] [PMC free article] [PubMed] [Google Scholar]
- 15. Alam I, Alkhouli M, Gerard-O'Riley RL, et al. Osteoblast-specific overexpression of human WNT16 increases both cortical and trabecular bone mass and structure in mice. Endocrinology. 2016;157(2):722–736. [DOI] [PMC free article] [PubMed] [Google Scholar]
- 16. Alam I, Oakes DK, Reilly AM, et al. Overexpression of WNT16 does not prevent cortical bone loss due to glucocorticoid treatment in mice. JBMR Plus. 2019;3(4):e10084. [DOI] [PMC free article] [PubMed] [Google Scholar]
- 17. Alam I, Reilly AM, Alkhouli M, et al. Bone mass and strength are significantly improved in mice overexpressing human WNT16 in osteocytes. Calcif Tissue Int. 2017;100(4):361–373. [DOI] [PMC free article] [PubMed] [Google Scholar]
- 18. Chesi A, Wagley Y, Johnson ME, et al. Genome-scale Capture C promoter interactions implicate effector genes at GWAS loci for bone mineral density. Nat Commun. 2019;10(1):1260. [DOI] [PMC free article] [PubMed] [Google Scholar]
- 19. Anantharaman V, Aravind L. Novel eukaryotic enzymes modifying cell-surface biopolymers. Biol Direct. 2010;5(1):1. [DOI] [PMC free article] [PubMed] [Google Scholar]
- 20. Anderson AC, Stangherlin S, Pimentel KN, Weadge JT, Clarke AJ. The SGNH hydrolase family: a template for carbohydrate diversity. Glycobiology. 2022;32(10):826–848. [DOI] [PMC free article] [PubMed] [Google Scholar]
- 21. Conery M, Pippin JA, Wagley Y, et al. GWAS-informed data integration and non-coding CRISPRi screen illuminate genetic etiology of bone mineral density. bioRxiv. Preprint posted online March 20 2024. 10.1101/2024.03.19.585778. [DOI] [PMC free article] [PubMed]
- 22. Kwon RY, Watson CJ, Karasik D. Using zebrafish to study skeletal genomics. Bone. 2019;126:37–50. [DOI] [PMC free article] [PubMed] [Google Scholar]
- 23. Busse B, Galloway JL, Gray RS, Harris MP, Kwon RY. Zebrafish: an emerging model for orthopedic research. J Orthop Res. 2020;38(5):925–936. [DOI] [PMC free article] [PubMed] [Google Scholar]
- 24. Tonelli F, Bek JW, Besio R, et al. Zebrafish: a resourceful vertebrate model to investigate skeletal disorders. Front Endocrinol (Lausanne). 2020;11:489. 10.3389/fendo.2020.00489 [DOI] [PMC free article] [PubMed] [Google Scholar]
- 25. Henke K, Farmer DT, Niu X, Kraus JM, Galloway JL, Youngstrom DW. Genetically engineered zebrafish as models of skeletal development and regeneration. Bone. 2023;167:116611. [DOI] [PMC free article] [PubMed] [Google Scholar]
- 26. Watson CJ, Tang WJ, Rojas MF, et al. wnt16 regulates spine and muscle morphogenesis through parallel signals from notochord and dermomyotome. PLoS Genet. 2022;18(11):e1010496. [DOI] [PMC free article] [PubMed] [Google Scholar]
- 27. Gupta T, Mullins MC. Dissection of organs from the adult zebrafish. J Vis Exp. 2010;37:e1717. 10.3791/1717. [DOI] [PMC free article] [PubMed] [Google Scholar]
- 28. Saunders LM, Srivatsan SR, Duran M, et al. Embryo-scale reverse genetics at single-cell resolution. Nature. 2023;623(7988):782–791. [DOI] [PMC free article] [PubMed] [Google Scholar]
- 29. Trapnell C, Cacchiarelli D, Grimsby J, et al. The dynamics and regulators of cell fate decisions are revealed by pseudotemporal ordering of single cells. Nat Biotechnol. 2014;32(4):381–386. [DOI] [PMC free article] [PubMed] [Google Scholar]
- 30. Butler A, Hoffman P, Smibert P, Papalexi E, Satija R. Integrating single-cell transcriptomic data across different conditions, technologies, and species. Nat Biotechnol. 2018;36(5):411–420. [DOI] [PMC free article] [PubMed] [Google Scholar]
- 31. R Core Team . R: A language and environment for statistical computing. R Foundation for Statistical Computing, Vienna, Austria. 2024. https://www.R-project.org/
- 32. Watson CJ, Monstad-Rios AT, Bhimani RM, et al. Phenomics-based quantification of CRISPR-induced mosaicism in zebrafish. Cell Syst. 2020;10(3):275–86 e5. [DOI] [PMC free article] [PubMed] [Google Scholar]
- 33. Hur M, Gistelinck CA, Huber P, et al. MicroCT-based phenomics in the zebrafish skeleton reveals virtues of deep phenotyping in a distributed organ system. elife. 2017;6:e26014. [DOI] [PMC free article] [PubMed] [Google Scholar]
- 34. Gomez AE, Salmon P, Baumgarten N, et al. MicroCT scanning and analysis in the zebrafish skeleton. Protocol Exchange. Protocol posted online March 1 2024. 10.21203/rs.3.pex-2573/v1. [DOI] [Google Scholar]
- 35. Schindelin J, Arganda-Carreras I, Frise E, et al. Fiji: an open-source platform for biological-image analysis. Nat Methods. 2012;9(7):676–682. [DOI] [PMC free article] [PubMed] [Google Scholar]
- 36. Diamond KM, Rolfe SM, Kwon RY, Maga AM. Computational anatomy and geometric shape analysis enables analysis of complex craniofacial phenotypes in zebrafish. Biol Open. 2022;11(2):bio058948. [DOI] [PMC free article] [PubMed] [Google Scholar]
- 37. Diamond KM, Burtner AE, Siddiqui D, et al. Examining craniofacial variation among crispant and mutant zebrafish models of human skeletal diseases. J Anat. 2023;243(1):66–77. [DOI] [PMC free article] [PubMed] [Google Scholar]
- 38. Fedorov A, Beichel R, Kalpathy-Cramer J, et al. 3D Slicer as an image computing platform for the Quantitative Imaging Network. Magn Reson Imaging. 2012;30(9):1323–1341. [DOI] [PMC free article] [PubMed] [Google Scholar]
- 39. Zhou L, Feng T, Xu S, et al. ggmsa: a visual exploration tool for multiple sequence alignment and associated data. Brief Bioinform. 2022;23(4):bbac222. [DOI] [PubMed] [Google Scholar]
- 40. Li Z, Zhang Y, Bush SJ, et al. MeDAS: a metazoan developmental alternative splicing database. Nucleic Acids Res. 2021;49(D1):D144–D150. [DOI] [PMC free article] [PubMed] [Google Scholar]
- 41. Tapial J, Ha KCH, Sterne-Weiler T, et al. An atlas of alternative splicing profiles and functional associations reveals new regulatory programs and genes that simultaneously express multiple major isoforms. Genome Res. 2017;27(10):1759–1768. [DOI] [PMC free article] [PubMed] [Google Scholar]
- 42. Tang WJ, Watson CJ, Olmstead T, Allan CH, Kwon RY. Single-cell resolution of MET- and EMT-like programs in osteoblasts during zebrafish fin regeneration. iScience. 2022;25(2):103784. [DOI] [PMC free article] [PubMed] [Google Scholar]
- 43. Lee HJ, Hou Y, Chen Y, et al. Regenerating zebrafish fin epigenome is characterized by stable lineage-specific DNA methylation and dynamic chromatin accessibility. Genome Biol. 2020;21(1):52. [DOI] [PMC free article] [PubMed] [Google Scholar]
- 44. Kettleborough RN, Busch-Nentwich EM, Harvey SA, et al. A systematic genome-wide analysis of zebrafish protein-coding gene function. Nature. 2013;496(7446):494–497. [DOI] [PMC free article] [PubMed] [Google Scholar]
- 45. Tuladhar R, Yeu Y, Tyler Piazza J, et al. CRISPR-Cas9-based mutagenesis frequently provokes on-target mRNA misregulation. Nat Commun. 2019;10(1):4056. [DOI] [PMC free article] [PubMed] [Google Scholar]
- 46. El-Brolosy MA, Kontarakis Z, Rossi A, et al. Genetic compensation triggered by mutant mRNA degradation. Nature. 2019;568(7751):193–197. [DOI] [PMC free article] [PubMed] [Google Scholar]
- 47. Medina-Gomez C, Kemp JP, Dimou NL, et al. Bivariate genome-wide association meta-analysis of pediatric musculoskeletal traits reveals pleiotropic effects at the SREBF1/TOM1L2 locus. Nat Commun. 2017;8(1):121. [DOI] [PMC free article] [PubMed] [Google Scholar]
- 48. Jayne BC, Lauder GV. Comparative morphology of the myomeres and axial skeleton in four genera of centrarchid fishes. J Morphol. 1994;220(2):185–205. [DOI] [PubMed] [Google Scholar]
- 49. Bonfante B, Faux P, Navarro N, et al. A GWAS in Latin Americans identifies novel face shape loci, implicating VPS13B and a Denisovan introgressed region in facial variation. Sci Adv. 2021;7(6):eabc6160. [DOI] [PMC free article] [PubMed] [Google Scholar]
- 50. Lunin VV, Wang HT, Bharadwaj VS, et al. Molecular mechanism of polysaccharide acetylation by the Arabidopsis xylan O-acetyltransferase XOAT1. Plant Cell. 2020;32(7):2367–2382. [DOI] [PMC free article] [PubMed] [Google Scholar]
- 51. Gutteridge A, Thornton JM. Understanding nature's catalytic toolkit. Trends Biochem Sci. 2005;30(11):622–629. [DOI] [PubMed] [Google Scholar]
- 52. Paetzel M, Dalbey RE. Catalytic hydroxyl/amine dyads within serine proteases. Trends Biochem Sci. 1997;22(1):28–31. [DOI] [PubMed] [Google Scholar]
- 53. Groza T, Gomez FL, Mashhadi HH, et al. The International Mouse Phenotyping Consortium: comprehensive knockout phenotyping underpinning the study of human disease. Nucleic Acids Res. 2023;51(D1):D1038–D1045. [DOI] [PMC free article] [PubMed] [Google Scholar]
- 54. Määttä JA, Bendre A, Laanti M, et al. Fam3c modulates osteogenic cell differentiation and affects bone volume and cortical bone mineral density. Bonekey Rep. 2016;5:787, 1–10. [DOI] [PMC free article] [PubMed] [Google Scholar]
- 55. Bendre A, Buki KG, Maatta JA. Fam3c modulates osteogenic differentiation by down-regulating Runx2. Differentiation. 2017;93:50–57. [DOI] [PubMed] [Google Scholar]
- 56. Qu X, Liao M, Liu W, et al. Loss of Wnt16 leads to skeletal deformities and downregulation of bone developmental pathway in zebrafish. Int J Mol Sci. 2021;22(13):6673. [DOI] [PMC free article] [PubMed] [Google Scholar]
- 57. McGowan LM, Kague E, Vorster A, Newham E, Cross S, Hammond CL. Wnt16 elicits a protective effect against fractures and supports bone repair in zebrafish. JBMR Plus. 2021;5(3):e10461. [DOI] [PMC free article] [PubMed] [Google Scholar]
- 58. Sobreira DR, Joslin AC, Zhang Q, et al. Extensive pleiotropism and allelic heterogeneity mediate metabolic effects of IRX3 and IRX5. Science. 2021;372(6546):1085–1091. [DOI] [PMC free article] [PubMed] [Google Scholar]
- 59. Anderson JL, Mulligan TS, Shen MC, et al. mRNA processing in mutant zebrafish lines generated by chemical and CRISPR-mediated mutagenesis produces unexpected transcripts that escape nonsense-mediated decay. PLoS Genet. 2017;13(11):e1007105. 10.1371/journal.pgen.1007105 [DOI] [PMC free article] [PubMed] [Google Scholar]
- 60. Sztal TE, McKaige EA, Williams C, Ruparelia AA, Bryson-Richardson RJ. Genetic compensation triggered by actin mutation prevents the muscle damage caused by loss of actin protein. PLoS Genet. 2018;14(2):e1007212. [DOI] [PMC free article] [PubMed] [Google Scholar]
- 61. San B, Rougeot J, Voeltzke K, et al. The ezh2(sa1199) mutant zebrafish display no distinct phenotype. PLoS One. 2019;14(1):e0210217. 10.1371/journal.pone.0210217 [DOI] [PMC free article] [PubMed] [Google Scholar]
- 62. Buglo E, Sarmiento E, Martuscelli NB, et al. Genetic compensation in a stable slc25a46 mutant zebrafish: a case for using F0 CRISPR mutagenesis to study phenotypes caused by inherited disease. PLoS One. 2020;15(3):e0230566. 10.1371/journal.pone.0230566 [DOI] [PMC free article] [PubMed] [Google Scholar]
- 63. Ma Z, Chen J. Premature termination codon-bearing mRNA mediates genetic compensation response. Zebrafish. 2020;17(3):157–162. [DOI] [PubMed] [Google Scholar]
- 64. Kontarakis Z, Stainier DYR. Genetics in light of transcriptional adaptation. Trends Genet. 2020;36(12):926–935. [DOI] [PMC free article] [PubMed] [Google Scholar]
- 65. El-Brolosy MA, Stainier DYR. Genetic compensation: a phenomenon in search of mechanisms. PLoS Genet. 2017;13(7):e1006780. 10.1371/journal.pgen.1006780 [DOI] [PMC free article] [PubMed] [Google Scholar]
Associated Data
This section collects any data citations, data availability statements, or supplementary materials included in this article.
Supplementary Materials
Data Availability Statement
The data are available from the corresponding author upon reasonable request.