

Abstract
Background
Lung cancer is a leading cause of cancer-related mortality. Non-small cell lung cancer (NSCLC) comprises 85% of cases with rising incidence among never-smokers (NS). This study seeks to compare clinical, imaging, pathology, and outcomes between NS and ever-smokers (S) NSCLC patients to identify significant differences if any.
Methods
Retrospective cohort study of 155 NSCLC patients (88 S and 67 NS). The main predictor was smoking. Clinical, imaging, and pathology findings were evaluated at initial biopsy for staging. The primary outcome was all-cause mortality, and the secondary outcome was 12-month progression-free survival.
Results
Imaging: NS and S had similar nodule size (0.81), calcification (> 0.99), and invasion of adjacent structures (> 0.99) (p values). NS slightly trended to more commonly involve the RLL vs S the RUL (p = 0.11). NS had higher numbers of extrathoracic metastases at initial biopsy for staging (p = 0.055).
Pathology: NS more commonly had adenocarcinoma compared to S, who had equal numbers of adenocarcinoma and squamous cell carcinoma (p = 0.001). Rates of lymphovascular and pleural invasion were similar (p = 0.84 and 0.28).
Initial staging: NS were more often initially diagnosed with stage IV disease (p = 0.046), positive nodal disease (p = 0.002), and metastatic disease (p = 0.004).
Outcomes: S had a non-significant trend toward worse 12-month progression-free survival (rate ratio = 1.31, p = 0.31; HR = 1.33, p = 0.28). NS and S had similar 1-year all-cause mortality (HR = 1.06, p = 0.90). S had nearly double the risk of all-cause mortality in 5 years (HR = 1.73, p = 0.056) and 10 years (HR = 1.77, p = 0.02). Median survival was 6.6 years for NS and 3.9 years for S, with NS surviving 2.7 years longer on average (p = 0.045).
Conclusions
CT nodule features were similar in NS and S. NS more often had metastatic adenopathy, distant metastases, and stage IV disease at initial biopsy. Despite similar 12-month progression-free survival and 1-year all-cause mortality, S had nearly double the risk of mortality in the first 5 and 10 years post-diagnosis.
Trial registration
Retrospectively registered.
Keywords: Non-small cell lung cancer, Chest CT, Histopathology, Cancer staging, All-cause mortality
Background
Lung cancer continues to have the highest incidence and mortality worldwide [1, 2]. Adenocarcinoma is the most common histologic subtype of lung cancer in the USA [2]. There is higher incidence of lung cancer in men, being the most common cause of death from malignancy in both men and women [2, 3]. The economic cost of caring for patients with lung cancer in the USA is over $12 billion per year [3].
NSCLC comprises about 85% of lung cancers including adenocarcinoma, squamous-cell carcinoma, and large-cell carcinoma [3]. Prognosis is directly related to stage at initial presentation, with 5-year survival ranging as high as 77% for stage IA to 1 to 2% for stage IV [4]. Treatment selection remains dependent on accurate staging [2, 4].
Clinical presentation of lung cancer is varied [2]. About one third of patients present with symptoms of distant metastases, and bone pain is present in up to 20% of all patients at presentation [2]. Other organs involved may include contralateral lung, liver, adrenal glands, lymph nodes, brain, and spinal cord [2].
The most important risk factor for lung cancer is cigarette smoking [5]. About 80–90% of lung cancers cases are related to smoking [6]. Recent medical reports found that lung cancer rates were increasing among youth and never-smokers (NS) [1]. Reports show utilizing low-dose lung cancer screening CT lowers mortality in smokers (S) [4, 7, 8]. However, no such screening method exists for NS.
Scarce data is available for characterization of clinical, imaging, pathology, and outcomes in NS compared to S NSCLC patients. In this study, we investigate if any significant differences between NS and S exist, in particular regarding chest CT imaging findings, initial staging, location of metastatic disease, and outcomes, including all-cause mortality and 12-month progression-free survival.
Methods
Study design
This study protocol was reviewed by our institution and followed our institutional guidelines to obtain IRB approval (ID# 00105708). Due to the retrospective nature of the study, patient consent was waived. Deidentified data are available from the corresponding author only upon reasonable request. Previous power calculations indicated a total of > 130 patients were adequate to determine statistical significance of primary and secondary outcomes between S and NS groups.
Participants
We gathered electronic medical record information from a tertiary level healthcare system including hospitals in Utah, Idaho, Colorado, Nevada, Wyoming, and Montana in addition to a large regional cancer institute. This was a retrospective cohort study design, and all patients were diagnosed and managed according to standard of care practices at the time. Detailed evaluation of the treatments offered and performed for this patient cohort was outside of the scope of this study and was not evaluated. We included 155 patients who underwent initial non-small cell lung cancer staging with PET-CT or CT alone between 11/11/2010 and 10/13/2022 (Fig. 1).
Fig. 1.

Patient selection flowchart
Inclusion criteria
Eligible participants were adults aged 18 years or older with a confirmed histopathological diagnosis of NSCLC.
Exclusion criteria
Participants < 18 years of age, those missing histopathological diagnosis of the tumor, those without electronic medical records, or undocumented smoking status were excluded. In addition, those without initial imaging staging prior to treatment, insufficient data for clinical staging, or no follow-up medical records data were also excluded.
Data collection
Clinical, demographic, and follow-up survival data were extracted from electronic health records. Variables collected included age, race, sex, body mass index (BMI), smoking history, cancer histology, stage, size, and follow-up outcomes. Treatment regimens, including surgery and radiation therapy, were not recorded or evaluated as part of this study. NSCLC staging was evaluated based on the American Joint Committee on Cancer (AJCC) 8th Edition staging manual. Pathology and radiology imaging data was retrieved from the hospital electronic medical records (EMR) system. Lung nodules and lung parenchyma were prospectively evaluated by a fellowship-trained cardiothoracic radiologist (JRB). Follow-up and outcomes data were recorded at 12 months and 36 months starting at the time of initial biopsy for staging. Follow-up and outcomes data obtained from the EMR included disease status (complete remission, partial remission, stable disease, or progressive disease according to Response Evaluation Criteria in Solid Tumors version 1.1 (RECIST v1.1 [9]), location of disease progression (as applicable), mortality status, and cause of death (as applicable).
Predictor and outcome variable definitions
The primary predictor variable was history of smoking. A nonsmoker was defined as a never smoker (n = 67). Ever smoker was defined as a prior smoker or current smoker (n = 88). The number of pack years was not used in the smoker definition.
The primary outcome variable was absence of overall survival, which is all-cause mortality (death from any cause). There were 73 who died and 82 who did not die during the 10-year follow-up time. Time to death was limited to the time between biopsy and death, or time between biopsy and end of follow-up.
The secondary outcome variable was 12-month progression-free survival, which is generally defined as the time between treatment (end of treatment) and first occurrence of disease progression or all-cause mortality. In a clinical trial of a specific cancer treatment regimen, this definition is straightforward and is modeled with a time-to-event analysis, commonly using Kaplan–Meier graphs and Cox regression. In our observational study, the treatment was whatever the physician determined was best for the patient, so end of treatment was not a consistent starting point for the follow-up period. To provide a consistent starting point, we began follow-up at the time of biopsy. Our outcome event was disease progression at 12 months, so absence of 12-month progression-free survival. A patient had 12-month progression-free survival if either the patient was still alive and had complete remission, partial remission, or stable disease at 12 months or the patient was still alive and had complete remission, partial remission, or stable disease at end of follow-up if end of follow-up was less than 12 months. Absence of 12-month progression-free survival, or 12-month disease progression, was assigned if the patient either died within 12 months or had progressive disease at 12 months or had progressive disease at end of follow-up if follow-up was less than 12 months. The 12-month disease progression outcome was determined by manual chart review of the electronic medical records.
Statistical analysis
For variables other than the primary outcomes, S were compared to NS using a chi-square test; or if the data were sparse, using Fisher exact test for binary categorical variables or Fisher-Freeman-Halton test for categorical variables with more than two categories. For ordered categorical variables, the comparison was made using a Wilcoxon-Mann–Whitney test. For continuous variables, an independent sample t-test was used.
For the primary outcome of all-cause mortality, a Cox regression model was fitted and graphed with a Kaplan–Meier plot. For the secondary outcome of 12-month disease progression, a Cox regression model is not a strictly correct analysis approach, as the data are not all incidence data (time to event data). Instead, the 12-month disease progression variable is a combination of death incidence and disease progression prevalence, as time to death is noted when death occurs in an incidence fashion, whereas disease progression is measured at the last clinic visit in the patient record if lost-to-follow-up before 12 months, or the disease progression status at 12 months if the patient had further clinic visits after 12 months.
We also fit a strictly correct analysis. Given unequal follow-up times, due to death or lost to follow-up, we fit a Poisson regression model, modeling rates (cases/person-time), where Poisson regression permits the incidence and prevalence mix, as it is not a strict time-to-event incidence analysis like Cox regression. We displayed the association with a Kaplan–Meier plot so the reader can see when death events (a strong form of disease progression) and losses to follow-up (censoring) occurred.
We then fit multivariable models, controlling for potential confounders. The potential confounders are the patient characteristic variables (baseline variables) shown in Table 1. The pathology and radiology variables (Table 2) are intermediate variables, rather than confounders, as they could be related to smoking by being an early outcome of smoking, so it is not correct to control for those. Patient characteristic variables where initially included in the multivariable models if they have p < 0.20, except for history of COPD which was too highly collinear with smoker, and then eliminated in an iterative backwards elimination fashion. Variables were retained in the final model if they had p < 0.10 or their inclusion changed the relative risk (hazard ratio or rate ratio) for the smoker variable by 10% [10].
Table 1.
Baseline patient characteristics
| Variable | Ever-smoker [n = 88] | Never-smoker [n = 67] | p value |
|---|---|---|---|
| Smoking status, n (%) | – | ||
| Current smoker | 15 (17) | ||
| Prior smoker | 73 (83) | ||
| Never smoker | 0 (0) | 67 (100) | |
| Pack years of smoking, median (IQRa) | 35 (20, 60) | 0 (0, 0) | – |
| Female sex, n (%) | 37 (42) | 45 (67) | 0.002 |
|
Age, mean ± SDa, years min–max |
69 ± 8 52–90 |
62 ± 13 22–87 |
< 0.001 |
| Race/ethnicity, n (%) | 0.67 | ||
| African American | 1 (1) | 2 (3) | |
| Latinx | 5 (6) | 6 (9) | |
| White | 76 (86) | 56 (84) | |
| Other | 6 (7) | 3 (4) | |
| Body mass index, mean ± SD, kg/m2 | 26 ± 6 | 26 ± 6 | 0.73 |
| Family history of lung cancer, n (%) | 11 (12) | 8 (12) | 0.94 |
| History of chronic obstructive pulmonary disease (COPD), n (%) | 42 (48) | 1 (1) | < 0.001 |
| History of interstitial lung disease (ILD), n (%) | 0 (0) | 1 (1) | 0.43 |
| Type of ILD, n (%) | |||
| Usual interstitial pneumonia (UIP), n (%) | 0 (0) | 1 (1) | 0.43 |
| History of non-lung cancer, n (%) | 25 (37) | 33 (38) | 0.98 |
| History of prior radiation therapy to the chest or neck, n (%) | 3 (3) | 3 (4) | > 0.99 |
| Known history of asbestos exposure, n (%) | 3 (3) | 1 (1) | 0.63 |
| History of type 2 diabetes mellitus (DM), n (%) | 19 (22) | 12 (18) | 0.57 |
| History of chronic liver disease, n (%) | 3 (3) | 3 (4) | > 0.99 |
| History of chronic kidney disease, n (%) | 6 (7) | 1 (1) | 0.14 |
aIQR interquartile range (25th, 75th percentile), SD standard deviation; boldface values indicate statistical significance
Table 2.
Pathology and radiology variables
| Variable | Ever-smoker [n = 88] | Never-smoker [n = 67] | p value |
|---|---|---|---|
| Follow-up time | |||
| 10-year overall survival follow-up period median follow-up time (KM-PF)a, median ± SEa, years | 5.1 ± 0.8 | 3.9 ± 0.6 | 0.24 |
| 1-year progression-free survival period median follow-up time (KM-PF), median ± SE*, months | 11.5 ± 1.7 | 12 ± 1.7 | 0.78 |
| Pathology | |||
| Fine needle aspiration (FNA), n (%) | 82 (93) | 53 (80) | 0.02 |
| Cell type, n (%) | < 0.001 | ||
| Adenocarcinoma | 42 (48) | 51 (76) | |
| Adenosquamous | 2 (2) | 1 (1) | |
| Squamous | 38 (43) | 10 (15) | |
| Large cell | 0 (0) | 1 (1) | |
| Poorly differentiated | 6 (7) | 4 (6) | |
| Surgical excision, n (%) | 25 (28) | 32 (48) | 0.01 |
| Cell type on surgical path, n/N (%) | 0.22 | ||
| Adenocarcinoma | 14/25 (56) | 23/32 (72) | |
| Adenosquamous | 1/25 (4) | 0/32 (0) | |
| Squamous | 10/25 (40) | 8/32 (25) | |
| Large cell | 0/25 (0) | 0/32 (0) | |
| Poorly differentiated | 0/25 (0) | 1/32 (3) | |
| Subtype (if applicable), n/N (%) | 0.21 | ||
| Acinar | 8/15 (53) | 6/24 (25) | |
| Papillary | 0/15 (0) | 4/24 (17) | |
| Bronchoalveolar | 0/15 (0) | 3/24 (12) | |
| Poorly differentiated | 4/15 (27) | 7/24 (7) | |
| Other | 0/15 (0) | 1/24 (1) | |
| Acinar and papillary | 2/15 (13) | 2/24 (8) | |
| Acinar and papillary and bronchoalveolar | 0/15 (0) | 1/24 (4) | |
| Acinar and large cell | 1/15 (0) | 0/24 (0) | |
| Size of tumor, mean ± SD, cm3 | 30 ± 83 | 30 ± 59 | 0.98 |
| Greatest dimension, mean ± SD, mm | 28 ± 15 | 29 ± 21 | 0.87 |
| Tumor genotype, n (%) | < 0.001 | ||
| No genotyping | 32 (37) | 18 (29) | |
| EGFR | 6 (7) | 20 (32) | |
| ALK | 1 (1) | 6 (10) | |
| MET | 1 (1) | 0 (0) | |
| BRAF | 1 (1) | 3 (5) | |
| RAS | 8 (9) | 1 (2) | |
| HER2 | 1 (1) | 2 (3) | |
| Other | 33 (38) | 9 (15) | |
| EGFR and other | 0 (0) | 1 (2) | |
| EGFR and ALK | 0 (0) | 2 (3) | |
| EGFR and RAS | 1 (1) | 0 (0) | |
| HER2 and other | 1 (1) | 0 (0) | |
| ROSI and other | 1 (1) | 0 (0) | |
| Lymphovascular invasion, n (%) | 9/25 (36) | 9/27 (33) | 0.84 |
| Pleural invasion, n (%) | 12/25 (48) | 9/27 (33) | 0.28 |
| Radiology | |||
| Location of nodule, n (%) | 0.11 | ||
| RLL | 22 (25) | 24 (36) | |
| RML | 3 (3) | 8 (12) | |
| RUL | 30 (34) | 16 (24) | |
| LLL | 9 (10) | 9 (13) | |
| Lingula | 2 (2) | 1 (1) | |
| LUL | 22 (25) | 9 (13) | |
| Nodule size in 2 dimensions, mean ± SD, cm2 | 17 ± 26 | 16 ± 21 | 0.81 |
| Missing data | (n = 3) | ||
| Greatest dimension, mean ± SD, mm | 40 ± 27 | 41 ± 26 | 0.88 |
| Missing data | (n = 3) | ||
| General nodule morphology, n (%) | 0.47 | ||
| Solid | 81 (92) | 56 (88) | |
| Part solid | 7 (8) | 7 (11) | |
| Nonsolid or ground glass | 0 (0) | 1 (2) | |
| Missing data | (n = 3) | ||
| Suspicious morphology (if applicable), n (%) | 0.050 | ||
| None | 3 (3) | 1 (2) | |
| Spiculated | 23 (26) | 16 (27) | |
| Lobulated margin | 28 (32) | 14 (24) | |
| Cystic/cavitary components | 8 (9) | 5 (8) | |
| Part solid | 3 (3) | 2 (3) | |
| Spiculated and lobulated margin | 7 (8) | 18 (31) | |
| Spiculated and cystic/cavitary components | 4 (5) | 0 (0) | |
| Spiculated and part solid | 2 (2) | 1 (2) | |
| Lobulated margin and cystic/cavitary component | 3 (3) | 0 (0) | |
| Spiculated and lobulated margin and cys/cav comp | 5 (6) | 2 (3) | |
| Lobulated margin and cys/cav comp and part solid | 1 (1) | 0 (0) | |
| Missing data | (n = 3) | ||
| Nodule calcifications, n (%) | 4 (5) | 3 (5) | > 0.99 |
| Missing data | (n = 3) | ||
| Nodule invades adjacent structures on CT, n (%) | 66 (75) | 48 (75) | > 0.99 |
| Missing data | (n = 3) | ||
| Single or multiple nodules, n (%) | 0.75 | ||
| Single nodule | 38 (43) | 26 (41) | |
| Multiple nodules > 4 mm | 50 (57) | 38 (59) | |
| Missing data | (n = 3) | ||
| Total nodules, n (%) | 0.67 | ||
| Single nodule | 38 (43) | 26 (41) | |
| < 10 nodules > 4 mm | 36 (41) | 26 (41) | |
| 10 or more nodules > 4 mm | 14 (16) | 12 (19) | |
| Missing data | (n = 3) | ||
| Underlying lung disease on staging CT, n (%) | <0.001 | ||
| Absent | 36 (41) | 61 (95) | |
| Emphysema | 50 (57) | 1 (2) | |
| Interstitial lung disease | 2 (2) | 2 (3) | |
| Missing data | (n = 3) | ||
| Enlarged mediastinal or hilar LNs at staging, n (%) | 45 (51) | 37 (58) | 0.41 |
| Missing data | (n = 3) | ||
| Extrathoracic metastases on staging imaging, n (%) | 24 (27) | 27 (42) | 0.055 |
| Missing data | (n = 3) | ||
| Metastases location at staging, n (%)b | |||
| None | 32 (36) | 20 (31) | 0.51 |
| Lung | 33 (38) | 36 (56) | 0.02 |
| Mediastinal/ipsilateral hilar LN | 44 (50) | 34 (53) | 0.70 |
| Contralateral LN | 14 (16) | 10 (16) | 0.96 |
| Distant LNs | 11 (12) | 16 (25) | 0.047 |
| Pleura/pericardium | 15 (17) | 13 (20) | 0.61 |
| Bone | 9 (10) | 12 (19) | 0.13 |
| Liver | 3 (3) | 3 (5) | 0.70 |
| Brain | 8 (9) | 8 (12) | 0.50 |
| Adrenal | 8 (9) | 4 (6) | 0.52 |
| Other | 5 (6) | 4 (6) | 0.88 |
| Missing data | (n = 3) | ||
| Primary nodule FDG avid on PET (if applicable), n (%) | 0.59 | ||
| Yes | 78 (90) | 55 (86) | |
| No | 0 (0) | 1 (2) | |
| No PET | 9 (10) | 8 (12) | |
| Missing data | (n = 3) | ||
aSE standard error, KM-PF Kaplan–Meier estimate of potential follow-up time
bPercentages sum to greater than 100% because multiple metastases locations occurred in the same patient; boldface values indicate statistical significance
For the 10-year overall survival analysis, we computed the median survival times from the Kaplan–Meier curves. To obtain a significance test, we fit a parametric survival regression model that assumed an exponential survival distribution and obtained the median survival times using post-fit marginal estimation (the predicted median time to event) and compared them using a post-fit Wald test.
To confirm that follow-up time bias was not present, we compared the follow-up times between S and NS, which is different than time to event. Reporting average follow-up time as a separate variable is problematic, since follow-up time to an event, follow-up time to censoring, and follow-up time with events and censored observations combined are all highly influenced by the time to event, and so are biased estimates of follow-up time [11]. To avoid a biased estimate, the median follow-up times for the smoker and never smoker groups were estimated using the Kaplan–Meier estimate of potential follow-up (KM-PF), which is Method 5 described by Schemper and Smith [11]. This method uses the censoring event as the outcome in place of the event itself, then fits a parametric survival regression, followed by using post-fit marginal estimation to obtain the median times to censoring, and finally compares these estimates with a post-fit Wald test. For a deceased patient, the unobservable follow-up time is interpreted as the follow-up time that potentially would have occurred if the patient had not died. Statistical analyses were performed using R version 4.3.1.
Results
Clinical characteristics
We evaluated 155 patients with NSCLC over 10 years. Of these, 56.8% (88/155) were S. S were older (69- vs 62-year-old; p < 0.001) and more often male (58% (90/155); p = 0.002). The proportion of females and males significantly differed by smoking status, indicating a gender bias toward smoking habits. Otherwise, the S and NS groups had similar clinical characteristics (Table 1). A majority of patients did not have COPD, including both the S (52%) (42/88) and NS groups (99%) (1/67) (p < 0.001). Of the 88 S, mean pack years was 43 ± 33 years, and only 17% (15/88) were current smokers at the time of initial NSCLC diagnosis.
Our study included 60% symptomatic and 35.5% asymptomatic patients (remaining 4.5% had symptoms not reported). The largest ethnic group in our study was white (85%) (132/155). Only 9.7% of patients had a family history of lung cancer. The indication for chest CT was most commonly to evaluate a pulmonary nodule previously identified on prior imaging, followed by “abnormal chest radiography,” and patients complaining of respiratory symptoms.
In each of the multivariable models, all variables in Table 1 were initially considered as potential confounding variables. Only the variables female sex, age in years, and history of chronic kidney disease had a p < 0.20, so the initial multivariable models included all 3. History of obstructive pulmonary disease (COPD) was not included in the model, due to collinearity with the smoker variable. All of the potential confounding variables dropped out of the models using iterative backwards variable selection, all being non-significant, so the multivariable models were identical to the univariable model that included only smoker as the predictor variable. This occurred in every model fitted. The median follow-up times were similar between S and NS, both for the overall survival and 12-month progression-free survival outcomes (Table 2).
Imaging and pathology findings
Patients in S and NS groups more commonly had no underlying parenchymal lung disease (65%) at initial staging CT or PET/CT (Additional file 1: Fig. S1). Nodule/mass morphology on CT was solid (91.6%), subsolid (7.7%), and nonsolid or ground glass (0.7%). Solid nodules/masses were most commonly adenocarcinoma followed by squamous subtype (66% and 35%, respectively). Subsolid and ground glass nodules/masses were exclusively adenocarcinoma. The smallest tumor was 11 mm and the largest was 143 mm (greatest dimension). Mean tumor size in NS was 77 mm vs 76 mm in S (p = 0.81). Only 4.5% of tumors contained calcifications, predominantly those with adenocarcinoma followed by the squamous subtype. Nodules/masses with suspicious morphology were as follows: 27% spiculated margins or partially spiculated margin, 30% lobulated margin, 9% cystic/cavitary, 3% part solid nodules, and 3% partially lobulated margin. Spiculated nodules/masses were predominantly adenocarcinoma (66.6%), followed by the squamous subtype (28%). Partially spiculated nodules/masses were more commonly associated with the adenocarcinoma subtype (74%). The majority of lobulated and partially lobulated nodules/masses were adenocarcinoma (59%). Nodules/masses with cystic/cavitary components were predominantly squamous subtype (51.8%) (Table 2, Additional file 1: Fig. S2). Missing data due to unavailable outside chest CT imaging for three NS patients.
Nodules/masses in S were more commonly multiple (55.7%), solid (92%), and lobulated or spiculated (50% and 46.6%, respectively). S nodules/masses frequently invaded adjacent structures (73.9%) on imaging and pathology. Nodules/masses in NS were multiple (56.7%), solid (83.6%), and spiculated or lobulated (55.2% and 49.3%, respectively), also frequently invaded adjacent structures (71.6%). A large majority of tumors in NS were adenocarcinoma (77.9%) versus an even split of adenocarcinoma and squamous cell carcinoma in S (49.4% and 43.7%, respectively). Only one patient had large cell type, and she was a never-smoker. Nearly equal numbers of S (6.9%) and NS (5.9%) had poorly differentiated carcinoma (Table 3).
Table 3.
Radiology-pathology correlation of NSCLC nodules at initial staging

Tumor location was most commonly in the RUL (30.2%), followed by RLL (28.9%), and LUL (19.7%). The least common location was the lingula (2%). NS more commonly had tumors in the RLL (35.8%), with S in the RUL ((34%); p = 0.11). Adenocarcinoma nodules most commonly were in the RLL (29.5%) followed by the RUL (27.3%). Squamous tumors most commonly were in the RUL (42.9%), followed by the RLL (26.5%).
Nearly all malignant nodules/masses showed FDG-avidity on PET/CT. However, 0.6% of adenocarcinoma subtype did not show increased FDG activity. Adenocarcinoma was the most common subtype on surgical histopathology analysis. Both S and NS had similar rates of lymphovascular invasion (p = 0.84). All patients with local–regional and distant metastases had lymphovascular invasion. Tumors invading adjacent structures on CT were not always associated with enlarged mediastinal or hilar lymph nodes or extrathoracic metastases on staging. Locations of metastases at staging were most commonly ipsilateral/contralateral lung, mediastinal or ipsilateral/contralateral lymph nodes, followed by distant lymph nodes. Excluding lung and lymph nodes, the most common distant metastases locations were, in descending order, bone, brain, adrenals, and liver (Table 4).
Table 4.
Location of nodules and metastases on imaging at initial staging. Relationship of metastatic disease with lymphovascular invasion

RUL right upper lobe, RLL right lower lobe, LUL left upper lobe, NSCLC non-small cell lung cancer
Initial staging
NS was more often initially diagnosed with stage IV disease (p = 0.046), positive nodal disease (p = 0.002), and metastatic disease (p = 0.004) compared to S. S are more commonly diagnosed at TNM stage T1 and AJCC stage I and III compared with NS (Table 5).
Table 5.
Comparison of AJCC TNM stages by smoking status
| Ever-smoker | Never-smoker | ||
|---|---|---|---|
| TNM stage | N (%) | N (%) | p value |
| All patients | 88 | 67 | |
| T-stage | 0.054 | ||
| T1a | 4 (4.5) | 1 (1.5) | |
| T1b | 13 (14.8) | 11 (16.4) | |
| T1c | 7 (8.0) | 2 (3.0) | |
| T2 | 2 (2.3) | 8 (11.9) | |
| T2a | 14 (15.9) | 12 (17.9) | |
| T2b | 10 (11.4) | 5 (7.5) | |
| T3 | 14 (15.9) | 9 (13.4) | |
| T4 | 24 (27.3) | 19 (28.4) | |
| N-stage | 0.002 | ||
| N0 | 46 (52.3) | 25 (37.3) | |
| N1 | 10 (11.4) | 15 (22.4) | |
| N2 | 16 (18.2) | 20 (29.9) | |
| N3 | 16 (18.2) | 7 (10.4) | |
| M-stage | 0.004 | ||
| M0 | 57 (46.8) | 33 (49.3) | |
| M1 | 3 (3.4) | 0 (0) | |
| M1a | 10 (11.4) | 9 (13.4) | |
| M1b | 5 (5.7) | 9 (13.4) | |
| M1c | 11 (12.5) | 16 (23.9) | |
| M2 | 2 (2.3) | 0 (0) | |
| AJCC 8th Edition stage | 0.046 | ||
| IA | 1 (1.1) | 0 (0) | |
| IA1 | 2 (2.3) | 0 (0) | |
| IA2 | 12 (13.6) | 8 (11.9) | |
| IA3 | 3 (3.4) | 0 (0) | |
| IB | 10 (11.4) | 3 (4.5) | |
| IIA | 5 (5.7) | 2 (3.0) | |
| IIB | 4 (4.5) | 7 (10.4) | |
| IIIA | 10 (11.4) | 5 (7.5) | |
| IIIB | 7 (8.0) | 3 (4.5) | |
| IIIC | 4 (4.5) | 1 (1.5) | |
| IVA | 14 (15.9) | 19 (28.4) | |
| IVB | 16 (18.2) | 19 (28.4) | |
Boldface values indicate statistical significance
Clinical outcomes and follow-up
The collective mortality rate for our NSCLC patients over a 3-year period was 47% with NSCLC being the primary cause of death in most. S had nearly double the risk of all-cause mortality (worse overall survival) in the first 5 years following biopsy (HR = 1.73, 95% CI: 0.99 to 3.02, p = 0.056) (Table 6), as well as in the first 10 years (HR = 1.77, 95% CI: 1.10 to 2.82, p = 0.02) (Table 6 and Fig. 2). The median survival time for NS was 6.6 years or 79.2 months (95% CI: 4.2 to 9.0) and for S was 3.9 years or 46.8 months (95% CI: 2.7 to 5.0), with NS surviving 2.7 years longer on average (95% CI: 0.1 to 5.4) (p = 0.045) (Table 7). A 1-year increase in risk, however, was not demonstrated (HR = 1.06, 95% CI: 0.45 to 2.51, p = 0.90) (Table 6 and Fig. 3).
Table 6.
Primary outcome variables regression models (n = 155)
| Outcome variable | Regression modela | Relative riskb (ever-smoker (S):never-smoker (NS)) |
|---|---|---|
| 10-year all-cause mortality |
Deaths: S: 44/88 (50%) NS: 29/67 (43%) |
|
| Cox | HR = 1.77, 95% CI (1.10, 2.86), p = 0.02 | |
| 5-year all-cause mortality |
Deaths: S: 35/88 (40%) NS: 19/67 (28%) |
|
| Cox | HR = 1.73, 95% CI (0.99, 3.02), p = 0.056 | |
| 1-year all-cause mortality |
Deaths: S: 12/88 (14%) NS: 9/67 (13%) |
|
| Cox | HR = 1.06, 95% CI (0.45, 2.51), p = 0.90 | |
| 12-month disease progression |
Disease progression or death S: 37/88 (42%) NS: 23/67 (34%) |
|
| Cox | HR = 1.33, 95% CI (0.79, 2.25), p = 0.28 | |
| 12-month disease progression |
Disease progression or death rates (cases/person months) S: 37/897 (0.04) NS: 23/730 (0.03) |
|
| Poisson | RR = 1.31, 95% CI (0.78, 2.20), p = 0.31 |
aIn each multivariable model, the potential confounders (sex, age in years, and history of chronic kidney disease) all dropped out, leaving just smoking status, so multivariable and univariable models are identical
bHazard ratio (HR), rate ratio (RR) modeling cases/(person-time)—both are estimates of relative risk
Fig. 2.
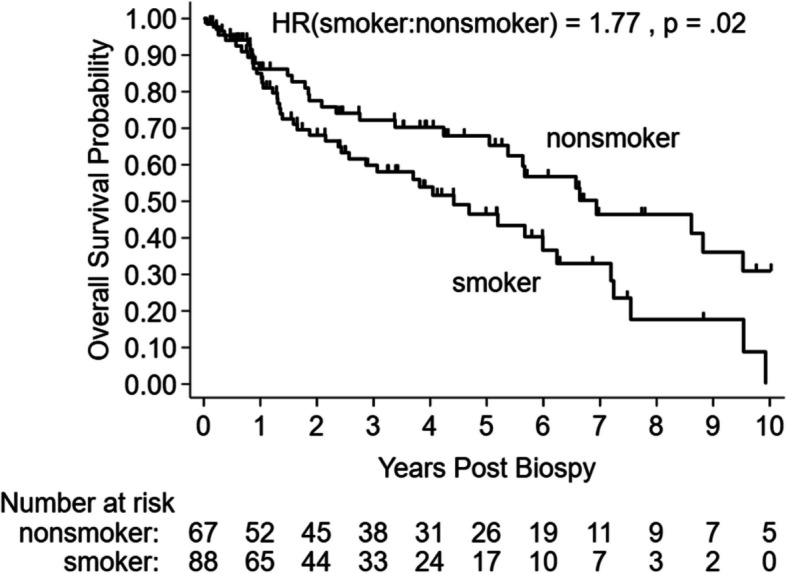
Overall survival (absence of all-cause mortality) Kaplan–Meier graph. The 10-year hazard ratio (HR) and p value are from a Cox regression with all-cause mortality as the outcome variable. Tick marks on the survival curves represent censoring events (time points where at least one patient was lost to follow-up)
Table 7.
Median survival times for 10-year overall survival
| Source | Never-smokers median survival timea [n = 67] | Ever-smokers median survival time [n = 88] | Difference |
|---|---|---|---|
| Kaplan–Meier estimates |
6.9 years 95% CI (5.4, 9.5) |
4.4 years 95% CI (2.6, 6.2) |
2.5 years |
| Parametric survival time regression |
6.6 years 95% CI (4.2, 9.0) |
3.9 years 95% CI (2.7, 5.0) |
2.7 years 95% CI (0.1, 5.4) p = 0.045 |
aThe median survival time is the follow-up time (X axis) value corresponding to the 0.50 or 50% survival probability (Y axis) on the Kaplan–Meier curve. It is the predicted median time to death event from the parametric survival time regression models that assumes an exponential survival distribution
Fig. 3.
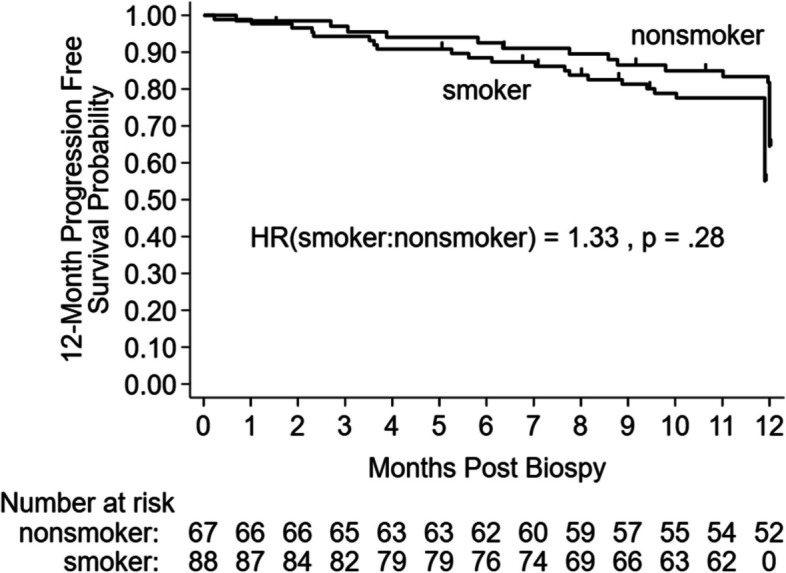
12-month progression-free survival (absence of disease progression or death at the 12-month time point) Kaplan-Meier graph. The 1-year hazard ratio (HR) and p value are from a Cox regression with the composite score (disease progression or death) as the outcome variable. Tick marks on the survival curves represent censoring events (time points where at least one patient was lost to follow-up). A loss-to-follow-up occurred if the patient’s last visit was before 12 months. The drop in the graph at 12 months is due to patients still in a state of disease progression at the 12-month time point (a small amount of jitter was added so the lines are distinguishable at the 12-month time point)
S had a non-significant slight trend of increased prevalence of disease progression at 12 months (worse 12-month progression-free survival) (Poisson regression rate ratio = 1.31, 95% CI: 0.78 to 2.20, p = 0.31), with a similar non-significant slight trend when modeled with Cox regression (HR = 1.33, 95% CI: 0.79 to 2.25, p = 0.28) (Table 6 and Fig. 3).
Cause of death in the NS cohort was 23/29 (79.3%), 4/29 (13.8%), 1/29 (3.4%), and 1/29 (3.4%), respectively, for NSCLC-related, cancer other than NSCLC, noncancer-related, and unknown cause. For the S cohort, respective cause of death according to these same four categories was 35/44 (79.5%), 3/44 (6.8%), 5/44 (11.4%), and 1/44 (2.3%).
Discussion
Our study was performed to determine if any significant differences between NS and S exist regarding chest CT imaging findings, initial staging, location of metastatic disease, and outcomes, including all-cause mortality and 12-month progression-free survival. Our most critical finding was a similar poor prognosis for both S and NS with NSCLC. The collective mortality rate for our NSCLC patients over a 3-year period was 47% with NSCLC being the primary cause of death in most. Data from the Surveillance, Epidemiology, and End Results (SEER) database report a 5-year OS of 44.9% [12].
The two groups were well-matched in a variety of clinical variables save for age, sex, and COPD. However, despite the health advantages provided by younger age, female sex, and healthy underlying lung parenchyma in the NS group, smoking status had no significant difference in all-cause mortality at 1-year and 12-month progression-free survival outcomes. However, there was a significant divergence in overall survival outcomes after 1 year, with S having nearly double the risk of NS for all-cause mortality at 5-year and 10-year follow-up. Similar findings were noted in a 2021 Cleveland Clinic study of stage I S vs NS NSCLC patients undergoing primary resection of NSCLC [13]. Also, we found the median survival time for NS was 2.7 years longer on average than S. The median survival time of 46.8 months for our S cohort was very similar to the SEER database median survival time of 48.5 months [12].
Smoking status significantly affects disease-free survival in NSCLC patients [14]. In the USA, tobacco use, in the form of cigarette smoking, is the leading preventable cause of cancer and cancer death, and smoking cessation reduces the risk over time and can improve overall survival in NSCLS patients [15, 16]. In NS, the proportion of lung cancer deaths is increasing [17]. Studies show that compared to NS, the risk may remain elevated for close to 30 years [8]. In a study including patients from the USA, China, South Korea, UK, and Australia, an estimated 2.2 million new lung cancer cases and 1.8 million lung cancer-related deaths occurred in 2020 [8]. Studies showed life expectancy of 6 years from initial diagnosis, and 5-year mortality rate of 70.6% in NSCLC patients [8].
Only 60% of the NSCLC patients in our study were symptomatic. This suggests that many lung cancers were incidental discoveries. Other investigators have found that most patients with symptoms have advanced disease, and symptoms result from the primary tumor invading adjacent structures and/or causing obstruction, metastases, or systemic manifestations including paraneoplastic syndromes [2, 4]. The most common indication for chest CT leading to the diagnosis of NSCLC in our study was a pulmonary nodule identified on prior imaging study. Some patients in the S cohort had low-dose lung cancer screening CT (LDCT) beginning in 2013–2014, which ultimately led to their NSCLC diagnosis. This may have contributed to a majority of S being diagnosed at stage IIIA or lower. These findings add to the preponderance of evidence supporting the utility of the LDCT program [18]. Additional investigation of why S had lower stage disease at initial diagnosis compared with NS and the potential influence of LDCT is needed.
Unfortunately, no such screening program exists for NS, which might explain why most NS patients in our study were diagnosed at stage IIIA or higher. NS patients were more likely to have metastatic adenopathy, distant metastases, and more extrathoracic metastases at initial diagnosis compared to S. Our findings differ from what was reported in a single study of patients in China with predominantly adenocarcinoma [19]. The difference likely relates to their using a cohort of patients undergoing surgical lung resection, with a bias toward lower stage tumors. We had no such bias, including all patients diagnosed with NSCLC during a predetermined study period. The literature is mixed on the survival advantage of NS vs S, probably also related, in part, to these differences in study patient selection [16, 20, 21]. Additional investigation of this phenomenon is needed.
Regarding imaging and histopathological findings, mean tumor size, morphology, and suspicious nodule characteristics were similar for S and NS. Most patients in both groups had no underlying parenchymal lung disease and most tumors were solid in density. NS more commonly had tumors involving the RLL, with S more commonly in the RUL. Similar findings were reported in the Cleveland Clinic study [13]. Also, in keeping with the current literature, adenocarcinoma was the most common tumor cell type [22].
Several strengths exist in our study. First, the study sample is representative of the general patient population in our region. Unlike prior studies comparing S vs NS, our cohort is not limited to patients who underwent surgical tumor resection. These studies have a limiting selection bias that is predicated upon the staging requirements needed to meet surgical management. This results in the exclusion of nearly all patients with M1 disease [19, 20]. Second, our study includes a long follow-up period. Finally, we included detailed radiology-pathology correlation with clinical outcomes. This may prove useful in developing deep learning algorithms for decision-making algorithms, radiological diagnosis, and prognosis.
We are aware of a few potential limitations of our study. We did not have data regarding potential radon and secondhand smoke exposure. Radon emits alpha ionizing radiation and is the primary risk factor for lung cancer in NS [23]. The International Agency for Research on Cancer (IARC, part of the World Health Organization—WHO) lists a number of potentially carcinogenic substances that may contribute to NSCLC in NS [24]. Unfortunately, this information was not available in our electronic health record. Also, a small number of patients were lost to follow-up after 1 year (n = 2). Assessment of NSCLC treatment was not performed as part of this study. Understanding why, despite being diagnosed at an earlier stage, S have a worse long-term prognosis will be an important follow-up study. This may have to do with the use of targeted drugs in NS patients who were more often diagnosed at stage IIIA or higher. Our study does not address this question. Finally, the retrospective nature of this study may introduce various forms of bias including selection and measurement bias. The electronic medical record used for this study may have included data with nonrandom variation. We sought to avoid potential bias by using predefined inclusion and exclusion criteria and multiple different researchers collecting data, with repeat data collection for 10% of the patients to minimize selection biases.
Conclusions
NS more often had metastatic adenopathy, distant metastases, and stage IV disease at initial biopsy. Despite similar 12-month progression-free survival and 1-year all-cause mortality rates, smokers had nearly double the risk of mortality in the first 5 and 10 years post-diagnosis. Nodule features on chest CT were similar in never-smokers and ever-smokers.
Understanding and correlating clinical and imaging features of NSCLC in never-smokers may help develop artificial intelligence algorithms for improved patient management and prognosis. This information is useful in diagnosing and staging NSCLC in never-smokers, and to direct future research to understand why never-smokers develop NSCLC, have worse initial staging, but have similar progression-free survival and overall survival rates with smokers at 1-year follow-up and better 5-year and 10-year survival rates.
Acknowledgements
This investigation was supported by the Study Design and Biostatistics Center (SDBC), with funding in part from the National Center for Advancing Translational Sciences of the National Institutes of Health under Award Number UM1TR004409. The content is solely the responsibility of the authors and does not necessarily represent the official views of the National Institutes of Health.
Abbreviations
- NS
Non/never-smokers
- S
Ever-smokers
- NSCLC
Non-small cell lung cancer
- SCLC
Small cell lung cancer
- CT
Computed tomography
- LDCT
Low-dose chest CT
- MRI
Magnetic resonance imaging
- PET
Positron emission tomography
- 18-FDG
18-Fluorodeoxyglucose
- RUL
Right upper lobe
- RML
Right middle lobe
- RLL
Right lower lobe
- LUL
Left upper lobe
- LLL
Left lower lobe
Authors’ Contribution
JRB- substantial contributions to the conception and design of the work; the acquisition, analysis, and interpretation of data; statistical analysis; drafted the work, revision NQ-substantial contributions to analysis and interpretation of data; drafted the work, revision GS- substantial contributions to statistical analysis, draft and revision AJ- substantial contributions to statistical analysis PSA-substantial contributions to data collection, analysis LW- substantial contributions to data collection, analysis AN- substantial contributions to data collection, analysis MRC- substantial contributions to data collection, analysis RE- substantial contributions to revision JC- substantial contributions to revision IK-substantial contributions to analysis, drafting the work and revision -All authors read and approved the final manuscript
Funding
Study Design and Biostatistics Center (SDBC), with funding in part from the National Center for Advancing Translational Sciences of the National Institutes of Health under Award Number UM1TR004409.
Data availability
The datasets used and/or analyzed during the current study are available from the corresponding author on reasonable request.
Declarations
Ethics approval and consent to participate
The need for patient consent to participate was waived by the IRB. This study protocol was reviewed by our institution and followed our institutional guidelines to obtain IRB approval (ID# 00105708).
Consent for publication
Not applicable.
Competing interests
The authors declare no competing interests.
Footnotes
Publisher’s Note
Springer Nature remains neutral with regard to jurisdictional claims in published maps and institutional affiliations.
References
- 1.Zheng Y, Dong J, Yang X, Shuai P, Li Y, Li H, et al. Benign-malignant classification of pulmonary nodules by low-dose spiral computerized tomography and clinical data with machine learning in opportunistic screening. Cancer Med. 2023;12(11):12050–64. [DOI] [PMC free article] [PubMed] [Google Scholar]
- 2.Pretreatment evaluation of non-small-cell lung cancer. The American Thoracic Society and The European Respiratory Society. Am J Respir Crit Care Med. 1997;156(1):320–32. [DOI] [PubMed] [Google Scholar]
- 3.Mariotto AB, Yabroff KR, Shao Y, Feuer EJ, Brown ML. Projections of the Cost of Cancer Care in the United States: 2010–2020, JNCI: J Natl Cancer Inst. 2011;103(2):117–28. 10.1093/jnci/djq495. [DOI] [PMC free article] [PubMed]
- 4.Rami-Porta R, Ball D, Crowley J, Giroux DJ, Jett J, Travis WD, et al. The IASLC Lung Cancer Staging Project: proposals for the revision of the T descriptors in the forthcoming (seventh) edition of the TNM classification for lung cancer. J Thorac Oncol. 2007;2(7):593–602. [DOI] [PubMed] [Google Scholar]
- 5.Boland GW, Dwamena BA, Jagtiani Sangwaiya M, Goehler AG, Blake MA, Hahn PF, et al. Characterization of adrenal masses by using FDG PET: a systematic review and meta-analysis of diagnostic test performance. Radiology. 2011;259(1):117–26. [DOI] [PubMed] [Google Scholar]
- 6.Kargar S, Ansari-Moghaddam A. Prevalence of cigarette and waterpipe smoking and associated cancer incidence among adults in the Middle East. East Mediterr Health J. 2023;29(9):749–56. [DOI] [PubMed] [Google Scholar]
- 7.Reck M, Dettmer S, Kauczor HU, Kaaks R, Reinmuth N, Vogel-Claussen J. Lung cancer screening with low-dose computed tomography. Dtsch Arztebl Int. 2023;120(23):387–92. [DOI] [PMC free article] [PubMed] [Google Scholar]
- 8.Kondo KK, Rahman B, Ayers CK, Relevo R, Griffin JC, Halpern MT. Lung cancer diagnosis and mortality beyond 15 years since quit in individuals with a 20+ pack-year history: a systematic review. CA Cancer J Clin. 2024;74(1):84–114. [DOI] [PubMed] [Google Scholar]
- 9.Eisenhauer EA, Therasse P, Bogaerts J, Schwartz LH, Sargent D, Ford R, et al. New response evaluation criteria in solid tumours: revised RECIST guideline (version 1.1). Eur J Cancer. 2009;45(2):228–47. [DOI] [PubMed] [Google Scholar]
- 10.Maldonado G, Greenland S. Simulation study of confounder-selection strategies. Am J Epidemiol. 1993;138(11):923–36. [DOI] [PubMed] [Google Scholar]
- 11.Schemper M, Smith TL. A note on quantifying follow-up in studies of failure time. Control Clin Trials. 1996;17(4):343–6. [DOI] [PubMed] [Google Scholar]
- 12.Donington J, Hu X, Zhang S, Song Y, Arunachalam A, Chirovsky D, et al. Real-world neoadjuvant treatment patterns and outcomes in resected non-small-cell lung cancer. Clin Lung Cancer. 2024;25(5):440–8. [DOI] [PubMed] [Google Scholar]
- 13.Tang A, Ahmad U, Toth AJ, Bourdakos N, Raja S, Raymond DP, et al. Non-small cell lung cancer in never- and ever-smokers: is it the same disease? J Thorac Cardiovasc Surg. 2021;161(6):1903-17 e9. [DOI] [PMC free article] [PubMed] [Google Scholar]
- 14.Herbst RS, Morgensztern D, Boshoff C. The biology and management of non-small cell lung cancer. Nature. 2018;553(7689):446–54. [DOI] [PubMed] [Google Scholar]
- 15.Fares AF, Li Y, Jiang M, Brown MC, Lam ACL, Aggarwal R, et al. Association between duration of smoking abstinence before non-small-cell lung cancer diagnosis and survival: a retrospective, pooled analysis of cohort studies. Lancet Public Health. 2023;8(9):e691–700. [DOI] [PMC free article] [PubMed] [Google Scholar]
- 16.Subramanian J, Govindan R. Lung cancer in never smokers: a review. J Clin Oncol. 2007;25(5):561–70. [DOI] [PubMed] [Google Scholar]
- 17.Carroll NM, Burnett-Hartman AN, Rendle KA, Neslund-Dudas CM, Greenlee RT, Honda SA, et al. Smoking status and the association between patient-level factors and survival among lung cancer patients. J Natl Cancer Inst. 2023;115(8):937–48. [DOI] [PMC free article] [PubMed] [Google Scholar]
- 18.Amicizia D, Piazza MF, Marchini F, Astengo M, Grammatico F, Battaglini A, et al. Systematic review of lung cancer screening: advancements and strategies for implementation. Healthcare (Basel). 2023;11(14):2085. [DOI] [PMC free article] [PubMed]
- 19.Shan L, Zhang L, Zhu X, Wang Z, Fang S, Lin J, et al. Chinese never smokers with adenocarcinoma of the lung are younger and have fewer lymph node metastases than smokers. Respir Res. 2022;23(1):293. [DOI] [PMC free article] [PubMed] [Google Scholar]
- 20.Tang A, Ahmad U, Toth AJ, Bourdakos N, Raja S, Raymond DP, et al. Non-small cell lung cancer in never- and ever-smokers: is it the same disease? J Thorac Cardiovasc Surg. 2021;161(6):1903-17.e9. [DOI] [PMC free article] [PubMed] [Google Scholar]
- 21.Scagliotti GV, Longo M, Novello S. Nonsmall cell lung cancer in never smokers. Curr Opin Oncol. 2009;21(2):99–104. [DOI] [PubMed] [Google Scholar]
- 22.Molina JR, Yang P, Cassivi SD, Schild SE, Adjei AA. Non-small cell lung cancer: epidemiology, risk factors, treatment, and survivorship. Mayo Clin Proc. 2008;83(5):584–94. [DOI] [PMC free article] [PubMed] [Google Scholar]
- 23.Riudavets M, Garcia de Herreros M, Besse B, Mezquita L. Radon and lung cancer: current trends and future perspectives. Cancers (Basel). 2022;14(13):3142. [DOI] [PMC free article] [PubMed]
- 24.IARC Working Group on the Evaluation of Carcinogenic Risks to Humans. Arsenic, metals, fibres, and dusts. IARC Monogr Eval Carcinog Risks Hum. 2012;100(Pt C):11–465. [PMC free article] [PubMed] [Google Scholar]
Associated Data
This section collects any data citations, data availability statements, or supplementary materials included in this article.
Data Availability Statement
The datasets used and/or analyzed during the current study are available from the corresponding author on reasonable request.