

ABSTRACT
Thermogravimetry coupled with simultaneous evolved gas analysis by mass spectrometry was used for discerning organic compounds released during the thermal degradation of paint whose chemical compositions are not readily accessible. Thermogravimetric analyses up to 600°C revealed distinct degradation patterns under inert and oxidative conditions. Significant degradation of paint initiates at around 360°C and concludes at 500°C in a nitrogen atmosphere. However, under oxidative conditions, degradation began at 100°C, with notable mass loss extending from 300 to 600°C, with a distinct event at 500°C. Moreover, the overall mass loss in air has been observed to be 3% higher than that in nitrogen. The rapid characterization of the volatiles was made possible by model‐free target factor analyses of evolved gas mass spectra. The temperature‐correlated mass analyses revealed potential volatile sources, including structural breakdown and oxidative conversion. Comparative analyses revealed predominantly oxidative conversion of organics to CO2 during degradation in air. The evolution of several classes of organics during the thermal degradation of paint is a matter of great concern for postulated accident scenarios in nuclear power plants. The low molecular weight organic volatiles may be taken up by iodine aerosols released into the containment during an accident, potentially forming organic iodides, which are biological hazards. Thus, identifying these volatile organics is crucial for accurately estimating the source term of volatile organic iodine.
Keywords: epoxy paint | mass spectrometry | paint degradation | target factor analysis | thermogravimetric analysis | volatiles
1. Introduction
Epoxy paints have found widespread use due to their high adhesion, corrosion resistance and thermal stability [1, 2]. These properties make them excellent choices for coatings on metallic surfaces in harsh environments particularly in space and nuclear facilities. Epoxy paints are mostly based on diglycidyl ether of Bisphenol A and are cured with various hardeners, such as amines, amides, and alcohols [3]. Additionally, they may include mineral whiteners, pigments, solvents, plasticizers and other additives for adhesion, preservation and stability. Due to the strong proprietary interest in the complex formulation of individual varieties of paints, only limited information on their formulations is available. With particular reference to containments of nuclear plants, under normal operations, paint undergoes natural ageing, during which it is exposed to substantially elevated temperatures (∼80°C), high humidity and low radiation doses for prolonged periods (12–18 months) [4]. However, during reactor accidents, the painted surfaces inside nuclear containments may undergo accelerated ageing due to the very high temperature and radiation doses (104 Gy/h) [5]. The volatiles released during the degradation of paint may provide the organics necessary for the formation of volatile organic iodides inside the containment [6, 7, 8]. The various chemical compounds present in the paint and their degradation products will therefore determine the speciation of the organic iodides thus formed which is vital for accurate estimation of iodine source term [4]. Therefore, it is necessary to have tentative information on the various classes of compounds that may be released under such conditions. Traditional analytical methods, such as pyrolysis gas chromatography‐mass spectrometry (GC‐MS), provide valuable information on volatile components [9]. However, they often fail to capture crucial details about temperature‐resolved evolution. Alternatively, thermogravimetry (TG) coupled with MS, that is, TG‐MS enables real‐time detection of evolved gases. This combined TG‐MS method enables the correlation of changes in mass with heat effects and identifies the types of volatiles released during thermal degradation [10, 11, 12].
In this work, we have investigated the thermal degradation of paint by TG‐MS. To correlate the evolved chemical species with the associated thermal events, the degradation of paint under an oxidising atmosphere (air) was compared with an inert (nitrogen) atmosphere. Simultaneous identification and determination of the evolution profile of each individual component from the accumulated mass spectra of the evolved gas containing several co‐eluting chemical compounds is cumbersome and challenging. To this end, a model‐free analytical method based on multivariate target factor analysis (TFA) has been employed to identify the individual chemical compounds as well as to predict their evolution profiles over the entire temperature range. The combined TG‐MS‐TFA method presented in this work provides a deeper understanding of the thermal degradation behaviour of complex polymers, such as paints whose chemical compositions are not readily available.
2. Material and Methods
2.1. Paint Sample Preparation
The paint sample was obtained in the form of its individual liquid components, “hardener” and “resin”. The “hardener” and “resin” were mixed in equal volumes; the mixture was applied on the surface of glass slides. The painted glass slides were left to cure in a dust‐free atmosphere at room temperature. Dried paint samples were collected by scraping the glass slides and analysed by TG‐MS. Details on spectroscopic characterisations on resin, hardener and paint can be found in Supporting Information.
2.2. Experimental: TG‐MS
Thermogravimetric analysis (TGA) was performed using Linesis STA PT1600. The evolved gas was analysed by Pfeiffer Vacuum Thermostar GSD 320 single quadrupole mass spectrometer coupled to TGA. Paint samples weighing 20 ± 2 mg were placed in an alumina crucible (inner diameter 4 mm, volume 180 µL) and heated under the following temperature programme: isothermal hold for 2 min at 30°C; heat from 30 to 600°C at a rate of 10°C/min; isothermal hold for 1 min at 600°C. The atmosphere surrounding the samples was controlled using a continuous purge gas flow of 50 mL/min. The gaseous products were introduced into the mass spectrometer using a Thermostar, quartz, 1 m long, 2 mm internal diameter gas sampling line maintained at 150°C to prevent the condensation of the evolved gas vapours during analysis. The mass spectrometer was set to scan between 2 and 251 amu and was operated in electron impact (EI) mode at 70 eV. The resolution was 1 amu. Each scan lasted 50 ms. This gave a total of 68,400 scans in 57 min of the MS data collection period. Repeatability was determined by performing three repeats of the TGA‐MS analysis on each sample. The data gathered by the mass spectrometer were processed off‐line with in‐house developed multivariate TFA coded in MATLAB [13].
2.3. Target Factor Analysis
The real‐time mass spectra of the gas released during the thermal degradation of paint can be represented as a data matrix with dimensions . Here, each row is a mass spectrum at a different temperature, and each column is the profile of a specific mass‐to‐charge ratio (m/z) over the temperature range. In the present work, ranges from 30 to 600°C and ranges from 41 to 251 amu. A compound is likely to be present in the evolved gas if its mass spectrum (or target vector ) is present in the spectral vector sub‐space of constituted only by the significant factors. The information deeply embedded within such complex data matrices can be extracted using factor analysis‐based methods.
In factor analysis, the data matrix is decomposed into a product of two matrices, and , where the columns of and rows of respectively represent the evolution profiles and corresponding mass spectra of the significant factors. This can be expressed by Equation (1)
| (1) |
where denotes the number of significant factors involved in the process and represents the associated experimental noise. The decomposition of was performed by the popular and robust singular value decomposition (SVD) algorithm which yielded three matrices, for
| (2) |
the case and is shown in Equation (2). The column matrices and corresponds to eigenvectors spanned over concentration and mass spectral vector space, respectively. The diagonal singular values matrix contains the square root of the corresponding eigenvalues, also known as singular values . The large eigenvalues indicate significant components whereas, the experimental error corresponds to lower . During SVD, the singular values () are arranged in decreasing order. This arrangement ensures that the eigenvectors in and correspond to the most significant factors first, with their significance decreasing afterwards. Due to the presence of experimental noise, there was no clear demarcation between high and low values, making the determination of from such experimental dataset having a very large number of co‐eluting species, challenging. The estimation of were carried out using three different plots of (a) , (b) indicator values (IND) and (c) % significance level (%SL) versus number of factors [14, 15, 16].
After the estimation of , a reduced data matrix with minimal experimental noise was reconstructed from the three decomposed matrices, (Equation (2)) and is shown in Equation (3).
 |
(3) |
The target test was conducted on this reduced data matrix .
Finally, the existence of the target vector in was validated by first calculating the transformation vector to predict the vector belonging to the vector subspace using the linear least‐square fit method as shown in the following sets of Equation (4).
| (4) |
This was followed by calculating the correlation coefficient between and . For a good correlation, will be close to 1 which also indicates the presence of the target vector in the dataset. The corresponding temperature‐dependent evolution profile was calculated by implementing constraints of non‐negative concentration using Equation (5). The superscripts t and + were used to represent transpose and pseudo‐inverse matrices.
| (5) |
3. Results and Discussion
3.1. Thermogravimetric Analyses
The thermal properties of paint are evaluated by comparing the maxima of the derivative of the mass loss curve in different atmospheres. In the nitrogen atmosphere, the TG curve (Figure 1a) shows an overall 47% mass loss in paint samples heated up to 600°C. The derivative thermogravimetric (DTG) curve curve highlights the decomposition occurring in three distinct steps. The first step shows a 2.5% mass loss occurring between 150°C and 250°C, with a maximum degradation rate at 220°C. This is followed by a substantial 30.5% mass loss between 250°C and 400°C, reaching its maximum at 360°C. Finally, there is a 15% mass loss between 400°C and 500°C, with the highest degradation rate observed at 420°C.
FIGURE 1.
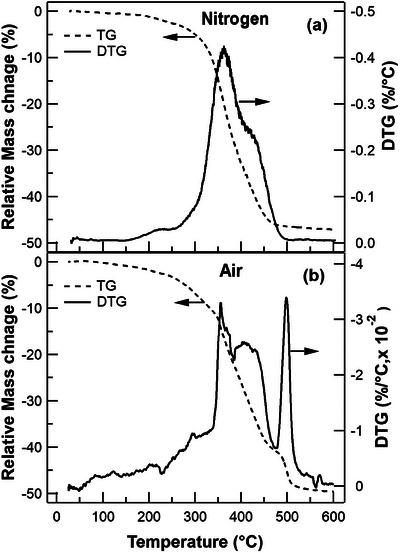
Thermogravimetric (TG) and derivative thermogravimetric (DTG) curve traces of paint sample under (a) nitrogen and (b) air atmosphere.
In the air atmosphere, the TG curve (Figure 1b) indicates an overall 50% mass loss, resulting in a lower residual mass compared to the nitrogen atmosphere. The DTG curve highlights a four‐step degradation process in the oxidative atmosphere. Initially, there is a gradual mass loss of 7% up to 300°C, contrasting with the nitrogen atmosphere, where degradation begins at a higher temperature of 150°C. This is followed by a 15% mass loss between 300 and 380°C, reaching its maximum at 360°C. Subsequently, there is an 18% mass loss between 380 and 470°C, with the highest degradation rate observed at 410°C. Finally, there is a 10% mass loss between 470 and 540°C, peaking at 495°C. Unlike the nitrogen atmosphere, where the degradation steps overlap between 250 and 500°C, the degradation steps in air are more distinct, with an additional step centred at 495°C.
3.2. Evolved Gas Mass Spectral Analyses from Paint Degradation under Nitrogen
Figure 2a shows the evolved gas spectra in the mass range 41–250 amu over the thermal degradation temperature range 30‐600°C. The dataset was subjected to TFA as per the methodology described in Section 2.3. The number of significant factors in this experimental dataset might be in the range 9–11 (Figure 2b–d). The TFA was carried out with 10 significant factors. For target testing, prior knowledge of the chemical composition of paint is necessary.
FIGURE 2.

(a) Two‐dimensional mass spectral data (m/z 41–250) of the evolved gases during thermal degradation of paint up to 600°C under nitrogen, (b) Plot of versus factors, (c) IND versus factors and (d) %SL versus factors for the experimental data shown in (a).
The paint sample used in this study has characteristic vibrations corresponding to aromatic rings, epoxy, phenolic ethers, amides, carbonyls, aliphatic alcohols etc. [17]. Moreover, the presence of epoxy groups in resin and amines in the hardener suggests that the paint is amine‐crosslinked epoxy‐based. As the actual composition of the paint is not accessible (cf. Section 1), a probable list of compounds (Table 1) for target testing is compiled from available literature on the pyrolysis of such epoxy paints [9]. In general, the presence of any target compound in evolved gas can be evaluated by examining their correlation coefficient, . A high value only results when there is significant match between target spectra from the NIST mass spectral (main EI MS) library and predicted spectra from TFA. This is clearly illustrated in Figure 3 for two compounds, phenol (high ‐value) and benzaldehyde (low ‐value). It is to be cautioned that a high cannot be the sole criterion for guaranteeing the presence of the target compound in the experimental data since compounds with low , when “target tested” for a large number of significant factors, can also yield high values. For instance, ethyl benzene has a values of 0.2992 for , but this increases to 0.8938 for . Therefore, it would be prudent to evaluate the presence of any target compound in evolved gas by looking at the trend of while varying the number of significant factors .
TABLE 1.
List of target compounds and molecular weights used for target factor analysis (TFA) of sample datasets.
| Name | Molecular weight | Name | Molecular weight |
|---|---|---|---|
| Acetaldehyde | 44 | 2 (or 3)‐Methyl phenol | 108 |
| Carbon dioxide | 44 | Anisole | 108 |
| Ethylene oxide | 44 | Benzyl alcohol | 108 |
| Ethanol | 46 | 3,5‐Dihydroxy toluene | 124 |
| Acetone | 58 | p‐Methoxy phenol | 124 |
| Acetic acid | 60 | 4‐Isopropyl phenol | 136 |
| Isopropanol | 60 | Isophorone | 138 |
| Methyl ethyl ketone (MEK) | 72 | 2‐Methyl propyl butyrate | 144 |
| Butanol | 74 | Butyl butyrate | 144 |
| Benzene | 78 | Butyl isobutyrate | 144 |
| Toluene | 92 | 2,2,4‐trimethyl‐1,3‐pentanediol | 146 |
| Phenol | 94 | Benzyl acetate | 150 |
| Texanol B | 94 | Benzyl propionate | 164 |
| Methyl isobutyl ketone (MIBK) | 100 | Hexyl butyrate | 172 |
| Diethylenetriamine | 103 | Benzyl butyrate | 178 |
| Benzaldehyde | 106 | Benzyl isobutyrate | 178 |
| Ethyl benzene | 106 | Tetraethylene pentamine | 189 |
| Xylene (o, m, p) | 106 | Bisphenol‐A | 228 |
FIGURE 3.

Comparison of target (NIST) and predicted (after target factor analysis [TFA]) mass spectra for (a) phenol with very high and (b) benzaldehyde with low .
Figure 4 shows the variation in correlation coefficient () values with increasing number of significant factors from 1 to 20.
FIGURE 4.

Plot of correlation coefficient () values versus the number of significant factors, used to test the presence of the target compound in the evolved gas.
It can be clearly seen in Figure 4 that the compounds with a higher probability of presence are clustered into two different regions corresponding to very high and moderately high values. At a threshold of 0.85, one can clearly see the demarcation. The dark‐shaded region in the figure constitutes the zone for a high correlation coefficient in the range of 0.85–1.0 for significant factors between 9 and 11. In this region, for 10 significant factors as inferred from Figure 2b–d, following target compounds have been sorted based on their decreasing values (mentioned in the parenthesis): carbon dioxide (1.0000), ethylene oxide (0.9998), acetaldehyde (0.9992), phenol (0.9953), acetone (0.9882), methyl isobutyl ketone (0.9701), methyl ethyl ketone (0.9634), butanol (0.9604), and 2,2,4‐trimethyl‐1,3‐pentanediol (0.8793). In other words, this is the decreasing order of their probability of presence in the experimental dataset.
These species evolved over the temperature regime of 30–600°C during which the paint undergoes thermal degradation under nitrogen atmosphere. The origin and possible fragmentation pathways for some of the volatiles observed during thermal degradation are shown in Figure 5.
FIGURE 5.

Possible fragmentation pathways during the thermal degradation.
The thermal evolution profile of the compounds sorted based on their decreasing values with a cut‐off of 0.85 is shown in Figure 6.
FIGURE 6.
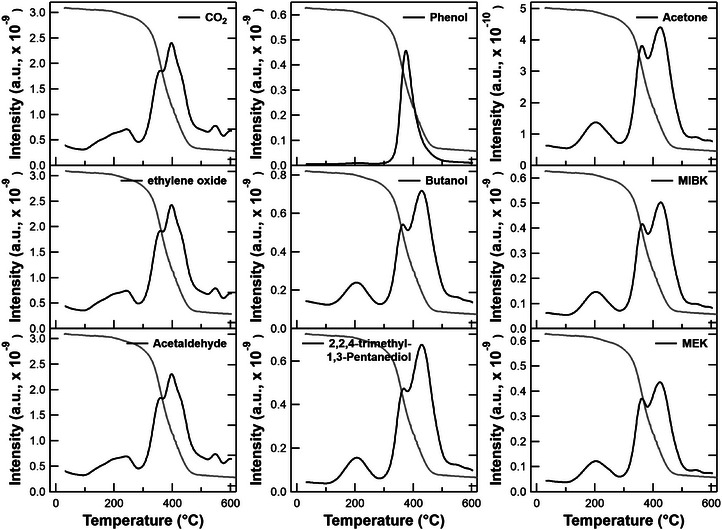
Evolution profile of compounds evolved during thermal degradation of paint in nitrogen atmosphere. Thermogravimetric (TG) trace (grey) of the sample is also shown for correlation purposes.
Most of the compounds evolved as a single band between 200 and 300°C and as two overlapped bands in 300–500°C which was also indicated by the DTG plot (Figure 1a). However, the relative abundance of these compounds in the evolved gas is quite varied as indicated by the intensities. Among these compounds, CO2, ethylene oxide and acetaldehyde are the most abundant. The evolution of these compounds starts from 100°C and gradually continues up to 250°C appearing as a small asymmetric band which is followed by a sharp rise in their evolution profile at 350°C with further increase in evolution at 400°C. The ethylene oxide may originate from the decomposition of unreacted cyclic ether components in resin, one of the constituents of paint. The similarity in the evolution profiles of CO2, ethylene oxide and acetaldehyde may arise from the fact that they share the same major ion peak 44 amu, beyond the mass cut‐off of 41 amu, while performing the TFA. Alcohols constitute another class of compounds in the evolved gas. Phenol, an aromatic alcohol, evolves as a single, narrow band between 300 and 500°C, with a peak at 380°C. This suggests that phenol originates from a singular source. In fact, Fourier‐transform infrared spectroscopy and micro‐Raman studies confirm the presence of aromatic compounds exclusively in the resin (Section S4, Supporting Information), which accounts for the observed evolution profile as a distinct single band. The evolution profiles of aliphatic alcohols, butanol and 2,2,4‐trimethyl‐1,3‐pentanediol show a smaller band at 200°C followed by a bimodal band with the maximum at 420°C. Ketones are another category of compounds present in the evolved gas. The evolution profiles of these ketones, acetone, methyl isobutyl ketone (MIBK) and methyl ethyl ketone (MEK) are similar to aliphatic alcohols, the notable difference being the comparable relative intensities of the two overlapping bands in 300–500°C. The similarity in the evolution profiles for a particular class of compounds in the evolved gas points towards a shared molecular origin.
3.3. Evolved Gas Mass Spectral Analyses from Paint Degradation under Air
The evolved gas mass spectra from the thermal degradation of paint samples under air were also subjected to a similar TFA. At the set threshold value of > 0.85, the identified compounds are carbon dioxide (1.0000), acetaldehyde (0.9998), ethylene oxide (0.9997), acetone (0.9923), ethanol (0.9929), phenol (0.9886), methyl isobutyl ketone (0.9766), methyl ethyl ketone (0.9740), butanol (0.9709), and isopropanol (0.9633).
Compared to the degradation under the nitrogen atmosphere, two new compounds, ethanol and isopropanol were observed while 2,2,4‐trimethyl‐1,3‐pentanediol was absent under the oxidative conditions. Figure 7 shows the evolution profiles of these compounds. Similar to the observations in the nitrogen atmosphere, the evolved gas is abundant in CO2, ethylene oxide and acetaldehyde. However, the intensities in air are ∼3 times higher suggesting increased oxidative conversion of the organics. Further, the CO2 evolution is in accordance with the DTG plot (Figure 1b), characterised by a small event from 30 to 300°C followed by three major events with distinct peaks at 320, 430, and 500°C. The maximum evolution of CO2 took place at 500°C which is higher than a nitrogen atmosphere (350°C), this might be correlated to oxidation of structural organic moieties. The additional compounds, ethanol and isopropanol observed under oxidative conditions having a similar evolution profile as CO2, may arise from oxidative events. Phenol shows a similar evolution profile and maxima under both inert and oxidative conditions, which may also arise due to structural breakdown. Further, the lower intensity (∼1 order) under oxidative conditions can be attributed to the oxidative transformation of phenol. Butanol, on the other hand, shows a small evolution profile at ∼200°C with major evolution taking place at 410°C followed by a new band of comparable intensity at 500°C. The evolution of ketones, acetone, MIBK and MEK show an additional band at 500°C when compared with the nitrogen atmosphere. While both acetone and MIBK have maximum evolution at 420°C, MEK has comparable band evolution intensities at both 420 and 500°C. Moreover, the similar evolution profile of butanol and MEK indicates a common molecular origin. The highlight of the evolution profiles in air is the appearance of a new band at 500°C which is not observed during degradation under nitrogen. The emergence of this band at high temperatures indicates that the major source of these evolved compounds is the structural breakdown of paint during pyrolysis [18].
FIGURE 7.

Evolution profile of compounds evolved during thermal degradation of paint in air. Thermogravimetric (TG) trace (grey) of the sample is also shown for correlation purposes.
These low molecular weight organics can undergo radiolysis under accidental conditions. For example, under gamma irradiation, MEK undergoes radiolysis to form methyl radical which then reacts with I2 to form methyl iodide as shown in Figure 8 [19]. The low molecular weight organic volatiles released due to the thermal degradation of paint during an accident scenario may be taken up by radioactive iodine potentially leading to organic iodides which are biological hazards. Detailed studies are needed to understand the effect of ionising radiation on the formation of organic iodides resulting from these classes of organics, which is beyond the scope of the present study.
FIGURE 8.

Formation of methyl iodide from methyl ethyl ketone (MEK) [19].
4. Conclusion
TG coupled with simultaneous evolved gas analyses by MS has proven to be a powerful tool for identifying the different classes of organics released during the thermal degradation of paint, whose chemical compositions are not easily accessible. Thermogravimetric analysis revealed the stepwise degradation behaviour and corresponding mass loss for each event. In the nitrogen atmosphere, significant paint degradation occurred between 250 and 400°C, concluding by 500°C. Conversely, under oxidative conditions, degradation began at 100°C, with notable mass loss extending from 300 to 600°C and a distinct event at 500°C. The overall mass loss in air was higher, amounting to 3% more than in nitrogen. Real‐time gas analysis using MS captured the thermal evolution profiles of the compounds in a complex 2D data matrix. Model‐free target factor analyses of this complex data enable rapid unveiling of the possible volatiles along with their evolution profiles. During paint degradation in both nitrogen and air, small molecules and aromatic compounds were released. However, fewer compounds were detected in the air compared to nitrogen due to the oxidative transformation of some volatiles into CO2, which resulted in approximately three times higher CO2 intensity. The temperature‐correlated mass analyses of evolved gas profiles shed light on the possible source of volatiles: structural breakdown, and oxidative conversion. The evolution of several classes of organics during thermal degradation of paint, such as aliphatic and aromatic alcohols, ketones, etc. is a matter of great concern in the context of postulated accident scenarios in nuclear power plants [20, 21]. The low molecular weight organic volatiles may be taken up by iodine aerosols released into the containment during accident scenarios. These may potentially lead to organic iodides which are biological hazards. The impact of organics generated from the thermal degradation of paints on the volatile iodine source term during a severe accident needs to be investigated in detail.
Author Contributions
Subhamoy Saha: investigation, methodology, software, formal analysis, and writing–original draft. Ajit N. Shirsat: investigation. V. S. Tripathi: investigation, resources, methodology, and writing–review & editing. Salil Varma: resources, writing–review & editing. P. Mathi: conceptualisation, methodology, formal analysis, and writing–review & editing.
Conflicts of Interest
The authors declare no conflicts of interest.
Supporting information
Supporting Information
Acknowledgements
The authors gratefully acknowledge Dr. Awadhesh Kumar and Dr. A. C. Bhasikuttan for their support and encouragement. The financial support from BARC, Department of Atomic Energy, Government of India, is gratefully acknowledged.
Contributor Information
V. S. Tripathi, Email: vst_apcd@barc.gov.in.
Salil Varma, Email: svarma@barc.gov.in.
Mathi Pandiyathuray, Email: mathip@barc.gov.in.
Data Availability Statement
Data will be made available on reasonable request.
References
- 1. Lee J.‐R., Park S.‐J., Seo M.‐K., Baik Y.‐K., and Lee S.‐K., “A Study on Physicochemical Properties of Epoxy Coating System for Nuclear Power Plants,” Nuclear Engineering and Design 236 (2006): 931–937, 10.1016/j.nucengdes.2005.09.017. [DOI] [Google Scholar]
- 2. Toldy A., Szolnoki B., and Marosi G., “Flame Retardancy of Fibre‐Reinforced Epoxy Resin Composites for Aerospace Applications,” Polymer Degradation and Stability 96 (2011): 371–376, 10.1016/j.polymdegradstab.2010.03.021. [DOI] [Google Scholar]
- 3. Grassie N., Guy M. I., and Tennent N. H., “Degradation of Epoxy Polymers: Part 4—Thermal Degradation of Bisphenol‐A Diglycidyl Ether Cured With Ethylene Diamine,” Polymer Degradation and Stability 14 (1986): 125–137, 10.1016/0141-3910(86)90011-X. [DOI] [Google Scholar]
- 4. Bosland L., Dickinson S., Glowa G. A., et al., “Iodine–Paint Interactions During Nuclear Reactor Severe Accidents,” Annals of Nuclear Energy 74 (2014): 184–199, 10.1016/j.anucene.2014.07.016. [DOI] [Google Scholar]
- 5. King D. B., Beta and Gamma Dose Calculations for PWR and BWR Containments (Washington, DC: Nuclear Regulatory Commission, 1989). [Google Scholar]
- 6. Bosland L. and Colombani J., “Review of the Potential Sources of Organic Iodides in a NPP Containment During a Severe Accident and Remaining Uncertainties,” Annals of Nuclear Energy 140 (2020): 107127, 10.1016/j.anucene.2019.107127. [DOI] [Google Scholar]
- 7. Schwarz M., Hache G., and von der Hardt P., “PHEBUS FP: A Severe Accident Research Programme for Current and Advanced Light Water Reactors,” Nuclear Engineering and Design 187 (1999): 47–69, 10.1016/S0029-5493(98)00257-X. [DOI] [Google Scholar]
- 8. Girault N., Dickinson S., Funke F., Auvinen A., Herranz L., and Krausmann E., “Iodine Behaviour Under LWR Accident Conditions: Lessons Learnt From Analyses of the First Two Phebus FP Tests,” Nuclear Engineering and Design 236 (2006): 1293–1308, 10.1016/j.nucengdes.2005.12.002. [DOI] [Google Scholar]
- 9. Tietze S., Foreman M. R. S. J., Ekberg C. H., and van Dongen B. E., “Identification of the Chemical Inventory of Different Paint Types Applied in Nuclear Facilities,” Journal of Radioanalytical and Nuclear Chemistry 295 (2013): 1981–1999, 10.1007/s10967-012-2190-3. [DOI] [Google Scholar]
- 10. Chang C. and Tackett J. R., “Characterization of Phenolic Resins With Thermogravimetry‐Mass Spectrometry,” Thermochimica Acta 192 (1991): 181–190, 10.1016/0040-6031(91)87160-X. [DOI] [Google Scholar]
- 11. Xu J., Liu C., Qu H., Ma H., Jiao Y., and Xie J., “Investigation on the Thermal Degradation of Flexible Poly(vinyl chloride) Filled With Ferrites as Flame Retardant and Smoke Suppressant Using TGA–FTIR and TGA–MS,” Polymer Degradation and Stability 98 (2013): 1506–1514, 10.1016/j.polymdegradstab.2013.04.016. [DOI] [Google Scholar]
- 12. Davies A., Grant Nicol J. T., Liu C., Tetteh J., and McAdam K., “Identification of Volatiles From Heated Tobacco Biomass Using Direct Thermogravimetric Analysis—Mass Spectrometry and Target Factor Analysis,” Thermochimica Acta 668 (2018): 132–141, 10.1016/j.tca.2018.08.007. [DOI] [Google Scholar]
- 13. The MathWorks Inc. MATLAB. (Natick, MA: The MathWorks Inc, 2024), https://www.mathworks.com.
- 14. Malinowski E. R., “Determination of the Number of Factors and the Experimental Error in a Data Matrix,” Analytical Chemistry 49 (1977): 612–617, 10.1021/ac50012a027. [DOI] [Google Scholar]
- 15. Malinowski E. R., Factor Analysis in Chemistry. 3rd ed. (New York: John Wiley, 2002). [Google Scholar]
- 16. Malinowski E. R. and McCue M., “Qualitative and Quantitative Determination of Suspected Components in Mixtures by Target Transformation Factor Analysis of Their Mass Spectra,” Analytical Chemistry 49 (1977): 284–287, 10.1021/ac50010a026. [DOI] [Google Scholar]
- 17. Saha S., Roy S., Mathi P., and Mondal J. A., “Adsorption of Iodine Species (I3–, I–, and IO3–) at the Nuclear Paint Monolayer–Water Interface and Its Relevance to a Nuclear Accident Scenario,” Journal of Physical Chemistry A 124 (2020): 6726–6734, 10.1021/acs.jpca.0c04893. [DOI] [PubMed] [Google Scholar]
- 18. Galant C., Fayolle B., Kuntz M., and Verdu J., “Thermal and Radio‐Oxidation of Epoxy Coatings,” Progress in Organic Coatings 69 (2010): 322–329, 10.1016/j.porgcoat.2010.07.005. [DOI] [Google Scholar]
- 19. Kim M., Kim T., and Yeon J.‐W., “Formation of CH3I in a NaI and Methyl Alkyl Ketone Solution Under Gamma Irradiation Conditions,” Journal of Radioanalytical and Nuclear Chemistry 316 (2018): 1329–1335, 10.1007/s10967-018-5852-y. [DOI] [Google Scholar]
- 20. Colombani J., Chauvet E., Amat S., Dupuy N., and Gigmes D., “A FTIR/Chemometrics Approach to Characterize the Gamma Radiation Effects on Iodine/Epoxy‐Paint Interactions in Nuclear Power Plants,” Analytica Chimica Acta 960 (2017): 53–62, 10.1016/j.aca.2017.01.005. [DOI] [PubMed] [Google Scholar]
- 21. Clément B., Hanniet‐Girault N., Repetto G., et al., “LWR Severe Accident Simulation: Synthesis of the Results and Interpretation of the First Phebus FP Experiment FPT0,” Nuclear Engineering and Design 226 (2003): 5–82, 10.1016/S0029-5493(03)00157-2. [DOI] [Google Scholar]
Associated Data
This section collects any data citations, data availability statements, or supplementary materials included in this article.
Supplementary Materials
Supporting Information
Data Availability Statement
Data will be made available on reasonable request.