

Introduction
Splenic injuries are some of the most frequent and life-threatening traumatic injuries, given the spleen’s high vascularity and anatomic location.1,2 Over the past two decades, management of splenic injuries has shifted from total splenectomy to non-operative management (NOM) in hemodynamically stable patients to preserve the immunological function of the spleen.3–5 Over 80% of patients with splenic injuries are currently managed with NOM with an 85% to 94% success rate.3–5 Complications of NOM include splenic artery pseudo-aneurysms, splenic abscesses, and persistent or delayed hemorrhage requiring total splenectomy in approximately 1.2% to 3.1% of patients.4,6
Prior to the 1960s, total splenectomy was the standard of care for all splenic injuries. In the following two decades, research and support for splenic salvage utilizing splenorrhaphy and non-operative management increased due to the concern for overwhelming post-splenectomy infections (OPSIs) occurring in 2.2–5.9% of splenectomy patients with a subsequent 2–3% rate of mortality.7 Long term studies of patients that underwent splenectomies for trauma revealed these patients had a higher risk of pneumonia, deep vein thrombosis (DVT), pulmonary embolisms, certain solid tumors and hematologic malignancies in addition to an increased risk of mortality secondary to pneumonia and septicemia.8,9 These studies highlighted the importance of spleen preservation. One of the earliest studies was performed by Weinstein et al. in 1979, who reported 30 patients with splenic injuries, with a 60% splenorrhaphy rate, who demonstrated similar post-operative blood transfusion rates as those who underwent total splenectomy, with no reoperations, and no deaths, highlighting the feasibility of splenorrhaphy.10 Following these early studies, splenorrhaphy became a standard in splenic injury management, occurring in approximately 40% of all splenic injuries. Splenorrhaphy techniques included topical and electrocautery hemostasis, suture repair, mesh wraps, and partial splenectomies.11
The standard of care further transitioned to NOM, given high success rates and the introduction of therapeutic adjuncts such as angioembolization. Subsequently, only hemodynamically unstable patients with high-grade splenic injuries are managed operatively.12,13 Splenorrhaphy often requires increased operative time depending on the level of repair compared to a total splenectomy which may not be possible in clinically unstable patients with high-grade injuries.7,10
There has been a lack of studies on the utility and outcomes following splenorrhaphy over the past three decades. Thus, the current role of splenorrhaphy as a form of splenic salvage is not clearly delineated. We aim to evaluate the role of splenorrhaphy in adults with splenic injuries requiring operative intervention to determine the current rates of splenorrhaphy and the effect of splenorrhaphy failure requiring reoperation on mortality outcomes.
Methods
We retrospectively reviewed the National Trauma Data Bank from 2007 to 2019. The NTDB is the most extensive database in the United States of de-identified trauma patients from over 900 participating trauma centers and includes demographics, diagnoses, procedures, and outcomes. Participating trauma centers are permitted access to the repository by the American College of Surgeons (ACS) for quality and research purposes.14
Our study focused on adult trauma patients (≥16 years old) with splenic injuries. We excluded patients with a total initial Glasgow coma scale (GCS) ≤8 to prevent significant confounding, given high mortality rates in patients with traumatic brain injuries (Figure 1). Utilizing the International Classification of Diseases (ICD), 9th and 10th revisions, we selected patients diagnosed with a splenic injury during their trauma admission (ICD-9: 865*; ICD-10: S36*). Operative splenic injury management, total splenectomy (ICD-9: 41.5; ICD-10: 07BP0ZZ, 07TP0ZZ, 075P0ZZ) versus splenorrhaphy (ICD-9: 41.95; ICD-10: 07QP0ZZ) was compared. Patients were considered to have failed splenorrhaphy if they had separate codes for both splenorrhaphy and total splenectomy, indicating an unsuccessful attempt to repair the spleen requiring a return to the operative room for delayed splenectomy. Patients who underwent angioembolization were excluded given the inability to determine procedure timing and inconsistent ICD-9 and ICD-10 coding (ICD-9: 38.86; ICD-10: 04L43). Angioembolization was not the focus of this study, as we have previously described the role of angioembolization in splenic trauma.15
Figure 1:
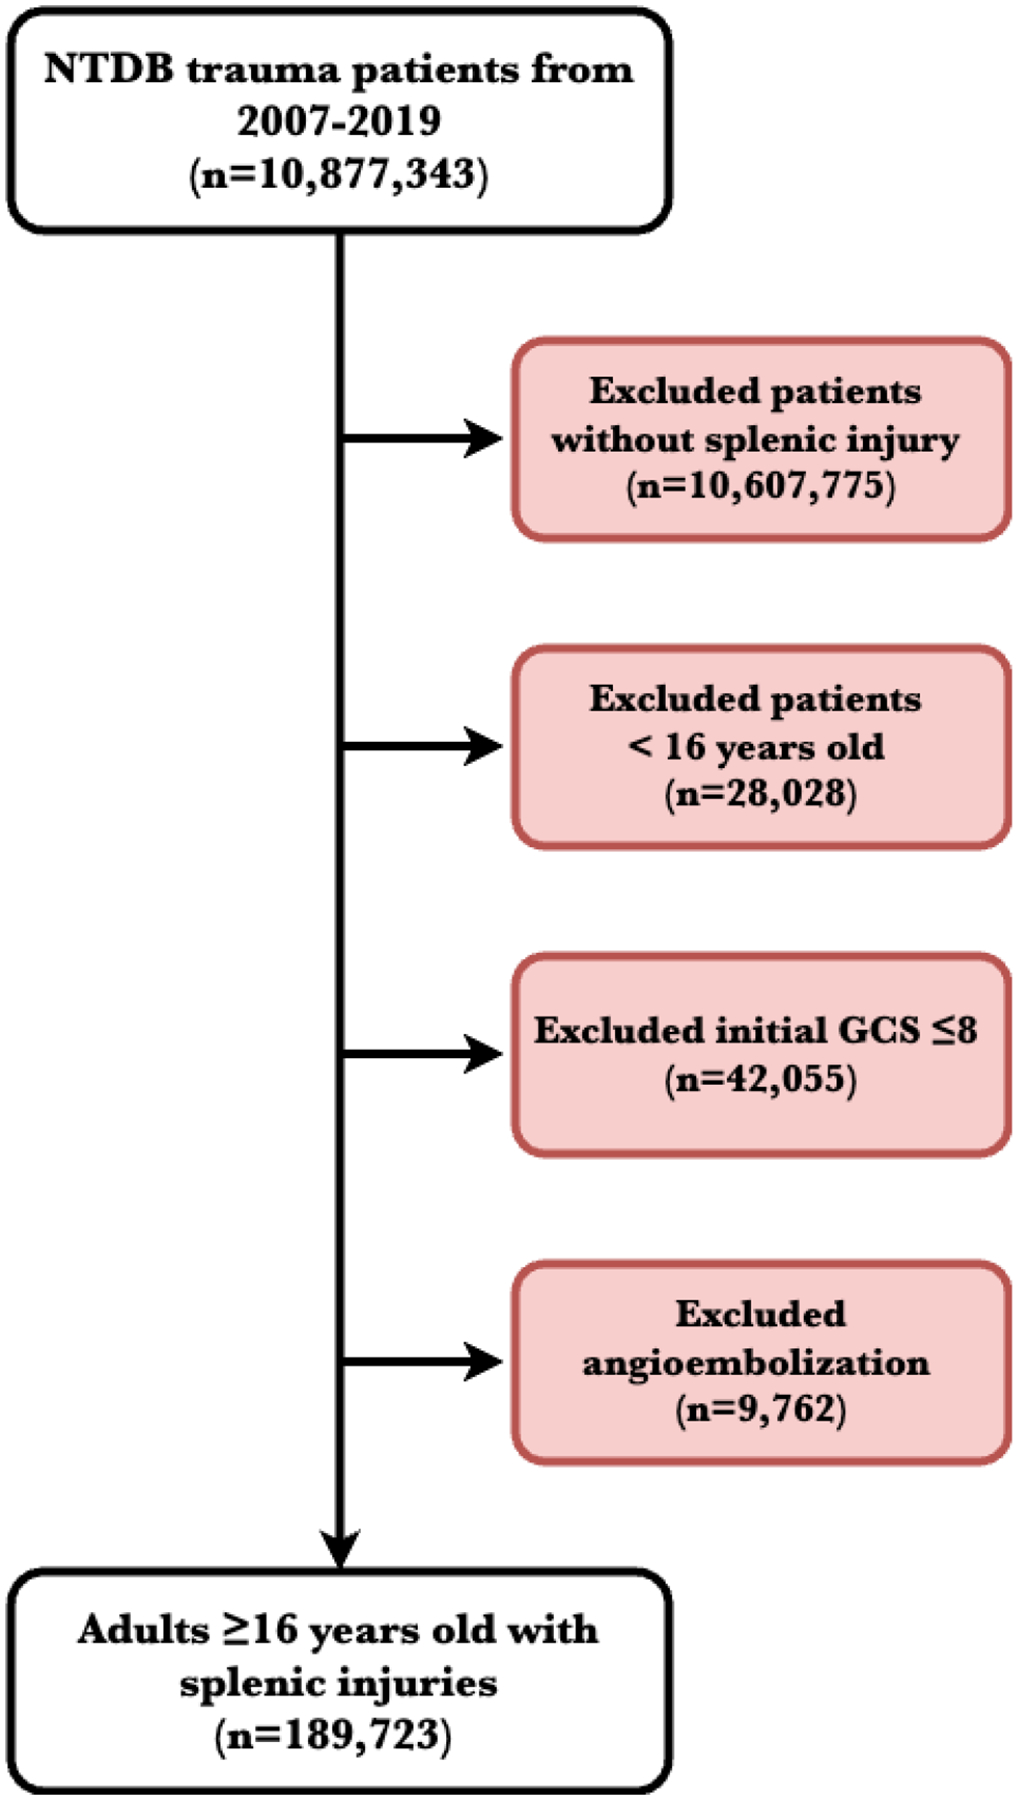
Flow diagram of patient selection and exclusion criteria
Abbreviations: NTDB: National Trauma Data Bank; GCS: Glasgow coma scale
Patient variables collected included the year of traumatic injury, age, sex, race, ethnicity, and mechanism of injury (blunt vs. penetrating). Clinical variables collected included vital signs (systolic blood pressure (SBP), pulse rate, oxygen saturation, respiratory rate (RR), and temperature) recorded upon patient arrival to the Emergency Department (ED), initial total GCS, Injury severity score (ISS), total Abbreviated injury scale (AIS) systems injured and Splenic AIS. The shock index was calculated for each patient by dividing the pulse rate by SBP. A modified Charlson comorbidity index (CCI) was calculated for each patient using previously described methods.16
The primary outcome measure for this study was in-hospital mortality, defined as all deaths in the ED or before hospital discharge. Secondary outcomes such as hospital length of stay, ED disposition, and hospital discharge disposition were evaluated. We defined statistical significance for all hypotheses tested at p <0.05. We used Chi2 and analysis of variance for categorical variables and Kruskal-Wallis and Student’s t-test for continuous variables for bivariate analysis. We performed multivariable logistic regressions to estimate the effect of operative splenic injury management on mortality. Significant potential confounding covariates (age, sex, arrival SBP and pulse rate, modified CCI, total initial GCS, mechanism of injury, Spleen AIS, and total injured AIS systems were controlled for in the models. Missingness was evaluated for all variables, and missingness in confounding covariates did not exceed 5% (Table 1). Additionally, we generated predictive probabilities of mortality utilizing the same covariates as the multivariable logistic regression models.
Table 1:
Demographic and clinical characteristics of all adults (≥16 years old) with splenic injuries based on splenic injury management
| No Intervention | Total Splenectomy | Splenorrhaphy | Failed Splenorrhaphy | Total | p-value | Missing Values | |
|---|---|---|---|---|---|---|---|
| N=151,627 (79.9%) | N=34,553 (18.2%) | N=3,405 (1.8%) | N=138 (0.1%) | N=189,723 | |||
| Age (years) | 40.5 (18.8) | 42.4 (18.1) | 35.4 (15.7) | 41.2 (18.9) | 40.8 (18.7) | <0.001 | 2,526 (1.3%) |
| Sex | <0.001 | 590 (0.3%) | |||||
| Male | 100,355 (66.4%) | 24,534 (71.2%) | 2,652 (78.3%) | 111 (80.4%) | 127,652 (67.5%) | ||
| Female | 50,807 (33.6%) | 9,913 (28.8%) | 734 (21.7%) | 27 (19.6%) | 61,481 (32.5%) | ||
| Race/Ethnicity | <0.001 | 0 (0%) | |||||
| White Non-Hispanic | 109,302 (72.1%) | 23,620 (68.4%) | 1,537 (45.1%) | 74 (53.6%) | 134,533 (70.9%) | ||
| White Hispanic | 15,630 (10.3%) | 3,409 (9.9%) | 724 (21.3%) | 24 (17.4%) | 19,787 (10.4%) | ||
| Black | 14,532 (9.6%) | 4,912 (14.2%) | 818 (24.0%) | 29 (21.0%) | 20,291 (10.7%) | ||
| Asian | 2,336 (1.5%) | 439 (1.3%) | 56 (1.6%) | 3 (2.2%) | 2,834 (1.5%) | ||
| Pacific Islander | 315 (0.2%) | 64 (0.2%) | 10 (0.3%) | 0 (0.0%) | 389 (0.2%) | ||
| American Indian | 881 (0.6%) | 144 (0.4%) | 29 (0.9%) | 1 (0.7%) | 1,055 (0.6%) | ||
| Other | 8,631 (5.7%) | 1,965 (5.7%) | 231 (6.8%) | 7 (5.1%) | 10,834 (5.7%) | ||
| Modified Charlson Comorbidity Index | 0.2 (0.7) | 0.2 (0.7) | 0.1 (0.5) | 0.2 (0.6) | 0.2 (0.7) | <0.001 | 0 (0%) |
| Mechanism of Injury | <0.001 | 0 (0%) | |||||
| Blunt | 145,369 (95.9%) | 28,514 (82.5%) | 1,533 (45.0%) | 82 (59.4%) | 175,498 (92.5%) | ||
| Penetrating | 6,258 (4.1%) | 6,039 (17.5%) | 1,872 (55.0%) | 56 (40.6%) | 14,225 (7.5%) | ||
| Arrival Vital Signs | 3,804 (2.0%) | ||||||
| SBP (mmHg) | 128.4 (25.0) | 114.9 (27.9) | 124.5 (27.2) | 115.8 (34.4) | 125.9 (26.1) | <0.001 | 4,075 (2.1%) |
| Pulse Rate (bpm) | 93.2 (21.0) | 100.0 (24.5) | 98.4 (22.7) | 101.8 (23.3) | 94.5 (21.9) | <0.001 | 28,088 (14.8%) |
| Temperature (*C) | 36.5 (1.8) | 36.2 (2.1) | 36.3 (2.3) | 36.2 (1.0) | 36.4 (1.9) | <0.001 | 5,683 (3.0%) |
| RR (bpm*) | 19.9 (5.4) | 21.3 (6.5) | 21.3 (6.2) | 22.0 (6.4) | 20.2 (5.7) | <0.001 | 37,119 (19.6%) |
| Pulse Oximetry (%O2) | 96.8 (6.6) | 96.5 (7.2) | 96.7 (9.5) | 97.5 (3.8) | 96.8 (6.8) | <0.001 | 5,290 (2.8%) |
| Shock Index | 0.8 (0.4) | 0.9 (0.8) | 0.8 (0.3) | 0.9 (0.4) | 0.8 (0.5) | <0.001 | 7,801 (4.1%) |
| Total Initial GCS | 14.7 (0.9) | 14.5 (1.1) | 14.7 (1.0) | 14.5 (1.2) | 14.7 (1.0) | <0.001 | 4,569 (2.4%) |
| ISS | 17.8 (10.2) | 26.0 (12.2) | 18.7 (10.6) | 26.8 (12.7) | 19.3 (11.1) | <0.001 | 571 (0.3%) |
| Spleen AIS | 2.7 (0.9) | 3.8 (1.1) | 2.6 (0.9) | 3.1 (1.1) | 2.9 (1.1) | <0.001 | 0 (0%) |
| Total AIS Systems Injured | 3.4 (1.7) | 3.3 (1.7) | 3.0 (1.6) | 3.5 (1.7) | 3.4 (1.7) | <0.001 | 7,801 (4.1%) |
| Trauma Center Level | <0.001 | 67,711 (35.7%) | |||||
| Level I Trauma Center | 63,529 (65.1%) | 14,660 (66.7%) | 1,510 (65.7%) | 69 (75.8%) | 79,768 (65.4%) | ||
| Level II Trauma Center | 30,138 (30.9%) | 6,646 (30.2%) | 744 (32.4%) | 22 (24.2%) | 37,550 (30.8%) | ||
| Level III Trauma Center | 3,983 (4.1%) | 666 (3.0%) | 45 (2.0%) | 0 (0.0%) | 4,694 (3.8%) | ||
| ED Disposition | <0.001 | 5,128 (2.7%) | |||||
| Non-ICU Admission | 50,950 (34.6%) | 1,855 (5.5%) | 179 (5.3%) | 2 (1.5%) | 52,986 (28.7%) | ||
| ICU Admission | 71,731 (48.7%) | 6,084 (17.9%) | 377 (11.3%) | 15 (11.0%) | 78,207 (42.4%) | ||
| Operating Room | 18,837 (12.8%) | 25,943 (76.4%) | 2,788 (83.2%) | 119 (87.5%) | 47,687 (25.8%) | ||
| Home | 993 (0.7%) | 21 (0.1%) | 2 (0.1%) | 0 (0.0%) | 1,016 (0.6%) | ||
| Deceased | 663 (0.5%) | 19 (0.1%) | 1 (0.0%) | 0 (0.0%) | 683 (0.4%) | ||
| Transfer to Hospital/Other | 3,975 (2.7%) | 38 (0.1%) | 3 (0.1%) | 0 (0.0%) | 4,016 (2.2%) | ||
| Hospital Discharge Disposition | <0.001 | 9,785 (5.2%) | |||||
| Home | 109,635 (76.7%) | 22,114 (66.0%) | 2,586 (78.0%) | 75 (55.1%) | 134,410 (74.7%) | ||
| Inpatient Rehab | 10,771 (7.5%) | 3,064 (9.1%) | 226 (6.8%) | 14 (10.3%) | 14,075 (7.8%) | ||
| Nursing Facility | 8,345 (5.8%) | 2,049 (6.1%) | 129 (3.9%) | 9 (6.6%) | 10,532 (5.9%) | ||
| Short/Intermediate Long-Term Care Facility | 8,710 (6.1%) | 2,765 (8.3%) | 207 (6.2%) | 16 (11.8%) | 11,698 (6.5%) | ||
| Hospice | 342 (0.2%) | 87 (0.3%) | 8 (0.2%) | 0 (0.0%) | 437 (0.2%) | ||
| Deceased | 3,754 (2.6%) | 2,841 (8.5%) | 90 (2.7%) | 14 (10.3%) | 6,699 (3.7%) | ||
| Mental Health Facility/Jail | 1,423 (1.0%) | 586 (1.7%) | 70 (2.1%) | 8 (5.9%) | 2,087 (1.2%) | ||
| ICU LOS (days) | 5.2 (7.0) | 8.4 (10.5) | 7.2 (9.3) | 13.2 (14.9) | 6.0 (8.1) | <0.001 | 67,468 (35.6%) |
| Hospital LOS (days) | 8.1 (9.8) | 14.0 (14.8) | 12.2 (11.9) | 21.7 (18.8) | 9.3 (11.1) | <0.001 | 1,203 (0.6%) |
| In-Hospital Mortality | 4,387 (2.9%) | 2,859 (8.3%) | 91 (2.7%) | 14 (10.1%) | 7,351 (3.9%) | <0.001 | 0 (0%) |
Data presented as mean (SD) or n (%)
Abbreviations: SBP: Systolic blood pressure; bpm: beats per minute; RR: Respiratory rate; bpm*:breaths per minute; GCS: Glasgow coma scale; ISS: Injury severity score; AIS: Abbreviated Injury Scale; LOS: Length of stay
We performed all statistical analyses with Stata 17.0.17 The institutional review board at the University of North Carolina at Chapel Hill exempted the study (IRB: 20–3018).
Results
Over the study period, 189,723 patients in the NTDB met our inclusion criteria (Figure 1). Of the patients analyzed, 67.5% were male, and the mean age of the study was 40.8 (18.7 SD) years old. Blunt injury was the primary mechanism of splenic injury, occurring in 92.5% of patients (Table 1). Of the 37,958 operative patients, 91.0% required a total splenectomy, 9.0% underwent splenorrhaphy, and of the splenorrhaphy patients, 3.9 % (n=138) failed and required reoperation for total splenectomy (Figure 2). Total splenectomy was most often performed in blunt splenic injuries (82.5%), whereas most splenorrhaphies were performed in patients with penetrating splenic injuries (55.0%). Splenorrhaphies performed for blunt splenic injuries were more likely to fail compared to penetrating splenic injuries (59.4% vs. 40.6%, p<0.001). Splenic injury management was stable over time with 79.9% (n=151,627) managed non-operatively, 18.2% (n=34,533) undergoing a total splenectomy and 1.9% (n=3,543) splenorrhaphy (Table 2).
Figure 2:

Operative splenic injury management by year of admission
Table 2:
Splenic injury management by year of admission
| Splenic Injury Management | |||||
|---|---|---|---|---|---|
| Year of Admit | No Intervention | Total Splenectomy | Splenorrhaphy | Failed Splenorrhaphy | Total |
| 2007 | 9,087 (78.9%) | 2,178 (18.9%) | 240 (2.1%) | 8 (0.07%) | 11,513 |
| 2008 | 10,332 (78.6%) | 2,538 (19.3%) | 270 (2.1%) | 7 (0.05%) | 13,147 |
| 2009 | 10,367 (79.1%) | 2,472 (18.9%) | 263 (2.0%) | 10 (0.08%) | 13,112 |
| 2010 | 10,331 (78.4%) | 2,568 (19.5%) | 269 (2.0%) | 8 (0.06%) | 13,176 |
| 2011 | 11,104 (79.2%) | 2,619 (18.7%) | 293 (2.1%) | 6 (0.04%) | 14,022 |
| 2012 | 11,847 (79.9%) | 2,709 (18.3%) | 271 (1.8%) | 5 (0.03%) | 14,832 |
| 2013 | 11,463 (79.9%) | 2,646 (18.4%) | 226 (1.6%) | 20 (0.14%) | 14,355 |
| 2014 | 11,908 (80.8%) | 2,589 (17.6%) | 231 (1.6%) | 4 (0.03%) | 14,732 |
| 2015 | 12,372 (81.3%) | 2,594 (17.1%) | 238 (1.6%) | 7 (0.05%) | 15,211 |
| 2016 | 13,527 (81.8%) | 2,731 (16.5%) | 261 (1.6%) | 12 (0.07%) | 16,531 |
| 2017 | 13,329 (80.3%0 | 2,983 (18.0%) | 262 (1.6%) | 20 (0.12%) | 16,594 |
| 2018 | 13,106 (80.4%) | 2,891 (17.7%) | 282 (1.7%) | 19 (0.12%) | 16,298 |
| 2019 | 12,854 (79.3%) | 3,035 (18.7%) | 299 (1.8%) | 12 (0.07%) | 16,200 |
| Total | 151,627 (79.9%) | 34,553 (18.2%) | 3,405 (1.8%) | 138 (0.1%) | 189,723 |
Patients that underwent splenorrhaphies were more often male (78.3% vs. 71.2%, p<0.001) and younger (35.4 vs. 42.4 years, p<0.001) than patients that underwent a total splenectomy. A larger proportion of splenorrhaphy patients were Black (24.0% vs. 14.2%, p<0.001) and White-Hispanic (21.3% vs. 9.9%, p<0.001) compared to total splenectomy patients who were primarily White Non-Hispanic (68.4% vs. 45.1%, p<0.001). Splenorrhaphy patients had a lower mean Spleen AIS (2.6 vs. 3.8, p<0.001), ISS (18.7 vs. 26.0, p<0.001) and crude mortality (2.7% vs. 8.3%, p< 0.001) compared to total splenectomy patients. Patients that underwent splenorrhaphy were more likely to have concurrent small bowel (14.6% vs. 6.6%, p<0.001) and colon (21.0% vs. 11.2%, p<0.001) injuries in comparison to patients that underwent total splenectomy. Both cohorts had similar rates of concurrent liver injuries (22.1% vs. 21.2%, p<0.001; Table 1).
Failed splenorrhaphy patients had a higher mean Spleen AIS (3.1 vs. 2.6, p<0.001) and ISS (26.8 vs. 18.7, p<0.001) compared to successful splenorrhaphy patients. Failed splenorrhaphy patients had higher crude mortality (10.1% vs. 8.3%, p<0.001), longer ICU length of stay (13.2 vs. 8.4 days, p<0.001), overall longer hospital length of stay (21.7 vs. 14.0 days, p<0.001) and were less likely to discharge home (55.1% vs. 66.0%, p<0.001) compared to patients who underwent initial total splenectomy (Table 1). Overall, patients that failed splenorrhaphy had higher rates of concurrent liver (33.3% vs. 22.1% and 21.2%, p<0.001), small bowel (15.2% vs. 14.6% and 6.6%, p<0.001), colon (29.0% vs. 21.0% and 11.2%, p<0.001) and renal (21.0% vs. 14.4% and 16.1%, p<0.001) injuries when compared to both successful splenorrhaphies and total splenectomies respectively. When evaluating hospital complications, patients that failed splenorrhaphy had higher rates of DVT (7.4% vs. 3.8% and 5.9%, p<0.001), ventilator associated pneumonia (13.9% vs. 9.0% and 13.0%, p<0.001), intubation (5.6% vs. 3.3% and 4.9%, p<0.001), cardiac arrest (7.4% vs. 1.9% and 4.9%, p<0.001), and acute kidney injury (AKI; 10.2% vs. 4.1% and 5.7%, p<0.001), when compared to patients that underwent successful splenorrhaphy and total splenectomies respectively (Table 1).
When evaluating splenic injury management by spleen AIS, total splenectomy occurred most often in patients with high-grade injuries, Spleen AIS 4 and 5, at 35.9% and 32.4%, respectively. Splenorrhaphy was attempted most often in lower grade injuries, with 66.7% of Spleen AIS 2 patients undergoing splenorrhaphy compared to Speen AIS 4 and 5 at 18.4% and 4.0%, respectively (Table 3). Of the patients that underwent splenorrhaphy, those with Spleen AIS 2 injuries failed less often (2.5%) compared to 6.3% and 11.2% failure rates in those with Spleen AIS 4 and 5 injuries (Table 4).
Table 3:
Spleen AIS based on splenic injury management
| Splenic Injury Management | |||||
|---|---|---|---|---|---|
| Spleen AIS | No Intervention | Total Splenectomy | Splenorrhaphy | Failed Splenorrhaphy | Total |
| 1 | 1 (0%) | 0 (0)%) | 0 (0)%) | 0 (0)%) | 1 (0%) |
| 2 | 91,893 (60.8%) | 6,137 (17.8%) | 2,298 (67.7%) | 58 (42.0%) | 100,386 (53.1%) |
| 3 | 22,836 (15.1%) | 4,795 (13.9%) | 361 (10.6%) | 23 (16.7%) | 28,015 (14.8%) |
| 4 | 30,437 (20.1%) | 12,376 (35.9%) | 609 (17.9%) | 41 (29.7%) | 43,463 (23.0%) |
| 5 | 5,987 (4.0%) | 11,157 (32.4%) | 127 (3.7%) | 16 (11.6%) | 17,287 (9.1%) |
| Total | 151,154 (79.9%) | 34,465 (18.2%) | 3,395 (1.8%) | 138 (0.1%) | 189,152 |
Data presented as n (%)
Abbreviations: AIS: Abbreviated Injury Scale
Table 4.
Adjusted Odds Ratio for In-Hospital Mortality Based on Splenic Injury Management
| Odds Ratio | 95% CI | p-value | |
|---|---|---|---|
| Splenic Injury Management* (ref: Splenorrhaphy) | |||
| No Intervention | 1.08 | 0.85 – 1.37 | 0.518 |
| Total Splenectomy | 2.30 | 1.82 – 2.92 | <0.001 |
| Failed Splenorrhaphy | 2.36 | 1.19 – 4.67 | 0.014 |
Adjusted for age, sex, SBP, pulse rate, modified Charlson comorbidity index, total initial GCS, mechanism of injury, Spleen AIS, and total injured AIS systems
Abbreviations: CI: Confidence Interval; Ref: reference group; SBP: Systolic blood pressure; GCS: Glasgow coma scale; AIS: Abbreviated injury scale
Patients who underwent total splenectomy and failed splenorrhaphy requiring splenectomy had an adjusted odds ratio for mortality of 2.30 (95% CI 1.82–2.92, p<0.001) and 2.36 (95% CI 1.19–4.67, p<0.014), respectively, compared to successful splenorrhaphy patients, after adjusting for age, sex, SBP, pulse rate, total initial GCS, modified Charlson comorbidity index, mechanism of injury, Spleen AIS and total injured AIS systems (Table 5).
Table 5.
Adjusted Odds Ratio for In-Hospital Mortality Based on Splenic Injury Management
| Odds Ratio | 95% CI | p-value | |
|---|---|---|---|
| Splenic Injury Management (ref: Splenorrhaphy & Failed Splenorrhaphy) | |||
| No Intervention | 1.00 | 0.80 – 1.25 | 0.998 |
| Total Splenectomy | 2.13 | 1.70 – 2.66 | <0.001 |
Adjusted for age, sex, SBP, pulse rate, modified Charlson comorbidity index, total initial GCS, mechanism of injury, Spleen AIS, and total injured AIS systems
Abbreviations: CI: Confidence Interval; Ref: reference group; SBP: Systolic blood pressure; GCS: Glasgow coma scale; AIS: Abbreviated injury scale
A predictive probability model was performed for in-hospital mortality by operative splenic injury management, stratified by Spleen AIS, controlling for the same covariates as the multivariable logistic regression models. The predicted probability of in-hospital mortality was higher in patients who underwent total splenectomy compared to all patients who underwent splenorrhaphy. The predicted probability of in-hospital mortality in all patients who underwent splenorrhaphy increased with rising Spleen AIS (Figure 3).
Figure 3.
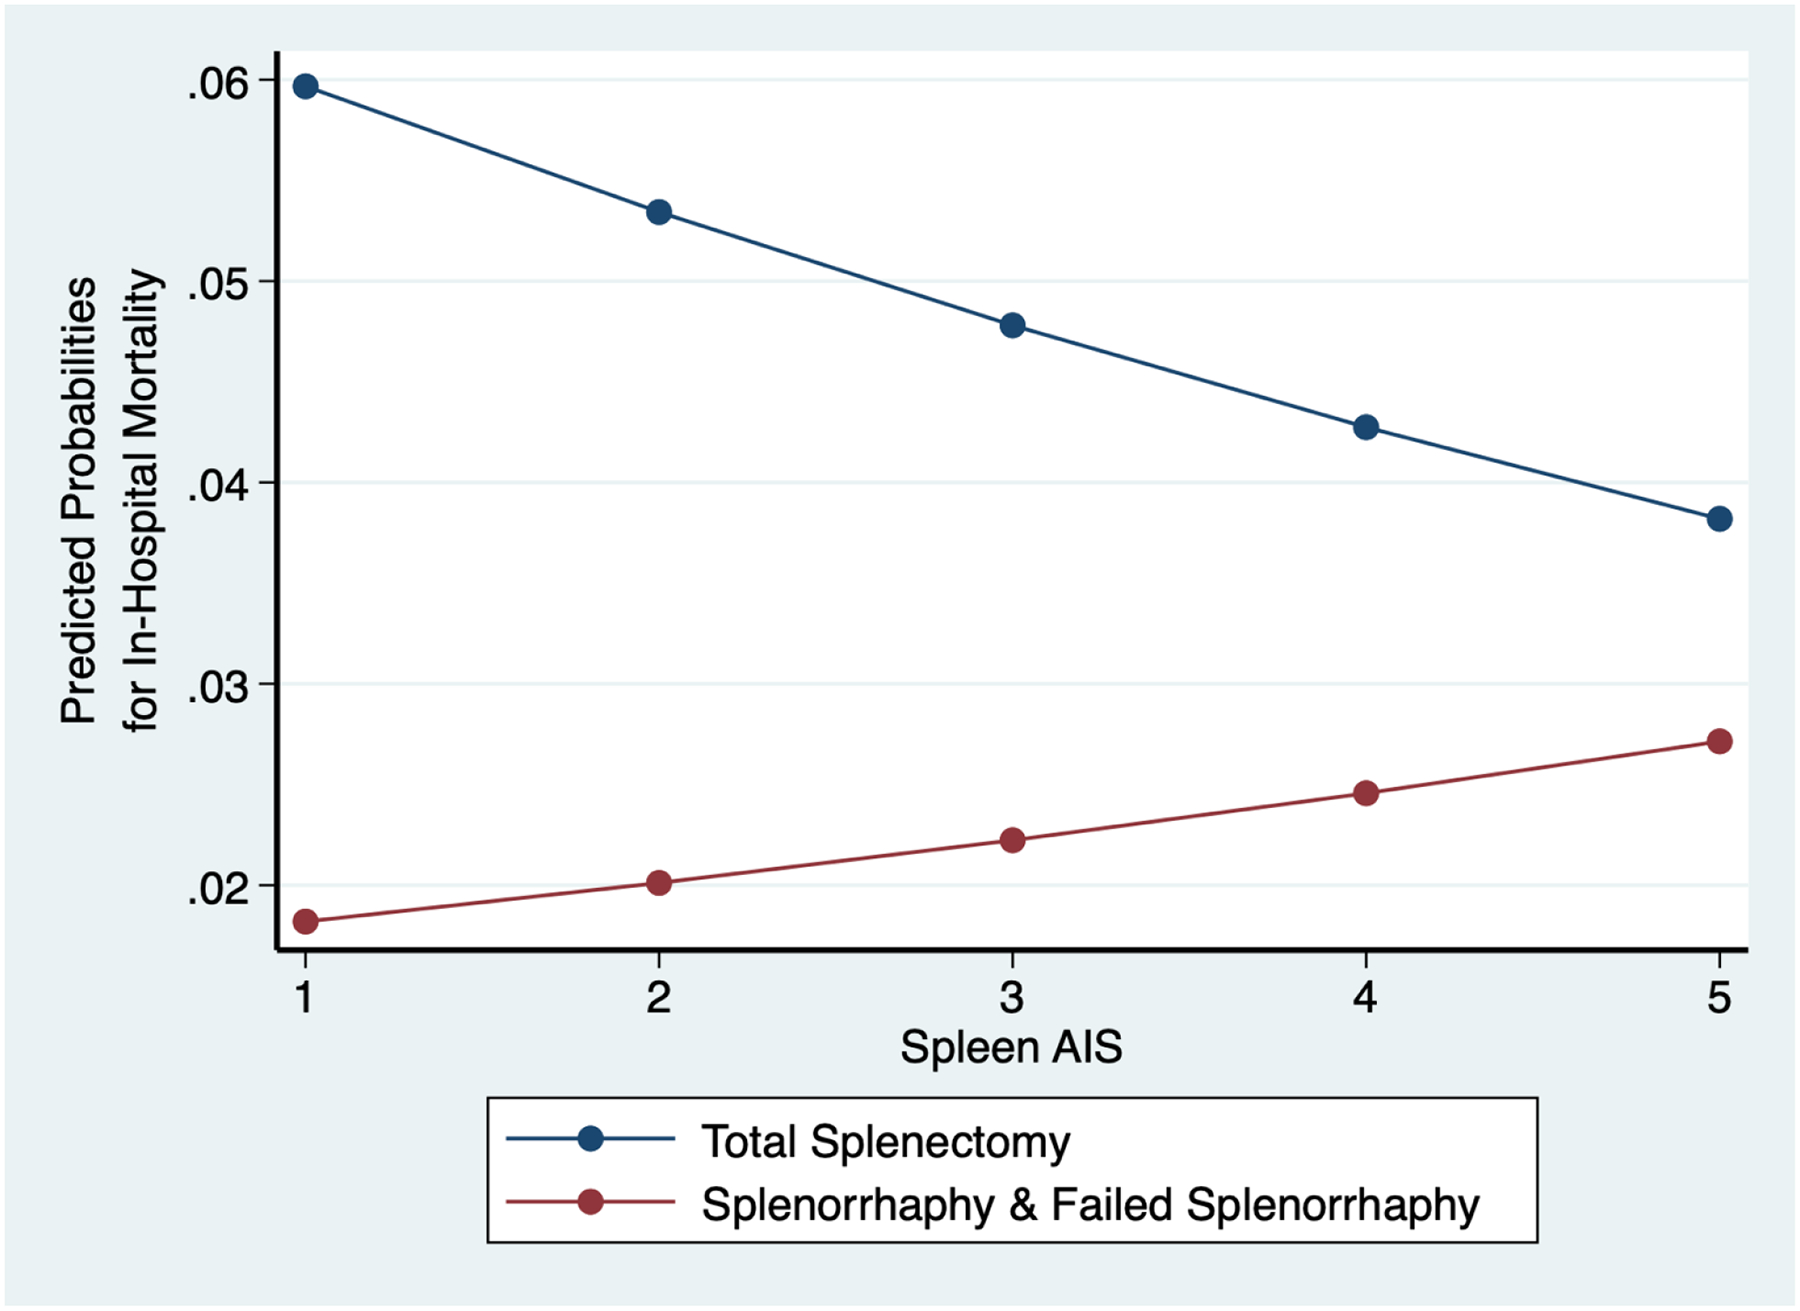
Predicted probabilities of in-hospital mortality comparing operative splenic injury management across Spleen Abbreviated injury scale (AIS)
Discussion
In our study of adult patients with splenic injuries requiring operative intervention, we show that total splenectomy and splenorrhaphy have remained consistent from 2007 to 2019, with average yearly splenectomy and splenorrhaphy rates of 18.2 and 1.9%, respectively. Splenorrhaphy was performed more often in those with less severe splenic injuries. We found patients undergoing total splenectomy had over twice the odds of mortality compared to all patients who underwent splenorrhaphy. Mortality outcomes were not significantly different in those who underwent splenorrhaphy compared to those who were managed non-operatively. However, patients who required a subsequent splenectomy following failed splenorrhaphy demonstrated significantly higher odds of mortality and worse outcomes than those who underwent an initial splenectomy. Patients that failed splenorrhaphy were also more likely to have concurrent liver, small bowel, colon and kidney injuries. Further, these patients demonstrated a higher rate of complications such as DVT, intubation, cardiac arrest and AKI compared to patients that underwent initial total splenectomy and successful splenorrhaphy. These complications may be secondary to hypotension and delayed hemorrhage in the setting of failed splenorrhaphy requiring reoperation for total splenectomy, thus leading to a higher mortality in this population.
Compared to early studies, our results showed significantly lower rates of splenorrhaphy, higher rates of re-operative splenectomy in those that had a splenorrhaphy, and higher crude mortality. Feliciano et al. published a study of 240 patients who underwent splenorrhaphy at one urban trauma center from 1980–1989, accounting for 43.4% of all splenic injuries managed during that time interval. Reoperation for splenectomy secondary to post-operative hemorrhage occurred in 1.3% of patients compared to our 4%.7 Similarly, Ko et al. performed a retrospective review of splenorrhaphy rates at a single level I trauma center from 2014 to 2018. Of the 717 patients studied, 1.4% underwent splenorrhaphy, 21.9% total splenectomy, 22.0% angiogram and 51.7% NOM.11 Similar to our study, the majority of splenorrhaphies were performed in patients with Grade II injuries (80%), however, the Ko et al study did not show any occurrence of mortality or reoperation due to splenic repair.11 17
This is the first study to our knowledge to evaluate splenorrhaphy rates and outcomes utilizing a national trauma registry and provides a current, updated evaluation of adult splenic injury management in the United States. Our study correlates with and strengthens the recently reported rates of splenorrhaphy in adults with splenic injuries. However, given the large number of patients in the study cohort, we could better ascertain the risk of mortality and reoperation in this population in relation to patients undergoing NOM or total splenectomy.
Splenorrhaphy encompasses various techniques to salvage splenic parenchyma and achieve hemostasis. Hemostasis can be achieved through compression, electrocautery, and topical hemostatic agents such as absorbable gelatin sponges, oxidized regenerated cellulose or microfibrillar collagen.7 Splenic lacerations can be repaired using chronic catgut suture in an interrupted fashion with pledgets, with or without an omental pedicle buttress. More complex splenic injuries may require a combination of suture repair, omental buttress, selective vessel ligation and removal of devitalized tissue.7 Absorbable mesh can be used to strengthen a splenic repair, and some early studies report wrapping the injured spleen in absorbable mesh with some success.7,18 Ko et al. further evaluated splenorrhaphy technique, comparing the modern cohort previously discussed to a historical cohort of splenorrhaphy patients, finding that 100% of the contemporary cohort required only topical hemostatic agents for repair compared to 83% of the historic cohort performing suture repair with or without hemostatic agents. Their study showed no difference in complications between the cohorts indicating that either technique remains a feasible option for splenic salvage. While various splenorrhaphy techniques can be performed, given the higher odds of mortality and morbidity associated with failed splenorrhaphy requiring reoperation for splenectomy, patient selection must be based on splenic injury grade and surgical expertise.
Splenorrhaphy may be more appropriate for patients requiring operative intervention that have lower grade splenic injuries (AIS < 3) and lower overall injury severity (ISS <20), as our results demonstrate these patients more often undergo successful splenorrhaphy. However, these scores are difficult to delineate in the emergent trauma setting and require thorough imaging and operative evaluation to discern. As such, we recommend performing a total splenectomy in patients requiring operative intervention in the presence of a splenic injury greater than AIS 2 operatively and associated multiple concurrent abdominal organ injuries requiring repair. Splenorrhaphy should be avoided in patients with high-grade splenic injuries with severe hemorrhage as splenorrhaphy can potentially prolong operative times and has a significant rate of failure in this population.
Inherent limitations arise from utilizing a large, national administrative dataset. Data quality depends on the collection and reporting process and the quantity of missing data from each reporting trauma center. Although the NTDB requires strict data coding through a standard data dictionary, some variations in data will be present. Further, while the NTDB incorporates data from over 900 trauma centers nationwide, this may exclude patient characteristics, management, and outcomes at smaller, rural centers that do not participate.19,20 Missing data prevented our evaluation of potentially important secondary outcomes such as blood transfusions, operative times, postoperative hemorrhage, and postoperative angiography rates. Further, the NTDB does not contain laboratory values, so important information regarding hemoglobin and coagulopathy cannot be obtained. Procedure timing is not recorded within this database, potentially introducing bias when evaluating multiple procedures in relation to each other. Additionally, the NTDB does not provide follow up data beyond discharge, so important outcomes such as readmission rates, splenic abscesses, thromboses, and post-discharge mortality cannot be assessed.19
We have recently evaluated angioembolization in relation to splenectomy, finding that the rates of angioembolization have increased year-to-year without a subsequent decrease in splenectomy rates.15 Given the inability to determine timing of angioembolization in relation to both splenorrhaphy and splenectomy within this study, we chose to exclude patients that underwent this procedure to prevent confounding of our results. However, it is important to discuss as angioembolization may play an important role in the outcomes of these patients. Potentially patients that underwent splenorrhaphy may have undergone angioembolization and patients that received initial splenectomy may have failed angioembolization first. Further, splenorrhaphy may have succeeded more often in the setting of concurrent angioembolization. Determining the angioembolization status of patients that failed splenorrhaphy would be interesting to evaluate if concurrent angioembolization may improve mortality outcomes in this population and decrease rates of delayed splenectomy. However, given our recent findings suggesting no reciprocal change in splenectomy rates in relation to angioembolization rates this benefit may be negligible.15
Conclusion
In conclusion, adults with splenic injuries requiring operative intervention have over twice the odds of mortality when a total splenectomy is performed or when splenorrhaphy fails compared to successful splenorrhaphy, despite injury severity. Splenorrhaphy rates were stable over the study interval occurring in 1.9% of all splenic injuries and 9.0% of patients requiring operative intervention, with a subsequent 3.9% failure rate requiring reoperation for splenectomy. Our findings suggest the careful selection of potential splenorrhaphy patients is imperative as failure may lead to significant morbidity and mortality in this population.
References
- 1.Waseem M, Bjerke S. Splenic Injury. Operative Techniques in General Surgery. 2022;2(3):192–205. doi: 10.1053/otgn.2000.17747 [DOI] [Google Scholar]
- 2.Jesani H, Jesani L, Rangaraj A, Rasheed A. Splenic trauma, the way forward in reducing splenectomy: our 15-year experience. Ann R Coll Surg Engl. 2020;102(4):263–270. doi: 10.1308/RCSANN.2019.0164 [DOI] [PMC free article] [PubMed] [Google Scholar]
- 3.Zarzaur BL, Kozar R, Myers JG, et al. The splenic injury outcomes trial: An American Association for the Surgery of Trauma multi-institutional study. J Trauma Acute Care Surg. 2015;79(3):335–342. doi: 10.1097/TA.0000000000000782 [DOI] [PubMed] [Google Scholar]
- 4.Santorelli JE, Costantini TW, Berndtson AE, Kobayashi L, Doucet JJ, Godat LN. Readmission after splenic salvage: How real is the risk? Surgery. 2022;171(5):1417–1421. doi: 10.1016/J.SURG.2021.10.060 [DOI] [PubMed] [Google Scholar]
- 5.Savage SA, Zarzaur BL, Magnotti LJ, et al. The evolution of blunt splenic injury: resolution and progression. J Trauma. 2008;64(4):1085–1091. doi: 10.1097/TA.0B013E31816920F1 [DOI] [PubMed] [Google Scholar]
- 6.Rosenberg GM, Knowlton L, Rajasingh C, et al. National Readmission Patterns of Isolated Splenic Injuries Based on Initial Management Strategy. JAMA Surg. 2017;152(12):1119–1125. doi: 10.1001/JAMASURG.2017.2643 [DOI] [PMC free article] [PubMed] [Google Scholar]
- 7.Feliciano D v., Spjut-Patrinely V, Burch JM, et al. Splenorrhaphy. The alternative. Ann Surg. 1990;211(5):569–582. doi: 10.1097/00000658-199005000-00007 [DOI] [PMC free article] [PubMed] [Google Scholar]
- 8.Kristinsson SY, Gridley G, Hoover RN, Check D, Landgren O. Long-term risks after splenectomy among 8,149 cancer-free American veterans: a cohort study with up to 27 years follow-up. Haematologica. 2014;99(2):392–398. doi: 10.3324/HAEMATOL.2013.092460 [DOI] [PMC free article] [PubMed] [Google Scholar]
- 9.Lee HJ, Cheng CT, Chen CC, et al. Increased long-term pneumonia risk for the trauma-related splenectomized population - a population-based, propensity score matching study. Surgery. 2020;167(5):829–835. doi: 10.1016/J.SURG.2020.01.006 [DOI] [PubMed] [Google Scholar]
- 10.Weinstein ME, Govin GG, Rice CL, Virgilio RW. Splenorrhaphy for splenic trauma. J Trauma. 1979;19(9):692–696. doi: 10.1097/00005373-197909000-00012 [DOI] [PubMed] [Google Scholar]
- 11.Ko A, Radding S, Feliciano D v., et al. Near Disappearance of Splenorrhaphy as an Operative Strategy for Splenic Preservation After Trauma. Am Surg. 2022;88(3):429–433. doi: 10.1177/00031348211050591 [DOI] [PubMed] [Google Scholar]
- 12.Harfouche MN, Dhillon NK, Feliciano D v. Update on Nonoperative Management of the Injured Spleen. Am Surg. Published online 2022. doi: 10.1177/00031348221114025 [DOI] [PubMed] [Google Scholar]
- 13.Zarzaur BL, Rozycki GS. An update on nonoperative management of the spleen in adults. Trauma Surg Acute Care Open. 2017;2(1). doi: 10.1136/TSACO-2017-000075 [DOI] [PMC free article] [PubMed] [Google Scholar]
- 14.About NTDB. Accessed April 25, 2022. https://www.facs.org/quality-programs/trauma/tqp/center-programs/ntdb/about
- 15.Schneider AB, Gallaher J, Raff L, Purcell LN, Reid T, Charles A. Splenic preservation after isolated splenic blunt trauma: The angioembolization paradox. Surgery. 2021;170(2):628–633. doi: 10.1016/J.SURG.2021.01.007 [DOI] [PubMed] [Google Scholar]
- 16.Knowlin L, Stanford L, Moore D, Cairns B, Charles A. The Measured Effect Magnitude of Co-Morbidities on Burn injury Mortality. Burns. 2016;42(7):1433. doi: 10.1016/J.BURNS.2016.03.007 [DOI] [PMC free article] [PubMed] [Google Scholar]
- 17.StataCorp. 2021. Stata Statistical Software: Release 17. College Station, TX: StataCorp LLC. [Google Scholar]
- 18.Rogers F, Baumgartner N, Robin A, Barrette J. Absorbable mesh splenorrhaphy for severe splenic injuries: functional studies in an animal model and an additional patient series - PubMed. J Trauma. Published February 1991. Accessed September 29, 2022. https://pubmed.ncbi.nlm.nih.gov/1847221/ [PubMed] [Google Scholar]
- 19.Hashmi ZG, Kaji AH, Nathens AB. Practical Guide to Surgical Data Sets: National Trauma Data Bank (NTDB). JAMA Surg. 2018;153(9):852–853. doi: 10.1001/JAMASURG.2018.0483 [DOI] [PubMed] [Google Scholar]
- 20.National Trauma Data Standard (NTDS). Accessed November 2, 2021. https://www.facs.org/quality-programs/trauma/tqp/center-programs/ntdb/ntds