

ABSTRACT
Genome-wide association studies identified variants around the BIN1 (bridging integrator 1) gene locus as prominent risk factors for late-onset Alzheimer disease. In the present study, we decreased the expression of BIN1 in mouse hippocampal neurons to investigate its neuronal function. Bin1 knockdown via RNAi reduced the dendritic arbor size in primary cultured hippocampal neurons as well as in mature Cornu Ammonis 1 excitatory neurons. The AAV-mediated Bin1 RNAi knockdown also generated a significant regional volume loss around the injection sites at the organ level, as revealed by 7-Tesla structural magnetic resonance imaging, and an impaired spatial reference memory performance in the Barnes maze test. Unexpectedly, Bin1 knockdown led to concurrent activation of both macroautophagy/autophagy and MTOR (mechanistic target of rapamycin kinase) complex 1 (MTORC1). Autophagy inhibition with the lysosome inhibitor chloroquine effectively mitigated the Bin1 knockdown-induced dendritic regression. The subsequent molecular studydemonstrated that increased expression of ULK3 (unc-51 like kinase 3), which is MTOR-insensitive, supported autophagosome formation in BIN1 deficiency. Reducing ULK3 activity with SU6668, a receptor tyrosine kinase inhibitor, or decreasing neuronal ULK3 expression through AAV-mediated RNAi, significantly attenuated Bin1 knockdown-induced hippocampal volume loss and spatial memory decline. In Alzheimer disease patients, the major neuronal isoform of BIN1 is specifically reduced. Our work suggests this reduction is probably an important molecular event that increases the autophagy level, which might subsequently promote brain atrophy and cognitive impairment through reducing dendritic structures, and ULK3 is a potential interventional target for relieving these detrimental effects.Abbreviations: AV: adeno-associated virus; Aβ: amyloid-β; ACTB: actin, beta; AD: Alzheimer disease; Aduk: Another Drosophila Unc-51-like kinase; AKT1: thymoma viral proto-oncogene 1; AMPK: AMP-activated protein kinase; AP: autophagosome; BafA1: bafilomycin A1; BDNF: brain derived neurotrophic factor; BIN1: bridging integrator 1; BIN1-iso1: BIN1, isoform 1; CA1: cornu Ammonis 1; CA3: cornu Ammonis 3; CLAP: clathrin and adapter binding; CQ: chloroquine; DMEM: Dulbecco’s modified Eagle medium; EGFP: enhanced green fluorescent protein; GWAS: genome-wide association study; MAP1LC3B/LC3B: microtubule-associated protein 1 light chain 3 beta; MRI: magnetic resonance imaging; MTOR; mechanistic target of rapamycin kinase; MTORC1: MTOR complex 1; PET: positron emission tomography; qRT-PCR: real-time quantitative reverse transcription PCR; ROS: reactive oxygen species; RPS6KB1: ribosomal protein S6 kinase B1; TFEB: transcription factor EB; ULK1: unc-51 like kinase 1; ULK3: unc-51 like kinase 3.
KEYWORDS: Alzheimer disease, autophagy, BIN1, hippocampal atrophy, ULK3
Introduction
The BIN1 (bridging integrator 1) protein was initially identified as a tumor suppressor that interacts with MYC/cMyc (MYC proto-oncogene, bHLH transcription factor) and inhibits its activity [1]. In the past two decades, large-scale genome-wide association studies (GWASs) identified genetic variants around the BIN1 gene as risk factors for late-onset Alzheimer disease (AD) [2,3]. In cultured mouse cortical neurons, BIN1 depletion increases production of amyloid-β (Aβ) [4,5], but this effect was not replicated in a subsequent in vivo study [6]. Clinical studies associated the BIN1 risk allele rs744373 with worse MAPT/Tau pathology but not cerebrospinal fluid Aβ levels or AV45 amyloid-positron emission tomography (PET) uptake [7,8]. BIN1 directly interacts with MAPT/Tau via its C-terminal SH3 domain [9,10]; in various cellular and mouse models, BIN1 regulates MAPT/Tau pathology, the transcellular spreading of MAPT/Tau [9,11,12], and MAPT/Tau-dependent neuronal network excitability [13].
BIN1 has multiple neuronal functions. In cultured murine cortical neurons, BIN1 deficiency impairs presynaptic neurotransmitter release as well as postsynaptic membrane trafficking of AMPA receptors [14,15]. In a group of rhythm-pacing neurons, our previous work found the Drosophila ortholog of human BIN1 regulates dynamics of dendritic branches and synaptic strength [16]. These findings are mostly from loss-of-function studies; they have AD-associated implications as the main neuronal isoform of human BIN1, isoform 1 (BIN1-iso1), is specifically reduced in AD patients according to postmortem assessments of brain lysates [17–19]. The magnitude of this reduction is greater than its paralog, AMPH (amphiphysin) [19], suggesting this BIN1 decrease is not merely from neuronal loss. Neurodegeneration, as routinely reflected by brain atrophy at the organ level, is a perpetual theme in AD. Particularly, loss of the hippocampal volume occurs early and progresses over time through the whole AD course [20]. Interestingly, previous longitudinal volumetric magnetic resonance imaging (MRI) studies identified no association between the rate of hippocampal atrophy and Aβ and MAPT/Tau deposition [21,22], implying other factors involved. In a cohort of young healthy university students, an MRI study associated rs744373 with altered hippocampal volume and functional connectivity [23]. In addition, when neuronal BIN1 is specifically ablated, mice display declined hippocampus-dependent spatial cognitive performance [14]. These findings suggest BIN1 might participate in hippocampal degeneration in an AD context.
Both neuronal loss and dendritic size reduction contribute to hippocampal volume loss, and they tend to interweave in neurodegenerative disorders, making study of their respective contributions difficult. Our previous work identified a dendritic role of BIN1. In the present study, we reduced BIN1 expression with lentivirus-mediated RNAi in primarily cultured mouse hippocampal neurons. This BIN1 manipulation significantly reduced the size of the dendritic arbor. Unexpectedly, Bin1 knockdown led to elevated autophagic flux that is accompanied by increased, rather than decreased, activity of the MTOR (mechanistic target of rapamycin kinase) complex 1 (MTORC1), suggesting an MTOR-independent autophagy elevation might be involved. Subsequently, we reduced BIN1 expression in hippocampal cornu Ammonis 1 (CA1) neurons with AAV-mediated RNAi (AAV-shBin1). This in vivo RNAi knockdown reproduced the dendritic regression phenotype and the autophagy elevation. In addition, a 7-Tesla structural MRI scan identified a mild but significant volume loss around the injection sites in AAV-shBin1 mice; mice also displayed impaired spatial memory performance in the Barnes maze test. Mechanistically, we found that Bin1 knockdown leads to nuclear translocation of TFEB, which upregulates the expression of a batch of autophagy genes including ULK3 (unc-51 like kinase 3). ULK3 is MTOR-insensitive and acts as an additional autophagy initiator promoting autophagosome (AP) formation. Blocking TFEB translocation, decreasing ULK3 expression with RNAi, or inhibiting ULK3 activity with an inhibitor SU6668, all effectively mitigated the Bin1 knockdown-induced dendritic regression in primary neurons; in accordance, both SU6668 and AAV-mediated Ulk3 knockdown significantly attenuated hippocampal regional atrophy, and improved spatial memory performance in AAV-shBin1 mice. Thus, the present work unveiled a new role of BIN1 in regulating dendritic arbor size in hippocampal neurons, which is associated with an enhanced, ULK3-initiated autophagic flux.
Results
Decreasing BIN1 expression in cultured hippocampal neurons reduces dendritic arbor size but increases MTORC1 activity
To investigate the neuronal function of BIN1, we dissected the hippocampus from neonatal mice and cultured the pyramidal neurons. On day in vitro (DIV) 5, we transduced neurons with a lentivirus expressing an shRNA targeting all isoforms of mouse Bin1 under the RNU6 promoter; the vector also encodes an enhanced green fluorescent protein (EGFP) reporter under a separate human PGK1 (phosphoglycerate kinase 1) promoter for convenient visualization of transduced cells under a microscope (plko.1-RNU6-shBin1-PGK1-EGFP, referred to as shBin1 hereafter). On DIV11, cells were harvested for subsequent analyses. In shBin1 neurons, western blot (WB) revealed drastically reduced BIN1 protein levels (Figure 1A), demonstrating RNAi works well with high knockdown efficiency. Next, we stained neurons with an anti-MAP2 antibody and reconstructed the dendritic arbor accordingly (Figure 1B). Quantitative morphometric analyses revealed significantly reduced dendritic size in shBin1 neurons, as reflected by reduced total length of dendritic arbor and fewer intersection numbers in the Sholl analysis (Figure 1B,C). The reduction of lengths takes place at each branch order (Figure 1C); meanwhile, the numbers of primary or secondary orders of branches displayed no significant alteration (Figure S1). These data suggest that Bin1 knockdown preferentially affect branch elongation. In agreement with the reduced dendritic size, decreased MAP2 protein level was observed in shBin1 neurons (Figure 1D). The development of dendritic arbor mainly takes place in the first two weeks in cultured hippocampal neurons [24,25]. To see whether this reduction is a development defect, we postponed the RNAi knockdown by transducing neurons on DIV11 and examining the dendritic morphology on DIV18. Interestingly, we still evidenced a dendritic size decline at a comparable degree in shBin1 neurons (Figure 1E). Thus, it appears that Bin1 knockdown leads to a regression of the dendritic arbor rather than disturbing dendritic development in hippocampal neurons.
Figure 1.

Decreasing BIN1 expression in primary mouse hippocampal neurons reduced dendritic size and complexity but increased MTORC1 activity. (A) Representative WB images showing the efficiency of Bin1 knockdown in primary mouse hippocampal neurons with lentivirus-mediated RNAi. Right, a bar graph (mean + SEM) overlaid with dot plots (individual data points) showing the corresponding quantification of BIN1 bands intensity. n = 3 per group. (B) Representative immunofluorescence images and reconstructions visualizing dendritic arbor of primary hippocampal neurons. Reconstruction is based on the anti-MAP2 signal; the green fluorescence is from the co-expressed EGFP. Scale bar: 50 μm. (C) Bar graphs (mean + SEM) overlaid with dot plots (individual data points) showing the corresponding morphometric analysis of the dendritic arbor. The numbers of intersections are from the Sholl analysis of reconstructions. n = 29 per group. (D) Representative WB images and a bar graph (mean + SEM) overlaid with dot plots (individual data points) showing MAP2 protein expression in different groups. n = 3 per group. (E) Representative immunofluorescence images and reconstructions visualizing dendritic arbor of primary hippocampal neurons and the bar graphs (mean + SEM) overlaid with dot plots (individual data points) showing the analysis of the total dendritic length. The numbers of intersections are from the Sholl analysis of reconstructions. n = 21 per group. Reconstruction is based on the anti-MAP2 signal; the green fluorescence is from the co-expressed EGFP. Scale bar: 50 μm. (F) Representative WB images and a bar graph (mean + SEM) overlaid with dot plots (individual data points) showing p-RPS6KB1 and RPS6KB1 protein expression in different groups. n = 3 per group. (G) Representative WB images showing MTOR protein expression in different groups; bottom, a bar graph (mean + SEM) overlaid with dot plots (individual data points) showing the corresponding quantification of MTOR band intensities in different groups. n = 4 per group.
Neurite outgrowth requires coordinated protein synthesis, which is regulated by MTORC1. Previous studies revealed MTOR as a master signaling hub in dendritic development [26,27]. We examined the Thr389 phosphorylation of RPS6KB1 (ribosomal protein S6 kinase B1) as a proxy of MTORC1 activity. Unexpectedly, we found that Bin1 knockdown leads to a modest but significant increase of RPS6KB1 phosphorylation (Figure 1F), indicating elevated MTORC1 activity. The protein level of MTOR was unaltered by Bin1 knockdown (Figure 1G). These results support our notion that the dendritic size reduction in shBin1 neurons is not mainly from a developmental defect.
Bin1 knockdown-induced reduction of dendritic arbor size is associated with elevated autophagic flux
Macroautophagy/autophagy is a conserved catabolic process that degrades cellular contents by the lysosome. Through degrading organelles and important proteins in neurites, autophagy could negatively regulate the size of axonal or dendritic arbors [28,29]. Though MTORC1 is known to suppress autophagy, previous studies identified existence of MTOR-independent autophagy activation [30,31]. Thus, we treated neurons with various autophagy inhibitors and then assessed the change of MAP1LC3/LC3-II levels as an index of autophagic flux [32]. As expected, the AP-lysosome fusion inhibitor bafilomycin A1 (BafA1, 50 nM, 4 h) significantly increased LC3-II levels in both groups (Figure 2A). It is noteworthy that the extent of the LC3-II elevation was greater in shBin1 neurons (Figure 2A), suggesting a higher autophagic flux there. We also tried the lysosomal protease and calpain inhibitor leupeptin (50 μM, 4 h), which produced a similar trend but is less effective than BafA1(Figure 2A); we discontinued its usage in the following experiments. In addition, the protein levels of BECN1 were significantly elevated in shBin1 neurons, while that of SQSTM1/p62 (sequestome 1) declined (Figure 2B), both indicating an elevated autophagic flux. Next, we expressed a genetically encoded fluorescent probe (GFP-LC3-RFP-LC3ΔG, under a CMV promoter) for monitoring autophagic flux [33]. A significantly reduced GFP/RFP ratio was observed in shBin1 neurons (Figure 2C), indicating increased AP quenching of GFP signals. Last, blocking downstream lysosomal degradation with chloroquine (CQ, 40 μM for 4 h) led to significantly more LC3+ puncta in shBin1 neurons (Figure 2D), as well as more LC3-II protein accumulations (Figure S2), providing additional support that Bin1 knockdown did lead to autophagy elevation.
Figure 2.
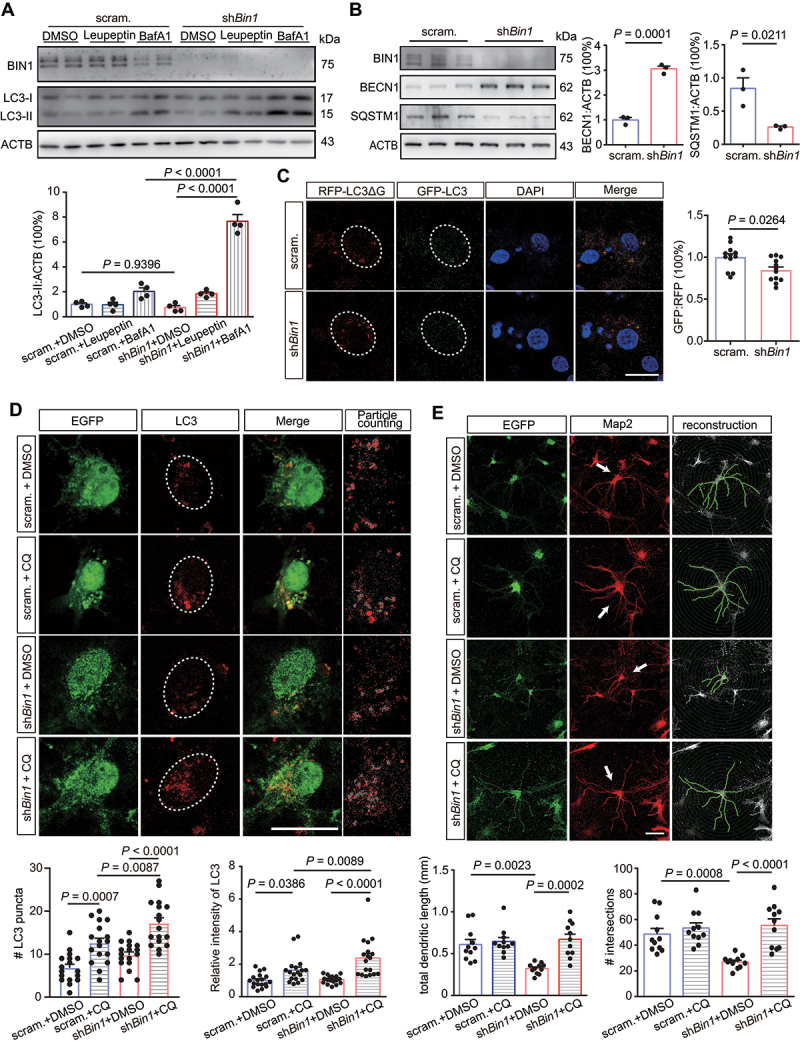
Decreasing BIN1 expression led to elevated autophagic flux and a dendritic regression phenotype in cultured hippocampal neurons. (A) Representative WB images showing the protein levels of LC3-II in mouse hippocampal neurons with DMSO, leupeptin (50 μM), or BafA1 (50 nM) treatment for 4 h before harvesting. Bottom, a bar graph (mean + SEM) overlaid with dot plots (individual data points) showing the corresponding quantification of LC3-II band intensities in different groups. n = 4 per group. (B) Representative WB images showing the protein levels of BECN1 and SQSTM1 in different groups of primary hippocampal neurons; right, corresponding bar graphs (mean + SEM) overlaid with dot plots (individual data points) showing quantification of the protein levels. n = 3 per group. (C) Representative immunofluorescence images visualizing RFP-LC3ΔG and GFP-LC3 in different groups of primary hippocampal neurons; right, a corresponding bar graph (mean + SEM) overlaid with dot plots (individual data points) showing the signal ratio of GFP/RFP. Scale bar: 20 μm. n = 12 per group. (D) Representative immunofluorescence images visualizing LC3 puncta in primary hippocampal neurons with DMSO or CQ (40 μM) treatment for 24 h before fixation, bottom panel shows the corresponding counting of LC3 puncta; bottom, a bar graph (mean + SEM) overlaid with dot plots (individual data points) showing LC3 puncta numbers in different groups. Scale bar: 20 μm. n = 18 neurons per group. (E) Representative immunofluorescence images and reconstructions visualizing the dendritic arbor of primary hippocampal neurons with DMSO or CQ (40 μM) treatment for 24 h before fixation; bottom, bar graphs (mean + SEM) overlaid with dot plots (individual data points) showing the corresponding morphometric analysis of the dendritic arbor. Reconstruction is based on the anti-MAP2 signal; the green signal is from the co-expressed EGFP. The numbers of intersections are from the Sholl analysis of reconstructions. Scale bar: 50 μm. n = 11 per group.
Does this autophagy elevation affect dendrite morphology? Treating cells with CQ for a prolonged time (24 h before fixation) largely restored the dendritic size in shBin1 neurons, while no significant effect was observed in the scrambled control group (Figure 2E). This data support autophagy elevation as a critical mediator in reducing dendritic size in BIN1 deficiency. Autophagy also interacts with oxidative stress. On one side, reactive oxygen species (ROS) is an important signal transducer sustaining autophagy in pathological conditions; on the other side, by degrading impaired mitochondria, autophagy negatively regulates ROS production [34]. In our system, shBin1 neurons didn’t generate significantly more ROS at baseline or when challenged by low dose Aβ oligomers (10 μM, 24 h) until autophagic flux was additionally blocked (Figure S3). This data demonstrate autophagy helps neurons confront Aβ-elicited ROS stress.
Specifically decreasing neuronal BIN1 expression in mouse hippocampal CA1 subfield leads to regional volume loss and declined spatial memory performance
The induction of MTOR-independent autophagy activation implies that BIN1 deficiency might also affect dendritic size in mature neurons. To test this hypothesis, we generated an adeno-associated virus (AAV, serotype 9) expressing the same BIN1-targeting shRNA as in the lentivirus; this AAV also expresses a mCherry reporter under the same Camk2a promoter for convenient visualization of transduced excitatory neurons (AAV-Camk2a-mCherry-shBin1, abbreviated as AAV-shBin1 hereafter; control mice express a scrambled shRNA, referred to as AAV-scram.). We successfully delivered the virus to the CA1 subfield of mouse hippocampus with stereotaxic intracranial injection. ~2.5 months after the injection, all mice were sacrificed for analyses. In both groups, bright mCherry signals were observed in CA1, indicating effective virus transduction and expression (Figure 3A). WB examination of the CA1 lysates revealed significantly reduced BIN1 levels in the AAV-shBin1 group, (Figure 3B), demonstrating the AAV-mediated RNAi is highly effective.
Figure 3.

Specifically decreasing neuronal BIN1 expression in hippocampal CA1 led to regional volume loss and declined spatial memory performance. (A) An illustration showing stereotaxic intracranial injection into the hippocampal CA1 region of 2-month-old mice; right, representative immunofluorescence images showing expression of mCherry under the Camk2a promoter in hippocampal CA1. Scale bar: 500 μm. (B) Representative WB strips showing protein levels of BIN1 from CA1 lysates in AAV-scram. and AAV-shBin1 groups; right, a bar graph (mean + SEM) overlaid with dot plots (individual data points) showing the corresponding quantification of BIN1 bands intensity. n = 6 per group. (C) Representative consecutive MRI images showing the morphological change of hippocampal CA1 in four-and-a-half-month-old mice from AAV-scram. and AAV-shBin1 groups. Scale bar: 2.5 mm. Bottom, bar graphs (mean + SEM) overlaid with dot plots (individual data points) showing volume change of hippocampal CA1 as well as the whole hippocampus. n = 6 per group. (D) Representative trajectory images showing the movement of mice in the Barnes maze during the probe phase; middle, line graphs showing the mistakes made (primary errors) and latencies before reaching the escape tunnel during the acquisition training phase, data were presented as mean ± SEM; bottom, bar graphs (mean + SEM) overlaid with dot plots (individual data points) showing primary errors and latencies before reaching the previous escape tunnel location during the probe phase. AAV-scram., n = 38 per group; AAV-shBin1, n = 37 per group.
In AD patients, dendritic arbor shrinkage is common and is regarded as a contributor to brain atrophy. To see whether organ-level atrophy takes place in our model, we performed T2-weighted structural imaging with a 7-Tesla MRI scanner before sacrificing the mice. After manually delineating the whole hippocampus as well as a majority of the CA1 subfield (3 slices around the injection sites), we quantified their volumes with the help of ImageJ. The total hippocampal volume displayed no change; however, the selected CA1 region displayed a modest (~10%) but significant volume reduction in AAV-shBin1 mice (Figure 3C).
We also employed the Barnes maze test to assess whether neuronal Bin1 knockdown affects hippocampus-dependent spatial cognition. Mice were first habituated and spent 5 days in the acquisition training phase, at the end of which all mice could find the escape tunnel at a similar time scale (Figure 3D), suggesting Bin1 knockdown does not significantly affect the spatial learning ability. 3 days after the final training session, mice underwent the probe trial to assess their spatial reference memory. In this session, AAV-shBin1 mice spent significantly more time before reaching the previous escape tunnel location, and they also checked more incorrect holes compared to their counterparts (Figure 3D), suggesting their reference memory is dampened. This finding is largely consistent with a previous study in which specifical BIN1 depletion in forebrain glutamatergic neurons impairs spatial learning and memory performance as revealed in the Morris water maze test [14]. We also assessed mice’s working memory with the Y-maze and the new object recognition test but observed no significant alteration (Figure S4).
Bin1 knockdown through aav-mediated RNAi in hippocampal CA1 neurons leads to dendritic regression, elevated autophagy, but not neuronal loss
The MRI-revealed regional volume decrease implies a reduction of neuritic arbors and/or neuronal loss. We thus performed Golgi-Cox staining and imaged CA1 pyramidal neurons. Reconstruction and morphometric analyses of the neurites revealed a clear and significant decrease in the dendritic arbor size and complexity in AAV-shBin1 mice; the reduction occurred to both apical and basal dendrites and at every order of branches (Figure 4A). Neuronal loss is another main reason for brain atrophy in neurodegenerative disorders. We stained the sections with an anti-RBFOX3/NeuN antibody to visualize the neuronal body and then counted them in the CA1 subfield. No significant difference was identified between the two groups (Figure 4B), suggesting Bin1 knockdown does not significantly affect neuronal survival at least at the dosage and treatment duration in our setting. Together, this data support the reduced dendritic size, rather than neuronal loss, as a main contributor to the observed CA1 atrophy in AAV-shBin1 mice.
Figure 4.

Specifically decreasing neuronal BIN1 expression in hippocampal CA1 led to dendritic size reduction and autophagy elevation, but not neuronal loss. (A) Representative Golgi staining images with corresponding reconstructions showing dendritic arbor morphology of hippocampal CA1 pyramidal neurons; right, bar graphs (mean + SEM) overlaid with dot plots (individual data points) showing the total length, the lengths of basal dendrite and apical dendrite, the lengths, and numbers of each order of branches, as well as numbers of intersections from the Sholl analysis for each CA1 pyramidal neuron in the AAV-scram. and AAV-shBin1 groups. Scale bar: 100 μm. n = 25 neurons from 6 mice for each group. (B) Representative immunofluorescence images showing RBFOX3+ cells in hippocampal CA1; right, a bar graph (mean + SEM) overlaid with dot plots (individual data points) showing the numbers of RBFOX3+ cells in the AAV-scram. and AAV-shBin1 groups. Scale bar: 100 μm. n = 6 per group. (C) Representative WB images showing protein levels of LC3-II from CA1 lysates in AAV-scram. and AAV-shBin1 groups with or without CQ treatment; bottom, a corresponding bar graph (mean + SEM) overlaid with dot plots (individual data points) showing quantification of LC3-II protein levels in different groups. n = 6 mice per group. (D) Representative WB images showing protein levels of SQSTM1 from CA1 lysates in AAV-scram. and AAV-shBin1 groups; right, a corresponding bar graph (mean + SEM) overlaid with dot plots (individual data points) showing quantification of SQSTM1 protein levels in different groups. n = 8 mice per group.
We then checked whether autophagic flux is altered in AAV-shBin1 mice. We attenuated lysosome activity by daily intraperitoneal CQ (20 mg/kg) injection for 4 consecutive days and then sacrificed mice 4 h after the last injection [32]. Because CQ is an immunosuppressive agent and displayed apparent toxicity in our mice, we treated mice for a relatively short time and used a low dose [35]. Analyzing the CA1 lysates with WB, we found that only in a Bin1 knockdown background the CQ treatment elicit significant LC3-II elevation (Figure 4C). SQSTM1 protein levels were significantly lower in AAV-shBin1 mice (Figure 4D), additionally supporting an elevated autophagy level. These data confirmed our cell culture results that BIN1 deficiency leads to autophagy elevation in hippocampal neurons.
Bin1 knockdown in hippocampal neurons activates ULK3-initiated autophagy
In the classic model, active MTORC1 phosphorylates ULK1 (unc-51 like autophagy activating kinase 1) on Ser757 and thus suppresses its activity in initiating AP formation [36]. Indeed, WB revealed increased Ser757 phosphorylation in shBin1 neurons (Figure 5A). A previous work reports phosphorylation on Ser317 by AMP-activated protein kinase (AMPK) directly activates ULK1 [36]. In our cells, Bin1 knockdown in practice decreased Ser317 phosphorylation (Figure S5), confirming ULK1 is kept inactive.
Figure 5.

Decreasing BIN1 expression in cultured mouse hippocampal neurons led to ULK3-initiated autophagy elevation. (A) Representative WB images and bar graphs (mean + SEM) overlaid with dot plots (individual data points) showing p-ULK1-Ser757 in different groups. n = 3 per group. (B) A bar graph (mean + SEM) overlaid with dot plots (individual data points) showing the transcriptional change of AP initiation-related factors after knocking down BIN1 in primary hippocampal neurons. Results are from qRT-pcr with ACTB as an internal reference. n = 3 per group. (C) Representative WB images and bar graphs (mean + SEM) overlaid with dot plots (individual data points) showing ULK1 and ULK3 expression in different groups. n = 3 per group. (D) Primary hippocampal neurons of the scrambled group and shBin1 group were transfected with siUlk1 or siUlk3, and then treated with DMSO or BafA1 (50 nM) for 4 h. Representative WB images showing the expression of LC3-II; bottom, a bar graph (mean + SEM) overlaid with dot plots (individual data points) showing the relative protein levels of LC3-II normalized to its respective ACTB. n = 3 per group. (E) Primary hippocampal neurons of the scrambled group and shBin1 group were additionally transfected with siUlk1 and siUlk3, and assessed for SQSTM1 protein levels. Representative WB images showing the expression of SQSTM1; bottom, a bar graph (mean + SEM) overlaid with dot plots (individual data points) showing the relative amount of SQSTM1 in different groups. n = 4 per group. (F) Representative confocal images showing APs visualized by mCherry-hLC3B in primary hippocampal neurons after transfection of siUlk3 or a negative control siRNA for 48 h before fixation; bottom panel, the corresponding counting of LC3 puncta; bottom, a bar graph (mean + SEM) overlaid with dot plots (individual data points) showing mCherry-hLC3B puncta numbers in different groups. Scale bar: 10 μm. n = 20 per group.
To facilitate Gene Set Enrichment Analysis, Mizushima et al. constructed the gene set MIZUSHIMA_AUTOPHAGOSOME_FORMATION which contains a panel of genes related to AP formation [37]. Examining the mRNA expression of these genes with qPCR revealed most of them significantly increased in shBin1 neurons (Figure 5B). One of them, the ULK3, attracted our most attention. Previous studies reported overexpressing ULK3, or its Drosophila homolog Aduk (Another Drosophila Unc-51-like kinase), induces AP formation independently of ULK1 [38,39]. In shBin1 neurons, the elevation of ULK3 was confirmed at protein levels (Figure 5C). To see whether this elevation affects autophagy level, we additionally decreased the expression of ULK1 or ULK3 in shBin1 neurons. As expected, siUlk1 drastically attenuated BafA1-elicited LC3-II accumulation in both groups; however, siUlk3 mitigated BafA1-elicited LC3-II accumulation only in a Bin1 knockdown background (Figure 5D). This difference suggests ULK3 is additionally recruited for AP formation when BIN1 is deficient. We next checked their effects on another autophagic marker SQSTM1 and mCherry-hLC3B-visualized APs. Similarly, only in shBin1 neurons, siUlk3 significantly increased SQSTM1 protein levels (Figure 5E), and reduced the amounts of APs (Figure 5F). These results confirmed the increased reliance on ULK3 for autophagy initiation in shBin1 neurons.
Bin1 knockdown promotes nuclear translocation of the transcription factor EB (TFEB), which upregulates autophagy and lysosomal genes including ULK3
TFEB is a master regulator of the autophagy-lysosomal pathway, whose translocation to the nucleus induces transcription of a batch of autophagy and lysosomal genes [40]. After decreasing BIN1 expression with RNAi in Neuro-2A cells, we separated cytosolic and nuclear fractions and examined TFEB protein levels. WB revealed significantly increased TFEB distribution in the nuclear fraction (Figure 6A). In agreement with the Neuro-2A result, Bin1 knockdown in primary hippocampal neurons also led to TFEB nuclear translocation (Figure 6B), while the protein level of TFEB remained unchanged (Figure S5). TFEB localization is regulated by its phosphorylation status. A recent study reported phosphorylation of TFEB by AKT represses its nuclear translocation in a MTORC1-independent manner [41]. In hippocampal neurons, Bin1 knockdown dramatically reduced phosphorylation of AKT on Ser473 (Figure 6C), indicating decreased AKT activity. Treating cells with SC79, an AKT agonist, significantly reduced TFEB nuclear localization in shBin1 neurons (Figure 6B). SC79 also canceled the elevation of ULK3 by Bin1 knockdown, further supporting AKT as an upstream regulator of TFEB activity (Figure 6D). In addition, SC79 significantly increased the total dendritic length and the dendritic arbor complexity in shBin1 neurons (Figure 6E). These data suggest an AKT-TFEB signaling chain acts as an upstream regulator of autophagy genes including ULK3 when BIN1 is deficient.
Figure 6.

Decreasing BIN1 expression promoted the nuclear translocation of TFEB, which promoted expression of autophagy and lysosomal genes. (A) Representative WB images (left panel) and bar graphs (mean + SEM) overlaid with dot plots (individual data points) (middle and right panels) showing TFEB protein levels in the cytoplasm or nucleus of neuro-2A cells in different groups. n = 3 per group. (B) Representative immunofluorescence images showing the distribution of TFEB in hippocampal neurons with indicated treatments; right, a bar graph (mean + SEM) overlaid with dot plots (individual data points) showing the percentage of area occupied by TFEB in the nucleus in different groups; scale bar: 10 μm. n = 10 per group. (C) Representative WB images (upper panel) and a bar graph (mean + SEM) overlaid with dot plots (individual data points) (bottom panel) showing p-AKT-Ser473 and AKT protein levels in different groups. n = 3 per group. (D) A bar graph (mean + SEM) overlaid with dot plots (individual data points) showing the relative transcript levels of ULK3 in primary hippocampal neurons with indicated treatments. Transcripts were examined by qRT-pcr with ACTB as an internal reference. n = 3 per group. (E) Representative immunofluorescence images and the corresponding reconstructions visualizing the dendritic arbor of primary hippocampal neurons with indicated treatments; right, bar graphs (mean + SEM) overlaid with dot plots (individual data points) showing the corresponding morphometric analysis of the dendritic arbor. Reconstruction is based on the anti-MAP2 signal; the green fluorescence is from the co-expressed EGFP. The numbers of intersections are from the Sholl analysis of the reconstructions. Scale bar: 50 μm. n = 12 per group. SC79 treatment is 10 μM for 24 h before fixation or harvest in B, D, and E.
ULK3 inhibitor SU6668 mitigated Bin1 knockdown-induced dendritic size reduction, hippocampal volume loss, and hippocampus-dependent cognitive impairment
The increased reliance on ULK3 for autophagy initiation provides a chance for relatively cell-selective intervention. SU6668, also known as TSU-68, is an inhibitor for multiple receptor tyrosine kinases. In several clinical trials, it was evaluated as a potential anticancer agent and proved generally safe [42,43]. Recent studies reported SU6668 could effectively inhibit the catalytic activity of ULK3 [44,45]. Treating hippocampal neurons with 5 μM SU6668 for 6 consecutive days, the Bin1 knockdown-induced dendritic size reduction were almost completely blocked (Figure 7A).
Figure 7.

Inhibiting ULK3 activity with SU6668 mitigated Bin1 knockdown-induced dendritic size reduction, hippocampal volume loss, and cognitive impairment. (A) Representative immunofluorescence images and the corresponding reconstructions visualizing the dendritic arbor of primary hippocampal neurons with indicated treatment. SU6668 treatment is 5 μM once a day for 6 days before fixation; bottom, bar graphs (mean + SEM) overlaid with dot plots (individual data points) showing the corresponding morphometric analysis of the dendritic arbor. Reconstruction is based on the anti-MAP2 signal; the green signal is from the co-expressed EGFP. The numbers of intersections are from the Sholl analysis of reconstructions. Scale bar: 50 μm. n = 15 per group. (B) Representative immunofluorescence images showing the intensity of ULK3 in the hippocampal CA1 subfield of different groups of mice; bottom left, a bar graph (mean + SEM) overlaid with dot plots (individual data points) showing the corresponding immunofluorescence intensity quantifications. Scale bar: 50 μm. n = 6 mice per group. (C) Heat maps showing representative trajectories of mice in the Barnes maze during the probe phase; bottom left, line graphs showing the latencies and mistakes made (primary errors) before reaching the escape tunnel during the acquisition training phase; bottom right, bar graphs (mean + SEM) overlaid with dot plots (individual data points) showing the latencies and primary errors before reaching the previous escape tunnel location during the probe phase. n = 18 mice per group. (D) Representative consecutive MRI image sections showing the morphology of hippocampal CA1 in four-and-a-half-month-old mice from different groups. Scale bar: 5 mm; top, a bar graph (mean + SEM) overlaid with dot plots (individual data points) showing volume change of hippocampal CA1. n = 6 mice per group.
As in primary cultures, AAV-shBin1 mice displayed significantly elevated ULK3 signals in the CA1 region (Figure 7B). 2 weeks after the intracranial injection, mice were administered drinking water containing SU6668 (100 mg/kg, replenished every 3 days) for 5 weeks. In the Barnes maze test, AAV-shBin1 mice receiving SU6668 (AAV-shBin1-SU6668) spent significantly less time reaching the previous escape tunnel location, while mistakes made in the probe trial displayed no significant difference (Figure 7C). After the behavioral test, MRI were performed and significantly attenuated regional volume loss around the injection sites were evidenced in AAV-shBin1-SU6668 mice (Figure 7D).
Additional ULK3 knockdown in AAV-shBin1 mice mitigated CA1 regional volume loss and cognitive impairment
SU6668 is an inhibitor targeting multiple receptor tyrosine kinases including endothelial growth factor receptor-2, platelet-derived growth factor receptor, and fibroblast growth factor receptor [46,47]. It is possible that non-ULK3 targets in practice affect hippocampal volume and spatial memory performance. To overcome this limitation, we generated another AAV expressing an shRNA targeting ULK3 driven under the Camk2a promoter (rAAV-Camk2a-5’miR-30a-shUlk3-3’miR-30a-WPREs, abbreviated as AAV-shUlk3). About 2 months after delivering AAV-shUlk3 together with AAV-shBin1 to the CA1 region, we evaluated the mice’s hippocampus-dependent cognition, and the CA1 volume, and lastly sacrificed mice for detecting the levels of relevant proteins. With the CA1 lysates, WB revealed significantly reduced BIN1 and ULK3 in the AAV-shBin1-shUlk3 group, indicating both AAV-shUlk3 and AAV-shBin1 work effectively (Figure 8A). Compared to the AAV-shBin1 group, the levels of LC3-II were significantly reduced in AAV-shBin1-shUlk3 mice, and SQSTM1 showed a significant increase (Figure 8A), reflecting a lowered autophagy level. In the Barnes maze, comparing to the AAV-shBin1 mice, AAV-shUlk3-shBin1 mice spent significantly less time reaching the previous escape tunnel location (Figure 8B), indicating an improved memory performance. Interestingly, Ulk3 knockdown in the control mice (AAV-shUlk3 mice) displayed a trend of higher latency than AAV-scram. mice (Figure 8B), supporting decreasing ULK3 only works in a BIN1 deficiency background. For the number of mistakes made in the probe trial, AAV-shBin1-shUlk3 mice displayed a trend of reduction, but a significant threshold was not reached (Figure 8B). Like SU6668, the additional Ulk3 knockdown significantly ameliorated the regional volume loss in hippocampal CA1 only in a Bin1 knockdown background (Figure 8C). Lastly, WB examination of CA1 lysates revealed significantly increased ULK3 protein levels in AAV-shBin1 mice (Figure 8D). Taken together, these data support the elevation of ULK3 as a critical downstream event of Bin1 knockdown, as well as a potentially effective interventional target to confront the adverse effects from BIN1 loss.
Figure 8.

Additional Ulk3 knockdown in aav-shBin1 mice mitigated CA1 regional volume loss and cognitive impairment. (A) Representative WB images (upper panel) and a bar graph (mean + SEM) overlaid with dot plots (individual data points) (right) showing BIN1, ULK3, SQSTM1 and LC3II protein expression in the different groups. n = 6 mice per group. (B) Heat maps showing representative trajectories of mice in the Barnes maze during the probe phase; bottom, line graphs showing the latencies and mistakes made (primary errors) before reaching the escape tunnel during the acquisition training phase; bar graphs (mean + SEM) overlaid with dot plots (individual data points) showing the latencies and primary errors before reaching the previous escape tunnel location during the probe phase. n = 16 mice per group. (C) Representative consecutive MRI image sections showing the morphology of hippocampal CA1 subfield in four-month-old mice from different groups. Scale bar: 2.5 mm; right, a bar graph (mean + SEM) overlaid with dot plots (individual data points) showing volume change of the hippocampal CA1 subfield. n = 7 mice per group. (D) Representative WB images (upper panel) and a bar graph (mean + SEM) overlaid with dot plots (individual data points) (bottom panels) showing BIN1 and ULK3 protein expression in the different groups. n = 5-6 mice per group. (E) A diagrammatic illustration showing the proposed molecular mechanism underneath Bin1 knockdown-induced dendritic regression, and hippocampal regional atrophy at the organ level. Under physiological conditions, AKT maintains TFEB in the cytoplasm through phosphorylation; when BIN1 is deficient, AKT is deactivated, and TFEB thus translocates to the nucleus, where it increases the transcription of a myriad of autophagy and lysosomal genes including ULK3, whose elevation initiates autophagy independently of MTOR. This autophagy elevation drives CA1 volume loss and hippocampus-dependent memory impairment, supposed to be from reducing dendritic arbor size.
Collectively, as illustrated in Figure 8E, we propose a model that neuronal BIN1 deficiency decreases AKT activity and therefore promotes TFEB translocation to the nucleus, where it drives expression of a batch of autophagy and lysosomal genes including ULK3; ULK3 then initiates neuronal autophagy in a MTORC1-insensitive manner and keeps it at a high level with the coordination of other upregulated autophagy genes; this autophagy activation is supposed to underlie the dendritic regression phenotype observed in primary cultures as well as in mature CA1 neurons, which manifests as regional volume loss at the organ-level as revealed by the MRI. This hippocampal structural impairment is also associated with declined spatial memory performance.
Discussion
The most widely employed diagnosis criteria for AD is clinical syndrome-based [48]. GWAS by nature associates risk alleles with cognitive impairment, not with Aβ or MAPT/Tau pathology. Thus, Aβ- and MAPT/Tau-independent mechanisms must be accounted for when trying to connect risk factors with cognitive disturbance. In the present study, we found Bin1 knockdown in hippocampal neurons led to dendritic regression and impairs hippocampus-dependent spatial memory. In AD patients, a reduction of dendritic size is consistently observed [49–51]. Though this reduction is generally accepted as an important contributor to brain atrophy, it is almost always accompanied by neuronal loss [52,53], making evaluating their respective contribution difficult. Here, we report specifical Bin1 knockdown in CA1 excitatory neurons produces a significant regional volume loss at the organ level, which is associated with reduced dendritic arbor size but not neuronal loss. This finding thus revealed a closer association between dendritic size reduction and hippocampal atrophy.
The present work found an already established dendritic arbor is still at risk when BIN1 is deficient. Since the major neuronal isoform of human BIN1 was reported to decrease in AD patients, our finding has potential clinical relevance. In shBin1 neurons, a significantly elevated autophagic flux was tightly associated with the dendritic size reduction. Data from the CQ treatment support autophagy elevation as a potential mechanism beneath dendritic regression, though a conclusive causal relationship has not yet been drawn because CQ treatment also generate non-autophagy disturbance. In differentiated SH-SY5Y cells, a siRNA specifically targeting BIN1-iso1 significantly elevated the autophagy level (Figure S6), suggesting reduction of BIN1-iso1 might produce a similar dendritic defect in human neurons. However, it needs to be noted that SH-SY5Y is a neuroblastoma cell line, and we found the supposed BIN1-iso1 encoding gene cloned from it lacks an exon (exon 16) that encodes a part of the clathrin and adapter binding (CLAP) motif (Data File S1). The neuronal-specific CLAP motif is required for BIN1 to bind AP2 and clathrin; lack of exon 16 might affect BIN1’s function in the formation and transport of clathrin-coated vesicles, especially during endocytosis. This lack of a genuine BIN1-iso1 weakens the strength of data from SH-SY5Y. In the future, iPSC-derived human neurons could be a better model, in which we could manipulate the expression of a specific BIN1 isoform and then evaluate the functional consequences. Meanwhile, clinical studies may assess whether BIN1-iso1 levels are associated with dendritic size at the cellular level.
Autophagy is activated in stressful situations and is usually regarded as a protective cellular adaptation. The present work draws an association between autophagy elevation and declined hippocampus-dependent spatial memory performance, which appears somewhat counterintuitive. We are uncertain whether dendritic regression is also a kind of adaptation. By reducing exposure to extracellular toxins like Aβ or glutamate, this morphological alteration may in fact promote neuronal survival. This idea is somewhat supported by our observation that shBin1 neurons seem to employ elevated autophagy to control Aβ-induced ROS elevation (Figure S2), in which increased mitophagy and reduced dendritic Aβ exposure are potential explanations. Collectively, we prefer to interpret the elevated autophagy as a cellular adaption with cost. The cell may adapt for its own survival, but learning and memory require not only live neurons but functional intact ones, with correct and sufficient synaptic connections, and there are situations they do not align well. In AD, autophagy induction was reported to increase while the maturation of APs and their transport were found impeded [54,55]. A strategy focusing on enhancing late-stage autophagic flux, combined with a way of preserving the intact dendritic/axonal arbor, might help to slow the disease course.
The concurrent activation of MTORC1 and autophagy by Bin1 knockdown is a surprise. With different model systems, researchers also reported this kind of coactivation. In mouse oocytes, fertilization-induced autophagy activation continues when MTOR is additionally activated by applying the protein synthesis inhibitor cycloheximide [56,57]. The present work identified ULK3 as an additional autophagy initiator when BIN1 expression is decreased. Unlike ULK1, ULK3 seems constitutively active and is not affected by MTORC1-mediated phosphorylation [58]. Two recent studies reported increasing ULK3 expression is sufficient to induce autophagy activation in fibroblasts [38,59]. The recruiting of ULK3 for additional autophagy initiation suggests an attractive potential drug target. As ULK3 is not the default autophagy initiator, ULK3 inhibition should not suppress global autophagy. Interestingly, a recent study reported that ULK3-dependent GLI1 activation reduces baseline autophagy activity in the long term through DNA methylation-mediated transcriptional repression of MAP1LC3 expression [60]. Other genes in the autophagy-lysosomal pathway might also undergo this epigenetic modification. This finding draws a more complicated picture of ULK3’s role in autophagy regulation. Cellular senescence is another way of stress response. It was found overexpressing ULK3 in human fibroblasts induces mitotic senescence [38], additionally supporting ULK3 as a stress-responsive gene and a potential drug target. Compared to ULK3, upstream regulators such as AKT and TFEB are not ideal interventional targets because of their potential global disturbance. In addition, it is possible that BIN1 regulates autophagy also through TFEB-independent mechanisms. BIN1 is known to suppress MYC/c-MYC activity, and a recent study reported that MYC transcriptionally activates ULK3 expression in bladder cancer cell lines T24 and BK10 [61]. Thus, MYC is another possible route mediating BIN1’s autophagy effect. The ULK3 inhibitor SU6668 is a drug with proven safety by previous clinical trials [42,43]. In the present work, both SU6668 administration and Ulk3 knockdown significantly mitigated the adverse effects of neuronal Bin1 knockdown, supporting ULK3 is an important effector downstream of BIN1. SU6668 inhibits multiple tyrosine kinases and may produce unwanted global disturbance; highly selective ULK3 inhibitors could overcome this limitation with future drug development.
Reduced BIN1 expression was also reported in carcinomas such as breast cancer, prostate cancer, melanoma, astrocytoma, and neuroblastoma [62], where BIN1 loss is regarded to favor tumor progression and is a marker for cancer chemoresistance. Meanwhile, upregulating autophagy to survive an unfriendly microenvironment is a common strategy for tumor cells, which encourages the development of additional autophagy inhibition as an anti-cancer strategy [63]. Elevated ULK3 expression was evidenced in multiple kinds of carcinomas, where it increases the oncogenicity according to a very recent study [64]. Therefore, the inverse correlation between BIN1 and ULK3 appears to also exist in some cancer scenarios, and breaking the BIN1-ULK3 axis might also be effective there.
Materials and methods
Reagents and antibodies
Leupeptin (SG2012) and SC79 (SF2730) were purchased from Beyotime Biotechnology. Bafilomycin A1 was purchased from Sangon Biotech (A601116). Chloroquine was purchased from Beijing Vokai Biotechnology (A31639) and Macklin (C843545). SU6668 was purchased from Macklin (N872395), Beyotime Biotechnology (SF5301), and Yuanye Bio-Technology (S96560).
The primary antibodies used for WB and immunofluorescence were: anti-BIN1 (Proteintech 14,647–1-AP), anti-TFEB (Proteintech 13,372–1-AP), anti-ACTB (Proteintech, HRP-60008), anti-LC3 (Proteintech 14,600–1-AP), anti-MTOR (7C10; Cell Signaling Technology, 2983), anti-phospho-RPS6KB1/p70 S6 Kinase (Thr389, 108D2; Cell Signaling Technology, 9234), anti-RPS6KB1/p70 S6 Kinase (Cell Signaling Technology, 9202), anti-RBFOX3/NeuN (abcam, ab177487), anti-MAP2 (Sigma-Aldrich, M9942), anti-MAP2 (Proteintech 17,490–1-AP), anti-ULK3 (ImmunoWay Biotechnology, YT4820), anti-ULK1 (Affinity, Ab-DF7588), anti-phospho-ULK1 (Ser317; Affinity, Ab-AF2301), anti-phospho-ULK1 (Ser757; Affinity, Ab-AF4387), anti-AKT (Proteintech 10,176–2-AP), anti-phospho-AKT (S473; Proteintech 66,444–1-lg), and anti-H3 (ABclonal, A2348). The secondary antibodies used for WB and immunofluorescence were: HRP-conjugated Goat anti-Mouse IgG (Proteintech, SA00001–1), HRP-conjugated Goat anti-Rabbit IgG (Proteintech, SA00001–2), CoraLite488-conjugated Goat anti-Mouse IgG (Proteintech, SA00013–1), CoraLite 488-conjugated Goat anti-Rabbit IgG (Proteintech, SA00013–2), Rhodamine (TRITC)-conjugated Goat anti-Mouse IgG (Proteintech, SA00007–1), Rhodamine (TRITC)-conjugated Goat anti-Rabbit IgG (Proteintech, SA00007–2), and Alexa Fluor™ Plus 405-conjugated Goat anti-Rabbit IgG (Invitrogen, A48254).
RNA interference, lentivirus, and AAVs
The siRNAs were all synthesized by Genepharma with sequences shown below:
siBin1: 5”-GCUCAAUCAGAACCUCAAUGAU-3”;
siUlk1: 5”-GAGCAAGAGCACACGGAAA-3”;
siUlk3: 5”-GGUUAUUUCUAAAGUUAGA-3”;
To reduce BIN1 expression in cultured primary neurons, we constructed a lentivirus vector expressing an shRNA targeting sequence shared by all isoforms of mouse BIN1 under the RNU6 promoter as well as an EGFP reporter under a separate PGK1 promoter for convenient visualization of successfully transduced cells under a microscope (plko.1-RNU6-shBin1-PGK1-EGFP); the control virus expresses a scrambled sequence of shBin1 (plko.1-RNU6-scramble-PGK1-EGFP). Both lentiviruses were packaged and produced by Hanbio.
For visualization of APs in primary neurons, we engineered the plko.1 vector to include a mCherry-hLC3B reporter immediately upstream of the EGFP element (plko.1-shBin1-PGK1-mCherry-hLC3B-EGFP, abbreviated as shBin1-hLC3B), and used plko.1-scramble-PGK1-mCherry-hLC3B-EGFP (abbreviated as scram-hLC3B) as the control. mCherry-hLC3B-pcDNA3.1 plasmid is a gift from the David Rubinsztein lab (Addgene 40,827) [65]. Both lentiviruses were packaged and produced by OBiO Technology. For monitoring autophagic flux, we generated a lentivirus expressing the GFP-LC3-RFP-LC3ΔG reporter under the CMV promoter in a pLVX backbone (pLVX-GFP-LC3-RFP-LC3ΔG). The GFP-LC3-RFP-LC3ΔG reporter is subcloned from the plasmid pcDNA3-GFP-LC3-RFP-LC3ΔG, which is a gift from the Noboru Mizushima lab (Addgene 168,997) [33]. This lentivirus was packaged and produced by abm.
To reduce neuronal BIN1 expression in hippocampal CA1, we employed a rAAV2/9 Mir30-based vector expressing the same shRNA targeting all isoforms of mouse BIN1, as well as a mCherry reporter, both under the Camk2a promoter for specifical expression in excitatory neurons (rAAV-Camk2a-mCherry-5’miR-30a-shBin1-3’miR-30a-WPREs, abbreviated as AAV-Camk2a-mCherry-shBin1 or AAV-shBin1); rAAV-Camk2a-mCherry-5’miR-30a-scramble-3’miR-30a-WPREs (abbreviated as AAV-Camk2a-mCherry-scramble or AAV-scram.) was used as the control. The two AAVs were packaged by BrainVTA. The AAV for Ulk3 knockdown (abbreviated as AAV-shUlk3) used the same vector but has no mCherry reporter and was packaged and produced by Hanbio.
Culture of primary hippocampal neurons
The primary hippocampal and cortex neurons were isolated from newborn (P0) mice or mice at E16–18 with a standard procedure reported before [66]. Briefly, mice were disinfected with 75% alcohol before sacrifice and dissection; in cold DMEM (Thermo Scientific, C11995500BT), the meninges were carefully and gently peeled off with forceps, and the hippocampus and the cortex were identified and dissected out; the hippocampus and cortex were then cut up and digested in a solution containing 1 mg/ml DNase (Merck, D4513) and 2 mg/ml papain (Sangon Biotech, 9001-73-4), filtered through a Falcon® 40-µm cell strainer (Corning 352,340); cells were then transferred to Neurobasal™-A (Thermo Scientific 10,888,022) containing 2% B-27™ (Thermo Scientific 17,504,044), 1% penicillin-streptomycin (Thermo Scientific 15,140,122), and 2 mM L-glutamine (Thermo Scientific 35,050,061). Neurons were cultured in Dishes or plates coated with 0.01 mg/ml poly-D-lysine (Merck, P6407) for 5 days prior to transfection or lentivirus transduction.
Lentivirus transduction
The lentivirus was introduced into the primary hippocampal neurons from 5 days in vitro (DIV5). 24 h after the transduction, the old medium containing the virus were removed and replaced by fresh medium. On DIV11, neurons were harvested for the subsequent immunofluorescence, real-time quantitative reverse transcription PCR (qRT-PCR), or WB analyses.
Mouse maintenance, separation of brain tissue
The 8-week-old wild-type C57BL/6J mice were purchased from the Animal Core Facility of Nanjing Medical University. All mice underwent a 12-hour light/dark cycle under appropriate ambient temperature and humidity, with good ventilation, and ad libitum access to food and water. Mice were injected with AAV-Camk2a-mCherry-shBin1 or AAV-Camk2a-mCherry-scramble in bilateral hippocampal CA1 and fed for 8 weeks before the sacrifice. Mice were anesthetized by intraperitoneal injection of 30 ml/kg phenobarbital (Merck, P3761). After perfusion with cold physiological saline, the skull was opened and the whole brain tissue was collected. All tissues were frozen in liquid nitrogen and stored at −80°C before use.
Stereotaxic intracranial injection
Mice were anesthetized and fixed in a stereo locator; the hair near the injection site was cut off and disinfected twice with betadine. Carefully cut the skin along the sagittal slit with disinfected scissors to expose the skull surface. For introduction of AAVs into the bilateral hippocampal CA1, 0.5 µl virus for each side was injected at the following coordinates: 2.5 mm behind bregma, 1.0 mm off, and 1.9 mm deep. The infusion rate was 0.1 µl/min with a Hamilton 33 G syringe needle, which remained at the injection site for 5 minutes after the infusion to prevent virus spillover. After the injection, mice were placed in an isolated environment to facilitate their recovery. All experiments were performed 8–10 weeks after the injection.
Behavioral tests
Mice behavioral images were captured with a computer-connected digital camera (TopScan CleverSys, USA). The test mice were acclimated to the room for 2 hours before a behavioral test. Learning and memory abilities were assessed with the Barnes Maze, the Y Maze, and the New Object Recognition (NOR) test.
Y-maze
The Y maze was employed to evaluates short-term spatial memory in mice by comparing the numbers of times they enter the new arm with other arms and the length of stay. The device used in this experiment has three interconnected arms and an Angle of 120 degrees between two adjacent arms. Each arm has the same size and the length, width and height are 29 cm × 8 cm × 15 cm. To give the mice visual stimuli, each arm was labeled with a different pattern and randomly named as the starting arm, novelty arm, or other arm. The experimental process is mainly divided into two parts: the adaptation stage and the test stage. During the adaptation period, the novel arm was separated from the other two arms by a baffle. At this time, the mice could only move in the initial arm and other arms, and the free movement time of each mouse was 5 min. After the adaptation period of each mouse, the excreta of the mice in the experimental equipment were wiped with 75% alcohol before the next experiment. At the beginning of the test phase, the novel arms were opened first, and the mice could move freely within the three arms. The test time for each mouse was 5 min.
Barnes maze
Barnes maze is used to evaluate long-term spatial memory in mice [67]. The behavioral test consists of five days of training and one day of testing. The experimental device is a disk with a diameter of 90 cm. There are 22 holes evenly distributed at 5 cm of the edge of the disk, of which only one hole is equipped with an escape box. A bright light source was placed above the platform, forcing the mice to explore and hide in the box. During the training period of 5 consecutive days, the mice were trained once a day. If the mice did not enter the escape box within 300 s, the mice were guided into it, and the mice were removed and put back into the cage 30 s later. The tests were conducted three days apart after the training phase. During the test period, each mouse was active for 300 s. Software is used to record data in real time during behavioral processes. Finally, the time when mice entered the escape box and the Numbers of times, they sniffed the wrong hole were counted.
NOR test
NOR test was conducted in an open-air installation measuring 40 cm × 30 cm × 25 cm in length, width, and height. Use objects that are similar in height and volume but different in shape and appearance. During the habituation period, the animals were allowed to explore an environment with two identical objects for 5 min. After the adaptation period of each mouse, the excreta of the mice in the experimental equipment were wiped with 75% alcohol before the next experiment. In the next stage, the mice were exposed to a familiar environment, one of the objects was replaced with a new object, and the mice were allowed to roam freely for 5 min. Analysis of variance records and analyzes the percentage of time and discrimination index spent exploring each object. The discriminant index is calculated as (time to explore the new object/total time).
ROS detection
ROS levels were evaluated with a DCFHDA-based Reactive Oxygen Species detection kit (Beyotime, S0033S) according to the manufacturer’s manual. Briefly, after removing the cell culture medium, appropriate volume of diluted DCFHDA was added and cells were then incubated in the incubator at 37°C for 20 min. Cells were washed three times with serum-free culture medium to fully remove the DCFHDA that did not enter cells before digestion with 0.25% pancreatin. Cells were then collected and detected with a Varioskan Flash microplate reader (Thermo Scientific, USA). The excitation wavelength of 488 nm and the emission wavelength of 525 nm were used for the detection.
Cell lines culture and transfection
Neuro-2A and immortalized mouse hippocampal HT22 cell line (Wuhan Pricella Biotechnology, CL-0697) were cultured in DMEM high-glucose medium containing 10% fetal bovine serum with penicillin and streptomycin. Transfections were performed with Lipofectamine™ 3000 (Invitrogen, L3000075) when cells reach ~ 70% confluence. Transfected cells were cultured in the incubator (37°C, 5% CO2) for additional 72 h before harvest.
Immunofluorescence
Tissues were fixed with 4% paraformaldehyde for 24 h, dehydrated with 20% sucrose in phosphate-buffered saline (PBS; Sangon Biotech, E607008) for 24 h, and then 30% sucrose in PBS for ~24 h until they sink to the bottom. Tissues were embedded in OCT glue (Sakura Finetek, 4583), sliced at a thickness of 20 μm with a CM1950 cryostat microtome (Leica Biosystems, Germany), and lastly mounted on gelatin coated slides. 0.1% Triton X-100 (Sangon Biotech, A600198) for 1 h was applied for tissue permeabilization, and then tissues were blocked in 5% BSA (Sangon Biotech, A600332). For cultured cells, the permeabilization time is 10 min. For primary antibodies, samples were incubated at 4°C overnight; for secondary antibodies, samples were incubated at room temperature for 2 h.
WB
RIPA buffer (Beyotime, P0013B) with a protease inhibitor cocktail (Beyotime, st506) and a phosphatase inhibitor cocktail (Roche 04,906,837,001) were used for cell lysis and protein extraction. For tissue homogenization, cells or tissue lysate was placed in an ice shaker at 4°C for 30 min to fully lysate. With 13,700 × g centrifugation, supernatant was collected and protein quantification was performed using Enhanced BCA Protein Assay Kit (Beyotime, P0010S). The SDS-PAGE Sample Loading Buffer 5X (Beyotime, P0015) was added to the remaining protein lysate, and the protein was heated at 95°C for 5 min. Thirty-μg protein samples were separated by electrophoresis at 80 v, 30 min, 120 v, 2 h, and then transferred to Immobilon®-PSQ PVDF Membrane (Merck, ISEQ08100), blocked with 5% dry skim milk, incubated with different primary antibodies in a shaking bed at 4°C overnight, and washed with TBST which composed of TBS (Sangon Biotech, A510025–0001) and 0.1% Tween 20 (Sangon Biotech, A600560) for 3 times, 10 min each time. After incubation for 1 h, the corresponding HRP-conjugated secondary antibody was washed with TBST 3 times, 10 min each time. When there are too many samples to fit in a single gel but are needed to be analyzed in one batch, we run two gels and the following procedures alongside to enable a cross comparison between groups on different gels applicable.
Cytosolic and nuclear protein extraction
Nuclear protein and cytoplasmic protein extraction kit purchased from Beyotime. The cell precipitates were suspended in cytoplasmic protein extraction reagent A added with PMSF and shaken at 4°C for 30 min. Add 10 μl of cytoplasmic protein extraction reagent B, shake violently, centrifuge at 4°C 12000 -16,000 × g for 5 min, absorb the supernatant into the pre-cooled plastic tube as the extracted cytoplasmic protein. For precipitation, the remaining supernatant was completely sucked up and 50 μl nuclear protein extraction reagent added with PMSF was added. Shake violently until the cells precipitate completely suspended and disperse. Centrifuge at 4°C 12000 -16,000 × g for 10 min. Immediately absorbing supernatant into a pre-cooled plastic tube is the extracted nuclear protein.
qRT-PCR
RNAiso Plus (Takara Bio, 9109) was used to extract total RNA from cells or tissues. 4× EZscript Reverse Transcription Mix II (with gDNA Remover) kit (EZBioscience, EZB-RT2GQ) and 2× SYBR Green qRT-PCR Master Mix (EZBioscience, A0001-R1) were used for qRT-PCR with the following settings: 95°C for 5 min, 60°C for 30 s for 40 cycles, 95°C for 10 s; Actb was employed as an internal reference; the delta-delta Ct method was used to calculate the relative fold of target genes. All primers were synthesized by Sangon Biotech. Sequences of all primers were listed in Table S1.
Golgi staining
Mouse brains were sectioned at a thickness of 100 μm with a CM1950 cryostat microtome (Leica Biosystems, Germany) and then mounted onto gelatin-coated slides. The slices were stained with the FD Rapid GolgiStain™ Kit (FD NeuroTechnologies, PK401) according to the manufacturer’s instructions. The radial dendrite layer in CA1 region was imaged and quantified.
Magnetic resonance protocol
For each mouse, a total of 22 scans covering the whole mouse brain were acquired on a 7-Tesla BioSpin MRI GmbH Spectrometer (Bruker, Germany). The mice were first anesthetized with 1.5% (v/v) isoflurane and then placed in the apparatus. The coronal/horizontal T2-weighted (T2W) MRI scans parameters are as follows: spin echo, repetition time (TR) = 2500 ms, echo time (TE) = 35 ms, matrix dimensions = 256 × 256, flip angle = 90 degrees, field of view = 2 cm × 2 cm, slice thickness = 0.7 mm. The acquisition time is 10 min for each mouse. Among the 22 scanned images, the hippocampal CA1 region typically occupies 4 slices, and we employed only the first 3 sections because the virus diffusion is poor and variable in the 4th section. The CA1 region and the whole hippocampus were manually delineated and quantified for their volumes with the help of ImageJ. The CA1/CA2 border is determined by drawing a line perpendicular to the end part of the stratum lacunosum-moleculare, while the CA1/subiculum border is determined by drawing a line along the hippocampal fissure. The head is bounded by the dorsal third ventricle. The upper part is bounded by the junction of the striatum and the hippocampus.
Image analysis
A DM4000 B fluorescence microscope (Leica Biosystems, Germany) and a LSM 710 laser scanning confocal microscope (Zeiss, Germany) were employed to image all cell slides or tissue sections. For each group, at least 3 slides were randomly imaged. Images were analyzed by ImageJ with the SNT plugin for dendritic length reconstruction and quantifications. Dendritic complexity was presented as the number of intersections from the Sholl analysis, which is performed with the Sholl Analysis plugin; all measurements were centered on the soma and proceeded with a 10 μm interval. For immunostaining or fluorescence intensity analysis, ~3 regions of interest (ROIs) with the fixed area were randomly selected for each neuron from high magnified images; averaged intensities of each ROI were employed for comparison. For the analysis of the LC3 puncta, we used “Threshold” tool to adjust the image, then used the “Analyze Particles” tool to get the results and a typical punctum has a width of 10–70 pixel (1.32–9.24 μm).
Study approval
All animal experiments were conducted following the international standards on animal welfare and the guidelines of the Institute for Laboratory Animal Research of Nanjing Medical University (approval no. IACUC: 2201039 and IACUC:1812054-4).
Statistical analyses
All data were statistically analyzed by GraphPad Prism. Data were expressed as Mean + SEM unless otherwise noted. Two-tailed Student’s t-test was performed for comparing two groups of data, and two-way ANOVA followed by Tukey’s post hoc test was employed for comparisons among 4 or more groups. p < 0.05 was considered statistically significant.
Supplementary Material
Acknowledgements
We thank Dr. Jun Qin for kindly providing the plko.1-GFP lentiviral vector, and Dr. Yi Fan for providing reagents and advice on the Golgi-Cox impregnation.
Funding Statement
The work was supported by the China Postdoctoral Science Foundation [2023T160070 and 2023M740372]; Nanjing Medical University [NMUR2019011]; Natural Science Research of Jiangsu Higher Education Institutions of China [21KJA310005]; Postdoctoral research funding from Changzhou Medical Center, Nanjing Medical University [CZKYCMCP202302].
Disclosure statement
No potential conflict of interest was reported by the author(s).
Data availability statement
The datasets used and analyzed during the current study are available from the corresponding author on reasonable request.
Supplementary material
Supplemental data for this article can be accessed online at https://doi.org/10.1080/15548627.2024.2393932
References
- [1].Sakamuro D, Elliott KJ, Wechsler-Reya R, et al. BIN1 is a novel myc–interacting protein with features of a tumour suppressor. Nat Genet. 1996;14(1):69–77. doi: 10.1038/ng0996-69 [DOI] [PubMed] [Google Scholar]
- [2].Seshadri S, Fitzpatrick AL, Ikram MA, et al. Genome-wide analysis of genetic loci associated with alzheimer disease. JAMA. 2010;303(18):1832–1840. doi: 10.1001/jama.2010.574 [DOI] [PMC free article] [PubMed] [Google Scholar]
- [3].Kunkle BW, Grenier-Boley B, Sims R, et al. Genetic meta-analysis of diagnosed Alzheimer’s disease identifies new risk loci and implicates Aβ, tau, immunity and lipid processing. Nat Genet. 2019;51(3):414–430. doi: 10.1038/s41588-019-0358-2 [DOI] [PMC free article] [PubMed] [Google Scholar]
- [4].Miyagawa T, Ebinuma I, Morohashi Y, et al. BIN1 regulates BACE1 intracellular trafficking and amyloid-β production. Hum Mol Genet. 2016;25:2948–2958. doi: 10.1093/hmg/ddw146 [DOI] [PubMed] [Google Scholar]
- [5].Ubelmann F, Burrinha T, Salavessa L, et al. Bin1 and CD2AP polarise the endocytic generation of beta-amyloid. EMBO Rep. 2017;18(1):102–122. doi: 10.15252/embr.201642738 [DOI] [PMC free article] [PubMed] [Google Scholar]
- [6].Andrew RJ, De Rossi P, Nguyen P, et al. Reduction of the expression of the late-onset Alzheimer’s disease (AD) risk-factor BIN1 does not affect amyloid pathology in an AD mouse model. J Biol Chem. 2019;294(12):4477–4487. doi: 10.1074/jbc.RA118.006379 [DOI] [PMC free article] [PubMed] [Google Scholar]
- [7].Franzmeier N, Rubinski A, Neitzel J, et al. Alzheimer’s disease neuroimaging I. The BIN1 rs744373 SNP is associated with increased tau-pet levels and impaired memory. Nat Commun. 2019;10(1):1766. doi: 10.1038/s41467-019-09564-5 [DOI] [PMC free article] [PubMed] [Google Scholar]
- [8].Wang H-F, Wan Y, Hao X-K, et al. Bridging integrator 1 (BIN1) genotypes mediate Alzheimer’s disease risk by altering neuronal degeneration. J Alzheimer’s Disease. 2016;52(1):179–190. doi: 10.3233/JAD-150972 [DOI] [PubMed] [Google Scholar]
- [9].Chapuis J, Hansmannel F, Gistelinck M, et al. Increased expression of BIN1 mediates alzheimer genetic risk by modulating tau pathology. Mol Psychiatry. 2013;18(11):1225–1234. doi: 10.1038/mp.2013.1 [DOI] [PMC free article] [PubMed] [Google Scholar]
- [10].Sottejeau Y, Bretteville A, Cantrelle FX, et al. Tau phosphorylation regulates the interaction between BIN1’s SH3 domain and Tau’s proline-rich domain. Acta Neuropathol Commun. 2015;3(1):58. doi: 10.1186/s40478-015-0237-8 [DOI] [PMC free article] [PubMed] [Google Scholar]
- [11].Sartori M, Mendes T, Desai S, et al. BIN1 recovers tauopathy-induced long-term memory deficits in mice and interacts with tau through Thr348 phosphorylation. Acta Neuropathol. 2019;138(4):631–652. doi: 10.1007/s00401-019-02017-9 [DOI] [PMC free article] [PubMed] [Google Scholar]
- [12].Calafate S, Flavin W, Verstreken P, et al. Loss of Bin1 promotes the propagation of tau pathology. Cell Rep. 2016;17(4):931–940. doi: 10.1016/j.celrep.2016.09.063 [DOI] [PubMed] [Google Scholar]
- [13].Voskobiynyk Y, Roth JR, Cochran JN, et al. Alzheimer’s disease risk gene BIN1 induces Tau-dependent network hyperexcitability. Elife. 2020;9. doi: 10.7554/eLife.57354 [DOI] [PMC free article] [PubMed] [Google Scholar]
- [14].De Rossi P, Nomura T, Andrew RJ, et al. Neuronal BIN1 regulates presynaptic neurotransmitter release and memory consolidation. Cell Rep. 2020;30(10):3520–35 e7. doi: 10.1016/j.celrep.2020.02.026 [DOI] [PMC free article] [PubMed] [Google Scholar]
- [15].Schürmann B, Bermingham DP, Kopeikina KJ, et al. A novel role for the late-onset Alzheimer’s disease (load)-associated protein Bin1 in regulating postsynaptic trafficking and glutamatergic signaling. Mol Psychiatry. 2020;25(9):2000–2016. doi: 10.1038/s41380-019-0407-3 [DOI] [PMC free article] [PubMed] [Google Scholar]
- [16].Sheng C, Javed U, Gibbs M, et al. Experience-dependent structural plasticity targets dynamic filopodia in regulating dendrite maturation and synaptogenesis. Nat Commun. 2018;9(1):3362. doi: 10.1038/s41467-018-05871-5 [DOI] [PMC free article] [PubMed] [Google Scholar]
- [17].Glennon EBC, Whitehouse IJ, Miners JS, et al. BIN1 is decreased in sporadic but not familial Alzheimer’s disease or in aging. PLOS ONE. 2013;8(10):e78806. doi: 10.1371/journal.pone.0078806 [DOI] [PMC free article] [PubMed] [Google Scholar]
- [18].Holler CJ, Davis PR, Beckett TL, et al. Bridging integrator 1 (BIN1) protein expression increases in the Alzheimer’s disease brain and correlates with neurofibrillary tangle pathology. J Alzheimer’s Disease. 2014;42:1221–1227. doi: 10.3233/JAD-132450 [DOI] [PMC free article] [PubMed] [Google Scholar]
- [19].De Rossi P, Buggia-Prévot V, Clayton BLL, et al. Predominant expression of Alzheimer’s disease-associated BIN1 in mature oligodendrocytes and localization to white matter tracts. Mol Neurodegener. 2016;11(1):59. doi: 10.1186/s13024-016-0124-1 [DOI] [PMC free article] [PubMed] [Google Scholar]
- [20].Pini L, Pievani M, Bocchetta M, et al. Brain atrophy in Alzheimer’s disease and aging. Ageing Res Rev. 2016;30:25–48. doi: 10.1016/j.arr.2016.01.002 [DOI] [PubMed] [Google Scholar]
- [21].Erten-Lyons D, Dodge HH, Woltjer R, et al. Neuropathologic basis of age-associated brain atrophy. JAMA Neurol. 2013;70(5):616–622. doi: 10.1001/jamaneurol.2013.1957 [DOI] [PMC free article] [PubMed] [Google Scholar]
- [22].Silbert LC, Quinn JF, Moore MM, et al. Changes in premorbid brain volume predict Alzheimer’s disease pathology. Neurology. 2003;61(4):487–492. doi: 10.1212/01.WNL.0000079053.77227.14 [DOI] [PubMed] [Google Scholar]
- [23].Zhang X, Yu J-T, Li J, et al. Bridging integrator 1 (BIN1) genotype effects on working memory, hippocampal volume, and functional connectivity in young healthy individuals. Neuropsychopharmacology. 2015;40(7):1794–1803. doi: 10.1038/npp.2015.30 [DOI] [PMC free article] [PubMed] [Google Scholar]
- [24].Mattson MP, Kater SB.. Isolated hippocampal neurons in cryopreserved long-term cultures: development of neuroarchitecture and sensitivity to NMDA. Int J Dev Neurosci. 1988;6(5):439–452. doi: 10.1016/0736-5748(88)90050-0 [DOI] [PubMed] [Google Scholar]
- [25].Dailey ME, Smith SJ. The dynamics of dendritic structure in developing hippocampal slices. J Neurosci. 1996;16(9):2983–2994. doi: 10.1523/JNEUROSCI.16-09-02983.1996 [DOI] [PMC free article] [PubMed] [Google Scholar]
- [26].Kumar V, Zhang M-X, Swank MW, et al. Regulation of dendritic morphogenesis by Ras–PI3K–akt–mTOR and Ras–mapk signaling pathways. J Neurosci. 2005;25(49):11288–11299. doi: 10.1523/JNEUROSCI.2284-05.2005 [DOI] [PMC free article] [PubMed] [Google Scholar]
- [27].LiCausi F, Hartman NW. Role of mTOR complexes in neurogenesis. Int J Mol Sci. 2018;19(5):1544. doi: 10.3390/ijms19051544 [DOI] [PMC free article] [PubMed] [Google Scholar]
- [28].Ban B-K, Jun M-H, Ryu H-H, et al. Autophagy negatively regulates early axon growth in cortical neurons. Mol Cell Biol. 2013;33(19):3907–3919. doi: 10.1128/MCB.00627-13 [DOI] [PMC free article] [PubMed] [Google Scholar]
- [29].Yang Y, Coleman M, Zhang L, et al. Autophagy in axonal and dendritic degeneration. Trends Neurosci. 2013;36(7):418–428. doi: 10.1016/j.tins.2013.04.001 [DOI] [PMC free article] [PubMed] [Google Scholar]
- [30].Al-Bari MAA, Xu P. Molecular regulation of autophagy machinery by mTOR-dependent and -independent pathways. Ann N Y Acad Sci. 2020;1467(1):3–20. doi: 10.1111/nyas.14305 [DOI] [PubMed] [Google Scholar]
- [31].Corona Velazquez AF, Jackson WT. So many roads: the multifaceted regulation of autophagy induction. Mol Cell Biol. 2018;38(21):38. doi: 10.1128/MCB.00303-18 [DOI] [PMC free article] [PubMed] [Google Scholar]
- [32].Mizushima N, Yoshimori T. How to interpret LC3 immunoblotting. Autophagy. 2007;3(6):542–545. doi: 10.4161/auto.4600 [DOI] [PubMed] [Google Scholar]
- [33].Kaizuka T, Morishita H, Hama Y, et al. An autophagic flux probe that releases an internal control. Mol Cell. 2016;64(4):835–849. doi: 10.1016/j.molcel.2016.09.037 [DOI] [PubMed] [Google Scholar]
- [34].Filomeni G, De Zio D, Cecconi F. Oxidative stress and autophagy: the clash between damage and metabolic needs. Cell Death Differ. 2015;22(3):377–388. doi: 10.1038/cdd.2014.150 [DOI] [PMC free article] [PubMed] [Google Scholar]
- [35].Vodicka P, Lim J, Williams DT, et al. Assessment of chloroquine treatment for modulating autophagy flux in brain of WT and HD mice. J Huntingtons Dis. 2014;3(2):159–174. doi: 10.3233/JHD-130081 [DOI] [PubMed] [Google Scholar]
- [36].Kim J, Kundu M, Viollet B, et al. AMPK and mTOR regulate autophagy through direct phosphorylation of Ulk1. Nat Cell Biol. 2011;13(2):132–141. doi: 10.1038/ncb2152 [DOI] [PMC free article] [PubMed] [Google Scholar]
- [37].Mizushima N, Yoshimori T, Levine B. Methods in mammalian autophagy research. Cell. 2010;140(3):313–326. doi: 10.1016/j.cell.2010.01.028 [DOI] [PMC free article] [PubMed] [Google Scholar]
- [38].Young ARJ, Narita M, Ferreira M, et al. Autophagy mediates the mitotic senescence transition. Genes Dev. 2009;23(7):798–803. doi: 10.1101/gad.519709 [DOI] [PMC free article] [PubMed] [Google Scholar]
- [39].Braden CR, Neufeld TP. Atg1-independent induction of autophagy by the drosophila Ulk3 homolog, ADUK. FEBS J. 2016;283(21):3889–3897. doi: 10.1111/febs.13906 [DOI] [PMC free article] [PubMed] [Google Scholar]
- [40].Napolitano G, Ballabio A. TFEB at a glance. J Cell Sci. 2016;129(13):2475–2481. doi: 10.1242/jcs.146365 [DOI] [PMC free article] [PubMed] [Google Scholar]
- [41].Palmieri M, Pal R, Nelvagal HR, et al. mTORC1-independent TFEB activation via akt inhibition promotes cellular clearance in neurodegenerative storage diseases. Nat Commun. 2017;8(1):14338. doi: 10.1038/ncomms14338 [DOI] [PMC free article] [PubMed] [Google Scholar]
- [42].Kanai F, Yoshida H, Tateishi R, et al. A phase I/II trial of the oral antiangiogenic agent TSU-68 in patients with advanced hepatocellular carcinoma. Cancer Chemother Pharmacol. 2011;67(2):315–324. doi: 10.1007/s00280-010-1320-2 [DOI] [PubMed] [Google Scholar]
- [43].Enooku K, Tateishi R, Kanai F, et al. Evaluation of molecular targeted cancer drug by changes in tumor marker doubling times. J Gastroenterol. 2012;47(1):71–78. doi: 10.1007/s00535-011-0462-2 [DOI] [PubMed] [Google Scholar]
- [44].Piirsoo A, Kasak L, Kauts ML, et al. Protein kinase inhibitor SU6668 attenuates positive regulation of Gli proteins in cancer and multipotent progenitor cells. Biochim Biophys Acta. 2014;1843(4):703–714. doi: 10.1016/j.bbamcr.2014.01.003 [DOI] [PMC free article] [PubMed] [Google Scholar]
- [45].Kasak L, Naks M, Eek P, et al. Characterization of protein kinase ULK3 regulation by phosphorylation and inhibition by Small molecule SU6668. Biochemistry. 2018;57(37):5456–5465. doi: 10.1021/acs.biochem.8b00356 [DOI] [PubMed] [Google Scholar]
- [46].Naumova E, Ubezio P, Garofalo A, et al. The vascular targeting property of paclitaxel is enhanced by SU6668, a receptor tyrosine kinase inhibitor, causing apoptosis of endothelial cells and inhibition of angiogenesis. Clin Cancer Res. 2006;12(6):1839–1849. doi: 10.1158/1078-0432.CCR-05-1615 [DOI] [PubMed] [Google Scholar]
- [47].Kuenen BC, Giaccone G, Ruijter R, et al. Dose-finding study of the multitargeted tyrosine kinase inhibitor SU6668 in patients with advanced malignancies. Clin Cancer Res. 2005;11(17):6240–6246. doi: 10.1158/1078-0432.CCR-04-2466 [DOI] [PubMed] [Google Scholar]
- [48].McKhann G, Drachman D, Folstein M, et al. Clinical diagnosis of Alzheimer’s disease. Report of the NINCDS‐ADRDA work Group* Under The Auspices Of Department Of Health And Hum Serv Task Force On Alzheimer’s Disease. Neurology. 1984;34(7):939–939. doi: 10.1212/WNL.34.7.939 [DOI] [PubMed] [Google Scholar]
- [49].Cochran JN, Hall AM, Roberson ED. The dendritic hypothesis for Alzheimer’s disease pathophysiology. Brain Res Bull. 2014;103:18–28. doi: 10.1016/j.brainresbull.2013.12.004 [DOI] [PMC free article] [PubMed] [Google Scholar]
- [50].Anderton BH, Callahan L, Coleman P, et al. Dendritic changes in Alzheimer’s disease and factors that may underlie these changes. Prog Neurobiol. 1998;55(6):595–609. doi: 10.1016/S0301-0082(98)00022-7 [DOI] [PubMed] [Google Scholar]
- [51].Baloyannis SJ. Dendritic pathology in Alzheimer’s disease. J Neurol Sci. 2009;283(1–2):153–157. doi: 10.1016/j.jns.2009.02.370 [DOI] [PubMed] [Google Scholar]
- [52].Sanchez-Varo R, Mejias-Ortega M, Fernandez-Valenzuela JJ, et al. Transgenic mouse models of Alzheimer’s disease: an integrative analysis. Int J Mol Sci. 2022;23(10):5404. doi: 10.3390/ijms23105404 [DOI] [PMC free article] [PubMed] [Google Scholar]
- [53].Jankowsky JL, Zheng H. Practical considerations for choosing a mouse model of Alzheimer’s disease. Mol Neurodegener. 2017;12(1):89. doi: 10.1186/s13024-017-0231-7 [DOI] [PMC free article] [PubMed] [Google Scholar]
- [54].Nixon RA. Autophagy, amyloidogenesis and alzheimer disease. J Cell Sci. 2007;120(23):4081–4091. doi: 10.1242/jcs.019265 [DOI] [PubMed] [Google Scholar]
- [55].Nixon RA. The role of autophagy in neurodegenerative disease. Nat Med. 2013;19(8):983–997. doi: 10.1038/nm.3232 [DOI] [PubMed] [Google Scholar]
- [56].Watanabe-Asano T, Kuma A, Mizushima N. Cycloheximide inhibits starvation-induced autophagy through mTORC1 activation. Biochem Biophys Res Commun. 2014;445(2):334–339. doi: 10.1016/j.bbrc.2014.01.180 [DOI] [PubMed] [Google Scholar]
- [57].Yamamoto A, Mizushima N, Tsukamoto S. Fertilization-induced autophagy in mouse embryos is Independent of mTORC11. Biol Reprod. 2014;91(1):91. doi: 10.1095/biolreprod.113.115816 [DOI] [PubMed] [Google Scholar]
- [58].Mathea S, Salah E, Tallant C, et al. Conformational plasticity of the ULK3 kinase domain. Biochemical J. 2021;478(14):2811–2823. doi: 10.1042/BCJ20210257 [DOI] [PubMed] [Google Scholar]
- [59].Goruppi S, Procopio M-G, Jo S, et al. The ULK3 kinase is critical for convergent control of cancer-associated fibroblast activation by CSL and GLI. Cell Rep. 2017;20(10):2468–2479. doi: 10.1016/j.celrep.2017.08.048 [DOI] [PMC free article] [PubMed] [Google Scholar]
- [60].Gonzalez-Rodriguez P, Cheray M, Keane L, et al. ULK3-dependent activation of GLI1 promotes DNMT3A expression upon autophagy induction. Autophagy. 2022;18(12):2769–2780. doi: 10.1080/15548627.2022.2039993 [DOI] [PMC free article] [PubMed] [Google Scholar]
- [61].Liu B, Gao W, Sun W, et al. Promoting roles of long non-coding RNA FAM83H-AS1 in bladder cancer growth, metastasis, and angiogenesis through the c-myc-mediated ULK3 upregulation. Cell Cycle. 2020;19(24):3546–3562. doi: 10.1080/15384101.2020.1850971 [DOI] [PMC free article] [PubMed] [Google Scholar]
- [62].Chen SY, Cao JL, Li KP, et al. BIN1 in cancer: biomarker and therapeutic target. J Cancer Res Clin Oncol. 2023;149(10):7933–7944. doi: 10.1007/s00432-023-04673-7 [DOI] [PMC free article] [PubMed] [Google Scholar]
- [63].White E. The role for autophagy in cancer. J Clin Invest. 2015;125(1):42–46. doi: 10.1172/JCI73941 [DOI] [PMC free article] [PubMed] [Google Scholar]
- [64].Goruppi S, Clocchiatti A, Bottoni G, et al. The ULK3 kinase is a determinant of keratinocyte self-renewal and tumorigenesis targeting the arginine methylome. Nat Commun. 2023;14(1):887. doi: 10.1038/s41467-023-36410-6 [DOI] [PMC free article] [PubMed] [Google Scholar]
- [65].Jahreiss L, Menzies FM, Rubinsztein DC. The itinerary of autophagosomes: from peripheral formation to kiss-and-run fusion with lysosomes. Traffic. 2008;9(4):574–587. doi: 10.1111/j.1600-0854.2008.00701.x [DOI] [PMC free article] [PubMed] [Google Scholar]
- [66].Beaudoin GMJ, Lee S-H, Singh D, et al. Culturing pyramidal neurons from the early postnatal mouse hippocampus and cortex. Nat Protoc. 2012;7(9):1741–1754. doi: 10.1038/nprot.2012.099 [DOI] [PubMed] [Google Scholar]
- [67].Pitts MW. Barnes maze procedure for spatial learning and memory in mice. Bio Protoc. 2018;8(5). doi: 10.21769/BioProtoc.2744 [DOI] [PMC free article] [PubMed] [Google Scholar]
Associated Data
This section collects any data citations, data availability statements, or supplementary materials included in this article.
Supplementary Materials
Data Availability Statement
The datasets used and analyzed during the current study are available from the corresponding author on reasonable request.