

ABSTRACT
Macroautophagy/autophagy activation in renal tubular epithelial cells protects against acute kidney injury (AKI). However, the role of immune cell autophagy, such as that involving macrophages, in AKI remains unclear. In this study, we discovered that macrophage autophagy was an adaptive response during AKI as mice with macrophage-specific autophagy deficiency (atg5−/−) exhibited higher serum creatinine, more severe renal tubule injury, increased infiltration of ADGRE1/F4/80+ macrophages, and elevated expression of inflammatory factors compared to WT mice during AKI induced by either LPS or unilateral ischemia-reperfusion. This was further supported by adoptive transfer of atg5−/− macrophages, but not WT macrophages, to cause more severe AKI in clodronate liposomes-induced macrophage depletion mice. Similar results were also obtained in vitro that bone marrow-derived macrophages (BMDMs) lacking Atg5 largely increased pro-inflammatory cytokine expression in response to LPS and IFNG. Mechanistically, we uncovered that atg5 deletion significantly upregulated the protein expression of TARM1 (T cell-interacting, activating receptor on myeloid cells 1), whereas inhibition of TARM1 suppressed LPS- and IFNG-induced inflammatory responses in atg5−/− RAW 264.7 macrophages. The E3 ubiquitin ligases MARCHF1 and MARCHF8 ubiquitinated TARM1 and promoted its degradation in an autophagy-dependent manner, whereas silencing or mutation of the functional domains of MARCHF1 and MARCHF8 abolished TARM1 degradation. Furthermore, we found that ubiquitinated TARM1 was internalized from plasma membrane into endosomes, and then recruited by the ubiquitin-binding autophagy receptors TAX1BP1 and SQSTM1 into the autophagy-lysosome pathway for degradation. In conclusion, macrophage autophagy protects against AKI by inhibiting renal inflammation through the MARCHF1- and MARCHF8-mediated degradation of TARM1.
Abbreviations: AKI, acute kidney injury; ATG, autophagy related; Baf, bafilomycin A1; BMDMs, bone marrow-derived macrophages; CCL2/MCP-1, C-C motif chemokine ligand 2; CHX, cycloheximide; CQ, chloroquine; IFNG, interferon gamma; IL, interleukin; IR, ischemia-reperfusion; MAP1LC3/LC3, microtubule-associated protein 1 light chain 3; LPS, lipopolysaccharide; MARCHF, membrane associated ring-CH-type finger; NC, negative control; NFKB, nuclear factor of kappa light polypeptide gene enhancer in B cells; NLRP3, NLR family, pyrin domain containing 3; NOS2, nitric oxide synthase 2, inducible; Rap, rapamycin; Wort, wortmannin; RT-qPCR, real-time quantitative polymerase chain reaction; Scr, serum creatinine; SEM, standard error of mean; siRNA, small interfering RNA; SYK, spleen tyrosine kinase; TARM1, T cell-interacting, activating receptor on myeloid cells 1; TAX1BP1, Tax1 (human T cell leukemia virus type I) binding protein 1; TECs, tubule epithelial cells; TNF, tumor necrosis factor; WT, wild type.
KEYWORDS: Adoptive transfer, Atg5, bone marrow-derived macrophages, inflammation, ischemia-reperfusion, tubular epithelial cells
Introduction
Acute kidney injury (AKI) is a clinical syndrome characterized by a rapid decline in renal function caused by several insults and causes high mortality and morbidity [1–3]. The incidence of AKI has been reported to increase annually in both developed and developing countries [4]. Patients with AKI have a higher risk of developing chronic kidney disease and end-stage renal disease than those without AKI; the risk of progression and associated mortality increases without effective treatments [5]. In addition, the related mechanisms of the pathogenesis and progression of AKI are still unclear.
Growing evidence indicates that inflammatory events driven by immune cells determine the progression of AKI [6,7]. It was first reported that in the early stage of AKI, macrophages are identified as the M1 phenotype and play a pro-inflammatory role in AKI, whereas deleting these macrophages alleviates renal tubular injury. Furthermore, depleting macrophages or blocking their renal infiltration during the repair phase delays the recovery of renal structure and function [8]. Studies have shown that macrophages, the most critical inflammatory cells, play critical roles in the initiation and development of AKI and affect the outcome and prognosis of AKI [9–13]. However, the underlying mechanisms of macrophage-mediated inflammatory responses in AKI state need to be addressed.
Autophagy is a biological process essential for maintaining cell homeostasis and function. Renal tubular epithelial cells/TECs are the primary cells in kidneys affected by AKI and play a key role in the progression and prognosis of AKI [14]. It has been demonstrated that autophagy activation in tubular epithelial cells protects against sepsis-induced or ischemia-reperfusion (IR)-induced AKI by our lab and others [15–19]. Moreover, autophagy also regulates the proliferation, apoptosis, differentiation, migration, and activation of various immune cells, including macrophages [20–22]. Recent studies have shown that disrupted macrophage autophagy enhances the production of inflammatory cytokines and aggravates the disease progression in eye pigments [23], obesity [24], and acute liver injury [25]. However, whether macrophage autophagy regulates AKI progression and its underlying mechanism remains undetermined.
In the present study, we aimed to verify the role and mechanisms of macrophage-specific autophagy in AKI in vivo using macrophage-specific autophagy-deficient (atg5−/−) mice and in vitro using atg5−/− bone marrow-derived macrophages (BMDMs) and atg5−/− RAW 264.7 macrophages. Results showed that autophagy deficiency in macrophages exacerbated renal inflammation in AKI by promoting TARM1-mediated macrophage proinflammatory responses. In addition, the E3 ubiquitin ligases MARCHF1 and MARCHF8 May ubiquitinate TARM1 and trigger its internalization from the plasma membrane into endosomes, causing it to be then recruited by TAX1BP1 and SQSTM1 into phagophores for degradation. These data demonstrated for the first time that macrophage autophagy protects against AKI by inhibiting renal inflammation through the MARCHF1- and MARCHF8-mediated degradation of TARM1.
Results
Autophagy is an adaptive response in renal macrophages in patients and mice with AKI
We first examined autophagy in renal macrophages of patients and mice with AKI. Single-cell transcriptome data analysis revealed an increased expression of autophagic genes, such as Atg5, Atg7, Atg12, Lc3, Sqstm1, Lamp1, and Lamp2 in the renal macrophages from mice with IR-induced AKI (IR-AKI) compared to their expression in the renal macrophages from sham mice (Figure 1A). The immunofluorescence analysis revealed elevated expression of MAP1LC3/LC3 (microtubule-associated protein 1 light chain 3) in the CD68+ macrophages in patients with AKI compared to those in minimal change nephropathy/MCN (Figure 1B). These data indicate that autophagy is an adaptive response in renal macrophages during AKI.
Figure 1.
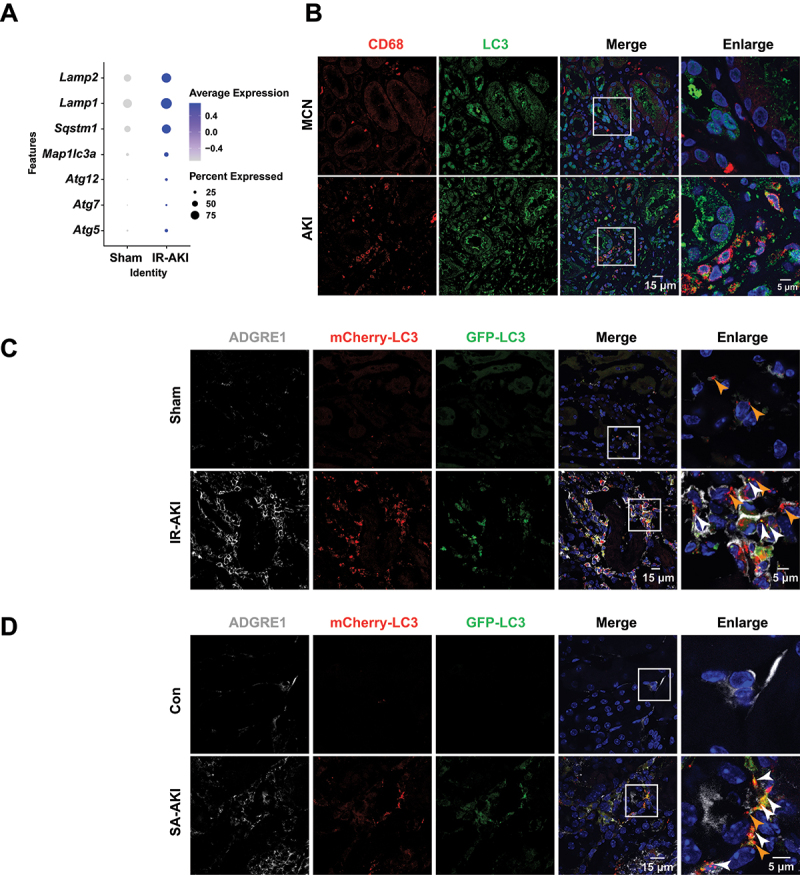
Autophagy is an adaptive response in renal macrophages in AKI. (A) expression of autophagic genes of single-cell transcriptome from the kidneys of mice subjected to IR for 3 days. (B) immunofluorescence staining of CD68 and LC3 in the kidney biopsy of patients with AKI. (C and D) immunofluorescence staining of ADGRE1 and tandem-tagged mCherry-EGFP-LC3 in the kidneys of mice subjected to IR for 3 days or LPS (5 mg/kg) for 24 h (white arrowheads indicating mCherry-EGFP-LC3, orange arrowheads indicating mCherry-LC3). Scale bars: 15 μm or 5 μm.
To monitor autophagic flux, we generated macrophage-specific tandem-tagged mCherry-EGFP-LC3 transgenic mice (Figure S1A-C), which enables the visualization of autophagosomal dynamics in macrophages as the yellow fluorescent particles (mCherry-EGFP-LC3) in free autophagosomes turn into red fluorescence (mCherry-LC3) upon the fusion of free autophagosomes with lysosomes due to acidity [26]. As shown in Figure S1D, the autophagy activator torin1 induced an abundance of red fluorescent particles, whereas the autophagy-lysosome inhibitor chloroquine (CQ) led to the accumulation of yellow puncta in BMDMs. This result indicates that macrophage autophagic flux can be efficiently monitored in the mouse model. Subsequently, immunofluorescence analysis revealed an increase in the numbers of renal ADGRE1/F4/80+ macrophages, with an increase in autophagosomes (yellow puncta) and autolysosomes (only red puncta), in mice with IR-AKI and lipopolysaccharide (LPS)-induced sepsis-associated AKI (SA-AKI) compared to those in control mice (Figure 1C, D). These data indicated that autophagy is activated in renal macrophages in the progression of AKI.
Macrophage autophagy protects mice from LPS and IR-induced AKI
To investigate the role of macrophage autophagy in AKI, we crossbred Lyz2 (lysozyme 2)-Cre with Atg5flox/+ mice to generate macrophage autophagy-deficient mice (atg5−/− mice) and Atg5flox/flox (WT) control mice (Figure S2A-C). As shown in Figure S2D, in contrast to WT BMDMs, the level of LC3-II and SQSTM1 could not be modulated by the autophagy activator rapamycin (Rap) or the autophagy-lysosome inhibitor CQ in BMDMs from atg5-/- mice. These findings indicate the successful generation of macrophage-specific autophagy-deficient mice. As shown in Figure 2A, the mortality rate in atg5−/− mice was 50% at 12 h, which increased to 100% at 36 h post-LPS (5 mg/kg) treatment. In contrast, WT mice exhibited resistance to LPS, with a death rate of only one-fifth during the entire experimental period. Therefore, we reduced the dose of LPS to 1 mg/kg of body weight to prevent mortality in atg5−/− mice. Compared to WT mice, atg5−/− mice had elevated levels of serum creatinine (Scr) (Figure 2B). Besides, the pathological damage of the kidney was aggravated, and HAVCR1/KIM-1, a marker of renal tubular injury, was upregulated in atg5−/− mice compared to that in WT mice (Figure 2C-F). Therefore, atg5−/− mice developed more severe SA-AKI than WT mice. The findings were further confirmed in IR-AKI. In addition, atg5−/− mice displayed more severe renal tubular damage with higher HAVCR1 expression than that of WT mice (Figure 2G-J). Collectively, these results illustrate that macrophage autophagy protects mice from LPS and IR-induced AKI.
Figure 2.
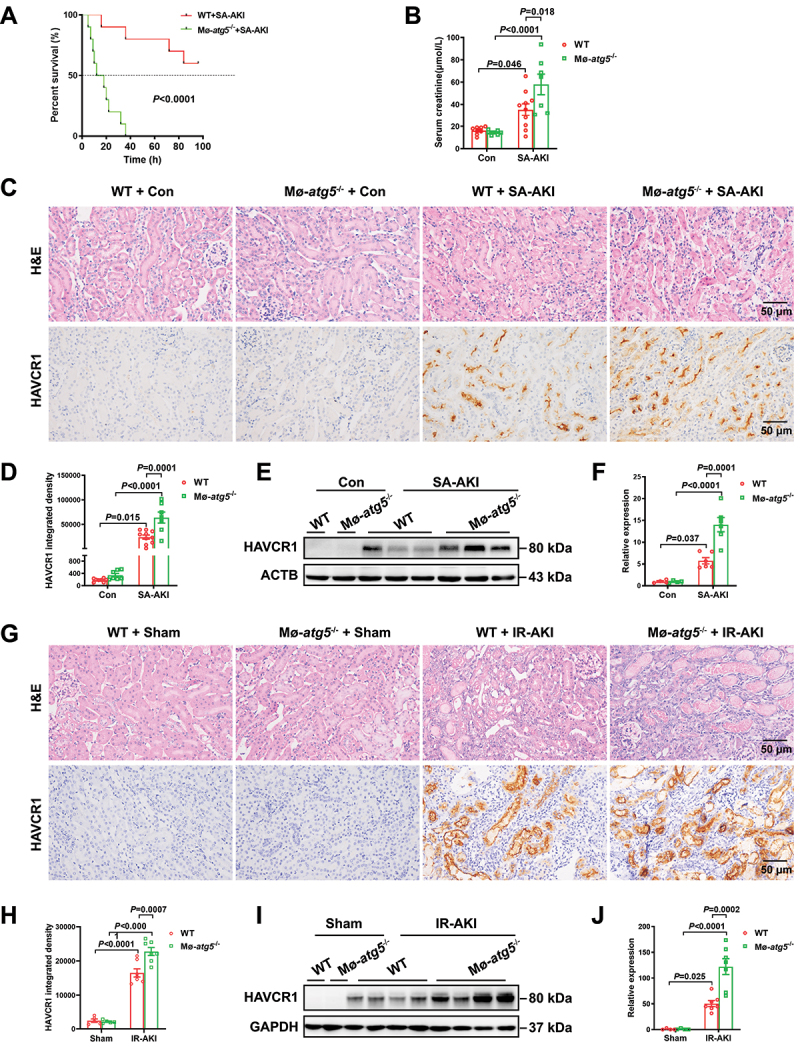
Mice with macrophage autophagy deficiency develop more severe AKI induced by LPS or IR. (A) the survival curves of female WT mice and female atg5−/−mice treated with LPS (5 mg/kg) treatment (n = 10). (B) serum levels of creatinine in WT mice and atg5−/− mice treated with or without LPS (1 mg/kg) for 24 h. (C and D) representative histology in the renal cortex by H&E staining and immunohistochemical staining of HAVCR1 in renal tissues of mice with SA-AKI. (n = 7-10 per group). (E and F) representative western blot images and quantification of HAVCR1 in renal tissues of mice with SA-AKI. (n = 4-6 per group). (G and H) pathological observation of kidney tissue by H&E staining and immunohistochemical staining of HAVCR1 in renal tissues of mice subjected to IR for 3 days. (n = 5-7 per group) (I and J) Representative western blot images and quantification of HAVCR1 in renal tissues of mice subjected to IR for 3 days. (n = 4-7 per group) all data are presented as mean ± SEM. Two-way ANOVA followed by Tukey’s post hoc test. Scale bars: 50 μm.
Macrophage autophagy suppresses renal inflammation in mice with AKI
As shown in Figure 3A and B, ADGRE1+ macrophages were more pronounced in the renal tissues of atg5−/− mice than in WT mice with SA-AKI. In addition, the renal expression of inflammatory factors, including CCL2/MCP-1, NLRP3, and IL18 was significantly upregulated in atg5−/−mice compared with those in WT mice during SA-AKI (Figure 3C, D). Like that in SA-AKI, deletion of Atg5 in macrophages also significantly enhanced the infiltration of ADGRE1+ macrophages (Figure 3E, F) and renal inflammatory cytokine production (Figure 3G, H) in atg5−/− mice subjected to IR. A similar result was confirmed by, in vitro study that showed that LPS and IFNG stimulation markedly increased the protein levels of NOS2, NLRP3, and IL18, in atg5−/− BMDMs compared to that of WT BMDMs (Figure 3I, J). These results indicate that macrophage autophagy inhibits renal inflammation in AKI.
Figure 3.

Macrophage autophagy deficiency enhances renal inflammation in mice with AKI. (A and B) immunofluorescence and quantification of ADGRE1+ macrophages in renal tissues of mice with SA-AKI. (n = 6-10 per group). (C and D) Representative western blot images and quantification of pro-inflammatory CCL2, NLRP3, and IL18 in the renal tissues of mice treated with LPS (1 mg/kg) for 24 h. (n = 4-6 per group). (E and F) immunofluorescence and quantification of ADGRE1+ macrophages in renal tissues of mice subjected to IR for 3 days. (n = 5-7 per group). (G and H) Representative western blot images and quantification of pro-inflammatory CCL2, NLRP3, and IL18 in the renal tissues of mice with ir-induced AKI. (n = 4-7 per group). (I and J) Representative western blot images and quantification of pro-inflammatory cytokines, NOS2, NLRP3, and IL18, in BMDMs subjected to LPS (100 ng/mL) and IFNG (50 ng/mL) for 24 h. (n = 3 per group). All data are presented as mean ± SEM. Two-way ANOVA followed by Tukey’s post hoc test (B, D, F, H); unpaired Student’s t-test (J). Scale bars: 50 μm.
Adoptive transfer of autophagy-deficient macrophages aggravates AKI in mice
Deletion of Atg5 under Lyz2-Cre not only disrupts autophagy in macrophages but also in neutrophil lineage, which contributes to renal inflammation in AKI as well [27]. To rule out this possibility, we next utilized adoptive transfer experiments to test whether autophagy attenuates AKI by suppressing macrophage-mediated inflammatory responses (Figure 4A). Macrophage depletion induced by clodronate liposomes protected against renal injury and inflammation in mice with SA-AKI (Figure S3A-E, G and Figure 4B-D, J), supporting that macrophages are the key immune cell components that drive AKI. Moreover, contrary to WT RAW 264.7 macrophages, adoptive transfer of atg5−/− RAW 264.7 macrophages markedly impaired renal function and exacerbated tubular injury in macrophage-depleted WT mice subjected to SA-AKI (Figure 4B-D). Similarly, the adoptive transfer of atg5−/− BMDMs significantly aggravated tubular lesions, upregulated HAVCR1 expression, and elevated serum creatinine compared to the adoptive transfer of WT BMDMs into macrophage-depleted WT or atg5−/− mice (Figure 4E-I). In addition, adoptive transfer of autophagy-deficient macrophages markedly increased the levels of these inflammatory molecules in the kidney of macrophage-depleted WT mice compared to those receipted WT macrophages (Figure 4J, K and Figure S3D, G-I). These results further confirmed that autophagy-deficient macrophages are responsible for excessive tubular injury and renal inflammation in AKI.
Figure 4.

Adoptive transfer of autophagy-deficient macrophages promotes SA-AKI in clodronate liposomes-mediated macrophage depletion mice. (A) schematic diagram of administration of clodronate liposomes to deplete macrophages and adoptive transfer macrophages in mice. (B) quantification of serum creatinine levels in SA-AKI-bearing mice that received atg5−/− or WT RAW 264.7 macrophage transfer. (C-D) Representative images of H&E, immunohistochemical staining, and quantification of HAVCR1 in renal tissues of SA-AKI-bearing mice that received atg5−/− or WT RAW 264.7 macrophage transfer. (n = 5 per group). (E-I) Representative images of H&E, immunohistochemical staining of HAVCR1 in renal tissues, and serum levels of creatinine of SA-AKI-bearing mice that received atg5−/− or WT BMDMs transfer. (n = 3 per group). (J) Representative western blot images of HAVCR1, IL18, NLRP3, and CCL2 expression in renal tissues of SA-AKI-bearing mice that received atg5−/− or WT RAW 264.7 macrophage transfer. (n = 5 per group). (K) Representative western blot images of HAVCR1, IL18, NLRP3, and CCL2 expression in renal tissues of SA-AKI-bearing mice that received atg5−/− or WT BMDMs transfer. (n = 3 per group). All data are presented as mean ± SEM. One-way ANOVA followed by Tukey’s post hoc test (B, C); and unpaired Student’s t-test (G-J). Scale bars: 50 μm.
Autophagy suppresses macrophage pro-inflammatory activities by targeting leukocyte receptor TARM1 (T cell-interacting, activating receptor on myeloid cells 1)
To explore mechanisms underly the autophagy suppresses macrophage pro-inflammatory activities, we performed proteomics analysis in BMDMs derived from WT and atg5−/− mice subjected to LPS and IFNG stimulation. The results revealed 15 and 10 proteins were significantly upregulated and downregulated respectively (|log2 fold|>2 and p < 0.05) (Figure 5A and Table S1). Among these, TARM1, a newly identified member of the leukocyte immunoglobulin-like receptor family, was significantly upregulated in atg5−/− BMDMs compared to WT BMDMs after treatment with LPS and IFNG (Figure 5B, C). Moreover, TARM1 was significantly upregulated in the renal tissues of atg5−/− mice compared with those in WT mice during SA-AKI (Figure 5D, E). Interestingly, inhibition of TARM1 by siRNA or an immobilized competitive TARM1-FC fusion protein significantly suppressed the expression of NOS2 or IL18 in Atg5-deficient RAW 264.7 macrophages induced by LPS- and IFNG (Figure 5F-K). These results reveal that autophagy suppresses the inflammatory responses of macrophages by targeting TARM1.
Figure 5.

Macrophage autophagy suppresses inflammatory cytokine production by targeting TARM1. (A) proteomic analysis of the differential protein expression in WT and atg5−/− BMDMs in response to LPS (100 ng/mL) and IFNG (50 ng/mL) for 24 h. (n = 3 per group). (B and C) Representative western blot images and quantification of TARM1 expression in WT and atg5−/− BMDMs in response to LPS and IFNG for 24 h. (n = 3 per group). (D and E) Representative western blot images and quantification of TARM1 expression in renal tissues of mice with lps-induced AKI. (n = 4-6 per group). (F and G) Representative western blot images and quantification of pro-inflammatory cytokines in WT and atg5−/− RAW 264.7 macrophages transfected with siTarm1 or NC for 24 h then in response to LPS and IFNG for 24 h. (n = 4 per group). (H and I) flow cytometry and quantification of NOS2 level in WT and atg5−/− RAW 264.7 macrophages transfected with siTarm1 or NC for 24 h then in response to LPS and IFNG for 24 h. (n = 4 per group). (J and K) flow cytometry and quantification of NOS2 level in WT and atg5−/− RAW 264.7 macrophages pretreated with TARM1-FC (10 μg/mL) or IgG-fc (10 μg/mL) for 1 h then in response to LPS and IFNG for 24 h. (n = 4 per group). (L and M) Representative western blot images and quantification of pro-inflammatory cytokines in WT and atg5−/− RAW 264.7 macrophages pretreated with Piceatannol (20 μM) or JSH-23 (20 μM) for 1 h then in response to LPS and IFNG for 24 h. (n = 4 per group). All data are presented as mean ± SEM. Unpaired Student’s t-test (C); two-way ANOVA followed by Tukey’s post hoc test (E, G, M); one-way ANOVA followed by Tukey’s post hoc test (I, K).
Previous studies have shown that TARM1 interacts with and depends on the immunoreceptor tyrosine-based activation motif (ITAM) of FCER1G/FcRγ for facilitating signal transduction, but the downstream pathway of TARM1-mediated inflammation remains unknown [28]. Particularly, ITAM can recruit SYK (spleen tyrosine kinase), leading to SYK phosphorylation and subsequent activation of the NFKB (nuclear factor of kappa light polypeptide gene enhancer in B cells) signaling pathway, thereby inducing the production of NOS2 and IL18 in macrophage [29–31]. Thus, we hypothesized that the elevated TARM1 caused by autophagy deficiency may promote inflammatory responses in macrophages through the SYK-NFKB pathway. As shown in Figure 5L, M, LPS and IFNG stimulation increased even higher expression of phosphorylation of SYK and phosphorylation of RELA/p65, an NFKB subunit, in atg5−/− RAW 264.7 macrophages than those in WT RAW 264.7 macrophages. In addition, inhibition of SYK by piceatannol or inhibition of NFKB by JSH-23 similarly reduced the level of p-RELA/p65 and markedly suppressed NOS2 and IL18 expression in atg5−/− RAW 264.7 macrophages. Additionally, suppression of SYK or NFKB activation notably reduced the NOS2 and IL18 expression in TARM1-overexpressing RAW 264.7 macrophages (Figure S4A, B). Collectively, these results demonstrate that autophagy deficiency-induced TARM1 activates pro-inflammatory macrophages through the SYK-NFKB signaling pathway.
Macrophage TARM1 is degraded in an autophagy-dependent manner
To examine how autophagy regulates macrophage TARM1, we initially stimulated atg5−/− or WT RAW 264.7 macrophages with LPS and IFNG for 12 h before subjecting them to the protein synthesis inhibitor cycloheximide (CHX) for the next 0, 2, 4, and 8 h. Results showed that the TARM1 protein displayed a dramatic decrease time-dependently in WT RAW 264.7 macrophages, however, the reduction of TARM1 protein in atg5−/− RAW 264.7 macrophages was much delayed (Figure 6A, B), indicating autophagy deficiency may delay macrophage TARM1 degradation.
Figure 6.

Autophagy regulates TARM1 degradation in macrophages. (A and B) Representative western blot images and quantification of TARM1 in WT and atg5−/− RAW 264.7 macrophages pretreated with LPS (100 ng/mL) and IFNG (50 ng/mL) for 12 h then stimulated with CHX (500 μg/mL) for 0 h, 2 h, 4 h, and 8 h. (n = 3 per group). (C and D) Representative western blot images and quantification of TARM1 in RAW 264.7 macrophages pretreated with MG132 (1 μM) for 1 h then in response to LPS and IFNG for 24 h. (n = 4 per group). (E and F) Representative western blot images and quantification of TARM1 in BMDMs pretreated with rap (10 μM), torin1 (1 μM), CQ (10 μM), and Baf (25 nM) for 1 h then in response to LPS (100 ng/mL) and IFNG (50 ng/mL) for 24 h. (n = 4 per group). (G and H) Representative western blot images and quantification of TARM1 in WT and atg5−/− RAW 264.7 macrophages pretreated with CQ (10 μM) for 1 h then in response to LPS and IFNG for 24 h. (n = 4 per group). (I and J) Representative western blot images and quantification of TARM1 in RAW 264.7 macrophages pretreated with wort (10 μM), LY294002 (10 μM), and CQ (10 μM) for 1 h then in response to LPS and IFNG for 24 h. (n = 4 per group). All data are presented as mean ± SEM. Two-way ANOVA followed by Tukey’s post hoc test (B, H); unpaired Student’s t-test (D); one-way ANOVA followed by Tukey’s post hoc test (F, J).
It is well established that the autophagy-lysosome pathway and the proteasome system are the two main pathways for cellular protein degradation [32]. In this study, treatment of proteasome inhibitor MG132 to BMDMs did not modulate TARM1 expression (Figure 6C, D). In contrast, autophagy induced by the autophagy activator Rap or torin1 downregulated the expression of TARM1 in BMDMs; however, inhibition of autophagy by CQ or bafilomycin A1 (Baf) increased the levels of TARM1 (Figure 6E, F), suggesting that macrophage TARM1 is degraded through the autophagy-lysosome pathway rather than the proteasome pathway.
Previous studies demonstrate that cell membrane receptors are transported to the endosomes after ubiquitylation and then sorted to lysosomal degradation [33,34]. However, recent studies have shown that autophagy is involved in the degradation of membrane receptors [35,36]. Here, we found that inhibition of autophagosome formation by deleting Atg5 or treatment with the autophagy inhibitor wortmannin (Wort) and LY294002 resulted in the accumulation of TARM1 in RAW 264.7 macrophages. Simultaneous inhibition of both autophagosome formation and lysosome function did not lead to further upregulation of TARM1 expression (Figure 6G-J), indicating that autophagosomes and lysosomes worked in the same pathway to degrade macrophage TARM1.
The E3 ubiquitin ligases MARCHF1 and MARCHF8 mediate the degradation of macrophage TARM1 through the autophagy pathway
Ubiquitination is an indispensable step for protein degradation. We hypothesized that macrophage TARM1 is first ubiquitinated by E3 ubiquitin ligase, and then internalized into endosomes and engulfed by LC3-positive autophagosomes for lysosomes degradation as described in Figure 7A. To address the hypotheses, first, we explored which E3 ubiquitin ligase mediates TARM1 ubiquitination, the key modification for TARM1 to be recognized by autophagic receptors and transported for autophagy-lysosome degradation. Using the online tool UbiBrowser 2.0 (http://ubibrowser.bio-it.cn/ubibrowser_v3/home/index), the E3 ubiquitin ligase MARCHF1, MARCHF8, and SYTL4, conserved in humans and mice, were predicted to mediate TARM1 ubiquitination (Figure 7B). Then, we co-transfected HEK293T cells with TARM1-Flag and either empty vector or MARCHF1-MYC, MARCHF8-MYC, or SYTL4-MYC plasmids. Forced expression of MARCHF1 or MARCHF8 degraded TARM1 in a dose-dependent manner, whereas SYTL4 overexpression did not alter the TARM1 level (Figure 7C). Further studies revealed that CQ suppressed the MARCHF1 and MARCHF8-induced TARM1 degradation, while the proteasome inhibitor MG132 did not (Figure 7D), supporting MARCHF1 and MARCHF8 induced TARM1 degradation via autophagy but not proteasome-mediated proteolysis. Moreover, co-immunoprecipitation experiments further revealed that MARCHF1 and MARCHF8 interacted with TARM1 and promoted its ubiquitination (Figure 7E, F). In contrast, when the functional domains of MARCHF1 and MARCHF8 were mutated, their functions in TARM1 ubiquitination and degradation were lost (Figure 7G).
Figure 7.

E3 ubiquitin ligases MARCHF1 and MARCHF8 mediate TARM1 degradation. (A) schematic diagram of our hypothesized process of TARM1 degradation through autophagy. (B) prediction of E3 ubiquitin ligase that mediates TARM1 degradation. (C) Representative western blot images demonstrate a dose-dependent degradation of TARM1 by MARCHF1, MARCHF8, and SYTL4 in HEK293T cells co-transfected with TARM1-flag and MARCHF1-MYC, MARCHF8-MYC, or SYTL4-MYC plasmid for 24 h. (D) Representative western blot images of TARM1 in HEK293T cells were co-transfected with TARM1-flag and either MARCHF1-MYC or MARCHR8-MYC plasmids for 18 h, followed by treatment with CQ (40 μM) or MG132 (10 μM) for 6 h. (E) Representative western blot images demonstrate the interaction between TARM1 and either MARCHF1 or MARCHF8 proteins in HEK293T cells co-transfected with TARM1-flag, MARCHF1-MYC, and MARCHF8-MYC plasmids for 24 h. Cellular lysates were subjected to immunoprecipitation (IP) using anti-flag, followed by western blot with anti-myc and anti-flag. (F) Representative western blot images demonstrate the ubiquitination of TARM1 in HEK293T cells co-transfected with TARM1-his, HA-Ub, and either MARCHF1-MYC or MARCHF8-MYC plasmids for 18 h, followed by treatment with CQ for 6 h. Cellular lysates were purified with a his-tag protein purification kit and then western blot with anti-ha, anti-his, and anti-myc. (G) Representative western blot images demonstrate the ubiquitination of TARM1 in HEK293T cells co-transfected with TARM1-his, HA-Ub, and either WT MARCHF1-MYC (WT), MARCHF1[Mut]-myc (mut), WT MARCHF8-MYC (WT), and MARCHF8Mut-MYC (mut) plasmids for 24 h. Cellular lysates were purified with a his-tag protein purification kit and then western blot with anti-ha, anti-his anti-myc.
Finally, silencing MARCHF1 and MARCHF8 by shRNA increased the expression of TARM1 in RAW 264.7 macrophages, associated with increased levels of NOS2 and IL18 (Figure 8A-D). In contrast, overexpression of MARCHF1 and MARCHF8 downregulated the levels of NOS2 and IL18 in macrophages by suppressing TARM1 (Figure 8E-H). Collectively, these results demonstrate that MARCHF1 and MARCHF8 promote the autophagy-mediated degradation of TARM1 to inhibit inflammatory response in macrophages.
Figure 8.
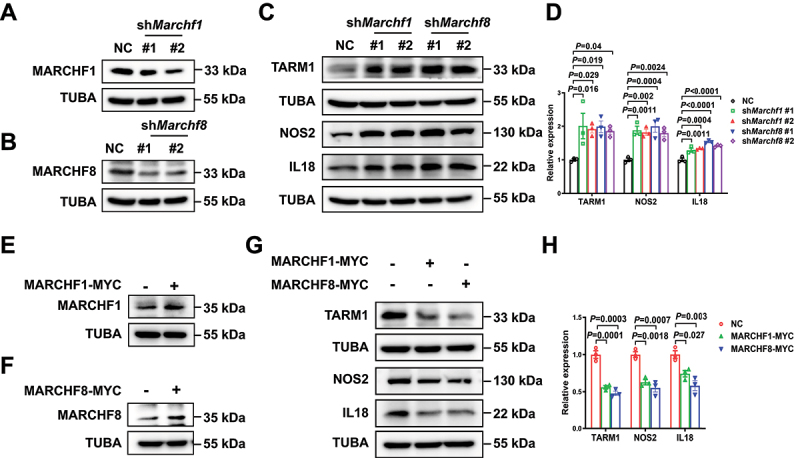
E3 ubiquitin ligases MARCHF1 and MARCHF8 inhibit the expression of TARM1 and attenuate the inflammatory response in macrophages. (A and B) Representative western blot images of MARCHF1 and MARCHF8 in RAW 264.7 macrophages silencing MARCHF1 and MARCHF8 by shMarchf1 and shMarchf8 lentivirus. (C and D) Representative western blot images and quantification of TARM1, NOS2, and IL18 in RAW 264.7 macrophages silencing MARCHF1 and MARCHF8 in response to LPS (100 ng/mL) and IFNG (50 ng/mL) for 24 h. (n = 3 per group). (E and F) Representative western blot images of MARCHF1 and MARCHF8 in RAW 264.7 macrophages overexpressing MARCHF1-MYC and MARCHF8-myc. (G and H) Representative western blot images and quantification of TARM1, NOS2, and IL18 in RAW 264.7 macrophages overexpressing MARCHF1-MYC and MARCHF8-myc in response to LPS and IFNG for 24 h. (n = 3 per group). All data are presented as mean ± SEM. Two-way ANOVA followed by Tukey’s post hoc test.
Ubiquitination is required for endocytosis of macrophage TARM1
Next, we explored whether ubiquitylation is required for endocytosis of TARM1. The cytoplasmic domain of TARM1 contains two conserved lysine residues, K286 and K293, which are potential ubiquitination sites (Figure S5). We therefore substituted arginine for these two lysine residues and found that MARCHF1 and MARCHF8 could not promote the ubiquitination and degradation of the mutated TARM1 (Figure 9A). The immunofluorescence results further showed that TARM1 was expressed on the cell membrane of RAW 264.7 macrophages. However, it was accumulated in the cytoplasm and colocalized with EEA1, an endosome marker, after stimulation with LPS and IFNG, in RAW 264.7 macrophage cells overexpressing WT TARM1. However, the K-to-R mutated TARM1 could not be internalized from the plasma membrane to endosomes by LPS and IFNG treatment (Figure 9B). All these results indicate that TARM1 ubiquitylation is indispensable for its endocytosis. Subsequently, macrophages transfected with TARM1[Mut]-His significantly increased the expression of NOS2, NLRP3, and IL18 in comparison to macrophages with WT TARM1 upon stimulation with LPS and IFNG (Figure 9C, D). Notably, this data highlighted that the crucial role of surface-TARM1 rather than cytoplasmic-TARM1 in mediating inflammation in macrophages.
Figure 9.
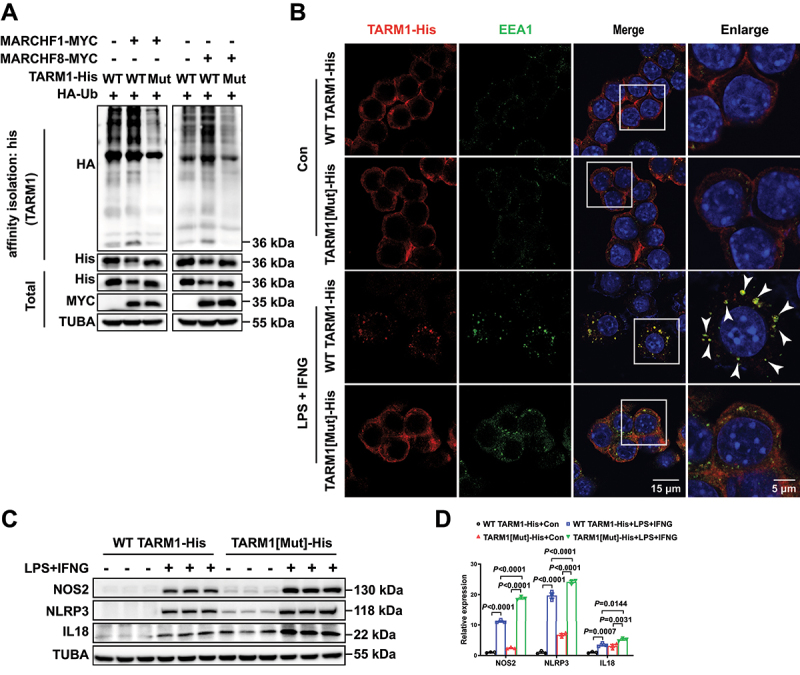
Ubiquitylation is required for endocytosis of TARM1. (A) Representative western blot images demonstrate the ubiquitination of TARM1 in HEK293T cells co-transfected with WT TARM1-his (WT), TARM1[Mut]-his (mut), HA-Ub, MARCHF1-MYC, and MARCHF8-MYC plasmids for 24 h. Cellular lysates were purified with a his-tag protein purification kit and then western blot with anti-ha, anti-his anti-myc. (B) Representative images of immunofluorescence staining of his and EEA1 in RAW 264.7 macrophages overexpressing TARM1-his in response to LPS and IFNG for 24 h (arrowheads indicating TARM1 and EEA1 colocalization). Scale bars: 15 μm or 5 μm. (C and D) Representative western blot images and quantification of NOS2, NLRP3, and IL18 in RAW 264.7 macrophages overexpressing WT TARM1-his or TARM1[Mut]-his in response to LPS (100 ng/mL) and IFNG (50 ng/mL) for 24 h. (n = 3 per group). Two-way ANOVA followed by Tukey’s post hoc test.
It is well accepted that selective autophagy receptors, such as SQSTM1, NBR1, OPTN (optineurin), CALCOCO2/NDP52, and TAX1BP1, can transfer the substrate to autophagosome and lysosome through LC3-interacting region/LIR domain and PB1 domain [32,37]. By co-immunoprecipitation analysis, TARM1 could interact with TAX1BP1, SQSTM1, and NBR1 (Figure 10A), suggesting that TARM1 May be recognized by these selective receptors. In addition, cell immunofluorescence data showed that LPS and IFNG treatment triggered TARM1 accumulation in the cytoplasm, and colocalization with selective autophagy receptors TAX1BP1, SQSTM1, and NBR1 in TARM1-Flag transfected RAW 264.7 macrophages (Figure 10B-E). In addition, LPS and IFNG also induced the colocalization of TARM1 with LC3 in RAW 264.7 macrophages. However, silencing TAX1BP1 or SQSTM1 by shRNA, reduced the colocalization of TARM1 with LC3 compared to the negative control (NC) after stimulation with LPS and IFNG, whereas silencing NBR1 had minor effects (Figure 10F-J). Moreover, deletion of Atg5 also significantly increased the expression of TAX1BP1 and SQSTM1, indicating that TAX1BP1 and SQSTM1 May be the major receptors for TARM1 in macrophages (Figure 5A and Table S1). Furthermore, as shown in Figure 10K, the binding of ubiquitinated TARM1 to the autophagy receptors TAX1BP1 and SQSTM1 had been revealed by the affinity isolation analysis. These results suggest that ubiquitinated TARM1 is internalized into endosomes and subsequently recognized by the autophagy receptors TAX1BP1 and SQSTM1 in the cytoplasm, then engulfed by LC3-positive phagophores and fused with lysosome for degradation.
Figure 10.

Autophagy receptors TAX1BP1 and SQSTM1 are recruited to ubiquitylated TARM1 and mediate autophagosome formation. (A) Representative western blot images demonstrate the interaction between TARM1 and either NBR1, TAX1BP1, OPTN, SQSTM1 or CALCOCO2/NDP52 proteins in RAW 264.7 macrophages overexpressing TARM1-flag, followed by treatment with LPS (100 ng/mL) and IFNG (50 ng/mL) for 24 h. Cellular lysates were subjected to immunoprecipitation using anti-flag, followed by western blot with anti-NBR1, anti-TAX1BP1, anti-optn, anti-SQSTM1, anti-CALCOCO2/NDP52, and anti-flag. (B-E) Representative images and quantification of immunofluorescence staining of flag, TAX1BP1, SQSTM1, and NBR1 in RAW 264.7 macrophages overexpressing TARM1-flag in response to LPS and IFNG for 24 h (arrowheads indicating TARM1 and TAX1BP1, SQSTM1, or NBR1 colocalization). (F-J) Representative images and quantification of immunofluorescence staining of TARM1-flag and LC3 in RAW 264.7 macrophages simultaneously overexpressing both TARM1-flag and silencing TAX1BP1, SQSTM1, or NBR1 in response to LPS and IFNG for 24 h (arrowheads indicating TARM1 and LC3 colocalization). (K) Representative western blot images demonstrate the binding of ubiquitinated TARM1 to TAX1BP1 and SQSTM1 in HEK293T cells co-transfected with TARM1-HA, his-ub, TAX1BP1-strep-flag, SQSTM1-strep-flag, MARCHF8-MYC and empty vector plasmids for 18 h, followed by treatment with CQ for 6 h. The colocalization was monitored using Pearson’s correlation coefficient of the ImageJ software. Scale bars: 15 μm or 5 μm.
Discussion
In this study, we found that macrophage autophagy is an adaptive response to AKI. Mice lacking autophagy in macrophages showed increased kidney damage and inflammation in AKI mouse model. The absence of autophagy-related gene Atg5 in macrophages led to higher expression of pro- inflammatory cytokines. In addition, atg5 deletion in macrophages increased TARM1 protein, which was regulated by E3 ubiquitin ligases MARCHF1 and MARCHF8, promoting its degradation via autophagy. This process involved TARM1’s internalization and recruitment by autophagy receptors such as SQSTM1 and TAX1BP1 into lysosomes (Figure 11). Overall, macrophage autophagy mitigates AKI by reducing inflammation through the degradation of TARM1, highlighting a new therapeutic target for kidney diseases.
Figure 11.

The proposed schematic diagram for macrophage TARM1 degradation during AKI. Upon LPS or other risk factors stimulation, TARM1 is upregulated and stimulates proinflammatory cytokine production by renal macrophages to induce AKI. Meanwhile, E3 ubiquitin ligases MARCHF1 and MARCHF8 can ubiquitylate and degrade TARM1 via the autophagy receptors TAX1BP1 and SQSTM1-dependent mechanism, which attenuates macrophage-mediated renal inflammation in AKI. In contrast, autophagy deficiency in macrophages promotes macrophage-mediated AKI.
Autophagy dysfunction in renal intrinsic cells is associated with various kidney diseases, including AKI [38]. Whether autophagy affects the functions of macrophages, a key component of the innate immune system, remains unclear in AKI. It has been shown that biglycan evokes autophagy in macrophages to limit the inflammatory responses in the kidneys subjected to IR [39]; in contrast, the suppression of macrophage autophagy by beclin1 siRNA attenuates lupus nephritis by decreasing autoantibody production [40]. These controversial data suggest that the role of macrophage autophagy in kidney diseases may be disease-type dependent. Here, we demonstrated for the first time that autophagy in renal macrophages was activated and detected by utilizing single-cell transcriptome analysis, immunofluorescence, and macrophage-specific tandem-tagged mCherry-EGFP-LC3 transgenic mice, which provides a method to dynamically observe the changes of autophagy in macrophages in vivo. Then autophagy suppression on macrophage-mediated inflammatory responses was verified in different AKI mouse models. As known that deletion of Atg5 under Lyz2-Cre suppresses autophagy in macrophages and other cells [27]. Therefore, we next utilized the adoptive transfer strategies above to identify that the macrophage compartment is the crucial subset contributing to increased kidney inflammation in myeloid cell-specific atg5 deletion mice with AKI. This solid evidence makes the protective role of macrophage autophagy in AKI more convincing than previous studies [41,42].
Although the suppression of autophagy in proinflammatory responses in macrophages was reported in acute liver injury and cytokine storm syndromes [25,43,44], a few studies have attempted to elucidate their molecular mechanisms. It has been reported that the ubiquitin-specific peptidase 5 recruits MARCHF7 to degrade NLRP3 in the autophagy-lysosome pathway [45]. In addition, TARM1 is a novel leukocyte receptor expressed in neutrophils, macrophages, and dendritic cells [28]. Furthermore, in response to LPS, or Mycobacterium tuberculosis infection, TARM1 enhances inflammatory cytokine production in macrophages by interacting with the immunoreceptor tyrosine-based activation motif-bearing signaling adaptor [28,46,47]. In this study, we demonstrated that autophagy deficiency in macrophages induced the accumulation of TARM1, which in turn promoted inflammatory cytokine production in autophagy-deficient macrophages. This data indicates a novel mechanism that autophagy suppresses macrophage-mediated inflammatory responses through the degradation of TARM1.
Next step, we have explored the fact that TARM1 cooperated with TLR4 to activate inflammatory responses in macrophages depending on the SYK-NFKB-pathway, our study uncovers the downstream mechanism of how TARM1 regulates inflammation [28,29,46,47]. Many studies have shown that membrane receptors internalized by endocytosis are targeted by the endosomal sorting complex required for transport/ESCRT machinery through multivesicular bodies/MVBs for lysosomal degradation [48–50]. Autophagy is formerly perceived to capture cytoplasmic proteins and organelles, not internalized membrane receptors, into autophagosomes for lysosome degradation [51]. Here, we demonstrated that autophagy is indispensable for lysosome-mediated TARM1 degradation. Similarly, recent studies showed that internalized receptors are delivered to lysosomes for degradation via LC3C- or GABARAPL2/GATE-16-mediated autophagy [35,52].
It was illustrated that MARCHF1 and MARCHF8 play crucial roles in negatively regulating immune cell activation, as the knockdown of either MARCHF1 or MARCHF8 results in the activation of inflammation [53–55]. It was well known that MARCHF1 and MARCHF8 containing E3 ubiquitin ligases with a variant Really Interesting New Gene/RING-CH domain, play critical roles in ubiquitination and removal of their target proteins, such as MHC class molecules, from the plasma membrane into lysosomes for degradation [56–58]. In addition, TARM1 is a leukocyte immunoglobulin-like receptor expressed on the cell membrane [28], therefore we postulated that MARCHF1 and MARCHF8 mediate the ubiquitination of TARM1, facilitating its internalization into the cytosol. In this study, we found that MARCHF1 and MARCHF8 interacted with TARM1 and then, facilitate the ubiquitination and subsequent degradation of TARM1 through autophagy rather than proteasome-mediated proteolysis mechanism.
Finally, we identified the two important amino acids of K286 and K293 ubiquitinated by MARCHF1 and MARCHF8 as indispensable for the endocytosis of TARM1, which is a key step to diminish TARM1-mediated inflammatory responses. In addition, we unveiled that ubiquitinated TARM1 was recognized and transported to autophagosomes for degradation dependent on autophagy receptors TAX1BP1 and SQSTM1, which may be medicated through their ubiquitin-associated domain [59]. This result is consistent with a recent investigation that suggested that the internalized receptors accumulate on the endosomal surface can be subsequently recognized by the autophagy receptors NBR1 and SQSTM1 and then, enveloped by autophagosome for degradation [60].
In conclusion, this study provides novel evidence that demonstrates the protective role of macrophage autophagy in AKI and also demonstrates that autophagy regulates macrophage pro-inflammatory responses during AKI via MARCHF1- and MARCHF8-mediated TARM1 ubiquitination and degradation. Altogether, the results of this study suggest that the activation of autophagy in macrophages may represent a novel therapeutic strategy for AKI.
Materials and methods
Kidney biopsy of patients with AKI
According to Global Outcomes 2012 Clinical Practice Guideline, AKI was defined as any of the following: increase in SCr ≥0.3 mg/dL within 48 h or increase in SCr ≥ 1.5 times baseline in 7 days or urine volume <0.5 mL/kg/hour for 6 h. After written informed consent, adult patients with AKI diagnosis and renal biopsy were admitted Group. Based on renal biopsy, pathologically confirmed minimal change nephropathy as the control group (n = 3) and acute tubular necrosis as AKI group (n = 3). The procedures were approved by the Ethics Committee of Human Experimentation of Affiliated Hospital of Guangdong Medical University (NO.YJYS2022062) and were in accordance with the Helsinki Declaration of 2013.
Generation of transgenic mice
C57BL/6J-Atg5flox/+ and Lyz2-Cre mice with a C57BL/6 genetic background were purchased from the Shanghai Model Organisms Center, Inc. (Shanghai, China). Atg5flox/+ mice were self-crossed to produce Atg5flox/flox (abbreviated WT) mice. WT mice were then crossed with Lyz2-Cre mice (carrying the Cre recombinase inserted in the Lyz2/LysM gene locus) to generate Atg5flox/+-Lyz-Cre mice, which were later crossed with WT to obtain macrophage-specific autophagy deficiency WT-Lyz-Cre mice (abbreviated atg5−/−); WT mice were used as controls.
To generate transgenic mice with macrophage-specific expression of tandem-tagged mCherry-EGFP-LC3, we obtained CAG promoter-loxp-stop-loxp-mCherry-EGFP-LC3 mice (Lc3tg/+) from the Shanghai Model Organisms Center. The CAG promoter-loxp-stop-loxp-mCherry-EGFP-LC3-WPRE-polyA expression cassette was inserted into the Rosa26 gene locus using CRISPR-Cas9 technology via homologous recombination. Lc3tg/+ mice were then bred to obtain Lc3tg/tg mice. These mice were subsequently crossed with Lyz-Cre mice to generate Lc3tg/tg; Lyz-Cre mice, which knocked out the loxp-polyA-loxp expression box and specifically overexpressed tandem-tagged mCherry-EGFP-LC3 under the drive of the CAG promoter in macrophages.
All mice were bred and maintained under specific pathogen-free conditions with a 12-h dark/light cycle. All animal experiments were conducted in accordance with institutional animal guidelines approved by the Institutional Animal Care and User Committee of Guangdong Medical University (No. GDY1802005).
Induction of AKI in mice
Female mice aged 8–10 weeks were used to establish the LPS-induced SA-AKI model. To assess the effects of LPS on mortality, the mice (n = 10) were intraperitoneally injected with LPS (Sigma-Aldrich, L2630) at a single dose of 5 mg/kg. The survival of the mice was analyzed using the Kaplan – Meier survival curve method, which revealed the dose of 5 mg/kg is highly toxic (Figure 2A). Therefore, we reduced the dose to 1 mg/kg LPS to establish the LPS-induced AKI model. Control mice were administered with the same volume of saline solution. All groups of mice were sacrificed 24 h after the LPS injection.
Male mice aged 8–10 weeks were used to establish the unilateral IR-induced AKI model. Briefly, under pentobarbital sodium (50 mg/kg)-induced anesthesia, mouse flank incisions were made to expose the kidneys, followed by clamping the left kidney pedicle for 30 min to induce ischemic injury. During the surgery, the body temperature of the mouse was maintained at 36.5–37.3°C via a homeothermic pad. The same procedure without renal pedicle clamping was performed in the sham control mice. The mice were sacrificed on day 3 after surgery for further experiments.
Preparation and adoptive transfer of BMDMs or RAW 264.7 macrophages
To prepare BMDMs, bone marrow cells were isolated from the tibiae and femurs of 8–10 weeks-old atg5−/− and WT mice. Following lysis of red blood cells, bone marrow cells were cultured in DMEM (HyClone, SH30243.01; 4.5 g/L glucose) supplemented with 1% penicillin-streptomycin solution, 10% FBS, and CSF1/M-CSF (Sino Biological 51,112-MNAH; 20 ng/mL) for 7–8 days with replacing fresh DMEM every 3 days, during which the bone marrow cells were induced into mature BMDMs and appeared as adherent cells.
The recipient female mice (for example, atg5−/− mice) were randomly divided into two groups to receive mature BMDMs from atg5−/− and WT mice. Alternatively, atg5−/− or WT RAW 264.7 macrophages were adoptively transferred into the recipient male C57BL/6J mice. Before the adoptive transfer of macrophages, the recipient mice were intravenously injected via tail with clodronate liposomes (Liposoma, C-005) at 0.1 mL/10 g body weight to deplete the circulating macrophages. After 24 h of clodronate liposome administration, the recipient mice were administered with mature BMDMs or RAW 264.7 macrophages (1 × 10⁶ cells per mouse in a volume of 100 µL) by tail vein injection, and LPS was injected intraperitoneally to induce AKI simultaneously. Mice were sacrificed 24 h after LPS administration. As shown in Figure S3F, the expression of ATG5 was not observed in renal ADGRE1+ macrophages in mice receipted with atg5−/− BMDMs compared to those receipted with WT BMDMs, which revealed the success of adoptive transfer experiments.
Renal function measurement
Plasma creatinine concentrations were measured according to the manufacturer’s instructions (Nanjing Jiancheng Bioengineering Institute, C011-2-1).
Histology and immunohistochemical staining
Mouse renal tissues were fixed in Carnoy’s solution (Proandy 10,313–1) for 24 h, dehydrated, embedded in paraffin, and cut into 3-μm sections. The sections were dewaxed and stained with hematoxylin and eosin (H&E) for morphometric analysis.
For Immunohistochemical staining, the slides were routinely deparaffinized, rehydrated, and underwent microwave antigen retrieval in citrate buffer (Beyotime Biotechnology, P0081) for 15 min, blocked with 3% H2O2 and 5% bovine serum albumin (BSA; BOSTER, AR0004), and incubated with primary antibodies against HAVCR1/KIM-1 (R&D Systems, AF1817) and ADGRE1/F4/80 (Cell Signaling Technology, D2S9R) overnight at 4°C. The corresponding secondary horseradish peroxidase-conjugated antibodies (Sigma-Aldrich, AP106P) were incubated for 1 h at room temperature. After diaminobenzidine/DAB (Beijing Zhongshan Biotechnology, ZLI-9017) exposure for visualization, the staining images were observed under a microscope with a DP74 camera (Olympus, Tokyo, Japan) and analyzed using ImageJ (NIH, Bethesda, MD).
Frozen kidney sections were used to detect target protein expression. The sections were first blocked with 5% BSA and incubated with antibodies against CD68 (Abcam, ab955), LC3 (Abcam, ab51520), ADGRE1/F4/80 (Bio-Rad, MCA497GA), ATG5 (Proteintech 66,744–1-IG), Flag-Tag (Proteintech 66,008–4-Ig), MYC-Tag (Proteintech 16,286–1-AP), His-Tag (Proteintech 66,005–1-IG), SQSTM1 (MBL, PM045), NBR1 (Proteintech 16,004–1-AP), TAX1BP1 (Invitrogen 702,840), and EEA1 (Proteintech, CL488–68065) overnight at 4°C. Secondary antibodies, including Alexa Fluor® 488 goat anti-rabbit IgG (Abcam, ab60314), Alexa Fluor ® 594 goat anti-rat IgG (Invitrogen, A11005), Alexa Fluor ® 594 donkey anti-mouse IgG (Invitrogen, A21203), and Alexa Fluor ® 647 donkey anti-rat IgG (Invitrogen, A78947), were incubated at room temperature for 1 h. Nuclei were counterstained with 4’,6-diamidino-2-phenylindole/DAPI (Beyotime Biotechnology, C1005). Images were obtained using a confocal fluorescence microscope (IX81, Olympus).
Western blot analysis
Western blotting was performed as described previously [61]. Kidney tissues were lysed with RIPA buffer (Beyotime Institute of Biotechnology, P0013B) containing a protease inhibitor cocktail (Beyotime Institute of Biotechnology, ST506–2) and a phosphatase inhibitor (Applygen, P1260). The protein concentration was measured using the Pierce™ BCA Protein Assay Kit (Thermo Fisher Scientific 23,225). Equal amounts of protein were loaded in each lane, separated by sodium dodecyl sulfate-polyacrylamide gel electrophoresis, and transferred to PVDF membranes. The membranes were blocked with 5% BSA at room temperature for 1 h, then incubated with primary antibodies against HAVCR1/KIM-1 (R&D Systems, AF1817), NLRP3 (Novus, NBP177080), GAPDH (Absin, abs830030), IL18 (Abcam, ab71495), CCL2/MCP-1 (Cell Signaling Technology 41,987), ACTB (Proteintech 20,536–1-ap), NOS2 (Abcam, ab3523), ATG5 (Abcam, ab108327), TARM1 (Santa Cruz Biotechnology, sc -514,218), SYK (Bioss, bs-0685 R), p-SYK (Bioss, bs-3434 R), RELA/p65 (abcam, ab32536), p-RELA/p65 (abcam, ab86299), MARCHF1 (Abmart, PA4324S), MARCHF8 (Proteintech 14,119–1-AP), MYC-Tag (Proteintech 16,286–1-AP), His-Tag (Proteintech 66,005–1-IG), Flag-tag (Proteintech 66,008–4-Ig), HA-Tag (Roche 11,867,423,001), TUBA/tubulin (Santa Cruz Biotechnology, sc -32,293), LC3 (Abcam, ab51520), SQSTM1 (MBL, PM045), NBR1 (Proteintech 16,004–1-AP), OPTN/optineurin (Proteintech 10,837–1-AP), CALCOCO2/NDP52 (Proteintech 12,229–1-AP) and TAX1BP1 (Invitrogen 702,840) at 4°C overnight. The membranes were then incubated with appropriate HRP-conjugated secondary antibodies (Sigma-Aldrich 401,215, AP106P, and 401,315). Antibody staining was visualized using Clarity Western ECL Substrate (Bio-Rad 1,705,060). Chemiluminescent signals were detected using a Western Blot Imaging System (C500, Azure Biosystems, Dublin, CA, USA). The linear response range of the detection system was established using a two-fold dilution series for protein loading. Appropriate protein loading was selected to ensure that band detection was within the linear range of the detection system.
Flow cytometry
Mouse kidney tissue was harvested and cut into 1-mm3 cubes. The small cubes were then digested with Liberase TM (Roche, 8482) at 37°C with shaking for 30 min. After red cell lysis, the digested tissues and mouse blood were filtered using a 40-μm strainer to reach a suitable cell size requirement for flow cytometry. Afterward, cells from the tissue and blood were fixed using an intracellular fixation buffer (Invitrogen, 88-8824-00). After blocking with 5% BSA, the cells were stained with fluorophore-conjugated primary antibodies at room temperature for 30 min. Antibodies against cell surface antigens used for staining were PTPRC/CD45 (BD Biosciences 553,080), NOS2 (Invitrogen 56,592,082), and ADGRE1/F4/80 (eBioscience, MF48021). Flow cytometry was performed on a BD Flow Cytometer (BD Biosciences). Flow Jo software (Tree Star, Ashland, USA) was used for data analysis and visualization.
Construction of plasmids
HA-Ub was generous with a gift from Dr Hong-Rui Wang. Mouse Marchf8 cDNA and Tarm1 cDNA were cloned from RAW 264.7 cells using reverse transcription PCR; The cDNA for Mouse Marchf1 (GOSE0381200) was purchased from Shanghai Genechem Company and Sytl4 cDNA (P39817), Sqstm1 cDNA (P22814), and Tax1bp1 cDNA (G44110) was purchased from MiaoLingBio company. Mutations in the RING-CH domain of MARCHF1 and MARCHF8 were generated by polymerase chain reaction (PCR) – based site-directed mutagenesis according to the previous report [62]. The mutation of TARM1 was generated through site-directed mutagenesis using polymerase chain reaction (PCR), resulting in the substitution of lysine with arginine at positions K286 and K293. Expression plasmids for various proteins were carried out using pCDH-EF1-MCS-IRES-puro vectors or pLV3-CMV-MCS-EF1a-Blast vectors (G38497) purchased from MiaoLingBio company. The lentivirus Mir30-based shRNA knockdown vector pCDH-EF1-miR30-shRNA-IRES-puro or pLV3-U6-MCS-shRNA-EF1a-Blast was used for the expression of shRNA. pCDH-mCherry or pLV3-mCherry as control group. The primers used in these papers were described in Table S2 and shRNA sequences in Table S3.
Cell culture, drug treatment, and transfection
RAW 264.7 macrophages (CL-0190) and HEK293T cells (CL-0005) purchased from Wuhan Procell Company were cultured in DMEM (4.5 g/L glucose) supplemented with 1% penicillin-streptomycin solution and 10% FBS in a humidified atmosphere of 5% CO2 at 37°C. For pharmacological treatment, cells were pretreated with 1 μM MG132 (Selleck, S2619), 10 μM rapamycin (Sigma-Aldrich, V900930), 1 μM torin1 (MedChemExpress, HY-13003), 10 μM chloroquine (Sigma-Aldrich, C6628), 25 nM bafilomycin A1 (Selleck, S1413), 10 μM wortmannin (Selleck, S2758), 10 μM LY294002 (Selleck, S1105), 20 μM piceatannol (Selleck, S3026), 20 μM JSH-23 (Selleck, S7351), 10 μg/mL IgG-Carrier Free (FC; Acmec, AC80066), or 10 μg/mL TARM1-FC (R&D 10,000-TA-050) for 1 h and then 100 ng/mL LPS (Sigma-Aldrich, L4391) and 50 ng/mL IFNG (R&D, 485-MI-100) was added and incubated for 24 h. RAW 264.7 macrophages were pretreated with 100 ng/mL LPS and 50 ng/mL IFNG for 8 h, then stimulated with 500 μg/mL cycloheximide for 2, 4, and 8 h. HEK293T cells were transiently transfected using the polyethylenimine (PEI polyscience 23,966–100) method. The ViraPower Lentiviral Expression System (Invitrogen) was used to generate recombinant lentivirus for infecting RAW 264.7 cells. For siRNA (small interfering RNA) transfection, the cell suspension was treated with siRNA or negative control (NC) and GP-transfect-mate (GenePharma Company, G04008) according to the manufacturer’s instructions.
Immunoprecipitation and protein pulldown
For our coimmunoprecipitation experiments, cells were washed once with cold 1× PBS and harvested using IP lysis buffer (Meilunbio, MB9900). Coimmunoprecipitation was performed using the BeyoMag™ Protein G Magnetic Beads (Beyotime Institute of Biotechnology, P2105) according to the manufacturer’s protocol with slight modifications. Briefly, 25 μL BeyoMag™ Protein G Magnetic Beads were preincubated with 0.5 μg of anti-Flag (Sigma-Aldrich, F3165) or an equal amount of IgG isotype antibody (Beyotime Institute of Biotechnology, A7028). Cell lysates were incubated with antibody-coated BeyoMag™ Protein G Magnetic Beads overnight at 4°C, followed by washing and elution. The eluted fractions were subjected to SDS-PAGE and western blot analysis.
For our protein affinity isolation experiments, cells were washed once with cold 1× PBS and harvested using cell lysis buffer (6 M guanidinium-HCl, 0.1 M Na2HPO4/NaH2PO4, 0.01 M Tris HCl, pH 8.0, 5 mM imidazole, 20 mM N-ethylmaleimide). The protein was affinity isolated by HisSep Ni-NTA Agarose Resin 6FF (Yeasen, 20503ES10) following the manufacturer’s protocol. In brief, the cell lysate containing overexpressed TARM1-His was incubated with HisSep Ni-NTA Agarose Resin 6FF overnight at 4°C, followed by washing and elution. The eluted fractions were subjected to SDS-PAGE and western blot analysis.
Alternatively, to detect whether TAX1BP1 and SQSTM1 binds to TARM1-Ub, HEK293T cells were co-transfected with TARM1-HA, His-Ub, TAX1BP1-Strep-Flag, SQSTM1-Strep-Flag, MARCHF8-MYC or empty vector plasmids. Then, TAX1BP1 and SQSTM1 were affinity isolation by using STarm Streptactin Beads 4FF (Smart-Lifesciences, SA092005). The subsequent proteins in conjunction with TAX1BP1 and SQSTM1 were dissociated with a potent degeneration cell lysis buffer. Subsequently, His-Ub was affinity isolated by HisSep Ni-NTA Agarose Resin 6FF, and western blotting was performed to detect the expression of TARM1.
Renal single-cell RNA sequencing analysis
The single-cell suspension was adjusted to single-cell library preparation and sequencing, as previously described [63]. The clusters for cell type identification were based on NormalizeData and ScaleData functions to normalize and scale all gene expression and selected the top 2000 variable genes with FindVariableFeautres function for PCA analysis then used the top 20 principal components to separate cells into multiple clusters with FindClusters. Finally, the UMAP algorithm was applied to visualize cells in a two-dimensional space. The differentially expressed genes (DEGs) identification was the Seurat FindMarkers function based on the Wilcox likelihood-ratio test with default parameters and selected the genes expressed in more than 10% of the cells in a cluster and with an average log (Fold Change) value greater than 0.25 as DEGs.
Proteomics and data analysis
The bone marrow-derived macrophage cells (5 × 10⁷ cells) were dissolved in 300 μL of SDT lysis buffer (4% SDS, 100 mM Tris-HCl, 1 mM DTT, pH 7.6). Protein digestion by trypsin (Gibco 25,200–056) was performed according to the filter-aided sample preparation procedure described by Matthias Mann [64]. The digest peptides of each sample were desalted on MCX Cartridges (omicsolution, OS-MCX-1 ML), concentrated by vacuum centrifugation, and reconstituted in 40 µL of 0.1% (v:v) formic acid.
LC-MS/MS analysis was performed on a Q Exactive mass spectrometer (Thermo Scientific) that was coupled to Easy nLC (Proxeon Biosystems). The peptides were loaded onto a reverse phase trap column (Thermo Scientific 164,535; Acclaim PepMap100) connected to the C18-reversed phase analytical column (Thermo Scientific Easy Column, DNV75150PN) in buffer A (0.1% formic acid) and separated with a linear gradient of buffer B (84% acetonitrile and 0.1% formic acid) at a flow rate of 300 nl/min controlled by IntelliFlow technology. The mass spectrometer was operated in positive ion mode, with the Orbitrap operating at 70,000 FWHM and 17,500 FWHM for MS and MS/MS, respectively. The 10 most abundant ions were selected for MS/MS.
The MS raw data for each sample were combined and searched using the MaxQuant 1.5.3.17 software for identification and quantitation analysis. Cluster 3.0 (http://bonsai.hgc.jp/~mdehoon/software/cluster/software.htm) and Java Treeview software (http://jtreeview.sourceforge.net) were used to perform hierarchical clustering analysis. Differentially expressed proteins were determined by setting a threshold for Log2 difference greater than 2 or smaller than − 2 and a p value < 0.05 (T-test). We thank Shanghai Applied Protein Technology for the collection of proteomics data.
Statistical analysis
Data are presented as the mean ± standard error of the mean from at least three independent experiments. GraphPad Prism version 5 (GraphPad Software, Inc.) was used for statistical analyses and graphical representation. The Student’s t-test was used to compare the means of two groups. Comparisons between multiple groups were performed using one-way or two-way ANOVA followed by Tukey’s post hoc test. Statistical significance was set at p < 0.05.
Supplementary Material
Acknowledgements
The authors thank Shao-ping Zhu for feeding experimental mice, Dan Wu, and Li-feng Huang for their help during in vivo experiments, Shang-mei Li for her expertise in kidney biopsy of patients, and Jian-song Qi and Zheng-zhao Liu for English language editing. We also thank Prof. Juan Cai from The Second Xiangya Hospital, Central South University for her help in molecular biology experiments.
Funding Statement
This work was supported by the National Natural Science Foundation of China (grant numbers: 82370705, 81700627, 81670654, and 81974095), the Natural Science Foundation of Guangdong Province (grant numbers: 2021A1515011581 and 2023A1515030024 and 2019A1515010678), Guangdong Provincial Key Laboratory of Autophagy and Major Chronic Non-Communicable Diseases (2022B1212030003), Discipline Construction Project of Guangdong Medical University (4SG21229G), the Science and Technology Planning Project of Zhanjiang City (grant numbers: 2018A01040 and 2018A01034), National Clinical Key Specialty Construction Project (Institute of Nephrology, Affiliated Hospital of Guangdong Medical University), and the Affiliated Hospital of Guangdong Medical University Clinical Research Program (grant number: LCYJ2018C008).
Disclosure statement
No potential conflict of interest was reported by the author(s).
Data availability statement
The data supporting the findings of this study are available from the corresponding author upon reasonable request.
Supplementary material
Supplemental data for this article can be accessed online at https://doi.org/10.1080/15548627.2024.2393926
References
- [1].Lafrance JP, Miller DR.. Acute kidney injury associates with increased long-term mortality. J Am Soc Nephrol. 2010;21(2):345–352. doi: 10.1681/ASN.2009060636 PMID:2001R9168. [DOI] [PMC free article] [PubMed] [Google Scholar]
- [2].Uchino S, Kellum JA, Bellomo R, et al. Acute renal failure in critically Ill patients a multinational, multicenter study. JAMA. 2005;294(7):813–818. doi: 10.1001/jama.294.7.813 PMID:16106006. [DOI] [PubMed] [Google Scholar]
- [3].Murugan R, Kellum JA. Acute kidney injury: what’s the prognosis? Nat Rev Nephrol. 2011;7(4):209–217. doi: 10.1038/nrneph.2011.13 PMID:21343898. [DOI] [PMC free article] [PubMed] [Google Scholar]
- [4].Li PK, Burdmann EA, Mehta RL. Acute kidney injury: global health alert. Kidney Int. 2013;83(3):372–376. doi: 10.1038/ki.2012.427 PMID:23302721. [DOI] [PubMed] [Google Scholar]
- [5].Coca SG, Singanamala S, Parikh CR. Chronic kidney disease after acute kidney injury: a systematic review and meta-analysis. Kidney Int. 2012;81:442–448. doi: 10.1038/ki.2011.379 PMID:22113526 [DOI] [PMC free article] [PubMed] [Google Scholar]
- [6].Rabb H, Griffin MD, McKay DB, et al. Inflammation in AKI: current understanding, key questions, and knowledge gaps. J Am Soc Nephrol. 2016;27(2):371–379. doi: 10.1681/ASN.2015030261 PMID:26561643. [DOI] [PMC free article] [PubMed] [Google Scholar]
- [7].Jang HR, Rabb H. Immune cells in experimental acute kidney injury. Nat Rev Nephrol. 2015;11(2):88–101. doi: 10.1038/nrneph.2014.180 PMID:25331787 [DOI] [PubMed] [Google Scholar]
- [8].Lee S, Huen S, Nishio H, et al. Distinct macrophage phenotypes contribute to kidney injury and repair. J Am Soc Nephrol. 2011;22(2):317–326. doi: 10.1681/ASN.2009060615 PMID:21289217 [DOI] [PMC free article] [PubMed] [Google Scholar]
- [9].Wynn TA, Vannella KM. Macrophages in tissue repair, regeneration, and fibrosis. Immunity. 2016;44(3):450–462. doi: 10.1016/j.immuni.2016.02.015 PMID:26982353 [DOI] [PMC free article] [PubMed] [Google Scholar]
- [10].Basile DP, Bonventre JV, Mehta R, et al. Progression after AKI: understanding maladaptive repair processes to predict and identify therapeutic treatments. J Am Soc Nephrol. 2016;27(3):687–697. doi: 10.1681/ASN.2015030309 PMID:26519085 [DOI] [PMC free article] [PubMed] [Google Scholar]
- [11].Kinsey GR. Macrophage dynamics in AKI to CKD progression. J Am Soc Nephrol. 2014;25(2):209–211. doi: 10.1681/ASN.2013101110 PMID:24309186 [DOI] [PMC free article] [PubMed] [Google Scholar]
- [12].Lv LL, Tang PM, Li CJ, et al. The pattern recognition receptor, Mincle, is essential for maintaining the M1 macrophage phenotype in acute renal inflammation. Kidney Int. 2017;91(3):587–602. doi: 10.1016/j.kint.2016.10.020 PMID:28017324 [DOI] [PubMed] [Google Scholar]
- [13].Tang PM, Nikolic-Paterson DJ, Lan HY. Macrophages: versatile players in renal inflammation and fibrosis. Nat Rev Nephrol. 2019;15(3):144–158. doi: 10.1038/s41581-019-0110-2 PMID:30692665. [DOI] [PubMed] [Google Scholar]
- [14].Liu BC, Tang TT, Lv LL, et al. Renal tubule injury: a driving force toward chronic kidney disease. Kidney Int. 2018;93(3):568–579. doi: 10.1016/j.kint.2017.09.033 PMID:29361307 [DOI] [PubMed] [Google Scholar]
- [15].Liu JX, Yang C, Zhang WH, et al. Disturbance of mitochondrial dynamics and mitophagy in sepsis-induced acute kidney injury. Life Sci. 2019;235:116828. doi: 10.1016/j.lfs.2019.116828 PMID:31479679 [DOI] [PubMed] [Google Scholar]
- [16].An N, Yang C, Wu HL, et al. Hydroxychloroquine administration exacerbates acute kidney injury complicated by lupus nephritis. Arthritis Res Ther. 2022;24(1):6. doi: 10.1186/s13075-021-02700-x PMID:34980245 [DOI] [PMC free article] [PubMed] [Google Scholar]
- [17].Shi M, Maique J, Shepard S, et al. In vivo evidence for therapeutic applications of beclin 1 to promote recovery and inhibit fibrosis after acute kidney injury. Kidney Int. 2022;101(1):63–78. doi: 10.1016/j.kint.2021.09.030 PMID:34736972 [DOI] [PMC free article] [PubMed] [Google Scholar]
- [18].Jiang M, Wei Q, Dong G, et al. Autophagy in proximal tubules protects against acute kidney injury. Kidney Int. 2012;82(12):1271–1283. doi: 10.1038/ki.2012.261 PMID:22854643 [DOI] [PMC free article] [PubMed] [Google Scholar]
- [19].Baisantry A, Bhayana S, Rong S, et al. Autophagy induces prosenescent changes in proximal tubular S3 segments. J Am Soc Nephrol. 2016;27(6):1609–1616. doi: 10.1681/ASN.2014111059 PMID:26487561 [DOI] [PMC free article] [PubMed] [Google Scholar]
- [20].Chen P, Cescon M, Bonaldo P. Autophagy-mediated regulation of macrophages and its applications for cancer. Autophagy. 2014;10(2):192–200. doi: 10.4161/auto.26927 PMID:24300480 [DOI] [PMC free article] [PubMed] [Google Scholar]
- [21].Levine B, Deretic V. Unveiling the roles of autophagy in innate and adaptive immunity. Nat Rev Immunol. 2007;7(10):767–777. doi: 10.1038/nri2161 PMID:17767194 [DOI] [PMC free article] [PubMed] [Google Scholar]
- [22].An N, Chen Y, Wang C, et al. Chloroquine autophagic inhibition rebalances Th17/Treg-mediated immunity and ameliorates systemic lupus erythematosus. Cell Physiol Biochem. 2017;44(1):412–422. doi: 10.1159/000484955 PMID:29141242 [DOI] [PubMed] [Google Scholar]
- [23].Santeford A, Wiley LA, Park S, et al. Impaired autophagy in macrophages promotes inflammatory eye disease. Autophagy. 2016;12(10):1876–1885. doi: 10.1080/15548627.2016.1207857 PMID:27463423 [DOI] [PMC free article] [PubMed] [Google Scholar]
- [24].Liu K, Zhao E, Ilyas G, et al. Impaired macrophage autophagy increases the immune response in obese mice by promoting proinflammatory macrophage polarization. Autophagy. 2015;11(2):271–284. doi: 10.1080/15548627.2015.1009787 PMID:25650776 [DOI] [PMC free article] [PubMed] [Google Scholar]
- [25].Ilyas G, Zhao E, Liu K, et al. Macrophage autophagy limits acute toxic liver injury in mice through down regulation of interleukin-1β. J Hepatol. 2016;64(1):118–127. doi: 10.1016/j.jhep.2015.08.019 PMID:26325539 [DOI] [PMC free article] [PubMed] [Google Scholar]
- [26].Gump JM, Thorburn A. Sorting cells for basal and induced autophagic flux by quantitative ratiometric flow cytometry. Autophagy. 2014;10(7):1327–1334. doi: 10.4161/auto.29394 PMID:24915460 [DOI] [PMC free article] [PubMed] [Google Scholar]
- [27].Choi GE, Yoon SY, Kim JY, et al. Autophagy deficiency in myeloid cells exacerbates eosinophilic inflammation in chronic rhinosinusitis. J Allergy Clin Immunol. 2018;141(3):938–50.e12. doi: 10.1016/j.jaci.2017.10.038 PMID:29225084 [DOI] [PubMed] [Google Scholar]
- [28].Radjabova V, Mastroeni P, Skjødt K, et al. TARM1 is a novel leukocyte receptor complex–encoded ITAM receptor that costimulates proinflammatory cytokine secretion by macrophages and neutrophils. J Immunol. 2015;195(7):3149–3159. doi: 10.4049/jimmunol.1401847 PMID:26311901 [DOI] [PMC free article] [PubMed] [Google Scholar]
- [29].Mócsai A, Ruland J, Tybulewicz VL. The SYK tyrosine kinase: a crucial player in diverse biological functions. Nat Rev Immunol. 2010;10(6):387–402. doi: 10.1038/nri2765 PMID:20467426 [DOI] [PMC free article] [PubMed] [Google Scholar]
- [30].Morgan MJ, Liu ZG. Crosstalk of reactive oxygen species and nf-κB signaling. Cell Res. 2011;21(1):103–115. doi: 10.1038/cr.2010.178 PMID:21187859 [DOI] [PMC free article] [PubMed] [Google Scholar]
- [31].Liu T, Zhang L, Joo D, et al. Nf-κB signaling in inflammation. Signal transduction and targeted therapy. Signal Transduct Target Ther. 2017;2(1):17023. doi: 10.1038/sigtrans.2017.23 PMID:29158945 [DOI] [PMC free article] [PubMed] [Google Scholar]
- [32].Li Y, Li S, Wu H. Ubiquitination-proteasome system (UPS) and autophagy two main protein degradation machineries in response to cell stress. Cells. 2022;11(5):PMID:35269473. doi: 10.3390/cells11050851 [DOI] [PMC free article] [PubMed] [Google Scholar]
- [33].Chen X, Zhou Y, Zhao Y, et al. Targeted degradation of extracellular secreted and membrane proteins. Trends Pharmacol Sci. 2023;44(11):762–775. doi: 10.1016/j.tips.2023.08.013 PMID:37758536 [DOI] [PMC free article] [PubMed] [Google Scholar]
- [34].Foot N, Henshall T, Kumar S. Ubiquitination and the regulation of membrane proteins. Physiol Rev. 2017;97(1):253–281. doi: 10.1152/physrev.00012.2016 PMID:27932395 [DOI] [PubMed] [Google Scholar]
- [35].Coelho PP, Hesketh GG, Pedersen A, et al. Endosomal LC3C-pathway selectively targets plasma membrane cargo for autophagic degradation. Nat Commun. 2022;13(1):3812. doi: 10.1038/s41467-022-31465-3 PMID:35780247 [DOI] [PMC free article] [PubMed] [Google Scholar]
- [36].Migliano SM, Schultz SW, Wenzel EM, et al. Removal of hypersignaling endosomes by simaphagy. Autophagy. 2023;20(4):1–23. doi: 10.1080/15548627.2023.2267958 PMID:37840274 [DOI] [PMC free article] [PubMed] [Google Scholar]
- [37].Shaid S, Brandts CH, Serve H, et al. Ubiquitination and selective autophagy. Cell Death Differ. 2013;20(1):21–30. doi: 10.1038/cdd.2012.72 PMID:22722335 [DOI] [PMC free article] [PubMed] [Google Scholar]
- [38].Choi ME. Autophagy in kidney disease. Annu Rev Physiol. 2020;82(1):297–322. doi: 10.1146/annurev-physiol-021119-034658 PMID:31640469 [DOI] [PubMed] [Google Scholar]
- [39].Poluzzi C, Nastase MV, Zeng-Brouwers J, et al. Biglycan evokes autophagy in macrophages via a novel CD44/Toll-like receptor 4 signaling axis in ischemia/reperfusion injury. Kidney Int. 2019;95(3):540–562. doi: 10.1016/j.kint.2018.10.037 PMID:30712922 [DOI] [PubMed] [Google Scholar]
- [40].Li B, Yue Y, Dong C, et al. Blockade of macrophage autophagy ameliorates activated lymphocytes-derived DNA induced murine lupus possibly via inhibition of proinflammatory cytokine production. Clin Exp Rheumatol. 2014;32(5):705–714. PMID:25151985. [PubMed] [Google Scholar]
- [41].Yuan Y, Yuan L, Yang J, et al. Autophagy-deficient macrophages exacerbate cisplatin-induced mitochondrial dysfunction and kidney injury via miR-195a-5p-SIRT3 axis. Nat Commun. 2024;15(1):4383. doi: 10.1038/s41467-024-47842-z PMID:38782909 [DOI] [PMC free article] [PubMed] [Google Scholar]
- [42].Zhu Y, Tan J, Wang Y, et al. Atg5 deficiency in macrophages protects against kidney fibrosis via the CCR6-CCL20 axis. Cell Commun Signal. 2024;22(1):223. doi: 10.1186/s12964-024-01600-2 PMID:38594728 [DOI] [PMC free article] [PubMed] [Google Scholar]
- [43].Liu R, Cui J, Sun Y, et al. Autophagy deficiency promotes M1 macrophage polarization to exacerbate acute liver injury via ATG5 repression during aging. Cell Death Discov. 2021;7(1):397. doi: 10.1038/s41420-021-00797-2 PMID:34930917 [DOI] [PMC free article] [PubMed] [Google Scholar]
- [44].Wang YT, Sansone A, Smirnov A, et al. Myeloid autophagy genes protect mice against fatal TNF- and lps-induced cytokine storm syndromes. Autophagy. 2023;19(4):1114–1127. doi: 10.1080/15548627.2022.2116675 PMID:36056542 [DOI] [PMC free article] [PubMed] [Google Scholar]
- [45].Cai B, Zhao J, Zhang Y, et al. USP5 attenuates NLRP3 inflammasome activation by promoting autophagic degradation of NLRP3. Autophagy. 2022;18(5):990–1004. doi: 10.1080/15548627.2021.1965426 PMID:34486483 [DOI] [PMC free article] [PubMed] [Google Scholar]
- [46].Li X, Wang M, Ming S, et al. TARM-1 is critical for macrophage activation and Th1 response in Mycobacterium tuberculosis infection. The J Immunol. 2021;207(1):234–243. doi: 10.4049/jimmunol.2001037 PMID:34183366 [DOI] [PubMed] [Google Scholar]
- [47].Yabe R, Chung SH, Murayama MA, et al. TARM1 contributes to development of arthritis by activating dendritic cells through recognition of collagens. Nat Commun. 2021;12(1):94. doi: 10.1038/s41467-020-20307-9 PMID:33397982 [DOI] [PMC free article] [PubMed] [Google Scholar]
- [48].Wang W, Bian J, Sun Y, et al. The new fate of internalized membrane receptors: internalized activation. Pharmacol & Ther. 2022;233:108018. doi: 10.1016/j.pharmthera.2021.108018 PMID:34626676 [DOI] [PubMed] [Google Scholar]
- [49].Piper RC, Katzmann DJ. Biogenesis and function of multivesicular bodies. Annu Rev Cell Dev Biol. 2007;23(1):519–547. doi: 10.1146/annurev.cellbio.23.090506.123319 PMID:17506697 [DOI] [PMC free article] [PubMed] [Google Scholar]
- [50].Henne WM, Buchkovich NJ, Emr SD. The ESCRT pathway. Dev Cell. 2011;21(1):77–91. doi: 10.1016/j.devcel.2011.05.015 PMID:21763610. [DOI] [PubMed] [Google Scholar]
- [51].Pei J, Wang G, Feng L, et al. Targeting lysosomal degradation pathways: new strategies and techniques for drug discovery. J Med Chem. 2021;64(7):3493–3507. doi: 10.1021/acs.jmedchem.0c01689 PMID:33764774 [DOI] [PubMed] [Google Scholar]
- [52].Winer H, Fraiberg M, Abada A, et al. Autophagy differentially regulates TNF receptor Fn14 by distinct mammalian Atg8 proteins. Nat Commun. 2018;9(1):3744. doi: 10.1038/s41467-018-06275-1 PMID:30218067 [DOI] [PMC free article] [PubMed] [Google Scholar]
- [53].Majdoubi A, Lee JS, Kishta OA, et al. Lack of the E3 ubiquitin ligase March1 affects CD8 T cell fate and exacerbates insulin resistance in obese mice. Front Immunol. 2020;11:1953. doi: 10.3389/fimmu.2020.01953 PMID:32973799 [DOI] [PMC free article] [PubMed] [Google Scholar]
- [54].Kishta OA, Sabourin A, Simon L, et al. March1 E3 ubiquitin ligase modulates features of allergic asthma in an ovalbumin-induced mouse Model of lung inflammation. J Immunol Res. 2018;2018:3823910. doi: 10.1155/2018/3823910 PMID:29854835 [DOI] [PMC free article] [PubMed] [Google Scholar]
- [55].Chen R, Li M, Zhang Y, et al. The E3 ubiquitin ligase MARCH8 negatively regulates IL-1β-induced nf-κB activation by targeting the IL1RAP coreceptor for ubiquitination and degradation. Proc Natl Acad Sci USA. 2012;109(35):14128–14133. doi: 10.1073/pnas.1205246109 PMID:22904187 [DOI] [PMC free article] [PubMed] [Google Scholar]
- [56].Cho KJ, Walseng E, Ishido S, et al. Ubiquitination by march-I prevents MHC class II recycling and promotes MHC class II turnover in antigen-presenting cells. Proc Natl Acad Sci USA. 2015;112(33):10449–10454. doi: 10.1073/pnas.1507981112 PMID:26240324 [DOI] [PMC free article] [PubMed] [Google Scholar]
- [57].Tada T, Zhang Y, Koyama T, et al. MARCH8 inhibits HIV-1 infection by reducing virion incorporation of envelope glycoproteins. Nat Med. 2015;21(12):1502–1507. doi: 10.1038/nm.3956 PMID:26523972. [DOI] [PubMed] [Google Scholar]
- [58].Bauer J, Bakke O, Morth JP. Overview of the membrane-associated RING-CH (MARCH) E3 ligase family. N Biotechnol. 2017;38:7–15. doi: 10.1016/j.nbt.2016.12.002 PMID:27988304 [DOI] [PubMed] [Google Scholar]
- [59].Isogai S, Morimoto D, Arita K, et al. Crystal structure of the ubiquitin-associated (UBA) domain of p62 and its interaction with ubiquitin. J Biol Chem. 2011;286(36):31864–31874. doi: 10.1074/jbc.M111.259630 PMID:21715324 [DOI] [PMC free article] [PubMed] [Google Scholar]
- [60].Migliano SM, Schultz SW, Wenzel EM, et al. Removal of hypersignaling endosomes by simaphagy. Autophagy. 2024;20(4):769–791. doi: 10.1080/15548627.2023.2267958 PMID:37840274 [DOI] [PMC free article] [PubMed] [Google Scholar]
- [61].Ye L, Pang W, Huang Y, et al. Lansoprazole promotes cisplatin-induced acute kidney injury via enhancing tubular necroptosis. J Cell Mol Med. 2021;25(5):2703–2713. doi: 10.1111/jcmm.16302 PMID:33605079 [DOI] [PMC free article] [PubMed] [Google Scholar]
- [62].Umthong S, Lynch B, Timilsina U, et al. Elucidating the antiviral mechanism of different MARCH factors. MBio. 2021;12(2). doi: 10.1128/mBio.03264-20 PMID:33653895. [DOI] [PMC free article] [PubMed] [Google Scholar]
- [63].Xu J, Shen C, Lin W, et al. Single-cell profiling reveals transcriptional signatures and cell-cell crosstalk in anti-PLA2R positive idiopathic membranous nephropathy patients. Front Immunol. 2021;12:683330. doi: 10.3389/fimmu.2021.683330 PMID:34135910 [DOI] [PMC free article] [PubMed] [Google Scholar]
- [64].Wiśniewski JR, Zougman A, Nagaraj N, et al. Universal sample preparation method for proteome analysis. Nat Methods. 2009;6(5):359–362. doi: 10.1038/nmeth.1322 PMID: 19377485. [DOI] [PubMed] [Google Scholar]
Associated Data
This section collects any data citations, data availability statements, or supplementary materials included in this article.
Supplementary Materials
Data Availability Statement
The data supporting the findings of this study are available from the corresponding author upon reasonable request.