

ABSTRACT
Country foods (i.e. wild traditional food) are associated with improved nutrition for northern populations. In response to community concerns, a project was implemented from 2019 to 2021 in the Sahtú region, Northwest Territories, Canada, to: 1) analyse nutrition biomarkers (vitamins A, B1, B2, B6, B12, D, E, folate, P, Na) in blood samples, in order to assess nutritional status and identify nutrient deficiencies, and 2) use a survey to document how access to country foods may improve food security in the community of Tulít’a. Findings from the nutritional biomarker assessments (n = 128) indicated that 94% of participants experienced clinical vitamin D deficiency (<20 ng/L of plasma 25-hydroxy-vitamin D3) and 9% had folate deficiency (<8.7 nmol/L total folate). In the previous 12 months, 71% of participants did not always have money to get more food when needed, but 92% of participants said they were not left hungry. Country foods were used to increase the quality or quantity of the diet. Increasing country food consumption, such as fatty fish and large game meat and organs could mitigate the vitamin D and folate deficiencies. Policies should be implemented to improve food security in the North by facilitating access to country food.
KEYWORDS: Food security; country foods; North; indigenous peoples; nutrition, biomarkers, vitamins
Introduction
Country foods, which are wild-harvested food from the land, sea and sky, sometimes identified as subsistence food or traditional food by different populations, are integral to the health, wellness, and food security of the Indigenous Peoples living in communities within the Northwest Territories (NWT), Canada [1–4]. Further, the consumption of such country foods, especially wild-harvested fish, has been associated with lower risk factors for cardiovascular disease and diabetes [5–7].
Many Indigenous groups within Canada have reported in the last 20 years a higher reliance on store-bought food [8–10]. Despite this general trend, some residents within specific NWT Indigenous communities still rely on significant quantities of country foods as part of their diet [4,11,12].
Many factors, including the expensive cost of fresh foods in remote communities, contribute to widespread food insecurity for northern Indigenous populations [13]. Food insecurity is expected to worsen due to the ongoing impacts of climate change [14]. Food insecurity has been associated with lower levels and deficiencies of vitamins, such as vitamins A, B1, B2, B6, B12, and D [15,16]. Furthermore, the potential nutritional deficiencies due to food insecurity may be more prominent in northern locations, where daylight is limited during the winter which can lead to vitamin D deficiency. The prevalence of vitamin D deficiency can affect up to three-quarters of Inuit populations [17].
Food insecurity, and its consequences on health, may increase in the future from climate change [10,18]. Specifically, climate change impacts (e.g. drought, disaster, flooding) will affect crop production [19,20], with the potential to increase food insecurity. As the climate changes, migration routes and country food species availability in the region will also change [21]. Ferreira Guiné and colleagues found that the availability of food was a main determinant for undernutrition, resulting in the need to reformulate the four pillars of food security (availability, access, utilisation and stability), in order to encompass climate change impacts [22].
Within the context of both climate change and dietary transitions, promoting country food consumption provides several health benefits. Country foods, which include game meats, wild birds, fish and foraged foods encompass food ingredients and practices associated with a specific region or culture, and sourced locally [12]. Consuming a diet that includes country food can increase intake of low-fat foods and long-chain omega-3 fatty acids, mainly through fish consumption [23,24]. Additionally, country food harvesting activities increase physical activity and connection to the land. Country food consumption might also advance the food security and sovereignty of northern communities.
In the last few years, local and regional organisations of the Sahtú that focus on resource management and wellness have developed a strong interest in examining climate change impacts on food security and have implemented local initiatives and land-based programs to mitigate those changes.
The Sahtú region, NWT, is the home of Dene (First Nations) and Métis living in five communities (Fort Good Hope, Norman Wells, Tulı´t’a, Délı̨nę, and Colville Lake) [25]. The communities are small, with each between 152 and 763 residents [26]. They are located in the subarctic region (immediately south of the Arctic Circle in the boreal zone), are remote and are fly-in only for the majority of the year. Three of the Sahtú communities are provided supplies during the summer by barges, while two rely on trucks travelling to each community by winter road [27].
While food insecurity was assessed in 98 First Nations populations across the 10 provinces of Canada in the First Nations Food Nutrition and Environment Study [28], data from First Nations of the Northwest Territories were collected only through the First Nations Regional Health Survey [29]. In the Sahtú region, Délı̨nȩ and Tulít’a participated in this survey; publicly available data are aggregated for all the NWT First Nations and not available disaggregated by community.
The objectives of the current research were to: 1) measure blood biomarkers for nutritional status assessment and identification of nutrient deficiencies, and 2) document how country foods may improve food security. Our project is novel as it documents food use and food security in the region using a culturally refined survey, and quantifies a wide range of nutrition biomarkers to assess nutrient deficiencies. Recommendations for policy-makers are made based on the findings. This project will support local and regional efforts to help Sahtú people to maintain their food, security, health, safety, and well-being.
The research team has received support from the Northern Contaminants Program for an ongoing research program within northern Canada that included the use of dietary surveys (24 h recall and food frequency questionnaires), a health messages survey to document message awareness and perception, an exposure factor survey, the collection of blood, urine and hair samples in several Indigenous communities, and the measurement of contaminants and nutrition markers in environmental medias and foods [30]. Engagement with the communities indicated their interest in including more research specifically on nutrition biomarkers and food security.
Nutrient intake (e.g. Vitamins C, D, E) can alter toxicity and offset some of the adverse effects of contaminants found in some country foods (e.g. lead, mercury, persistent organic pollutants) [31–35]. The characterisation of both nutrient and contaminant exposures might improve the understanding of the risks and benefits of country foods and complement the previous biomonitoring project that had largely focused on contaminant biomarkers.
Methods
Nutrition biomarkers analysis
In the Sahtú, adults and children from three communities (i.e. K’asho Got’ine, Délı̨nę, Tulít’a) participated in a biomonitoring project. Details on the recruitment and design of the clinic component from the biomonitoring project can be found in other papers [11,30]. From the biomonitoring project, a total of 128 samples of blood plasma were kept in a biobank (−80°C) at the University of Waterloo for further analysis. Details on the approach of the broader project are described elsewhere [11,30]. Plasma samples were collected between February 2017 and March 2018.
The analysis of nutritional biomarkers was completed in January 2021. The nutritional biomarkers selected for analysis were identified to be the most potentially relevant indicators of food insecurity, while respecting the technical limitations of the available biospecimens (i.e. stability over time, type of collected sample).
The biomarkers quantified were: 25-Hydroxyvitamin D3 (biomarker of vitamin D); B12 (biomarker of cobalamin, vitamin B12); retinol (biomarker of vitamin A); alpha-tocopherol (biomarker of vitamin E); riboflavin, flavin adenine dinucleotide (FAD), flavin mononucleotide (FMN) (biomarkers of vitamin B2); pyridoxal 5’-phosphate (PLP), pyridoxal (PL), pyridoxic acid (PA) (biomarkers of vitamin B6); folic acid (FA), tetrahydrofolate (THF), 5,10-methenyl THF, 5-formyl THF, 5-methyl THF, Metfox (5-methyl THF oxidation product) (biomarkers of folate; vitamin B9), thiamine (vitamin B1), sodium, albumin, phosphorus. These vitamins have various essential roles in metabolism, hormone balance, blood cell production, maintenance of the vascular and nervous system, development, and the absorption of other nutrients.
The analysis of vitamins (A, B1, B2, B6, B12, D, E, folate) were completed at the University of British Columbia (UBC), in the UBC Nutritional Biomarker Laboratory and the Analytical Core for Metabolomics and Nutrition (ACMaN). Liquid chromatography coupled with tandem mass spectrometry (LC-MS/MS) was used for quantification and isotope ratio analysis of folate forms, and vitamins B1, B2, B6, and D and related metabolites. Total vitamin B12 was analysed by a fully automated immunoassay (Abbott Architect i2000). Vitamins A and E were analysed by High Performance Liquid Chromatography. The UBC Nutritional Biomarker Laboratory participated in two international inter-laboratory comparison studies for folate analyses organised by the US Centers for Disease Control and Prevention.
Macro-elements (P, Na) and albumin were quantified in the medical laboratory of Grand River Hospital, an associated centre of the University of Waterloo, using an integrated platform VITROS® 5600 providing chemistry and immunoassay testing.
Aggregate data were made available to participating communities according to the data management principles outlined in each community research agreement. Participants received an individual results letter on their own nutrition biomarker levels. The team at the University of Waterloo prepared a technical report on the aggregate results from the Sahtú region, which was shared with the communities by the Ɂehdzo Got’ı̨nę Gots’ę́ Nákedı – the Sahtú Renewable Resources Board (SRRB).
As per the larger biomonitoring project, the results letters were designed by a team of experts in exposure science, biomonitoring and nutrition, including risk communication experts. The letter template was also reviewed by community members with the SRRB. The strategy following the return of results was implemented following collaborations among the local research team, the academic team, representatives from the territorial Department of Health and Social Services, and the local healthcare providers. In summary, the result letter was designed to include enough information to contextualise personal results for participants to inform dietary approaches and practices. Participants with concerns regarding their results were invited to ask questions of the research team (remotely) and/or, meet with accessible and free of charge local healthcare providers.
Survey development and implementation
The Ɂehdzo Got’ı̨nȩ Gots’ḝ Nákedı (Sahtú Renewable Resources Board – SRRB), in collaboration with the academic team, developed a semi-quantitative food security survey, reviewed and refined with local input from three residents from Tulit’a selected by the SRRB for their interest in the project, and then implemented within the community of Tulít’a.
The final survey consisted of 35 questions divided into two sections: the first one on the role of country food for food security and the limits of accessing country foods, and the second one on commonly used questions and/or standardised questions (i.e. the food security module used in the First Nations Regional Health Survey [29]) assessing food security by financial means to buy food. The first section had 29 questions (on demographics, sources of water, climate change and country food). The majority of questions were formatted with multi-select response options while a few were open-ended. Responses for open-ended questions were subsequently re-coded into thematic categories based on expert judgement. The second section had 6 questions on food security assessment.
Survey questions included those from the First Nations Food, Nutrition and Environment Study (FNFNES), which is comprised of 18 semi-quantitative questions on the topic of household food security – an adapted version of the Household Food Security Survey Module [36]. Of the 18 questions on food security derived from previous studies, only six were kept in the final survey used in Tulit’a. The 12 questions that were removed were based on feedback from the local advisors saying that some questions weren’t relevant, would have felt invasive, or were not culturally appropriate.
A household food security assessment was previously done with more than 20 000 First Nations community members around Canada via the First Nations Regional Health Survey (RHS). Based on the Phase 3 RHS report [29], a food security index was adapted from the six-item US Household Food Security Survey Module [36]. The classification system used in the RHS is that one affirmation of the 6 items classifies a household as food insecure. There were some small differences between the food security survey questions used in this study and the RHS questions. For questions 30 and 31 in this study, the word “household” was not included. Despite this, these questions were deemed close enough to be directly compared. In the same manner that the RHS classified food security based on responses to the six questions, the sum of affirmative responses (1 point per question, except for the frequency question which is weighted as 2 points) to the six questions was used to calculate the participant’s score in our study. Food security status was assigned according to these scores.
The final selection of questions was approved by the local advisors (SRRB). See the Supplementary material for the whole survey.
The survey was designed in English and was implemented in the community of Tulít’a in early March 2020 (pre-pandemic). Adult participants residing in Tulít’a were recruited to complete the questionnaire. The survey participants had to be 19 years old or older and residing in Tulit’a. The implementation of the study served to pilot the survey, as well as gather information on the role of country foods to increase food security. Two local research coordinators were selected and recruited by the SRRB. The research coordinators were community members and received online training by the academic team.
According to the most recent estimates (2023), Tulít’a is home to 530 inhabitants [26], with about 430 adults. We aimed to recruit 5% of the adult population (n = 25), which was technically feasible within the context. This number was determined to be sufficient to gather enough information on the role of country foods to increase food security. Potential participants were contacted by phone or door-to-door by local research coordinators. Participants provided oral consent and surveys were completed in person. Coordinators had the autonomy to recruit the participants, with the aim to recruit all genders and different ages. A small honorarium (i.e. gift card) was offered to each participant. The research coordinator assisted participants in completing a hard copy of the survey. Scans of the surveys were sent to the University of Waterloo for data entry and analysis. Data were recorded in a Microsoft Excel file and analysed by a graduate student and the research manager.
Ethics
Ethics approval was received from the University of Waterloo (ORE #41522, #30543). Research licences were obtained from the Aurora Research Institute (#15966, 16021, 16185, 16697). Data management followed University of Waterloo guidelines, and respected OCAP® (Ownership, Control, Access and Possession) principles. OCAP® is a registered trademark of the First Nations Information Governance Centre [37]. Anonymised codification was used to de-identify samples and data. Participants who provided a blood sample received a letter reporting their individual results.
Data analysis
Descriptive frequencies were calculated using Microsoft Excel. Analytical statistics were calculated using IBM SPSS version 20. Differences in responses (categorical variables) were assessed using a Kruskal-Wallis test. Spearman correlation tests were used to assess associations between continuous variables (i.e. age, Body Mass Index (BMI), frequencies and servings) and nutrition biomarkers. The null hypothesis was rejected at p < 0.05, and therefore the test was considered statistically significant.
Results
Nutrition biomarkers
Demographics
Of the 128 participants who provided a blood plasma sample for nutrient analysis, 50% (n = 64) were women. Median age of the participant was 44, similar to the average of 44.4 years. Age ranged from 8 to 88 years old. The average age of women was 41.7, slightly lower than men (average of 47.1). Three participants chose not to report their age. The average BMI was 25.8 ± SD of 5.3.
Nutritional biomarkers in plasma samples
Nutrition biomarker levels were compared to clinical reference values when available (see Table 1 and Table 2). The clinical value ranges were usually within the levels where no clinical adverse effects would be observed.
Table 1.
Nutritional biomarkers quantified in plasma samples from Sahtú participants.
| Unit | na | AM | GM | Median | Min | Max | 5th P | 95th P | |
|---|---|---|---|---|---|---|---|---|---|
| Total vitamin B12 | (pmol/L) | 128 | 310.10 | 295.01 | 296.75 | 93.90 | 725.50 | 174.04 | 460.21 |
| Retinol (Vitamin A) | (ug/ml) | 128 | 0.83 | 0.80 | 0.83 | 0.30 | 1.37 | 0.50 | 1.18 |
| alpha tocopherol (Vitamin E) | (ug/ml) | 128 | 9.81 | 9.57 | 9.55 | 3.64 | 17.26 | 7.04 | 13.41 |
| Riboflavin (Vitamin B2) | (nmol/L) | 128 | 26.77 | 15.60 | 12.90 | 1.16 | 318.00 | 5.18 | 91.01 |
| FAD | (nmol/L) | 128 | 82.35 | 79.92 | 78.95 | 44.60 | 204.00 | 55.14 | 119.95 |
| FMN | (nmol/L) | 128 | 21.85 | 21.00 | 20.50 | 13.60 | 72.70 | 15.04 | 31.66 |
| PLP (Vitamin B6 status) | (nmol/L) | 128 | 92.05 | 65.25 | 59.15 | 7.00 | 621.00 | 26.62 | 282.40 |
| PL | (nmol/L) | 128 | 55.64 | 49.03 | 47.05 | 24.20 | 611.00 | 27.84 | 85.83 |
| PA | (nmol/L) | 128 | 45.18 | 37.39 | 35.45 | 20.20 | 770.00 | 23.27 | 70.64 |
| 25hydroxy vitamin D3 | (ng/ml) | 128 | 9.88 | 8.60 | 8.75 | 2.30 | 31.10 | 3.40 | 20.49 |
| 5-methyl THF | (nmol/L) | 128 | 14.51 | 12.78 | 12.20 | 2.64 | 32.90 | 5.49 | 28.65 |
| THF | (nmol/L) | 128 | 1.56 | 1.26 | 1.23 | 0.25 | 7.05 | 0.48 | 3.77 |
| 5,10-methenylTHF | (nmol/L) | 128 | 0.11 | 0.10 | 0.09 | 0.04 | 0.35 | 0.05 | 0.25 |
| Folic Acid | (nmol/L) | 128 | 1.03 | 0.81 | 0.74 | 0.30 | 17.20 | 0.46 | 1.40 |
| 5-formyl THF | (nmol/L) | 128 | 0.12 | 0.10 | 0.10 | 0.01 | 1.02 | 0.05 | 0.24 |
| MeFox | (nmol/L) | 128 | 4.38 | 3.74 | 3.79 | 0.46 | 14.00 | 1.47 | 9.46 |
| Total folateb | (nmol/L) | 128 | 17.33 | 15.61 | 14.46 | 4.99 | 41.68 | 7.67 | 32.59 |
| Total thiamine (vitamin B1) | (nmol/L) | 128 | 4.46 | 3.49 | 3.40 | 0.40 | 36.20 | 1.44 | 10.01 |
| Sodium | (mmol/L) | 123 | 138.05 | 138.04 | 138.00 | 133.00 | 142.00 | 135.00 | 140.00 |
| Albumin | (g/L) | 123 | 47.77 | 47.68 | 48.00 | 37.00 | 57.00 | 42.10 | 52.00 |
| Phosphorus | (mmol/L) | 123 | 1.17 | 1.15 | 1.15 | 0.75 | 1.67 | 0.80 | 1.46 |
aDetection rate of 100% beside for phosphorus which is 99%.
bSum of 5-Methyl THF, THF, 5,10-Methenyl THF, Folic Acid, 5-Formyl THF.
AM (Arithmetic Mean); GM (Geometric Mean); SD (Standard Deviation); P (Percentile).
Table 2.
Percentage of the participants (n = 123–128) with a biomarker level below the clinical reference valuea.
| Biomarker | Deficiency thresholda | Deficiency (%) |
|---|---|---|
| B12 | <133 pmol/L | 1.6 |
| Retinol | <0.325 ug/ml | 0.8 |
| alpha tocopherol | <5.5 ug/ml | 0.8 |
| B2 | <2.7 nmol/L | 3.1 |
| PLP | <20 nmol/L | 3.1 |
| 25hydroxy vitamin D3 | <20 ng/mL | 93.8 |
| Total folateb | <8.706 nmol/L | 8.6 |
| Sodium | <135 mmol/L | 3.3 |
| Albumin | <35 g/L | 0.0 |
| Phosphorus | <0.81 mmol/L | 5.7 |
aMayo labs, 2022bSum of 5-Methyl THF, THF, 5,10-Methenyl THF, Folic Acid, 5-Formyl THF
By comparing the 5th percentiles of the distributions to clinical reference values, we screened whether at least 95% of the participants were above levels associated with deficiency. The analytes for which there appeared to be a deficiency for at least 5% of participants included: vitamin D (25 hydroxy vitamin D3) and total folate (sum of 5-methyl THF, THF, 5,10-methenyl THF, folic acid, 5-formyl THF). For vitamin D and its marker of 25 hydroxy vitamin D3, the median of the results was below the clinical reference value of severe deficiency (10 ng/ml). We found 94% of the samples from participants showed clinical vitamin D deficiency (<20 ng/L of 25 hydroxy vitamin D3), and 60% had a severe clinical vitamin D deficiency (<10 ng/L of 25 hydroxy vitamin D3). Deficiency in total folate was found in 9% of the samples from participants. All the participants with folate deficiency also had vitamin D deficiency, and 59% of those had a severe vitamin D deficiency. Retinol, a marker of vitamin A, exceeded the clinical range in 59% of the samples. Other vitamins and macro-elements appeared generally adequate. By example, vitamin B12 was adequate for over 95% of participants, based on a deficiency threshold of < 133 pmol/L.
The association between nutrition biomarkers and demographics, lifestyle and dietary factors were assessed (Table 3 and Table 4). Higher 25 hydroxy vitamin D3, the active form of vitamin D3, was observed in the oldest group (over 50 years) and in the groups who did not smoke, or drink alcohol in the previous 24 h. The folate levels were higher in the non-smoking group than in the smoking group.
Table 3.
Exploratory factors associated with average biomarker levels of 25-hydroxyvitamin D3 and folate.
| Factorsa | n | Mean (min-max) | Group | n | 25-hydroxyvitamin D3 (ng/ml) |
Folateb (nmol/L) |
||||||
|---|---|---|---|---|---|---|---|---|---|---|---|---|
| Mean | Median | 25th percentile | 75th percentile | Mean | Median | 25th percentile | 75th percentile | |||||
| Age | 125 | 44 (8–88) |
<19 | 14 | 9.4 | 7.8 | 5.6 | 11.9 | 16.4 | 12.8 | 10.6 | 20.5 |
| 19–30 | 21 | 8.7 | 9.2 | 5.2 | 10.8 | 18.4 | 17.6 | 10.4 | 25.9 | |||
| 31–51 | 42 | 8.9 | 7.6 | 6.0 | 11.5 | 18.7 | 17.7 | 12.0 | 22.9 | |||
| >51 | 48 | 11.1 | 9.8 | 6.8 | 15.5 | 15.7 | 13.5 | 11.0 | 18.1 | |||
| Sex | 128 | F | 64 | 8.7 | 7.5 | 5.4 | 11.3 | 18.1 | 16.5 | 10.7 | 23.2 | |
| M | 64 | 11.1 | 9.6 | 6.9 | 13.5 | 16.6 | 14.0 | 11.5 | 21.5 | |||
| BMI | 108 | 25.8 (16.9–46.4) |
≤25 | 55 | 9.0 | 7.5 | 5.2 | 11.4 | 16.4 | 14.7 | 10.7 | 22.0 |
| >25 | 53 | 10.4 | 9.4 | 6.9 | 12.9 | 18.0 | 14.2 | 11.1 | 23.2 | |||
| Smoking in the previous 24 h | 128 | Yes | 64 | 8.4 | 7.3 | 5.4 | 10.7 | 16.5 | 13.1 | 10.7 | 22.7 | |
| No | 64 | 11.3 | 10.3 | 7.2 | 14.3 | 18.2 | 17.1 | 11.9 | 22.1 | |||
| Alcohol in the previous 24 h | 128 | Yes | 18 | 8.8 | 7.6 | 5.4 | 12.0 | 18.8 | 16.3 | 12.8 | 23.0 | |
| No | 110 | 10.1 | 9.2 | 6.2 | 12.7 | 17.1 | 14.3 | 10.9 | 22.4 | |||
aFrom the general demographics survey, used in the biomonitoring project [11].
bSum of 5-Methyl THF, THF, 5,10-Methenyl THF, Folic Acid, 5-Formyl THF
Table 4.
Exploratory investigation of the dietary factors associated with nutrition marker levels.
| Dietary Factors | n | Mean (min-max) | % | Significant markers at p < 0.05 a,b |
|---|---|---|---|---|
| Consumption of wild fish in the last yearc | 52 | Yes = 96.2 | Albumin (p = 0.030) | |
| No = 3.8 | ||||
| Average Frequency per week | 50 | 1.0 (0.1–4.0) | FMN (p = 0.004), PL (p = 0.012) | |
| Average Serving per week | 50 | 1.6 (0.5–3.0) | FA (p = 0.012), B1 (p = 0.011) | |
| Consumption of wild land animals in the last yearc | 52 | Yes = 98.1 | Albumin (p = 0.020) | |
| No = 1.9 | ||||
| Average Frequency per week | 32 | 10.4 (0.5–29) | Retinol (p = 0.003), PA (p = 0.006), 25 HydroxyD3 (p = 0.049) | |
| Average Serving per week | 51 | 1.8 (0.5–3.0) | B1 (p = 0.032) | |
| Consumption of wild birds in the last yearc | 52 | Yes = 75.0 | Albumin (p = 0.018) | |
| No = 25.0 | ||||
| Average Frequency per week | 38 | 3.4 (0.5–10.5) | Alpha-tocopherol (p = 0.009) | |
| Average Serving per week | 39 | 1.7 (0.5–3.0) | ||
| Consumption of wild plants and berries in the last yearc | 52 | Yes = 50.0 | Retinol (p = 0.031), Albumin (p = 0.038) | |
| No = 50.0 | ||||
| Consumption of any country food in the previous 24 hd | 37 | Yes = 40.5 | Retinol (p = 0.010), PA (p = 0.031) | |
| No = 59.5 | ||||
| Calories from country food in the previous 24 h (%)d | 37 | 5.9 (0.0–29.7) | Retinol (p = 0.017), PLP (p = 0.049), PA (p = 0.033) | |
| Overall dietd | ||||
| Calories in the previous 24 h | 37 | 2167 (376–4891) | PLP (p = 0.002), albumin (p = 0.010) | |
| Servings of milk and dairy in the previous 24 h | 37 | 1.1 (0.0–3.6) | B12 (p = 0.032), | |
| Servings of meat and alternatives in the previous 24 h | 37 | 3.9 (0.6–8.2) | PLP (p = 0.010) | |
| Servings of vegetables and fruit in the previous 24 h | 37 | 2.9 (0.0–15.8) | FA (p = 0.031) | |
| Servings of grains products in the previous 24 h | 37 | 5.9 (5.0–22.5) | PLP (0 = 0.022), albumin (p = 0.021) |
aStatistical test for categorical variables tested by Kruskal-Wallis test
bStatistical test for continuous variables tested by Spearman correlation test
cFrom the food frequency questionnaire, used in the biomonitoring project [11].
dFrom the 24 h dietary recall survey, used in the biomonitoring project [11].
An exploratory statistical analysis indicated that age was associated with retinol (p < 0.001), alpha-tocopherol (p < 0.001), PL (p = 0.008), PA (p < 0.001), 25-hydroxy vitamin D3 (p < 0.001), and albumin (p = 0.005). Sex was associated with phosphorus (p = 0.003), and BMI was associated with retinol (p < 0.001), alpha-tocopherol (0 = 0.006), vitamin B2 (p = 0.008), 25-hydroxy vitamin D3 (p = 0.027). Smoking in the last 24 h was associated with PLP (p = 0.001), PL (p = 0.005), 25 hydroxy D3 (p = 0.001), and drinking alcohol in the last 24 h was associated with vitamin B12 (p = 0.027), FNM (p = 0.021), PLP (p = 0.048), and phosphorus (p = 0.028). In addition, albumin was the nutrition biomarker most often associated (p < 0.05) with dietary factors (e.g. consumption of wild fish, land animals, birds, berries in the prior year, grain products and number of calories in the last 24 h), followed by pyridoxal 5’-phosphate (PLP) and retinol.
Survey to improve food security in Tulít’a
Demographics
Of the 25 people who responded to the survey, 60% (n = 15) were women, 40% (n = 10) were men, and the median age was 60 with a range from 25 to 87 years. Seventy-two percent (72%, n = 18) of survey respondents lived in houses with children under the age of 18. In addition, a third of the participants (32%, n = 8) lived alone, and the remaining lived in a household with 2 to 5 persons. Fifty two percent (52%, n = 13) of respondents had completed elementary school or some of high school and 36% (n = 9) of people had no formal education or completed some elementary school. The remaining participants had a completed high school, college diploma, or a vocational training certificate. The most common source of income was from pension or senior benefits.
Country foods for food security
The most common harvesting activities practiced by participants included hunting or setting snares (40%, n = 10), followed by fishing (36%, n = 9) (Figure 1). Over half of the participants did not harvest country food within the previous year (60%, n = 25) or had any member of their household practicing harvesting activities (44%, n = 11). The majority of participants had country foods shared with them in the past year a few times a month (56%, n = 14) or once a year (40%, n = 10), with few (4%, n = 1) who did not have country foods shared with them in the last year. Large game (e.g. caribou) was the main type of shared food (96%, n = 24), followed by fish (80%, n = 20), and game birds (76%, n = 19). Small game (52%, n = 13) and plant foods or berries (20%, n = 5) had also been shared with participants. Country foods were used to either increase the quality or quantity of the foods by 92% (n = 23) of participants. While 88% (n = 22) of participants considered their diet to be generally healthy, 12% (n = 3) considered it to be only somewhat healthy. Results indicate that participants believed that country foods are healthier than market food (72%, n = 18). Other beliefs included that country food is more natural (28%, n = 7), tastes better (28%, n = 7), costs less than market food (28%, n = 7), is nutritious (12%, n = 7) and has less fat than market foods (4%, n = 1). Country foods were identified as related to food sovereignty (20%, n = 5) and tied to cultural values and beliefs (16%, n = 4).
Figure 1.
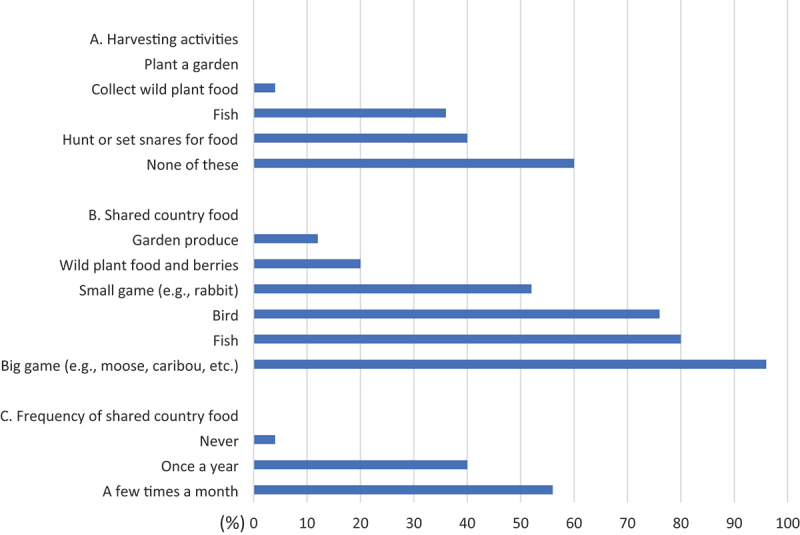
Country food harvesting and sharing in Tulít’a in 2020 from responses based on the previous 12 months (n = 25).
Fewer participants reported eating as much country foods as desired (16%, n = 4) than those who reported not having access to it (20%, n = 5). No participants reported not liking country food or not knowing how to prepare or cook it. Over 60% (n = 15) of respondents indicated that the cost of harvesting was a reason why no one in their household was on the land, which affected the quantity they could procure and eat (Table 5). Costs of harvesting can include the required equipment (e.g. fishing rods, rifles), the supplies (e.g. ammunition, bait), season-specific clothing to be safe while on the land (e.g. parka, winter boots), as well as those related to transportation (e.g. boat, snowmobile, fuel) and its maintenance. Among the barriers to consuming country food, cost of supplies (e.g. fuel, bullets) was most commonly reported (44%, n = 11), followed by the lack of a harvester in the household (20%, n = 5), broken equipment (8%, n = 2), and a lack of time for harvesting due to employment (4%, n = 1). Other reasons for limiting consumption that were identified by participants through open-ended questions included disability and personal choice. None of the participants reported any disruption in harvesting activities caused by industrial activities. The cost of going on the land was the biggest perceived barrier to accessing country foods, selected by 64% of people (n = 16). Other barriers included climate change, tourism disrupting ecosystems and habitats, and a decrease in the availability of animals. A third of respondents indicated additional access barriers not mentioned in the survey, such as old age.
Table 5.
Benefits and barriers of country food consumption reported by respondents (n = 25).
| Barriers | Response (%) |
Benefits | Response (%) |
|
|---|---|---|---|---|
| 1 | Overall cost of fishing/hunting/going on the Land | 60–64% | Healthier | 72% |
| 2 | Cost of supplies and gas | 44% | Less costly | 28% |
| 3 | No active harvester in the household or old age | 24–36% | Better taste | 28% |
| 4 | Human disturbances of ecosystems | 8% | More natural/from the land | 28% |
| 5 | Climate changes impacts on the Land | 8% | Our food/food sovereignty | 20% |
| 6 | Broken equipment | 8% | Cultural values/beliefs | 16% |
| 7 | Harvester too busy at job | 4% | More nutritious | 12% |
| 8 | Less animals available | 4% | Less fat on meat | 4% |
Climate change and country foods
Participants were asked about country foods and climate change. Twenty-nine percent (28%, n = 7) of participants indicated that there was decreased accessibility of fish relative to past years (March 2019-March 2020). No participants reported taste changes, reduced size, contamination, or physical changes in fish caught and consumed in the last year. However, some participants perceived an increase of abundance of moose, wolves, and bears. Notably, although wolves are not consumed, they can indirectly affect population sizes of other animals and the availability of country foods via predation [38]. Half of the respondents reported that some country foods are now less abundant, including caribou, rabbits, ptarmigans, chickens and grayling fish.
Participants were asked an open-ended question about any significant climate change impacts observed in the region in the last five years. Ninety-two percent (92%, n = 23) of participants reported at least one change. The most common responses were perceived unpredictable or bad weather, warmer weather, thinner ice, and changes in season length. Some respondents also mentioned one of the followings: colder weather, dangerous landscape, softer soil/permafrost thawing, longer time for the ice to freeze, and country foods harder to get.
Food security
All participants’ selections (n = 24) obtained a score of at least 2 points, meaning that all of the participants were classified as food insecure (Table 6), with over half (58%) being classified as severely food insecure. Participants were asked questions related to food security (Figure 2). In the last year, almost half (46%, n = 11) of the participants indicated that the food they bought sometimes just didn’t last and they didn’t have money to get more. A quarter (n = 6) of participants said this was often the case. In addition, 54% (n = 13) of participants reported sometimes not being able to afford to eat balanced meals (i.e. variety of foods and the right amounts to maintain a healthy diet), while 13% (n = 3) of people said this was often the case. Twenty-nine percent (29%, n = 7) of people sometimes cut the size of meals or skip meals, with a majority of participants (79%, n = 19) reporting they had to do this almost every month. Ninety-two percent (92%, n = 22) of participants reported not being left hungry even when there was not enough money for food and 79% (n = 19) of participants reported despite there being not enough money to buy food, they did not eat less than they should. However, 21% (n = 5) of people did have to eat less because there wasn’t enough money to buy more food in the last year.
Table 6.
Food security score and index for Tulít’a participants.
| Classification | Score | % (n = 24) |
|---|---|---|
| FOOD SECURE | 0 | 0 |
| FOOD INSECURE – MODERATE (Low food security)a | 1–4 | 42 |
| FOOD INSECURE – SEVERE (Very low food security) | 5–7 | 58 |
ano participant had a score of 0 or 1.
Figure 2.
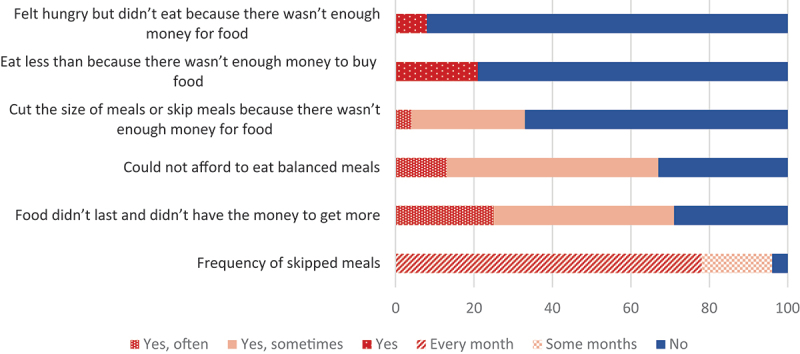
Food security assessment in Tulít’a in 2020 from responses based on the previous 12 months (n = 24).
In comparison, the national RHS Phase 3 [29] reported that 51% of participating First Nations adults were severely or moderately food insecure, and the NWT RHS [39] reported that 29% of participating First Nations adults were severely or moderately food insecure.
Discussion
Current situation of nutrition and food security in the Sahtú
Results from this project highlight the critical and pervasive problem of food insecurity in the Sahtú; all survey participants in one of the communities met criteria of either moderate or severe food insecurity. Further, nutrition biomarker levels from three communities suggest widespread deficiency of Vitamin D and/or folate. Those findings are in line with the estimated adequacy requirements of vitamin D and folate measured through 24-h recall surveys and resulting in deficiencies for at least half of the participants in Sahtú communities of the NWT [4,40].
Similar to our study, other authors reported that lower 25 hydroxy vitamin D3 and deficiency was associated with elevated BMI or obesity [41,42], and smoking [43], while higher country food consumption was associated with higher 25 hydroxy vitamin D3 [15].
The 25 hydroxy vitamin D status of Canadians measured in the 2007–2009 Canadian Health Measures Survey (CHMS) indicated that 10% of Canadians had inadequate levels (less than 37.5 nmol/L, GM: 67.7 nmol/L) [44]. The CHMS is a national survey collecting information from thousands of Canadians about their general health and is representative of the Canadian population living in the 10 provinces. More recently, the 2019 CHMS data indicate a central tendency at 66 nmol/L for adults [45], and we can expect a severe deficiency of 25 hydroxy vitamin D for 5% and inadequate levels for less than half of the CHMS participants.
A study conducted in First Nations Eeyou Istchee, Quebec, Canada, in 2005–2009 (n = 161) also indicated a high prevalence of vitamin D deficiency (32% below 25-hydroxyvitamin-D levels <50 nmol/L) [46]. A study was conducted from 2005 to 2009 to quantify serum 25-hydroxyvitamin D concentrations from 944 Cree [47]. Mean serum 25(OH)D concentrations by gender were 52.9 nmol/L in men and 47.5 nmol/L in women, which is twice the concentration we observed in this current study. Vitamin D was also assessed in a First Nations community (n = 445) in Ontario, Canada [48]. Men had a mean serum 25(OH)D concentrations of 22.1 nmol/L and women of 20.5 nmol/L, which is similar to what we observed in our project (mean of 25.0 and 24.3 nmol/L, respectively).
The measure the PAr index is the ratio of PA (the oxidative product) divided by the sum of PLP plus PL. This index reflects the average vitamin B6 catabolism through inflammation [49]. The PAr index is the greater predictor of cardiovascular mortality than smoking, diabetes, hypertension [50]. In the current study, the PAr index was 0.33, which is a low to moderate index. In comparison, the average PAr index of patients hospitalised for acute myocardial infarction was 0.54 [50].
We also compared the levels from this study with population levels in the USA. The USA has a similar North American diet to Canada and has an Indigenous population of about 2–3% (compared to 5% in Canada). From the National Health and Nutrition Examination Survey 2011–2012 (n = 7500), folate markers concentrations (geometric mean -GM) measured were above the current study for 5-methyl THF (37.5 vs 12.8 nmol/L) and FA (1.21 vs 0.81 nmol/L) [51].
It is worth noting that determinants, other than dietary factors, impact vitamin D and folate status. Genetic influences of ethnicity were identified to play a role on folate metabolism [52], and as such, we cannot exclude that Dene people may have different folate metabolism than the population as a whole. Non-smokers and people drinking less alcohol were more likely to have a normal level of folate [53,54]. Male, frequent physical activity and lower BMI were determinants of higher serum 25(OH)D [48,55,56].
Other vitamins and macro-elements appeared generally adequate (e.g. B12). Interestingly, 59% of the samples had retinol (vitamin A biomarker) concentrations exceeding the normal range clinical threshold and 15% samples had albumin concentration exceeding the normal range clinical threshold [57].
Implications for the health of the Sahtú residents
Vitamin D acts as a hormone. Low concentrations of vitamin D (serum 25-hydroxy vitamin D) have been associated with glucose intolerance and markers of insulin resistance in Indigenous populations, which might indicate a possible link between higher rates of vitamin D deficiencies and type 2 diabetes [58,59]. In addition, there is evidence of an association between vitamin D status and risk of colorectal cancer [60]. A recent study [61] documented cases of rickets and early vitamin D deficiencies in children in Manitoba (Canada). Most cases were from northern or rural residents and half were from Indigenous heritage.
Investigation of data from the Canadian Health Measures Survey indicated that in Canadians, elevated vitamin D concentrations were associated with better mental health [62]. Other epidemiological studies have previously shown an inverse association between low serum vitamin D levels and depression, mental disorders, neurodevelopment and psychosis [63–68]. Vitamin D supplementation has been shown to improve depression and anxiety [69–73]. Skogli et al [74] mentioned that low levels of vitamin D were associated with higher risk of serious psychological distress and underlined the potential impact of country foods on mental health and wellbeing. This is an important implication for Indigenous communities. For example, suicide rates among Indigenous Peoples within Canada are significantly higher than among the non-Indigenous population [75]. While improving Vitamin D and nutrient status would not be the solution to such mental health issues, it may complement other public health initiatives related to mental health in the region.
Knowing that vitamin D deficiency is linked to several physical and mental health issues, it is essential to build a strategy to improve its dietary intake. In remote regions within Canada where food security might be a challenge, traditional diets with country foods have been identified as an important determinant contributing to nutrient levels [2,48,76,77]. As such, the promotion of country foods may offer the most culturally-appropriate and preferred strategies for ameliorating Vitamin D deficiencies observed in the Sahtú.
Dietary intake of nutrients from country food consumption
The First Nations Food, Nutrition, and Environment Study (FNFNES) found that on days country foods were eaten, the intake of almost all nutrients was significantly higher [78]. In NWT communities, country food consumption was associated with higher protein and vitamin intakes [4,79]. Country food consumption is associated with higher nutrient and vitamin intake, as well as lower fat and lower sugar consumption [4,79–82].
A study was undertaken about 10 years ago to determine the level of dietary vitamin D in a Dene community (n = 46) by using a food frequency questionnaire [83]. Supplements, milk, and local fish were positively associated with adequate vitamin D intake. Specifically, milk and local fish were the major dietary sources of vitamin D. It is known that fish is important for food security and nutrition among First Nations within Canada [84] and can provide a rich source of vitamin D.
Our previous work provided more detailed dietary portraits of the Sahtú region (i.e. frequency of consumption), based on a 24-h recall and on a food frequency questionnaire [4,40,85,86], indicating that 5% of the total energy consumed was from country foods, and that fish was frequently consumed.
In addition, some other country foods contain elevated levels of vitamin D [17,87]. Eating fatty fish (e.g. lake whitefish and lake trout, both widely consumed in the Sahú), mushrooms, eggs, and walking on the Land under the sun could be a useful combination of methods to improve vitamin D levels for the study population.
Folate is absorbed daily from dietary sources, such as green leafy vegetables (e.g. spinach, asparagus, brussel sprouts, broccoli). While green vegetables/plants are not a common country food, it's worth noting that liver is also a good source of folate [88]. For example, an average of 374 μg of folate was measured in Canadian Arctic caribou liver [81] and this food is commonly consumed in the region [85].
Promoting country foods for improved food security in the North
Sharing country foods in Tulit’a is a common practice with 96% of the respondents having received foods. Despite not collecting information about the source of shared foods in our survey, it is known that country food is usually shared by someone in their immediate network (e.g. friends and relatives, neighbours, community harvesters). While food security is a challenge in Tulít’a, the findings indicate that country food could play an important role when people cannot afford food from the store. In fact, the majority of participants reported financial constraints related to buying food, yet the majority reported not being left hungry and reported not eating less than they felt they should when there was not enough money for food. Positively, this research also found that consuming country foods to increase overall diet quality and quantity was a common strategy which helped people deal with the cost of healthy market foods. Those findings were also reported in another study where the consumption of country foods was significantly higher among participants classified as food insecure [84].
The current findings also bring insights on the reasons why people eat country foods, with top reasons being that the country food was perceived as healthier, more natural, better tasting, and less costly. Accordingly, the design of a strategy to promote country food consumption should integrate those findings. From the survey findings, we see that the cost of fishing and hunting prevented harvesting in several households and the cost of harvesting supplies limited access to country food. While some participants indicated that country foods can be cheaper than market food, country foods are not necessarily more economically viable than market foods when all the related expenses, time, effort, and expertise are considered [89,90]. In the FNFNES study, the barriers mentioned most frequently were the lack of a hunter, resources (including equipment and transportation) and time [78]. The biggest barrier mentioned in our survey was cost and equipment. Thus, lack of financial resources was seen to be an important barrier to accessing country food. Not only is income known to be a main social determinant of health, but this finding also highlights the importance of economical contributions for northern Indigenous Peoples to move towards food sovereignty.
Wesche et al. [91] highlight that adequate knowledge and foodways transmission within families and communities, paired with land sovereignty, is central to food security for Indigenous populations [91]. Food sharing networks are a cultural practice but can also be a strategy to increase community level and household food security [92]. In addition, a culturally relevant education program on food security can benefit northern communities [93], as well as discussion on transfer of knowledge on the preparation of country foods.
Initiatives, such as the Nutrition North Canada (NNC) Harvesters Support Grant, which provides funding to northern organisations to increase country food harvesting, can support several types of harvesting-related activities as such as transportation, purchase and maintenance of equipment, traditional knowledge and practices, food processing equipment and food sharing initiatives [94]. The NNC program is a federal initiative to subsidise food for eligible remote and isolated communities within northern Canada. While in continuous evolution, it received critiques as it does not support cultural food preferences and dietary habits, and it does not provide support for hunting and harvesting, leading to neglecting the role of country foods among Indigenous communities [95]. A similar program in Alaska, the Supplemental Nutrition Assistance Program (SNAP), provides food benefits to low-income households but face similar challenges in not providing support for hunting and harvesting [96].
The promotion of country food consumption would provide several health benefits and activities on the land might increase physical activity and connections to the land. Islam and Berkes [97] reported that ongoing community-based fishery and sharing practices in three Cree First Nations communities have contributed to having more than 90% food secure households.
Wilson et al. [98] noted that a community-based and community-led approach to improve diversified food systems, including country food access, production and distribution, is the best strategy to strengthen northern food systems, but the contribution and infrastructure of multiple sectors are important.
When there is a need to improve food security, country food promotion becomes a tool to increase food security. Not only can country food promotion mitigate food insecurity issues in the North, but also Indigenous food systems have the potential to combat increasing diet-linked chronic diseases in those populations [99].
Adapting to foster food security in a changing climate
Climate change directly impacts store-bought food prices in communities without all-season road access and the cost of food is linked to the transportation method into the community (i.e. winter road, air, or barge). It is worth noting that economic and social factors, as well as programs and policies, are matters affect harvesting more than climate change on a day-to-day basis [100]. Nevertheless, climate change is a threat to food systems in this region.
The majority of participants indicated that they have noticed significant signs of climate change in the last five years that are related to their ability to harvest country foods (availability and access). Specifically, they noted changes to the weather and seasons that were uncharacteristic and inhibited traditional hunting practice in the region. The participants reported decreased availability of country foods, including caribou, which is an sacred animal of spiritual and cultural importance and life in the Sahtú. Changes in species and migration patterns, often due to climate change impacts, have the potential to affect the access and consumption of country foods [101]. In fact, in the Sahtú, differences of bird species consumption were observed over the last 20 years [12]. Adaptation to new food species may mitigate against declining nutrient intakes from country foods [102].
A study documenting Sahtú Dene and Métis use of over 80 types of birds, fish, and mammals indicates that their food system is responsive to changes (i.e. ecological, regulatory, and economic), with one key element likely being the harvester adaptability [103]. It is key to acknowledge that the entire process of country food procurement is essential for cultural continuity and is tied to food sovereignty for Indigenous Peoples [91,104,105]. There is a need to support sub-arctic and Arctic communities to create and implement adaptation strategies [106].
Land-based programming is a proposed component of promoting knowledge on the procurement of country foods from Elders to youth, to work towards food security and sovereignty. This approach is rooted in sustainability and long-term holistic well-being for communities despite changing environmental conditions and could be adopted in Tulít’a and other communities in the region [91]. Indigenous knowledges are a central asset in successful adaptation to climate change, in the ability to live on the land, to read environmental cues, and to follow community approaches to local initiatives such as sharing programs [107]. Despite unpredictable climate change impacts on the country food supply, there is a need to support the communities in adapting to their new realities, by supporting land-based initiatives.
Limitations of the findings
One of the challenges we faced was an analytic gap to quantify some analytes (Mg, Ca, K, Fe) and interpret our data from plasma samples. The quantification of such elements in plasma required levels much higher than in whole blood or in serum, and the literature offered limited comparative data for plasma. However, the nutrition biomarkers analysis might have been more representative from the community than the survey, as the participation rate was about 12.3% (n = 64) of the Tulít’a population. It is worth noting that only one spot sample was collected in the biomonitoring project and cannot estimate properly the deficiencies over time. In addition, the paired data used for the statistical exploratory analysis can provide insights to justify further investigations, although the small sample size doesn’t allow conclusions from the testing of a biostatistical hypothesis. We also didn’t report the use of dietary supplements. Our previous studies indicated that 11% of the participants from the biomonitoring project reported consuming vitamins, fibre, or other supplements but we didn’t collect information on the brand, type, or concentration of those supplements [86].
In addition, we faced several challenges in comparing our nutrition biomarker levels to the Canadian Health Measures Survey (CHMS). The two main ones being that: 1) the CHMS recruited fasted participants and that fasting was not part of the inclusion criteria for the current project, which might underreport the deficiency rates in the current study; 2) the vitamins and macro-elements were measured in serum by the CHMS while they were measured in plasma in the current study, and; 3) there were inconsistencies between the available statistics (e.g. percentiles, central estimate) reported and published from the CHMS.
There are limits in conducting a study with a modest sample of 25 participants, as well as using a recruitment process which was not randomised, as the results might not be representative of the overall community population. While the sample size is too small (5–6% of the adult population) to be drawing firm conclusions on the key findings and precludes statistical analysis of the role of gender, the results provide a platform for community discussion on food security challenges and potential opportunities.
Food insecurity is still unfortunately associated with stigmatisation [108,109]. As such, a bias of selection and information biases might have occurred during the recruitment and implementation of the food security survey. While stigma may cause participants to underreport food insecurity [108,110], people experiencing food insecurity may have been more likely to agree to be part of the study, which potentially applies to all studies assessing food insecurity. We did not aim to characterise rates of food insecurity per say, but rather to assess links between food security, country foods, and climate change in one community. Nevertheless, the results of this community-led food security exploration are intended to better document food security strategies and the role of country foods within the small sample of participants from Tulít’a.
In addition to the small sample size, the average age of participants was older, and no one under 25 years old participated in the survey. Our previous work indicated that country food consumption is less frequent for minors under 19 years old compared to older adults [40]. The responses from youth might be very different from the current findings from older adults. Youth-specific survey results would be beneficial to document shared country food, and perceived benefits of eating country foods, which would indicate key facilitators in promoting country food consumption within the young generation.
Furthermore, as adapted from the Household Food Security Survey Module, the survey questions measure the financial ability of households to purchase store bought foods in the market system [78]. This concept of food security is common in the literature but does not necessarily support a complete understanding of food security for Indigenous populations that have a mixed diet of country and market foods [111]. For instance, standardised questions on food security focused mainly on financial access to market food, which is not culturally relevant for the region where country food is a crucial part of many people’s diet. One participant decided not to complete this section of the survey. As all the survey participants were classified as food insecure, but 9 respondents of 10 reported they were not left hungry on one of the questions, it is obvious that this survey approach does not encompass all of the factors to assess food security. There is a need to develop a culturally relevant food security survey for Indigenous populations within Canada, that can be adapted to community realities. The key lesson is to better design a survey to obtain a more representative and contextual situation of food insecurity for Indigenous Peoples and northern remote populations, and to bring light to indigenised ways of getting food with adequate quality and quantity to live a healthy life.
Due to the COVID-19-pandemic, travel plans by the research team and community partners were cancelled and some components not able to be rescheduled. The initial plan was to invite to the University a delegate group from the Sahtú, and to organise a 4-day science hub meeting to: 1) discuss the findings in-person with the communities; 2) identify the best strategies to cope with food insecurity for this population; 3) connect researchers, government officials and key community persons to improve collaboration, and; 4) to share how research is done in university laboratories and how the survey results were analysed. Instead, due to travel restrictions made necessary by COVID-19, a workshop was organised in Tulít’a by the SRRB for the community members (n = 20), with the aim to share knowledge from this project as well as sharing country food preparation tips and skills within the community and engage in promoting country food consumption.
Conclusion
This research aimed to generate evidence and inform resilience initiatives in the region in the face of climate change, and to a lesser extent, to cope with the current levels of inflation. Altogether, this work informs the development of strategies that promote the consumption of country foods in Sahtú Dene and Métis communities of the NWT. The cultural and local perspectives to tailor dietary messaging and promote diet is essential and should be part of any food policy development [112].
In conclusion, the results of this community-led food security assessment are intended to explore the role of country foods in preventing food insecurity, and the nutrition biomarker analysis indicates substantial nutrition deficiencies. Those deficiencies may be prevented by the consumption of country foods [79–82] and signal a need to implement programs to promote county food access and consumption for this northern remote population, and other northern communities.
Since the completion of this study, the Climate Change and Health Adaptation Program in collaboration with the Climate Change Preparedness in the North Program have been funding a multi-year on-the-land harvest program (Dene Béré Harvesting and Sharing Campaign) in the Sahtú region to improve country food access for those communities. Lessons are being learned about how facilitating country food access at the community level can result in improved food security.
Supplementary Material
Acknowledgments
The team wishes to acknowledge the work of Dr. Deborah Simmons who passed away in October 2022. Deborah was a deeply committed, exceptional and empathetic collaborator and human who dedicated her life and work to the Sahtú region and especially to the Ɂehdzo Got’ı̨nę Gots’ę́ Nákedı (Sahtú Renewable Resources Board), aiming to better manage natural resources, protect the Land, support the revitalization of Dene culture and practices, and indigenize academic research.
The research team is grateful for assistance received from the following organizations: Grand River Hospital, the Government of the Northwest Territories Department of Health and Social Services (DHSS), the Ɂehdzo Got’ı̨nę Gots’ę́ Nákedı (Sahtú Renewable Resources Board [SRRB]) and the Northwest Territories Regional Contaminants Committee (NT RCC). This work is from an ongoing collaboration between researchers at the University of Waterloo, University of British Columbia, Wilfrid Laurier University, Trent University, Washington State University and the Sahtú Renewable Resources Board. We would like to thank all community leaders, participants and local coordinators for making this work possible.
Funding Statement
Funding for this work was provided by the Northern Contaminants Program (NCP), which covered the initial biomonitoring project and sample collection (HH-08). Funding for this work was also provided by the Canadian Institutes of Health Research (CIHR) - Development and Engagement Grant: Food Security and Climate Change in the Canadian North competition [#2018-10-25] for the food security survey component and the nutrition biomarker analysis.
Disclosure statement
No potential conflict of interest was reported by the author(s).
Author contributions statements
All authors contributed to the study. MR, DS and KS conceptualised and designed the project. KJ and JY were responsible for the community-based components and data collection. MR and BL were in charge of the sample collection. Nutritional biomarker quantification analyses were performed and coordinated by YL and LM. The first draft of the manuscript was written by MR and all authors commented on versions of the manuscript. All authors contributed to manuscript revisions, read, and approved the submitted version.
Compliance with ethical standards and research involving human participants
The study was approved by the appropriate institutional and national research ethics committees. The authors certify that the study was performed in accordance with the ethical standards as laid down in the 1964 Declaration of Helsinki and its later amendments or comparable ethical standards.
Ethics approval was received from the University of Waterloo (ORE #41522, #30543). Research licences were obtained from the Aurora Research Institute (#15966, 16021, 16185, 16697). Data management follows University of Waterloo guidelines, and respected the OCAP® (Ownership, Control, Access and Possession) principles. This research involves human subjects, who provided freely-given and informed consent to participate in the study. Written informed consent was obtained from the adults; minors and their guardians had to provide written consent.
Contribution to the field statement- significance
Country foods have high nutritional value and are associated with improved nutrition for northern populations. However, climate change has placed a disproportionate burden on northern Indigenous communities, with the potential to jeopardise food security in the North in the future. To facilitate future assessments of food security issues over time, we aimed to describe current food security status in the Sahtú population. In addition, there is a knowledge gap with regard to whether and how country food increases the diet quality and/or amount of available foods for northern populations. Furthermore, only a few studies have documented vitamin deficiency rates in these populations. Those assessments were based on dietary intake estimates from self-reported dietary surveys, which are less reliable and more subjective data than nutritional assessment using biomarkers. In response to community concerns, this project investigated food security in the Sahtú region of the Northwest Territories, Canada. Our project is the first to: 1) document food security in the region using a culturally and locally-refined survey, and; 2) determine nutritional status for a wide range of nutrients. Recommendations for policy development are made based on the findings.
Data availability statement
The datasets presented in this article are not readily available because they are the property of the First Nations communities who participated in the study, and with respect for the OCAP® principles, including Ownership, Control, Access and Possession. OCAP® is a registered trademark of the First Nations Information Governance Centre (FNIGC, 2022). Individual-level data related to the blood sample analysis is prohibited under our Community Research Agreements and protocols outlined in the Review Ethics Board approvals. Requests to access the datasets should be directed to the Sahtú Renewable Resources Board (www.srrb.nt.ca).
Supplementary material
Supplemental data for this article can be accessed online at https://doi.org/10.1080/22423982.2024.2438434
References
- [1].Berti PR, Receveur O, Chan HM, et al. Dietary exposure to chemical contaminants from traditional food among adult Dene/Métis in the Western Northwest Territories, Canada. Environ Res. 1998;76(2):131–18. doi: 10.1006/enrs.1997.3797 [DOI] [PubMed] [Google Scholar]
- [2].Kuhnlein HV, Receveur O.. Local cultural animal food contributes high levels of nutrients for arctic canadian indigenous adults and Children. J Nutr. 2007;137(4):1110–1114. doi: 10.1093/jn/137.4.1110 [DOI] [PubMed] [Google Scholar]
- [3].Nakano T, Fediuk K, Kassi N, et al. Food use of Dene/Métis and Yukon children. Int J Circumpol Health. 2005;64(2):137–146. doi: 10.3402/ijch.v64i2.17966 [DOI] [PubMed] [Google Scholar]
- [4].Ramirez-Prieto M, Ratelle M, Laird B, et al. Dietary intakes of traditional foods for Dene/Métis in the Dehcho and Sahtú regions of the Northwest Territories. Nutrients. 2022;14(2):378. doi: 10.3390/nu14020378 [DOI] [PMC free article] [PubMed] [Google Scholar]
- [5].Calder RSD, Bromage S, Sunderland EM. Risk tradeoffs associated with traditional food advisories for labrador inuit. Environ Res. 2019;168:496–506. doi: 10.1016/j.envres.2018.09.005 PMID: 30477821; PMCID: PMC6317887. [DOI] [PMC free article] [PubMed] [Google Scholar]
- [6].Dewailly E, Blanchet C, Gingras S, et al. Cardiovascular disease risk factors and n−3 fatty acid status in the adult population of James Bay Cree. Am J Clin Nutr. 2002;76(1):85–92. doi: 10.1093/ajcn/76.1.85 [DOI] [PubMed] [Google Scholar]
- [7].Receveur O, Boulay M, Kuhnlein HV. Decreasing traditional food use affects diet quality for adult Dene/Métis in 16 communities of the Canadian Northwest Territories. J Nutr. 1997;127(11):2179–2186. doi: 10.1093/jn/127.11.2179 [DOI] [PubMed] [Google Scholar]
- [8].Khoury C, Weihe P. Key recommendations and research priorities of the 2021 AMAP human health assessment. Int J Circumpolar Health. 2024;83(1). doi: 10.1080/22423982.2024.2408057 [DOI] [PMC free article] [PubMed] [Google Scholar]
- [9].Kuhnlein HV, Receveur O, Soueida R, et al. Arctic indigenous peoples experience the nutrition transition with changing dietary patterns and obesity. J Nutr. 2004;124(6):1447–1453. doi: 10.1093/jn/134.6.1447 [DOI] [PubMed] [Google Scholar]
- [10].Little M, Hagar H, Zivot C, et al. Drivers and health implications of the dietary transition among Inuit in the Canadian Arctic: a scoping review. Public Health Nutr. 2021;24(9):2650–2668. doi: 10.1017/S1368980020002402 [DOI] [PMC free article] [PubMed] [Google Scholar]
- [11].Ratelle M, Skinner K, Laird MJ, et al. Implementation of human biomonitoring in the Dehcho Region of the Northwest Territories, Canada. Archives of Public Health. 2018;76:73. eCollection 2018. [DOI] [PMC free article] [PubMed] [Google Scholar]
- [12].Ratelle M, Haig L, Laird B, et al. Game bird consumption in Dene communities of the Northwest Territories, Canada. Public Health Nutr. 2021;24(6):1229–1239. doi: 10.1017/S1368980021000021 [DOI] [PMC free article] [PubMed] [Google Scholar]
- [13].Skinner K, Hanning RM, Tsuji LJ. Prevalence and severity of household food insecurity of first nations people living in an on-reserve, sub-Arctic community within the Mushkegowuk territory. Public Health Nutr. 2014;17(1):31–39. doi: 10.1017/S1368980013001705 [DOI] [PMC free article] [PubMed] [Google Scholar]
- [14].Wheeler T, Von Braun J. Climate change impacts on global food security. Science. 2013;341(6145):508–513. doi: 10.1126/science.1239402 [DOI] [PubMed] [Google Scholar]
- [15].Egeland GM, Johnson-Down L, Cao ZR, et al. Food insecurity and nutrition transition combine to affect nutrient intakes in Canadian Arctic communities. J Nutr. 2011;141(9):1746–1753. doi: 10.3945/jn.111.139006 [DOI] [PubMed] [Google Scholar]
- [16].Kirkpatrick SI, Tarasuk V. Food insecurity is associated with nutrient inadequacies among Canadian adults and adolescents. J Nutr. 2008;138(3):604–612. doi: 10.1093/jn/138.3.604 [DOI] [PubMed] [Google Scholar]
- [17].El Hayek Fares J, Weiler HA. Implications of the nutrition transition for vitamin D intake and status in aboriginal groups in the Canadian Arctic. Nutr Rev. 2016;74(9):571–583. doi: 10.1093/nutrit/nuw020 [DOI] [PubMed] [Google Scholar]
- [18].Brubaker M, Berner J, Chavan R, et al. Climate change and health effects in Northwest Alaska. Glob Health Action. 2011;4(1):8445. doi: 10.3402/gha.v4i0.8445 [DOI] [PMC free article] [PubMed] [Google Scholar]
- [19].Kompas T, Che TN, Grafton RQ. Global impacts of heat and water stress on food production and severe food insecurity. Sci Rep. 2024;14(1):14398. doi: 10.1038/s41598-024-65274-z PMID: 38909134; PMCID: PMC11193756. [DOI] [PMC free article] [PubMed] [Google Scholar]
- [20].Parry ML, Rosenzweig C, Iglesias A, et al. Effects of climate change on global food production under SRES emissions and socio-economic scenarios. Global Environ Change. 2004;14(1):53–67. doi: 10.1016/j.gloenvcha.2003.10.008 [DOI] [Google Scholar]
- [21].Kubelka V, Sandercock BK, Székely T, et al. Animal migration to northern latitudes: environmental changes and increasing threats. Trends Ecol & Evol. 2022;37(1):30–41. doi: 10.1016/j.tree.2021.08.010 [DOI] [PubMed] [Google Scholar]
- [22].Guiné RD, Pato ML and Costa CA, et al. 2021. Food security and sustainability: discussing the four Pillars to Encompass Other Dimensions. Foods. 10(11): 2732 10.3390/foods10112732 [DOI] [PMC free article] [PubMed] [Google Scholar]
- [23].Blanchet R, Willows N, Johnson S, et al. Traditional food, health, and diet quality in Syilx Okanagan adults in British Columbia, Canada. Nutrients. 2020;12(4):927. doi: 10.3390/nu12040927 PMID: 32230797; PMCID: PMC7230592. [DOI] [PMC free article] [PubMed] [Google Scholar]
- [24].Chowdhury R, Stevens S, Gorman D, et al. Association between fish consumption, long chain omega 3 fatty acids, and risk of cerebrovascular disease: systematic review and meta-analysis. BMJ. 2012;345(oct30 3):e6698. doi: 10.1136/bmj.e6698 [DOI] [PMC free article] [PubMed] [Google Scholar]
- [25].Sahtú Renewable Resources Board, Ɂehdzo Got’ı̨nȩ Gots’ȩ Nákedı (SRRB) . 2024. Page consulted on 16 Oct 2024, at https://www.srrb.nt.ca/
- [26].NWT Bureau of Statistics . Population estimates by community. 2024. Available from: https://www.statsnwt.ca/population/population-estimates/bycommunity.php
- [27].Government of the Northwest Territories . Industry, tourism and investment: the Sahtu. 2024. Consulted online on 16 Oct 2024, at https://www.iti.gov.nt.ca/en/sahtu
- [28].First Nations Food, Nutrition and Environment Study (FNFNES) . 2018. Questionnaires accessible online at http://www.fnfnes.ca/download
- [29].First Nations Information Governance Centre (FNIGC) . National report of the first nations regional health survey phase 3: volume two. First Nations Information and Governance Centre; 2018. Available from: https://fnigc.ca/wp-content/uploads/2020/09/fnigc_rhs_phase_3_volume_two_en_final_screen.pdf [Google Scholar]
- [30].Ratelle M, Laird M, Majowicz S, et al. Design of a human biomonitoring community-based project in the Northwest Territories Mackenzie Valley, Canada, to investigate the links between nutrition, contaminants and country foods. Int J Circumpolar Health. 2018;77(1):1510714. doi: 10.1080/22423982.2018.1510714 [DOI] [PMC free article] [PubMed] [Google Scholar]
- [31].Beyrouty P, Chan HM. Co-consumption of selenium and vitamin E altered the reproductive and developmental toxicity of methylmercury in rats. Neurotoxicol Teratol. 2006;28(1):49–58. doi: 10.1016/j.ntt.2005.11.002 [DOI] [PubMed] [Google Scholar]
- [32].Hennig B, Reiterer G, Majkova Z, et al. Modification of environmental toxicity by nutrients implications in atherosclerosis. Cardiovasc Toxicol. 2005;5(2):153–160. doi: 10.1385/CT:5:2:153 [DOI] [PubMed] [Google Scholar]
- [33].Houston DK. Does vitamin C intake protect against lead toxicity? Nutr Rev. 2009;58(3):73–75. doi: 10.1111/j.1753-4887.2000.tb01842.x [DOI] [PubMed] [Google Scholar]
- [34].Olsvik PA, Berntssen MHG, Søfteland L, et al. Modifying effects of vitamin E on chlorpyrifos toxicity in Atlantic Salmon. PLOS ONE. 2015;10(3):e0119250. doi: 10.1371/journal.pone.0119250 [DOI] [PMC free article] [PubMed] [Google Scholar]
- [35].Shakman RA. Nutritional influences on the toxicity of environmental pollutants. Archiv Environ Health: An Int J. 1974;28(2):105–113. doi: 10.1080/00039896.1974.10666447 [DOI] [PubMed] [Google Scholar]
- [36].US Department of Agriculture (USDA) . US Household food security survey module: six-item short form. 2012. Available from: https://www.ers.usda.gov/media/8282/short2012.pdf
- [37].First Nations Information Governance Centre (FNIGC) . OCAP® is a registered trademark of the first nations information governance centre (FNIGC). 2022. Available from: https://fnigc.ca/ocap-training/
- [38].McLoughlin PD, Dzus E, Wynes B, et al. Declines in populations of Woodland Caribou. J Wildl Manag. 2003;67(4):755–761. doi: 10.2307/3802682 [DOI] [Google Scholar]
- [39].Dene Nation, (Authors: Skinner K, Judge C, Tang F, Phillipps B, Catholique S, Kaur R . First nations regional health survey report phase 3, 2015–2016 Northwest Territories. Yellowknife (NT): Dene Nation; 2019. [Google Scholar]
- [40].Ratelle M, Hanning R, Laird B, et al. Results report on dietary intake and dietary transition in the Mackenzie Valley, Northwest Territories. Waterloo (ON): University of Waterloo; 2020. [Google Scholar]
- [41].Vranić L, Mikolašević I, Milić S. Vitamin D deficiency: consequence or cause of obesity? Medicina (Kaunas). 2019;55(9):541. doi: 10.3390/medicina55090541 [DOI] [PMC free article] [PubMed] [Google Scholar]
- [42].Wortsman J, Matsuoka LY, Chen TC, et al. Decreased bioavailability of vitamin D in obesity. Am J Clin Nutr. 2000;72(3):690–693. doi: 10.1093/ajcn/72.3.690 [DOI] [PubMed] [Google Scholar]
- [43].Lange NE, Sparrow D, Vokonas P, et al. Vitamin D deficiency, smoking, and lung function in the normative aging study. Am J Respir Crit Care Med. 2012;186(7):616–621. doi: 10.1164/rccm.201110-1868OC [DOI] [PMC free article] [PubMed] [Google Scholar]
- [44].Langlois K, Greene-Finestone L, Little J, et al. Vitamin D status of Canadians as measured in the 2007 to 2009 Canadian health measures survey. Health Rep. 2010;21(1):47–55. PMID: 20426226. [PubMed] [Google Scholar]
- [45].Statistics Canada . Table 13-10-0336-01 nutritional status of the household population. Page consulted on 09 Oct 2022 at https://www150.statcan.gc.ca/t1/tbl1/en/cv.action?pid=1310033601. doi: 10.25318/1310033601-eng [DOI]
- [46].Zuk AM, Liberda EN, Tsuji LJS. Examining chronic inflammatory markers on blood pressure measures in the presence of vitamin D insufficiency among indigenous cree adults: results from the cross-sectional multi-community environment-and-health study in Eeyou Istchee, Quebec, Canada. BMJ Open. 2021;11(1):e043166. doi: 10.1136/bmjopen-2020-043166 [DOI] [PMC free article] [PubMed] [Google Scholar]
- [47].Riverin B, Dewailly E, Côté S, et al. Prevalence of vitamin D insufficiency and associated factors among Canadian Cree: a cross-sectional study. Can J Public Health. 2013;104(4):e291–e297. doi: 10.17269/cjph.104.3838 [DOI] [PMC free article] [PubMed] [Google Scholar]
- [48].Mansuri S, Badawi A, Kayaniyil S, et al. Country foods and 25(OH)D concentrations in a subarctic first nations community. Int J Circumpolar Health. 2016;75(1):31956. doi: 10.3402/ijch.v75.31956 [DOI] [PMC free article] [PubMed] [Google Scholar]
- [49].Ueland PM, Ulvik A, Rios-Avila L, et al. Direct and functional biomarkers of vitamin B6 status. Annu Rev Nutr. 2015;35(1):33–70. doi: 10.1146/annurev-nutr-071714-034330 [DOI] [PMC free article] [PubMed] [Google Scholar]
- [50].Ulvik A, Pedersen ER, Svingen GFT, et al. Vitamin B-6 catabolism and long-term mortality risk in patients with coronary artery disease. Am J Clin Nutr. 2016;103(6):1417–1425. doi: 10.3945/ajcn.115.126342 [DOI] [PubMed] [Google Scholar]
- [51].Pfeiffer CM, Sternberg MR, Fazili Z, et al. Folate status and concentrations of serum folate forms in the US population: national health and nutrition examination survey 2011–2. Br J Nutr. 2015;113(12):1965–1977. doi: 10.1017/S0007114515001142 [DOI] [PMC free article] [PubMed] [Google Scholar]
- [52].Fazili Z, Sternberg MR, Potischman N, et al. Demographic, physiologic, and lifestyle characteristics observed with serum total folate differ among folate forms: cross-sectional data from fasting samples in the NHANES 2011–2016. J Nutr. 2020;150(4):851–860. doi: 10.1093/jn/nxz278 [DOI] [PMC free article] [PubMed] [Google Scholar]
- [53].D’Onise K, McDermott RA, Leonard D, et al. Lack of folate improvement in high risk indigenous Australian adults over an average of 6.5 years: a cohort study. Asia Pac J Clin Nutr. 2012;21(3):431–439. [PubMed] [Google Scholar]
- [54].Li M, McDermott R, D’Onise K, et al. Folate status and health behaviours in two Australian indigenous populations in north Queensland. Public Health Nutr. 2012;15(10):1959–1965. doi: 10.1017/S1368980011003661 [DOI] [PubMed] [Google Scholar]
- [55].Luick B, Bersamin A, Stern JS. Locally harvested foods support serum 25-hydroxyvitamin D sufficiency in an indigenous population of Western Alaska. Int J Circumpolar Health. 2014;73(1):1. doi: 10.3402/ijch.v73.22732 [DOI] [PMC free article] [PubMed] [Google Scholar]
- [56].Riverin B. Étude transversale sur le statut en vitamine D et ses déterminants chez les Cris du nord du Québec [thesis]. Université Laval; 2014. Available from: https://corpus.ulaval.ca/jspui/handle/20.500.11794/24790 [Google Scholar]
- [57].Mayo labs . Test catalog- Interpretation. Page consulted on 01 July 2022 at: 2022. https://www.mayocliniclabs.com/test-catalog/index.html
- [58].Abrahão GP, Santos MC, Vieira Filho JPB, et al. Serum 25-hydroxyvitamin D concentration and its association with glucose intolerance in an indigenous population. Clin Nutr. 2021;40(3):1318–1322. doi: 10.1016/j.clnu.2020.08.015 [DOI] [PubMed] [Google Scholar]
- [59].Nsiah-Kumi PA, Erickson JM, Beals JL, et al. Vitamin D insufficiency is associated with diabetes risk in native American children. Clin Pediatr (Phila). 2012;51(2):146–153. doi: 10.1177/0009922811417290 [DOI] [PubMed] [Google Scholar]
- [60].Woolcott CG, Wilkens LR, Nomura AMY, et al. Plasma 25-hydroxyvitamin D levels and the risk of colorectal cancer: the multiethnic cohort study. Cancer Epidemiol, Biomarker & Prev. 2010;19(1):130–134. doi: 10.1158/1055-9965.EPI-09-0475 [DOI] [PMC free article] [PubMed] [Google Scholar]
- [61].Lautatzis ME, Sharma A, Rodd C. A closer look at rickets and vitamin D deficiency in Manitoba: the tip of the iceberg. Paediatr & Child Health. 2019;24(3):179–184. doi: 10.1093/pch/pxy105 [DOI] [PMC free article] [PubMed] [Google Scholar]
- [62].Chu F, Ohinmaa A, Klarenbach S, et al. Serum 25-hydroxyvitamin D concentrations and indicators of mental health: an analysis of the Canadian health measures survey. Nutrients. 2017;9(10):E1116. doi: 10.3390/nu9101116 [DOI] [PMC free article] [PubMed] [Google Scholar]
- [63].Chi MZ, Zhu L, Zhang ZL, et al. The relationship between maternal serum vitamin D levels and infant neurodevelopment and anthropometry: a prospective observational study. J Nutr Sci Vitaminol (Tokyo). 2018;64(2):161–167. doi: 10.3177/jnsv.64.161 [DOI] [PubMed] [Google Scholar]
- [64].Föcker M, Antel J, Ring S, et al. Vitamin D and mental health in children and adolescents. Eur Child Adolesc Psychiatry. 2017;26(9):1043–1066. doi: 10.1007/s00787-017-0949-3 [DOI] [PubMed] [Google Scholar]
- [65].Goltz A, Janowitz D, Hannemann A, et al. Association of brain- derived neurotrophic factor and vitamin D with depression and obesity: a population-based study. Neuropsychobiology. 2017;76(4):171–181. doi: 10.1159/000489864 [DOI] [PubMed] [Google Scholar]
- [66].Lally J, Ajnakina O, Singh N, et al. Vitamin D and clinical symptoms in first episode psychosis (FEP): a prospective cohort study. Schizophr Res. 2018;204:381–388. in press. doi: 10.1016/j.schres.2018.08.011 [DOI] [PubMed] [Google Scholar]
- [67].Lamb AR, Lutenbacher M, Wallston KA, et al. Vitamin D deficiency and depressive symptoms in the perinatal period. Arch Womens Ment Health. 2018;21(6):745–755. doi: 10.1007/s00737-018-0852-z [DOI] [PubMed] [Google Scholar]
- [68].Trujillo J, Vieira MC, Lepsch J, et al. A systematic review of the associations between maternal nutritional biomarkers and depression and/or anxiety during pregnancy and postpartum. J Affect Disord. 2018;232:185–203. doi: 10.1016/j.jad.2018.02.004 [DOI] [PubMed] [Google Scholar]
- [69].Grung B, Sandvik AM, Hjelle K, et al. Linking vitamin D status, executive functioning and self-perceived mental health in adolescents through multivariate analysis: a randomized double-blind placebo control trial. Scand J Psychol. 2017;58(2):123–130. doi: 10.1111/sjop.12353 [DOI] [PubMed] [Google Scholar]
- [70].Jamilian M, Samimi M, Mirhosseini N, et al. The influences of vitamin D and omega-3 co-supplementation on clinical, metabolic and genetic parameters in women with polycystic ovary syndrome. J Affect Disord. 2018;238:32–38. doi: 10.1016/j.jad.2018.05.027 [DOI] [PubMed] [Google Scholar]
- [71].Kimball SM, Mirhosseini N, Rucklidge J. Database analysis of depression and anxiety in a community sample—response to a micronutrient intervention. Nutrients. 2018;10(2):152. doi: 10.3390/nu10020152 [DOI] [PMC free article] [PubMed] [Google Scholar]
- [72].Penckofer S, Byrn M, Adams W, et al. Vitamin D supplementation improves mood in women with type 2 diabetes. J Diabetes Res. 2017;2017:1–11. doi: 10.1155/2017/8232863 [DOI] [PMC free article] [PubMed] [Google Scholar]
- [73].Raygan F, Ostadmohammadi V, Bahmani F, et al. The effects of vitamin D and probiotic co- supplementation on mental health parameters and metabolic status in type 2 diabetic patients with coronary heart disease: a randomized, double-blind, placebo-controlled trial. Prog Neuropsychopharmacol Biol Psychiatry. 2018;84(Pt A):50–55. doi: 10.1016/j.pnpbp.2018.02.007 [DOI] [PubMed] [Google Scholar]
- [74].Skogli HR, Geoffroy D, Weiler HA, et al. Associations between omega-3 fatty acids and 25(OH)D and psychological distress among inuit in Canada. Int J Circumpolar Health. 2017;76(1):1302684. doi: 10.1080/22423982.2017.1302684 [DOI] [PMC free article] [PubMed] [Google Scholar]
- [75].Canada . Suicide among first nations people, métis and inuit (2011–2016): finding from the 2011 Canadian census health and environment cohort (CanCHEC). 2019. Page consulted on 09 Oct 2022 at https://www150.statcan.gc.ca/n1/daily-quotidien/190628/dq190628c-eng.htm
- [76].Andersen S, Laurberg P, Hvingel B, et al. Vitamin D status in Greenland is influenced by diet and ethnicity: a population-based survey in an Arctic society in transition. Br J Nutr. 2013;109(5):928–935. doi: 10.1017/S0007114512002097 [DOI] [PubMed] [Google Scholar]
- [77].Gagné D, Blanchet R, Lauzière J, et al. Country food consumption is associated with higher nutrient intakes in inuit children attending childcare centres in Nunavik. Int J Circumpolar Health. 2012;71(1). doi: 10.3402/ijch.v71i0.18401 [DOI] [PMC free article] [PubMed] [Google Scholar]
- [78].Chan L, Batal M, Sadik T, et al. FNFNES final report for eight assembly of first nations regions. Draft comprehensive technical report. 2019. Available from: http://www.fnfnes.ca/docs/FNFNES_draft_technical_report_Nov_2__2019.pdf
- [79].Sheehy T, Kolahdooz F, Schaefer S, et al. Traditional food patterns are associated with better diet quality and improved dietary adequacy in aboriginal peoples in the Northwest Territories, Canada. J Hum Nutr Diet. 2015;28(3):262–271. doi: 10.1111/jhn.12243 [DOI] [PubMed] [Google Scholar]
- [80].Batal M, Chan HM, Ing A, et al. Nutrient adequacy and nutrient sources of adults among ninety-two first nations communities across Canada. Can J Public Health. 2021;112(Suppl 1):29–40. doi: 10.17269/s41997-021-00490-y [DOI] [PMC free article] [PubMed] [Google Scholar]
- [81].Hidiroglou N, Peace RW, Jee P, et al. Levels of folate, pyridoxine, niacin and riboflavin in traditional foods of Canadian Arctic indigenous peoples. J Food Composition Anal. 2008;21(6):474–480. doi: 10.1016/j.jfca.2008.04.003 [DOI] [Google Scholar]
- [82].Kuhnlein HV, Chan HM, Leggee D, et al. Macronutrient, mineral and fatty acid composition of canadian arctic traditional food. J Food Composition Anal. 2002;15(5):545–566. doi: 10.1006/jfca.2002.1066 [DOI] [Google Scholar]
- [83].Slater J, Larcombe L, Green C, et al. Dietary intake of vitamin D in a northern Canadian Dené first nation community. Int J Circumpolar Health. 2013. 1;72(1):20723. doi: 10.3402/ijch.v72i0.20723 [DOI] [PMC free article] [PubMed] [Google Scholar]
- [84].Marushka L, Batal M, Tikhonov C, et al. Importance of fish for food and nutrition security among first nations in Canada. Can J Public Health. 2021;112(S1):64–80. doi: 10.17269/s41997-021-00481-z [DOI] [PMC free article] [PubMed] [Google Scholar]
- [85].Ratelle M, Skinner K, Packull-McCormick S, et al. Food frequency questionnaire assessing traditional food consumption in Dene/Métis communities, Northwest Territories, Canada. Int J Circumpolar Health. 2020;79(1):1760071. doi: 10.1080/22423982.2020.1760071 PMID: 32400304; PMCID: PMC7269081. [DOI] [PMC free article] [PubMed] [Google Scholar]
- [86].Ratelle M, Skinner K, Ramirez Prieto M, et al. Dietary intake estimated from a 24-hour recall questionnaire in the Dene and métis communities of the Northwest Territories, Canada. Curr Devel Nutr. 2023;7(5):100055. doi: 10.1016/j.cdnut.2023.100055 [DOI] [PMC free article] [PubMed] [Google Scholar]
- [87].McDonnell SL, French CB, Heaney RP. Quantifying the food sources of basal vitamin d input. J Steroid Biochem Mol Biol. 2014;144(Part A):149–151. doi: 10.1016/j.jsbmb.2013.10.017 [DOI] [PubMed] [Google Scholar]
- [88].Czarnowska-Kujawska M, Draszanowska A, Gujska E. Effect of different cooking methods on folate content in chicken liver. Foods. 2020;9(10):1431. doi: 10.3390/foods9101431 [DOI] [PMC free article] [PubMed] [Google Scholar]
- [89].Leibovitch Randazzo M, Robidoux MA. The costs of local food procurement in a northern Canadian first nation community: an affordable strategy to food security? J Hunger & Environ Nutr. 2019;4(5):662–682. doi: 10.1080/19320248.2018.1464998 [DOI] [Google Scholar]
- [90].Pal S, Haman F, Robidoux MA. The costs of local food procurement in two northern indigenous communities in Canada. Food Foodways. 2013;21(2):132–152. doi: 10.1080/07409710.2013.792193 [DOI] [Google Scholar]
- [91].Wesche S, O’Hare-Gordon M, Robidoux M, et al. Land-based programs in the Northwest Territories: building indigenous food security and well-being from the ground up. Can Food Stud. 2016;3(2):23–48. doi: 10.15353/cfs-rcea.v3i2.161 [DOI] [Google Scholar]
- [92].Skinner K, Hanning RM, Desjardins E, et al. Giving voice to food insecurity in a remote indigenous community in subarctic Ontario, Canada: traditional ways, ways to cope, ways forward. BMC Public Health. 2013;13(1):427. doi: 10.1186/1471-2458-13-427 [DOI] [PMC free article] [PubMed] [Google Scholar]
- [93].Paci CJ, Dickson C, Nickels S, et al. Food security of northern indigenous peoples in a time of uncertainty. Northern Research Forum. 2004. Available from: https://www.rha.is/static/files/NRF/OpenAssemblies/Yellowknife2004/3rd-nrf_plenary-4_pp_paci-et-al.pdf [Google Scholar]
- [94].Canada . Nutrition North Canada- support for hunting, harvesting and community-led food programs. 2022. Available from: https://www.nutritionnorthcanada.gc.ca/eng/1586274027728/1586274048849
- [95].Pagaduan JE, Lazarescu C, Vallieres E, et al. The impacts of the nutrition north Canada program on the accessibility and affordability of perishable, nutritious foods among eligible communities: a scoping review. Int J Circumpolar Health. 2024;83(1):2313255. doi: 10.1080/22423982.2024.2313255 Epub 2024 Feb 12. PMID: 38346231; PMCID: PMC10863516. [DOI] [PMC free article] [PubMed] [Google Scholar]
- [96].Alaska Department of Health . Supplemental nutrition assistance program (SNAP). 2024. Page consulted on 16 Oct 2024 at https://health.alaska.gov/dpa/Pages/SNAP/default.aspx
- [97].Islam D, Berkes F. Indigenous peoples’ fisheries and food security: a case from northern Canada. Food Sec. 2016;8(4):815–826. doi: 10.1007/s12571-016-0594-6 [DOI] [Google Scholar]
- [98].Wilson A, Levkoe C, Andree P, et al. Strengthening sustainable northern food systems: federal policy constraints and potential opportunities. Arctic. 2020;73(3):292–311. doi: 10.14430/arctic70869 [DOI] [Google Scholar]
- [99].Sarkar D, Walker-Swaney J, Shetty K. Food diversity and indigenous food systems to combat diet-linked chronic diseases. Curr Devel Nutr. 2020;4(Suppl 1):3–11. doi: 10.1093/cdn/nzz099 [DOI] [PMC free article] [PubMed] [Google Scholar]
- [100].Naylor AW, Ford JD, Pearce T, et al. Monitoring the dynamic vulnerability of an Arctic subsistence food system to climate change: the case of Ulukhaktok, NT. PLOS ONE. 2021;16(9):e0258048. doi: 10.1371/journal.pone.0258048 [DOI] [PMC free article] [PubMed] [Google Scholar]
- [101].Guyot M, Dickson C, Paci C, et al. Local observations of climate change and impacts on traditional food security in two northern aboriginal communities. Int J Circumpolar Health. 2006;65(5):403–415. doi: 10.3402/ijch.v65i5.18135 [DOI] [PubMed] [Google Scholar]
- [102].Rosol R, Powell-Hellyer S, Chan HM. Impacts of decline harvest of country food on nutrient intake among inuit in Arctic Canada: impact of climate change and possible adaptation plan. Int J Circumpolar Health. 2016;75(1):1. doi: 10.3402/ijch.v75.31127 [DOI] [PMC free article] [PubMed] [Google Scholar]
- [103].Sahtú Renewable Resources Board, Ɂehdzo Got’ı̨né Gots’ḝNákedı (SRRB) . Final report of the sahtú harvest study. Consultant’s report prepared by Janet Winbourne for the sahtú renewable resources board. Tulıţ’a (NT); 2021. Available from: https://www.srrb.nt.ca/document-repository/public/projects-and-programs/2061-final-report-of-the-sahtu-harvest-study-2021/file [Google Scholar]
- [104].Council of Canadian Academies . Aboriginal food security in Northern Canada: an assessment of the state of knowledge. Ottawa (ON) 2014. Available from: https://cca-reports.ca/wp-content/uploads/2018/10/foodsecurity_fullreporten.pdf [Google Scholar]
- [105].Wesche SD, Chan HM. Adapting to the impacts of climate change on food security among Inuit in the Western Canadian Arctic. Ecohealth. 2010;7(3):361–373. doi: 10.1007/s10393-010-0344-8 [DOI] [PubMed] [Google Scholar]
- [106].Berner J, Brubaker M, Revitch B, et al. Adaptation in Arctic circumpolar communities: food and water security in a changing climate. Int J Circumpolar Health. 2016;75(1):33820. doi: 10.3402/ijch.v75.33820 [DOI] [PMC free article] [PubMed] [Google Scholar]
- [107].Furgal D, Seguin J. Climate change, health, and vulnerability in Canadian northern aboriginal communities. Environ Health Perspect. 2006;114(12):1964–1970. doi: 10.1289/ehp.8433 [DOI] [PMC free article] [PubMed] [Google Scholar]
- [108].Hatton CR, Bresnahan C, Tucker AC, et al. Food for thought: the intersection between SNAP stigma, food insecurity, and gender. Soc Sci Med. 2024;361. doi: 10.1016/j.socscimed.2024.117367 [DOI] [PMC free article] [PubMed] [Google Scholar]
- [109].Uri R. “It make me feel like I’m beneath them”: experiences of stigma among individuals living with food insecurity [Dissertations & Theses]. The University of North Carolina at Charlotte ProQuest; 2021. 28863993. [Google Scholar]
- [110].Tadesse G, Abate GT, Zewdie T. Biases in self-reported food insecurity measurement: a list experiment approach. Food Policy. 2020;92:101862. doi: 10.1016/j.foodpol.2020.101862 [DOI] [Google Scholar]
- [111].Naylor AW, Kenny TA, Furgal C, et al. Cash economy and store-bought food biases in food security assessments of inuit nunangat. Arctic. 2023;76(4):382–478. doi: 10.14430/arctic78196 [DOI] [Google Scholar]
- [112].Gyapay J, Noksana K, Ostertag S, et al. Informing the Co-development of culture-centered dietary messaging in the inuvialuit settlement region, northwest territories. Nutrients. 2022;14(9):1915. doi: 10.3390/nu14091915 [DOI] [PMC free article] [PubMed] [Google Scholar]
Associated Data
This section collects any data citations, data availability statements, or supplementary materials included in this article.
Supplementary Materials
Data Availability Statement
The datasets presented in this article are not readily available because they are the property of the First Nations communities who participated in the study, and with respect for the OCAP® principles, including Ownership, Control, Access and Possession. OCAP® is a registered trademark of the First Nations Information Governance Centre (FNIGC, 2022). Individual-level data related to the blood sample analysis is prohibited under our Community Research Agreements and protocols outlined in the Review Ethics Board approvals. Requests to access the datasets should be directed to the Sahtú Renewable Resources Board (www.srrb.nt.ca).