Abstract
The poly(A) signal and downstream elements with transcriptional pausing activity play an important role in termination of RNA polymerase II transcription. We show that an intronic sequence derived from the plant seed protein gene (AmA1) specifically acts as a transcriptional terminator in the fission yeast, Schizosaccharomyces pombe. The 3′-end points of mRNA encoded by the AmA1 gene were mapped at different positions in S.pombe and in native cells of Amaranthus hypochondriacus. Deletion analyses of the AmA1 intronic sequence revealed that multiple elements essential for proper transcriptional termination in S.pombe include two site-determining elements (SDEs) and three downstream sequence elements. RT–PCR analyses detected transcripts up to the second SDE. This is the first report showing that the highly conserved mammalian poly(A) signal, AAUAAA, is also functional in S.pombe. The poly(A) site was determined as Y(A) both in native and heterologous systems but at different positions. Deletion of these cis-elements abolished 3′-end processing in S.pombe and a single point mutation in this motif reduced the activity by 70% while enhancing activity at downstream SDE. These results indicate that the bipartite sequence elements as signals for 3′-end processing in fission yeast act in tandem with other cis-acting elements. A comparison of these elements in the AmA1 intron that function as a transcriptional terminator in fission yeast with that of its native genes showed that both require an AT-rich distal and proximal upstream element. However, these sequences are not identical. Transcription run-on analysis indicates that elongating RNA polymerase II molecules accumulate over these pause signals, maximal at 611–949 nt. Furthermore, we demonstrate that the AmA1 intronic terminator sequence acts in a position-independent manner when placed within another gene.
INTRODUCTION
Transcription termination, splicing and 3′-end processing of pre-mRNA are inter-dependent events (1–3). These links, perhaps, are very crucial for organisms with compact genomes. It is thus postulated that the combinatorial effect of different processes may result in a higher complex stability, which enhances the transcriptional processing efficiency. The mRNA 3′-end processing is an important step in gene expression. Many eukaryotic and viral genes give rise to mRNAs that differ in their 3′ ends due to the choice between alternative poly(A) sites. In addition, the presence of several isoforms of poly(A) polymerase and the stimulatory factor CstF-64 suggests that regulated 3′-end processing can be an additional means to modulate gene expression in a tissue- or developmental stage-specific manner. The 3′-end formation is a co-transcriptional phenomenon that results from coupled events of endonucleolytic cleavage and polyadenylation of the nascent transcript synthesized by RNA polymerase II (pol II). However, transcription termination occurs further downstream and is required to release the elongating polymerase for the subsequent round of transcription, as well as to prevent transcriptional interference of pol II genes transcribing in a similar direction (4). In general, transcription termination occurs in poorly defined regions up to 4 kb beyond the poly(A) signal. Two signals are believed to be necessary for pol II transcription termination: a functional poly(A) signal and a downstream sequence element (DSE) at the site of termination (5).
The signals directing cleavage/polyadenylation have been studied extensively in higher eukaryotes (4,6–9) but only sparse information is available for plant mRNA. The cis-sequences responsible for mRNA 3′-end processing in eukaryotic organisms are upstream sequence element/efficiency element (EE), a poly(A) signal known as the site-determining element (SDE), a poly(A) site and a DSE. Mutation of the poly(A) signal results in continued transcription beyond the normal termination site (5,10,11), and the in vitro processing efficiency of the poly(A) signal correlates with termination efficiency (12). The role of the upstream sequence element has been shown in mammals, plants and also in Saccharomyces cerevisiae but not in Schizosaccharomyces pombe while DSE has been characterized only in S.pombe and mammalian mRNAs. The cis-elements required for 3′-end formation in fission yeast have only been defined for three genes, namely ura4, nmt1 and nmt2 (7,4). In ura4, two SDEs that position the major and minor cleavage sites and a downstream EE are required for efficient 3′-end formation and a DSE for transcription termination (7,13). Similar to ura4, 3′-end processing signals in nmt1 and nmt2 mRNAs indicate that efficient transcription termination requires not only a poly(A) signal but also additional pause elements. Perhaps the absence of such pause elements close to the poly(A) site of these genes may account for their extended nascent transcripts (4,14). Unlike plants and yeast, mammals contain much simpler and almost invariant poly(A) signal AAUAAA, located 15–20 nt upstream of the cleavage site, and a less well defined GU- or U-rich element is located downstream of the cleavage site (9). In general, the sequences 30–150 nt upstream of the cleavage site are essential for 3′-end formation in plants (6,15). The universal mammalian signal sequence AAUAAA is present in only 40% of plant genes (16). However, point mutations that inactivate the AAUAAA element in plant mRNAs (17) result in only partial inactivation suggest that the plant ortholog of CPSF may have altered sequence specificity (6,15). Thus, signals for mRNA 3′-end processing in plants and fission yeast cells appear to be different from those in mammals.
In this study, we investigated the transcription of a seed protein gene, AmA1 (18) in S.pombe. AmA1 intron does not have any sequence similarity to S.pombe transcription termination elements. To our surprise, expression of AmA1 produced a truncated mRNA that extended beyond the 5′-splice site but terminated within the intronic sequence. We demonstrate that the transcription machinery of S.pombe specifically recognizes the putative poly(A) signals positioned within the AmA1 intronic sequence. The mRNA 3′-end points, where the poly(A) tail is added, are at a different position in amaranth and S.pombe, and the functioning of this site in fission yeast is position independent. We show that multiple cis-acting sequence elements, including two upstream sequences, the AAUAAA motif, and the sequences downstream of the poly(A) addition site are responsible for 3′-end processing and thus premature termination. To the best of our knowledge, this is the first report that clearly shows that the sequence AAUAAA, a highly conserved motif for mammalian poly(A) signal (19,20), is functional as SDE in S.pombe. Point mutations in this sequence reduced the activity of this signal to 30% of the original activity. We propose a computer-assisted structural model for the mechanism of 3′-end processing of prematurely terminated AmA1 transcript in S.pombe.
MATERIALS AND METHODS
Growth and transformation of S.pombe
The S.pombe strain used in this study was BJ7468 (ura4-D18 leu1-32 ade6-M216). Media, growth conditions, and maintenance of cells were in accordance with standard methods (21).
Oligonucleotides
The sequence of oligonucleotides used for cloning purposes or PCR can be made available upon request.
DNA constructs
The amaranth genomic DNA was PCR amplified using F51 and R1044, cloned in pBluescript II (Stratagene) and referred to thereafter as pSB5.4 (18). The clone was verified by restriction analysis and DNA sequencing. Various enzymatic deletions of this 2.55 kb AmA1 genomic fragment in pSB5.4 (accession no. AF491291) were carried out. The constructs, pSBDr 4.2 (with 535–1689 nt deleted) and pSBDr5.1 (with 1321–1689 nt deleted) were derived from self-ligation of pSB5.4–DraI partially digested fragments of sizes ∼4.2 and ∼5.1 kb, respectively. Similarly, pSBNd4.3 (with 464–1532 nt deleted) was derived from self-ligation of the ∼4.3 kb pSB5.4–NdeI partially digested fragment. The same deletions in pRAG were carried out by replacement cloning with BglII–NruI fragments of pSBDr4.2, pSBDr5.1 and pSBNd4.3, ligated separately to the BglII–NruI fragment of pRAG. pRABB (with 346–1675 nt deleted) and pRABN (with 346–2246 nt deleted) deletion clones were derived from self-ligation of the 9.6 kb BglII–BclI fragment and 9.6 kb BglII–NruI fragment of pRAG, respectively. All deletion constructs were verified by restriction digestions and confirmed by DNA sequencing. The clone pΔRAG (with 261–1709 nt deleted) was derived by an inverse PCR based strategy with R261 and F1709 primers and pRAG as template.
pRAM275, a mutant derivative of pRAG, where the ‘AA’ dinucleotides at position 275–276 of the gene were changed to ‘GC’, was constructed by carrying out PCR-mediated site-directed mutagenesis using primers F275 and R275 using template pRAG and the Quickchange Site-Directed Mutagenesis Kit (Stratagene). Similarly, clones pRABBM275, pRABNM275 and pRANdM275 representing the same mutation in pRABB, pRABN and pRANd, respectively, were derived using the latter three as templates. The RsaI fragment of AmA1 intron (from pSB5.4) spanning 213–589 nt was cloned separately in the NdeI and NruI sites of pRAC and the resultant clones were named pRACTNd and pRACTNr, respectively.
Transcript 3′-end mapping
The 3′ end of AmA1 transcripts from pRAG-transformed S.pombe cells as well as from immature seeds of Amaranthus hypochondriacus were mapped using the 3′-RACE system (Life Technologies). Total RNA was isolated using TriPure isolation reagent (Boehringer Mannheim) and 2 µg was used for cDNA synthesis. PCR amplification was carried out using F51/F190 as forward primer and AUAP (Life Technologies) as reverse primer. Reaction products were resolved on 1.0% agarose gel, and cloned at the EcoRV site of pBluescript II. The clones obtained for pRAG and native AmA1 were designated as pRAGRACE and pAmA1-3′R, respectively. The clones were sequenced using the M13 –40 Primer and Sequenase Version 2.0 DNA Sequencing Kit (US Biochemicals).
Transcript analysis
The DNA constructs detailed above were introduced into S.pombe by the lithium acetate method (22). RNA was isolated as described earlier and 25 µg of transcripts were analyzed by northern hybridization using a 1.18 kb EcoRI fragment of pAmA1.3 (23) as probe. RT–PCR analysis of transcripts was carried out using different primers and either Superscript-II RT (Life Technologies) and AmpliTaq DNA polymerase or rTth DNA polymerase (Perkin Elmer). In the case of RT–PCR with oligo-dT primer and gene-specific primer, first, cDNA synthesized was catalyzed by Superscript-II RT (Life Technologies) using 5 µg of total RNA and AP primer. The reaction mix was treated with RNase H (Life Technologies).
RT–PCRs with cDNA synthesized from pRAG RNA using a common forward primer F51 and different reverse primers (R261, R316, R370, R464, R680 and R1635) were carried out as described above, except in the case of R680 where the MgCl2 concentration used was 3.5 mM. For reference, 0.1 ng of pRAG plasmid DNA was amplified with each of the primer combinations using the same conditions as was used in respective RT–PCRs. Similarly, RT–PCRs with cDNA synthesized from pRAC RNA were carried out using F51 and either R1902 and R1044 primers. RT–PCR analyses of pRAG RNA were carried out with a common forward primer F51 and different reverse primers R261, R316, R370 and R680 using rTth DNA polymerase.
Transcription run-on (TRO) assay
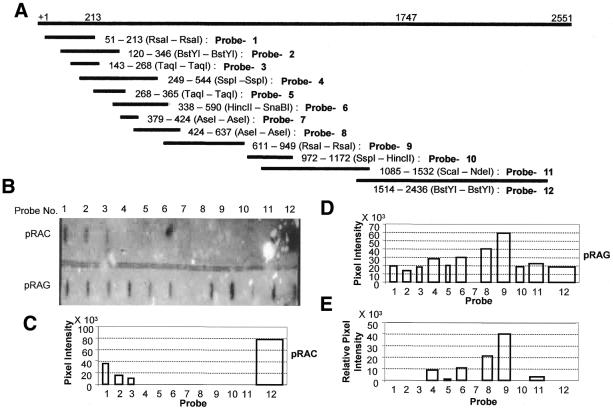
Different gel-purified restriction fragments of pSB5.4 (see Fig. 6A) were used as probes for the TRO assay. The double-stranded DNA fragments were denatured in 0.25 N NaOH for 10 min, chilled on ice and then diluted up to 50 µl in 0.125 N NaOH, 0.125× SSC. The samples were immobilized on a nylon membrane (GeneScreen Plus membrane, DuPont) using a Hybri-Slot Manifold (Life Technologies) apparatus and the blot was dried at 80°C.
Figure 6.
TRO analysis of the 2.55 kb AmA1 genomic fragment in S.pombe. (A) Schematic representation of different overlapping fragments of 2.55 kb in pSB5.4 used as probes. Restriction enzymes used to prepare the fragments are shown along with their respective positions. (B) TRO blots containing 30 ng of each of the probes were blotted and hybridized with nascent transcripts isolated from pRAC- and pRAG-transformed S.pombe cells as described in Materials and Methods. (C–E) Graphical display of the TRO profile. The graphs are drawn to scale such that the width of each bar reflects the length of the probe and the height indicates the respective signal across the probe. (C and D) The representative TRO signals from pRAC- and pRAG-transformed S.pombe cells, respectively, and (E) the signals across the probes in the case of pRAG-transformed cells which are corrected and expressed relative to probe 1.
The TRO assay was carried out following a protocol modified from that described for S.pombe (13). In brief, 100 ml of cultures of S.pombe cells (∼3 × 10⁸ cells) harboring pRAG and pRAC were grown in minimal medium to an OD595 of ∼1.0. Cells were harvested by centrifuging at 1000 g for 5 min, washed in 10 ml TMN (10 mM Tris–HCl pH 7.4, 5 mM MgCl2, 100 mM NaCl) and resuspended in 3.6 ml of H2O. Cells were then permeabilized by treating with 400 µl of 10% SDS on ice for 30 min and pelleted down by centrifuging at 1000 g for 2 min. The pellet was recentrifuged as above for 1 min to remove residual detergent, if any, and resuspended in 40 µl of 2.5× transcription buffer and 60 µl of transcription buffer supplements containing 4 mM DTT, 2 mM each rATP, rGTP, rCTP and 100 µCi of [α-32P]rUTP (3000 Ci/mmol). Transcription was allowed to proceed for 5 min at 25°C. Cells were collected by centrifugation at 1000 g for 2 min at 4°C, washed briefly with TMN and used for RNA isolation. RNA was partially hydrolyzed by treating with 0.2 M NaOH for 5 min at 4°C and neutralized with 0.2 M Tris–HCl (pH 7.2). The membrane with the immobilized probes was washed in 2× SSC for 1 min and prehybridized in 10 ml of 5× SSC, 50% (w/v) deionized formamide, 10% (w/v) dextran sulfate (molecular weight 500 000), 1% (w/v) SDS at 42°C for 4 h. Partially hydrolyzed RNA transcripts were hybridized to immobilized double-stranded DNA probes for 24 h at 42°C. The membrane was then washed with 0.2× SSC, 0.1% SDS twice at 42°C for 20 min each. The ‘run-on’ signals were visualized on Kodak (X-OMAT) AR films and quantified with a Storm 860 (Molecular Dynamics).
In vitro transcription interference assay
In vitro transcription reactions were carried out using 100 ng of pSBNd4.3 linearized with NdeI as template DNA and T3 RNA polymerase (Life Technologies). The reaction had 20 pmol of either of the following antisense oligonucleotides: R261, R316, R370 and R464. Similarly, reactions were set up varying the amount of R316 from 1 to 40 pmol. An aliquot of the reaction was analyzed on a 5% polyacrylamide–8 M urea gel along with an end-labeled 100 bp DNA ladder (New England Biolab) as a reference molecular weight marker. The gel was treated with 10% acetic acid and 10% MeOH for 10 min, lifted onto a Whatman 3 MM filter paper and dried. The signals were visualized using Kodak (X-OMAT) AR films.
Accession number for complete AmA1 CDS, intron and partial 3′-UTR
The sequence submitted to GenBank can be found under accession no. AF491291.
RESULTS
Intronic sequence functions as transcriptional terminator in S.pombe
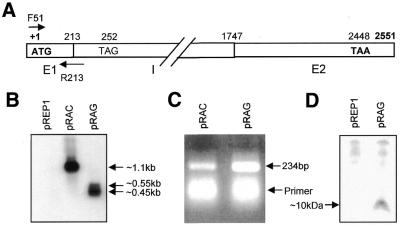
The 2.55 kb genomic fragment encoding AmA1 was cloned in S.pombe expression vector pREP1 at an NdeI site (24) under the control of an nmt1 promoter (Fig. 1A) and was named pRAG. The clone extends over the whole ORF and is interrupted by an intron of 1.55 kb spanning 213–1747 nt with the translational start codon (ATG) positioned at +1 and the translational stop codon (TAA) positioned at 2448 and contains an additional 103 nt of 3′-UTR of the gene. Total RNA was isolated from S.pombe cells harboring either pRAG, pREP1 (as negative control) or pRAC (AmA1 cDNA in pREP1) and northern hybridization was carried out using 1.18 kb of AmA1 cDNA as a probe. The pRAC clone used as a positive control revealed a transcript of an expected size of ∼1.1 kb. However, we were surprised to find an mRNA of ∼450 nt and a larger less abundant mRNA of ∼550 nt from pRAG (Fig. 1B). We note that the steady state level of transcripts from pRAG and pRAC are comparable. The size of the shorter transcript from the construct pRAG suggested that a premature termination product rather than a correctly spliced product was generated.
Figure 1.
(A) Schematic representation of the AmA1 genomic clone, pSB5.4, indicating two exons (E1 and E2) and one intron (I). (B) Northern blot of RNAs from S.pombe cells transformed with plasmids pREP1, pRAC and pRAG. The positions of RNA molecular weight markers are shown in the right track. (C) RT–PCR products of RNAs from cells transformed with pRAC and pRAG using F51 and R213 primers. (D) Immunoblot of total soluble protein from S.pombe cells transformed with pREP1 and pRAG. Aliquots of 200 µg protein were separated by 16.5% Tricine–SDS–PAGE and electroblotted onto a Hybond membrane (Amersham Pharmacia). The AmA1 protein was detected with a rabbit polyclonal anti-AmA1 antibody and anti-rabbit IgG antibody. The arrow indicates the truncated AmA1 protein.
To substantiate the northern results, the truncated AmA1 transcript was analyzed by RT–PCR using the primer combination F51 and R213. The primer F51 spans the ATG codon and therefore should be fully represented in mRNA from both pRAG and pRAC. The reverse primer R213 was designed such that it spans the first exon–intron boundary (Fig. 1A). We surmised that if indeed the mRNA from pRAG extends through the first exon–intron boundary, then the primer R213 would hybridize efficiently to this truncated 450 bp mRNA and result in optimal PCR amplification in the RT–PCR. In contrast, the same primer would hybridize weakly to 1.1 kb mRNA from pRAC because of the lack of an intron, and only the 3′ 11 bases of this 22mer oligo would hybridize to the pRAC mRNA. Consequently, the yield of PCR products would be less than that with pRAG mRNA. Results in Figure 1C show that the pRAG mRNA yielded ∼2–3-fold higher PCR products than with pRAC mRNA, indicating that the first exon–intron junction is preserved in pRAG mRNA. Furthermore, this also suggested that the simplest interpretation for the shorter transcripts from pRAG could be due to premature termination within the intronic sequence.
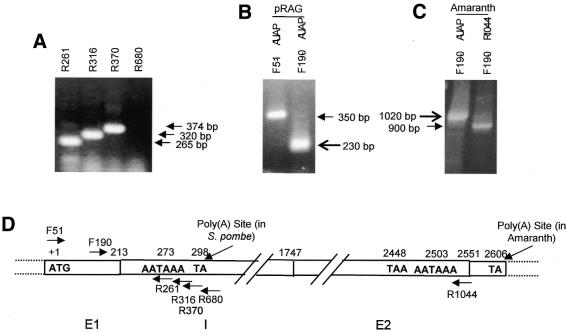
As the pRAG transcript was extended through the 5′-intronic region, we began our analysis on the extended transcripts with four near contiguous reverse primers from the intron and a common forward primer from exon 1 (Fig. 2D). RT–PCR analyses clearly demonstrated that the transcript was extended at least up to 154 nt but not beyond 467 nt of the 5′-intronic region as PCR products of expected sizes were obtained with primers R261, R316 and R370 (Fig. 2A). Transcription initiation from nmt1 promoter starts 69 nt upstream of ATG (24) and if that is the case in pRAG, transcription termination and 3′-end processing might have occurred at approximately position 370 of the gene, keeping in view that the transcript is a stable one and, hence, is invariably polyadenylated. A search over this intronic region identified a eukaryotic polyadenylation consensus sequence AAUAAA positioned at 273 nt and a translation stop codon TAG at 252 nt, in frame with the translation start codon but within the intron (Figs 2D and 1A).
Figure 2.
(A) RT–PCR products of RNAs from S.pombe cells transformed with pRAG using F51 in combination with R261, R316, R370 and R680 primers. RT products were analyzed on ethidium bromide stained 1% agarose gel. (B and C) Poly(A) site mapping of the premature transcripts by 3′-RACE. The reactions were carried out with RNAs from pRAG-transformed S.pombe cells using F51/F190 and AUAP (Life Technologies) primers (B) and amaranth seeds using F190 and AUAP/R1044 primers (C). The RACE products were analyzed on ethidium bromide stained 1.2% agarose gel. (D) Schematic representation of the AmA1 gene showing positions of different primers and poly(A) sites as detected in S.pombe and amaranth.
As the AmA1 truncated transcript in pRAG was stable and a translation stop signal was localized therein, it was of interest to see the translation product, if any, that would immuno-react with AmA1 antibody. To detect the speculated translated product, crude protein extracts from cells expressing pRAG and pREP1 were resolved on a Tricine–SDS–PAGE and immunoblotted with rabbit anti-AmA1 antibody. Immunoblot analysis revealed a distinct 10 kDa polypeptide that is specific for pRAG extracts indicating a probable translation stop codon TAG at 39 nt downstream of the intron start site (Fig. 1D).
Mapping of poly(A) site of prematurely terminated AmA1 transcript
To map the poly(A) site of the prematurely terminated transcript, 3′-RACE was carried out using total RNA isolated from S.pombe cells transformed with pRAG. The major DNA product was sub-cloned (Fig. 2B) and sequence analysis of the 3′-RACE product revealed the dinucleotide 5′-T(A)-3′ positioned at 86 nt downstream to the AmA1 intron start GT as the poly(A) site. The sequence conforms to the most favorable cleavage site in S.pombe, usually characterized by the sequence Y(A)n. The presence of a positioning element AAUAAA at 24 nt upstream of this poly(A) site could function as a candidate SDE that may be involved in defining the cleavage site.
It was of interest to map the poly(A) site of AmA1 in its native system, amaranth. The 3′-RACE of amaranth immature seed RNA (Fig. 2C) indicates a residue T(A) at position 159 nt downstream of the native translational stop codon of AmA1 gene. Sequence analysis of 3′-UTR of native transcript identifies an eukaryotic polyadenylation signal consensus AAUAAA, at position 98 nt upstream of the mapped poly(A) site which could be the probable near upstream element (NUE) of AmA1 gene (Fig. 2D).
Delineation of AmA1 intronic sequence involved in transcriptional termination
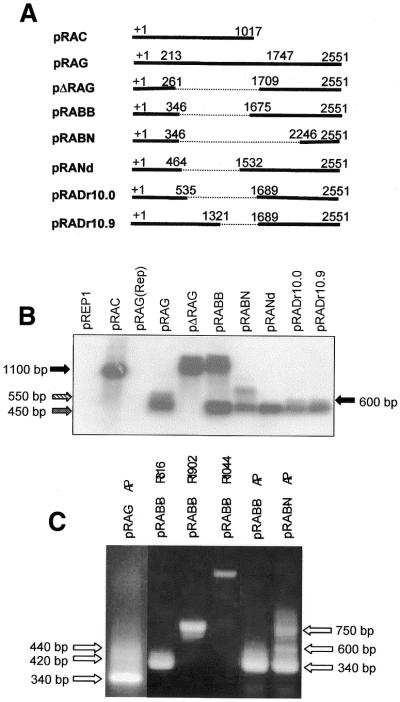
The specific recognition of the polyadenylation site of the AmA1 intron in S.pombe and the identities of the putative mRNA 3′-end forming signal has prompted us to determine the minimal cis-acting sequences required in transcription termination. In addition to the poly(A) signals, DSEs that are 3′ to the poly(A) site have previously been shown to be required for efficient termination of transcript in S.pombe (13). To identify DSE in AmA1 intron 5′- and 3′-deletion series were created (Fig. 3A) and 3′-end formation efficiency was determined by comparing the resultant transcripts in northern blot. The deletion analyses suggest that the region between 261 and 346 nt in the AmA1 intron encodes sequences that direct 3′-end processing in at least 50% of the read-through transcripts. Maximal efficiency of mRNA 3′-end processing requires the retention of sequence at least up to 464 nt indicating that nucleotides from 346 to 464 downstream to the mapped poly(A) site play an important role as DSE in transcription termination in S.pombe.
Figure 3.
(A) Diagram of the clones pRAC, pRAG and its deletion subclones along with the deleted region (dotted line) in the AmA1 intron. In pRAG and deleted subclones, the position +1 represents the translation start site of the AmA1 gene and 213 and 1747 as the 5′- and 3′-intron termini. (B) Northern blot showing 100% read-through transcript of 1.2 kb in pΔRAG, 50% each of 1.3 and 0.5 kb truncated transcripts in pRABB, with only 20% of 0.65 kb read-through and 80% 0.45 kb truncated transcripts in pRABN whereas there was no read-through transcript in pRANd, pRADr10.0 and pRADr10.9. (C) The 3′-RACE products of RNA isolated from S.pombe cells transformed with the constructs as indicated at the top of each lane. The reaction was carried out with F51 and AP (Life Technologies) primers and the products were analyzed on a 1.2% agarose gel. The differences in polyadenyaltion of transcripts are shown by arrows.
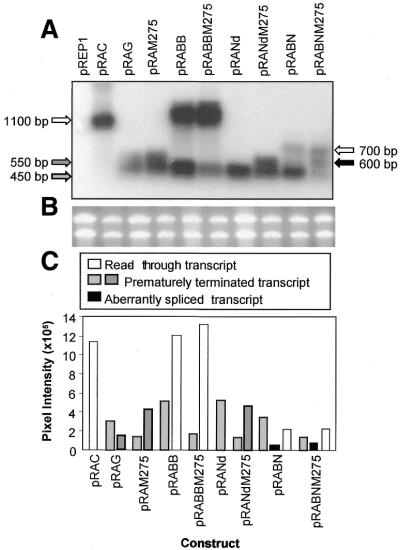
A close look at the northern blot revealed an additional truncated transcript of ∼600 nt, though less in amount, in the case of pRAG, pRADr10.0, pRADr10.9 and very much less in the case of pRANd. However, no such transcript was detected in pRABB and pRABN. This additional transcript might have originated due to polyadenylation at different poly(A) sites and may have a common or two entirely different SDEs.
In S.pombe native genes, at least two SDEs have previously been shown to be part of polyadenylation signal (13). The presence of more than one truncated transcript in northern blot (Fig. 3B) prompted us to ask whether these transcripts resulted from the presence of two such SDEs. To obtain this information, the polyadenylated AmA1 truncated transcripts in S.pombe were analyzed using oligo dT primer by a highly sensitive RT–PCR technique. The results clearly showed three different polyadenylated transcripts in pRAG. The ∼340 nt appeared as the major product while the ∼420 and ∼440 nt were minor products which could be correlated with the northern data of the ∼450 and ∼550 nt transcripts, respectively. Probably the two minor transcripts could not be resolved in northern blot and hence merged to form the ∼550 bp band. Similar was the result in pRABN where three distinct polyadenylated products were also detected. The major truncated transcript was ∼340 nt while ∼750 nt represented the read-through transcript and the ∼600 nt transcript was its aberrant spliced product (Fig. 3C). The results of this RT–PCR analysis confirmed that the different truncated AmA1 transcripts in S.pombe were indeed polyadenylated at different positions.
Higher eukaryotic consensus AAUAAA is functional SDE in S.pombe
Mapping of the poly(A) site of the truncated transcript of the AmA1 gene in S.pombe indicated the sequence AAUAAA at position 273 nt to be a putative SDE. To study its effect on transcription, this sequence was mutated as AAGCAA in pRAG and its deletion clones. Northern blot analyses revealed that the mutation significantly affected the yield of the small transcript of size ∼450 nt by 70% (Fig. 4A). Mutation favored the accumulation of the otherwise less predominant transcript, 600 nt, over its counterpart 450 nt in the clones pRAG, pRANd and pRABN (Fig. 4C). These results suggest the sequence AAUAAA functions as an SDE in S.pombe, though with a varied efficiency as the mutation could not abolish polyadenylation completely at the downstream poly(A) site.
Figure 4.
Analysis of putative SDE mutations of pSB5.4 and deletion subclones. (A) Northern blot of RNA from S.pombe cells harboring pRAG, deletion clones (pRABB, pRABN and pRANd) and mutants (pRAM275, pRABBM275, pRABNM275 and pRAND275) as detailed in Figure 3B. Positions of transcripts are shown by arrows. (B) An impression of the gel stained with ethidium bromide prior to transferring the RNA sample onto a nylon membrane. (C) Bar graph of the data obtained from the northern blot. The absolute values were corrected for background hybridization and plotted against respective clones each of which indicates the transcript size.
Detection of transcripts downstream of the poly(A) site
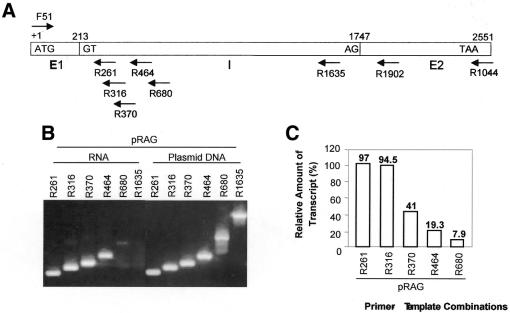
The transcriptional termination and pre-mRNA processing events are coupled phenomena in mRNA 3′-end formation in S.pombe (13). Indications of the involvement of DSE-like elements as well as the presence of more than one polyadenylated transcript suggest that the transcription termination event of the AmA1 gene in S.pombe also results from such a phenomenon. If this is true, one would expect mRNA transcripts extending beyond the poly(A) site. In order to verify this, an analysis of the termination event was characterized by defining the site at which no further transcripts could be detected in the 3′-flanking region of the mapped poly(A) site. The truncated transcripts were analyzed by RT–PCR with DNA primers (Fig. 5A) hybridized to the pRAG transcripts and by amplification of the cDNA products (Fig. 5B). A measure of the relative amount of transcripts was made by comparing the counts incorporated into the PCR products separated electrophoretically (Fig. 5C). To avoid any erroneous estimation due to varied RT–PCR efficiency for each pair of primers, a known amount of plasmid DNA was PCR amplified using the same amount of the primer combination as a reference and the amount of transcripts was expressed in percentage amplification relative to the reference (set at 100). The amount of DNA used in the reference reaction was selected such that all the reverse primers used in the study gave near equal amplification in terms of number of counts. Hence, the relative amount of the transcript expressed in percentage after normalization should correlate with the amount of transcripts extended up to the antisense oligonucleotide binding site. Transcripts were detected past the previously mapped poly(A) site, although at a much reduced level compared with the level of transcripts detected near downstream of the poly(A) site. Amplified product was detected up to the reverse primer R680, corroborating the findings in the northern blot, where two transcripts of size ∼450 and ∼550 nt were the end products. These results suggest that transcriptional termination of the AmA1 gene in S.pombe occurs close to the most distal mRNA 3′-end formation element roughly defined in these studies. The signals very close to 5′ upstream to 680 nt may therefore play an important role in transcription termination.
Figure 5.
Detection of transcripts downstream of poly(A). (A) Schematic representation of positions of each of the antisense oligonucleotides used for RT–PCR analysis with respect to the 2.55 kb AmA1 genomic fragment. (B) Electrophoretic separation of transcripts detected across the downstream region of the poly(A) site. RT reactions were carried out with RNA isolated from S.pombe cells transformed with pRAG using end-labeled F51 and different antisense primers. As reference for semi-quantification of differential amplification, 0.1 ng of pRAG DNA was also amplified and the products were analyzed on a 1.5% agarose gel. (C) Bar graph of the data obtained from RT–PCRs. The amplified DNA fragments were excised, the radioactivity count (Cerenkov) was determined and plotted as the percentage of the relative counts obtained from plasmid DNA (as 100%).
Detection of extended nascent transcription by TRO
In higher eukaryotes, TRO assays have been employed to map sites of nascent transcription in isolated nuclei or whole cells (4). In order to determine the precise signals required for transcriptional termination by pol II, the TRO assay was employed by measuring the polymerase density across the 3′-flanking region of the mapped poly(A) site of the AmA1 transcript. The TRO analyses in pRAG cells revealed high levels of incorporation of [α32-P]UTP over probes 4, 6, 8 and 9 (Fig. 6A) in AmA1 transcript, showing the strongest signal with probe 9. In contrast, no incorporation was detected in pRAC for these probes (Fig. 6B–E). As the signal for each probe is proportional to the average polymerase density across the DNA fragment, it appears that two distinct regions, one spanning from 338 to 590 nt and the other from 589 to 949 nt represent high levels of polymerase density where elongating polymerases probably accumulate in response to transcriptional pause signals in a way that is characteristic of DSE in S.pombe. If the pulse-labeled RNA is hybridized to contiguous single-stranded DNA probes spanning the 3′-flanking region of the poly(A) site in question, a profile of polymerase density could be obtained.
Minimal functional domain sufficient for mRNA 3′-end processing acts in a position independent manner
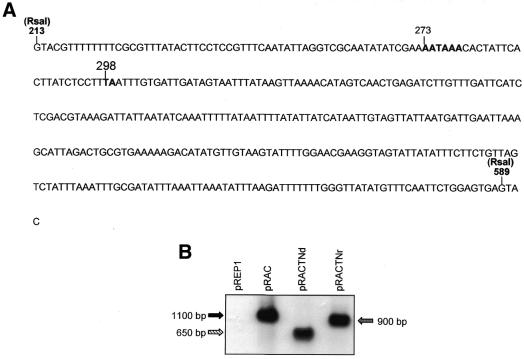
Taking together the findings of deletion analyses, RT–PCR studies and TRO assay, it appears that the minimal domain sufficient for 3′-end formation and transcription termination in S.pombe falls between 213 and 589 nt of the AmA1 gene. This 376 bp intronic sequence houses the elements required for polyadenylation and transcription termination (Fig. 7A). In order to determine the functionality of the domain recognized by the transcription machinery in S.pombe, it was introduced in pRAC independently at two different sites (NdeI positioned at 492 and NruI positioned at 714 of AmA1 cDNA). The clones pRACTNd and pRACTNr yielded two different truncated transcripts of 650 and 900 nt, respectively, instead of the unaltered AmA1 transcript size of 1100 nt (Fig. 7B). This suggests that the introduction of the functional domain leads to efficient transcription termination. Besides, this element is dominant over the native nmt1 termination sequence. These results also demonstrate that the AmA1 intronic sequence functions in a position- and context-independent manner.
Figure 7.
Functional analysis of the AmA1 intronic sequence recognized as a transcription terminator in S.pombe. (A) Sequence of the RsaI fragment (213–589, 376 nt) which was used to carry out functional analysis of the terminator. (B) Truncated transcripts detected in the northern blot. The blot was prepared with 25 µg of total RNA from each extract, separated on a 1.2% denaturing formaldehyde gel, transferred onto a nylon membrane and hybridized with 1.18 kb AmA1 cDNA.
A unique structural signature regulates transcription termination of the AmA1 gene
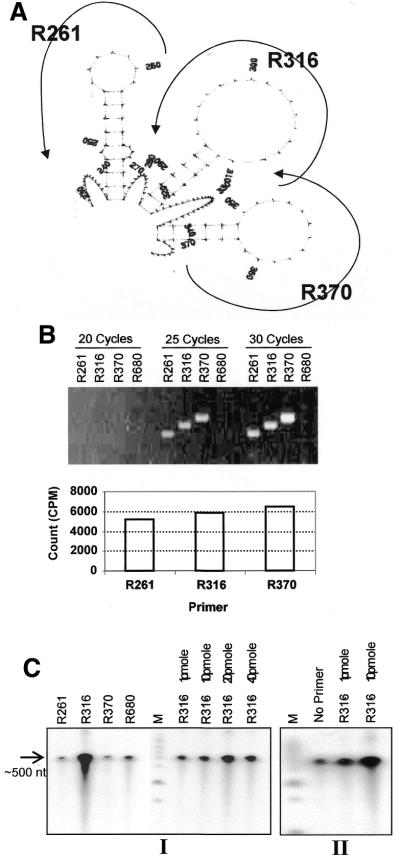
RT–PCR analyses of transcript using reverse primers R261, R316 or R370 with a common forward primer F51 yielded maximum amplification with R370, in comparison with other primer combinations (Fig. 8B). It was quite intriguing keeping in view their comparable melting temperatures and also the consistent amplification level obtained regardless of the protocol used in RT–PCR analyses. Hence, the variable pattern of amplification could be interpreted as an intrinsic property of the transcript. This finding motivated us to study the RNA secondary structure in that region. Moreover, other experiments designed to address transcription termination and 3′-end processing assigned significance to this very region as it housed the functional SDE and poly(A) site, besides stipulating the presence of DSEs, like the element that stalls elongating RNA polymerase.
Figure 8.
Structural analysis of the AmA1 transcript in S.pombe. (A) Secondary structure prediction of the transcript flanking poly(A) site. The AmA1 sequence spanning 1–464 nt was analyzed using the RNA-fold program. Only structures of stem–loops predicted in the region are shown. (B) RT–PCR analysis with different reverse primers in the stem–loop region. Electrophoretic separation of RT–PCR products generated after 20, 25 and 30 PCR cycles from RNA isolated from S.pombe cells transformed with pRAG. The reactions were carried with 1 µg of RNA using end-labeled F51 forward primer and one of the four reverse primers R261, R316, R370 and R680. The amplified products of the 25-cycle category were excised and radioactivity (Cerenkov count) was determined and represented graphically in the bottom panel. (C) In vitro transcription termination competition assay using T3 RNA polymerase (Life Technologies) from NdeI-linearized pSBNd4.3 in the presence of different primers (the primer quantities are indicated above the tracks) using [α32-P]UTP. The reactions were analyzed on denaturing polyacrylamide gel. The relative positions of the antisense primers used in the competition assay with respect to the RNA secondary structure are shown.
A structural analysis of the RNA sequence between 213 and 589 nt using the RNA-fold program (25) indicated three stem–loop structures tandemly arranged in between 245 and 367 nt of the AmA1 gene (Fig. 8A). The presence of these secondary structures in the region could probably play an important role in the 3′-end processing event. To substantiate this hypothesis, an in vitro transcription competition assay was carried out, wherein release of RNA from transcribing complexes upon challenging with oligonucleotides was measured. When a transcribing bacterial RNA polymerase (T3/T7 or SP6 RNA polymerase) encounters a secondary structure in the transcribed RNA, transcription termination takes place and RNA polymerase falls off releasing the transcript. If a secondary structure formation is counteracted by an oligonucleotide complementary to the RNA sequence, RNA polymerase should produce more ‘run off’ transcripts. The results indicated a maximum level of read-through transcript in the case of challenge with R316 in a concentration-dependent manner (Fig. 8C), indicating the presence of a secondary structure in the region, as was predicted by computational analysis.
DISCUSSION
The results in this paper define a novel terminator sequence in the 5′-intronic region of a seed storage protein gene AmA1 which functions as a transcriptional terminator in S.pombe. Our evidence for the existence of this sequence is both through in vitro RNA analyses and direct analysis of nascent RNA transcription. However, this transcriptional control region is otherwise inactive in its native system probably due to efficient RNA splicing of the AmA1 gene. We have also demonstrated that when this sequence is placed within a functional gene, the combinatorial effect of signal sequences causes premature termination of RNA transcription.
Our aim, primarily, was to investigate whether a plant intron is efficiently spliced out in S.pombe. Surprisingly, we observed that premature termination by an AmA1 intronic sequence is a predominant event rather than splicing. Thus, the investigation was focused on mapping and identifying sites of transcription termination and the signals required for the process. Moreover, it was of interest to map different cis-elements within this terminator region and to consider their role in premature termination in a heterologous system. Poly(A) site mapping of AmA1 transcript in its native system revealed a sequence 5′-CA-3′ as the polyadenylation site at position 2607 nt with ATG at position +1. However, the poly(A) site of the prematurely terminated transcript in S.pombe revealed 5′-TA-3′ dinucleotide but at a different position, 299–300 nt, to the poly(A) site. This is consistent with the invariable 5′-Y(A)n-3′ configuration of the poly(A) site often located between 10 and 30 nt downstream of the polyadenylation signal in eukaryotes. An inspection of the sequence revealed the eukaryotic polyadenylation consensus sequence AAUAAA at 98 and 25 nt upstream to the mapped poly(A) sites, which could be the putative signals for polyadenylation in amaranth and probable SDE in S.pombe, respectively. Previous studies on nmt1, nmt2 and ura4 genes in S.pombe showed the presence of an A-rich sequence as candidate SDEs located upstream of the poly(A) sites (4,7). Indeed, in this study, a read-through phenomenon from mutational analysis effectively entailed that AAUAAA located at 273–278 nt functions in S.pombe as its equivalent SDE.
A study of polyadenylation detected three different polyadenylated transcripts of the AmA1 gene in S.pombe (Fig. 3C). We find that the major polyadenylated transcript was detectable at significant levels immediately following the poly(A) site at 299 nt. However, the extent of polyadenylated transcript past the gene’s poly(A) site was found up to 165 nt downstream beyond which no polyadenylated transcript was detectable. The equivalent cis-elements for the minor polyadenylation event in all probability might fall at ∼464 nt. There might be different poly(A) sites involved in the species diversity of the terminated transcripts which were recognized in S.pombe. It can be argued that there may be more than one polyadenylated signal clustered around this sequence which gets more activated in the dysfunction of the first signal. These findings seem to be analogous to that in S.cerevisiae where multiple positioning elements (8,26,27) or SDE in S.pombe (7) are found directing cleavage at several clustered sites 15–30 nt downstream.
It was quite clear that on the putative SDE mutation, the amount of read-through transcripts increased in the case of pRABB and pRABN (Fig. 4A and C). The semi-quantitative RT–PCR analysis on read-through products detected transcripts extended up to 680 nt, though northern hybridization demonstrated the size of the transcripts not beyond ∼600 nt (Fig. 3B). Thus, the transcripts must not have been cleaved at the poly(A) site(s) immediately as was detected in the downstream, suggesting that there is a kinetic lag between transcription over the poly(A) signal and its effect on transcription termination. A kinetic lag seems to be essential for a fruitful interaction between factors involved in the cleavage at the poly(A) site and the polymerase.
Signal intensity measurement equivalent to the RT–PCR amplification, which is proportional to the amount of transcripts, revealed that the 3′ ends of the primary transcripts were heterogeneous and amounts varied appreciably (Fig. 5B and C). However, detection of the precise site(s) of transcription termination using RT–PCR may not be possible as it is basically a steady state transcript analysis and the products are highly unstable. Thus, a more sensitive TRO assay was employed that revealed polymerase density over a large span of the AmA1 gene downstream to the poly(A) site. The high polymerase density observed over the intronic regions of the AmA1 gene is indicative of transcriptional pausing over those sequences that some of them might act as DSEs (Fig. 6B and E). Delineation of the probes which yielded high intensity signals to the DNA sequences they cover points out two distinct regions, one spanning from 338 to 589 and the other from 589 to 949, while the third indicated the region 424–637, which overlaps with both. Furthermore, deletion analyses proved the ability of these regions to promote 3′-end processing at upstream signals suggesting their role as DSEs, as has been shown in two S.pombe genes, ura4 and nmt2 (7,4). Nevertheless, the results altogether suggest that the DSE does not mediate polyadenylation or transcription termination in isolation, but acts in concert with an upstream 3′-end processing signal of AmA1 gene. Probably interplay between multiple factors and sequence elements is involved in this premature termination process. A working model for transcription termination of the AmA1 gene in S.pombe has been proposed to fit the observations (Fig. 9). Computational analysis of the 3′ ends of the AmA1 transcript in S.pombe did not show any sequence homology with the host’s native genes reported so far. The S.pombe polyadenylation signals are often degenerate and redundant but they still direct a 3′-end processing event in which the primary transcript is cleaved and then a poly(A) tail is added to the 3′-end product (7).
Figure 9.
Modular architecture for the mechanism of 3′-end formation of the AmA1 gene in S.pombe. The diagram depicts a general architecture of poly(A) signals and terminator in S.pombe (A) and positions of various cis-elements responsible for the premature termination of AmA1 transcript in S.pombe (B). The clevage/polyadenylation site is indicated by an arrowhead. The drawing is not to scale.
It has been demonstrated that S.cerevisiae poly(A) signals function in S.pombe while mammalian poly(A) signals do not. However, the bipartite arrangement of the SDEs and EEs in S.pombe is very reminiscent of mammalian poly(A) signals and is necessary for efficient 3′-end processing (7,9,27). The modular architecture of the plant poly(A) signal, which comprises a NUE and far upstream element, closely resembles that of yeast (6,28). Keeping in view that the AmA1 sequence spanning 261–589 nt was, per se, sufficient for premature termination event, a functional analysis was performed. Indeed, a complete premature termination was observed when this sequence was placed within a functional gene indicating its predominant nature over the nmt1 terminator. The results unequivocally demonstrate the effectiveness of this sequence, which could be used as a potent transcriptional terminator in S.pombe.
It is quite evident that the terminator sequence in the AmA1 intron comprises all the cis-elements such as SDE, poly(A) site and DSE required for 3′-end processing and transcription termination in S.pombe. The AmA1 gene did not bring forth splicing in S.pombe, probably because the splicing machinery could not recognize properly the cis-elements present in it. In this study, polyadenylations within the AmA1 intron out-competed splicing, while in amaranth, splicing scored its due precedence out-competing the polyadenylation event.
Acknowledgments
ACKNOWLEDGEMENTS
The authors thank Dr K. Natarajan for critical reading of the manuscript. This work was supported by a grant from the Department of Biotechnology, Ministry of Science and Technology, Government of India.
DDBJ/EMBL/GenBank accession no. AF491291
REFERENCES
- 1.Bauren G., Belikov,S.A. and Wieslander,L. (1998) Transcription termination in the Balbiani ring 1 gene is closely coupled to 3′-end formation and excision of the 3′ terminal intron. Genes Dev., 12, 2759–2769. [DOI] [PMC free article] [PubMed] [Google Scholar]
- 2.Birse C.E., Minvielle-Sebastia,L., Lee,B.A., Keller,W. and Proudfoot,N.J. (1998) Coupling termination of transcription to messenger RNA maturation in yeast. Science, 280, 298–301. [DOI] [PubMed] [Google Scholar]
- 3.Greger I.H., Demarchi,F., Giacca,M. and Proudfoot,N.J. (1998) Transcriptional interference perturbs the binding of Sp1 to the HIV-1 promoter. Nucleic Acids Res., 26, 1294–1300. [DOI] [PMC free article] [PubMed] [Google Scholar]
- 4.Hansen K., Birse,C.E. and Proudfoot,N.J. (1998) Nascent transcription from the nmt1 and nmt2 genes of Schizosaccharomyces pombe overlaps neighbouring genes. EMBO J., 17, 3066–3077. [DOI] [PMC free article] [PubMed] [Google Scholar]
- 5.Logan J., Flack-Pederson,E., Darnell,J.E. and Shenk,T. (1987) A poly(A) addition site and a downstream termination region are required for efficient cessation of transcription by RNA polymerase II in the mouse β-globin gene. Proc. Natl Acad. Sci. USA, 84, 8306–8310. [DOI] [PMC free article] [PubMed] [Google Scholar]
- 6.Mogen B.D., MacDonald,M.H., Graybosch,R. and Hunt,A.G. (1990) Upstream sequences other than AAUAAA are required for efficient messenger RNA 3′-end processing in plants. Plant Cell, 2, 1261–1272. [DOI] [PMC free article] [PubMed] [Google Scholar]
- 7.Humphrey T., Birse,C.E. and Proudfoot,N.J. (1994) RNA 3′ end signals of the S. pombe ura4 gene comprise a site determining and efficiency elemnet. EMBO J., 13, 2441–2451. [DOI] [PMC free article] [PubMed] [Google Scholar]
- 8.Guo Z. and Sherman,F. (1996) 3′-end-forming signals of yeast mRNA. Trends Biochem. Sci., 21, 477–481. [DOI] [PubMed] [Google Scholar]
- 9.Wahle E. and Keller,W. (1996) The biochemistry of polyadenylation. Trends Biochem. Sci., 21, 247–250. [PubMed] [Google Scholar]
- 10.Whitelaw E. and Proudfoot,N.J. (1986) α-Thalassaemia caused by a poly(A) site mutation reveals that transcriptional termination is linked to 3′-end processing in the human α2 globin gene. EMBO J., 5, 2915–2922. [DOI] [PMC free article] [PubMed] [Google Scholar]
- 11.Connelly S. and Manley,J.L. (1988) A functional mRNA polyadenyaltion signal is required for transcription termination by RNA polymerase II. Genes Dev., 2, 440–452. [DOI] [PubMed] [Google Scholar]
- 12.Edwalds-Gilbert G., Prescott,J. and Falck-Pedersen,E. (1993) 3′ RNA processing efficiency plays a primary role in generating termination-competent RNA polymerase II elongation complexes. Mol. Cell. Biol., 13, 3472–3480. [DOI] [PMC free article] [PubMed] [Google Scholar]
- 13.Birse C.E., Lee,B.A., Hansen,K. and Proudfoot,N.J. (1997) Transcription termination signals for RNA polymerase II in fission yeast. EMBO J., 16, 3633–3643. [DOI] [PMC free article] [PubMed] [Google Scholar]
- 14.Aranda A. and Proudfoot,N.J. (1999) Definition of transcriptional pause elements in fission yeast. Mol. Cell. Biol., 19, 1251–1261. [DOI] [PMC free article] [PubMed] [Google Scholar]
- 15.Sanfanco H., Brodmann,P. and Hohn,T. (1991) A dissection of the cauliflower mosaic virus polyadenylation signal. Genes Dev., 5, 141–149. [DOI] [PubMed] [Google Scholar]
- 16.Joshi C.P. (1987) Putative polyadenylation signals in nuclear genes of higher plants: a compilation and analysis. Nucleic Acids Res., 15, 9627–9640. [DOI] [PMC free article] [PubMed] [Google Scholar]
- 17.Wickens M. (1990) How the messenger got its tail: addition of poly(A) in the nucleus. Trends Biochem. Sci., 15, 277–281. [DOI] [PubMed] [Google Scholar]
- 18.Datta A., Raina,A. and Biswas,S. (1997) U.S. Patent 5,670,635.
- 19.Russo P., Li,W.Z., Hampsey,D.M., Zaret,K.S. and Sherman,F. (1991) Distinct cis-acting signals enhance 3′ endpoint formation of CYC1 mRNA in the yeast Saccharomyces cerevisiae. EMBO J., 10, 563–571. [DOI] [PMC free article] [PubMed] [Google Scholar]
- 20.Zaret K.S. and Sherman,F. (1982) DNA sequence required for efficient transcription termination in yeast. Cell, 28, 563–573. [DOI] [PubMed] [Google Scholar]
- 21.Alfa C., Fantes,P., Hyams,J., McLeod,M. and Warbick,E. (1993) Experiments with Fission Yeast: A Laboratory Course Manual. Cold Spring Harbor Laboratory Press, Cold Spring Harbor, NY.
- 22.Rose M.D., Wiston,F. and Hieter,P. (1990) Methods in Yeast Genetics—A Laboratory Course Manual. Cold Spring Harbor Laboratory Press, Cold Spring Harbor, NY.
- 23.Raina A. and Datta,A. (1992) Molecular cloning of a gene encoding seed specific protein with nutritionally balanced amino acid composition from Amaranthus. Proc. Natl Acad. Sci. USA, 89, 11774–11778. [DOI] [PMC free article] [PubMed] [Google Scholar]
- 24.Maundrell K. (1990) nmt1 of fission yeast: a highly transcribed gene completely repressed by thiamine. J. Biol. Chem., 265, 10857–10864. [PubMed] [Google Scholar]
- 25.Walter A.E., Turner,D.H., Kim,J., Lyttle,M.H., Muller,P., Mathews,D.H. and Zuker,M. (1994) Coaxial stacking of helixes enhances binding of oligoribonucleotides and improves predictions of RNA folding. Proc. Natl Acad. Sci. USA, 91, 9218–9222. [DOI] [PMC free article] [PubMed] [Google Scholar]
- 26.Heidmann S., Obermaier,B., Vogel,K. and Domdey,H. (1992) Identification of pre-mRNA polyadenyaltion sites in Saccharomyces cerevisiae. Mol. Cell. Biol., 12, 4215–4229. [DOI] [PMC free article] [PubMed] [Google Scholar]
- 27.Guo Z. and Sherman,F. (1995) 3′-end forming signals of yeast mRNA. Mol. Cell. Biol., 5, 5983–5990. [DOI] [PMC free article] [PubMed] [Google Scholar]
- 28.Mogen B.D., MacDonald,M.H., Leggewie,G. and Hunt,A.G. (1992) Several distinct types of sequence elements are required for efficient mRNA 3′ end formation in a pea rbcS gene. Mol. Cell. Biol., 12, 5406–5414. [DOI] [PMC free article] [PubMed] [Google Scholar]


