Abstract
Temperature is a critical factor affecting the matric suction of unsaturated soils. This study employed a simple and time-saving method to investigate the influences of temperature and moisture content on the temperature dependence of matric suction in loess and sand soils. Based on experimental data, the fitting performance of three data-fitting models-Brooks-Corey, van Genuchten, and Fredlund-Xing -was evaluated at temperatures above 0 °C. The results indicated that matric suction decreased as temperature increased. The variation of matric suction with temperature was categorized into the maximum value range (RMax), the highly temperature sensitive range (RTS) and the weak temperature sensitive range (RTW). Additionally, RMax and RTW were observed to decrease and increase, respectively, as moisture content increased. Above 0 °C, the sensitivity of matric suction to temperature decreased with increasing moisture content, while below 0 °C, temperature sensitivity increased as moisture content increased. Furthermore, the matric suction of loess showed greater sensitivity to temperature changes than that of sand. The van Genuchten model outperformed the other models at temperatures above 0 °C. This study provides experimental evidence for a deeper understanding of the impact of temperature changes on matric suction.
Keywords: Unsaturated soils, Matric suction, Temperature, Moisture content, Van Genuchten model
Subject terms: Environmental impact, Hydrology, Civil engineering
Introduction
Matric suction is a key property of unsaturated soils, representing their ability to retain water. Its significance extends across various applications, such as soil water retention, water transport, slope stability analysis, and foundation bearing capacity evaluation1–4. Studies have shown that temperature is a critical environmental factor affecting the matric suction of unsaturated soils5,6. Variations in soil temperature change its matric suction and potentially impacting its mechanical properties7,8. Uchaipichat9 emphasized that temperature effect should be considered when solving engineering problems related to matric suction. Therefore, it is necessary to investigate the effect of temperature on the matric suction.
Scholars have conducted a series of research to examine the effect of temperature on the soil matric suction, and indicated that the impact of temperature on matric suction of unsaturated soils was not uniform and could vary significantly across different temperature ranges10–15. However, most studies on this topic focused on narrow temperature bands, limiting the generalizability of their findings. Notably, there is a lack of research within the temperature range of 0 °C to 20 °C, which is commonly encountered in soils for civil engineering and agricultural engineering worldwide. To address this gap, this paper intends to explore how temperature affects the matric suction of unsaturated soils over a wide range of temperatures. Furthermore, the influence of temperature on the matric suction of unsaturated soils may depend on the initial moisture content of the soil. There is ongoing debate and variability in research findings regarding whether temperature has a more pronounced effect on the matric suction of unsaturated soils at low moisture content or at high moisture content16–23. Given these complexities, it is crucial to conduct further research to clarify the temperature-moisture interactions on matric suction of unsaturated soils across different moisture content conditions.
The indoor measurement, like filter paper method, steam equilibrium method and so on, is typically used for obtaining the matric suction of unsaturated soils. However, most of these methods require testing at room temperature (approximately 20 °C), which restricts their applicability under varying temperature conditions. Besides, these methods are cumbersome to measure and require a long time to reach equilibrium. To address this issue, this study proposes the water potential method for measuring matric suction at different temperatures. This method primarily uses the water potential sensor (EROS21), which has a wide measurement range, a relatively short equilibrium time, and operates within the temperature range of -40 °C to 60 °C. As a result, it is easy to operate and time-efficient, suitable for various temperature conditions. The validity of this method will be verified through comparison with the pressure plate method. In view of these facts, this study investigates the effects of temperature and moisture content on the temperature dependence of matric suction in loess and sand soils, especially within the temperature range of 0 °C to 20 °C. Experiments are conducted over a broader temperature range of -20 °C to 45 °C using the water potential method, which is both easy to operate and time-efficient. The study further explores the mechanism of the influence of temperature, soil type, and moisture content on the temperature dependence of matric suction. Additionally, it evaluates the fitting performance of mathematical models for soil-water characteristic curves (SWCCs) at varying temperatures.
Materials and methods
Materials
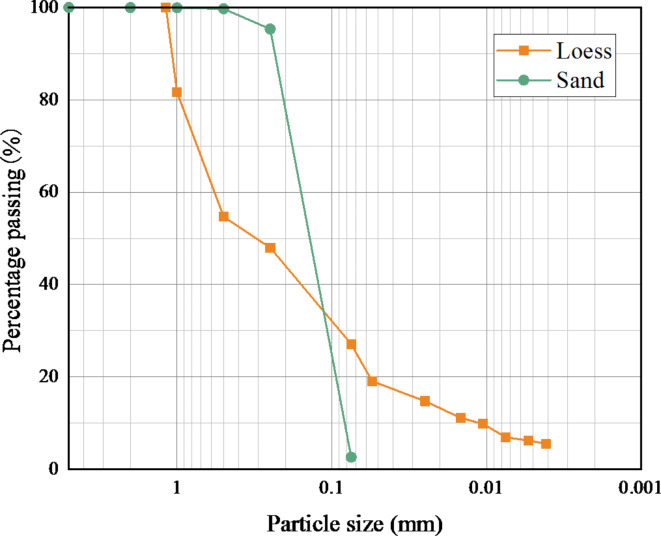
The soils investigated in the present study were loess and sand sourced from Northwest China. Table 1 summarizes the fundamental physical and minerals components of the soils, including specific gravity (Gs), optimum moisture content (wopt), maximum dry density (ρdmax), liquid limit (wL), plastic limit (wP), plasticity index (PI), and primary mineralogical compositions. The gradation curves are illustrated in Fig. 1.
Table 1.
Physical and chemical properties of the soil.
| Soil type | Gs | wopt (%) | ρdmax (g/cm3) | wL (%) | wP (%) | PI (%) | Dominant minerals |
|---|---|---|---|---|---|---|---|
| Loess | 2.71 | 14.1 | 1.8 | 30.5 | 17.69 | 12.81 | Quartz (44.7%), Anorthite (30%), Calcite (17.4%), Illite (7%) |
| Sand | 2.66 | 9 | 1.9 | - | - | - | Quartz (36.9%), Albite (58.4%) |
Fig. 1.
The gradation curves of the test soils.
Water potential method
Experimental apparatus
Due to the limitations of traditional methods for measuring soil matric suction, which are unsuitable under varying temperature conditions, this paper proposed a novel experimental approach-the water potential method-for assessing soil matric suction across different temperatures.
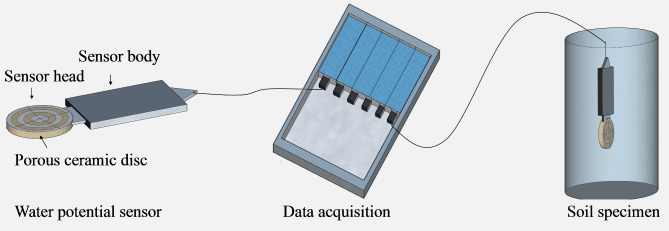
The experimental setup employed in this study comprises four components: a water potential sensor, a data acquisition system, and a high and low temperature test box. The water potential sensor used in this study is TEROS21, depicted in Fig. 2. This sensor first measures soil moisture content via its built-in sensor, subsequently converts the data into soil matric suction values using a porous ceramic disc. It operates within a temperature range of -40 to 60 °C, offering an extensive measuring range (9-100006 kPa) with high accuracy (1 kPa). Additionally, the water potential sensor includes an integrated thermistor to simultaneously measure soil temperature, with a range of -40 °C to 60 °C and an accuracy of ± 1 °C. Importantly, it reaches equilibrium in just 60 min, significantly faster than traditional methods. The data acquisition system employed in this study is the Em50, manufactured by METER, USA (Fig. 2). This system is highly adaptable to environmental conditions, operating effectively within a temperature range of -40 °C to 60 °C and a relative humidity range from 0 to 100% RH. It is important to note that when the temperature drops below 0 °C, soil water freezes, altering the dielectric constant of water and introducing significant errors in the measurement of matric suction during freezing. Despite this, trends in matric suction can still be analyzed using the data collected. Therefore, in this study, we focused solely on analyzing matric suction trends at temperatures below 0 °C to provide valuable insights.
Fig. 2.
The experimental apparatus for the soil matric suction.
Experimental scheme
The experimental temperature range selected for this study was − 20 °C to 45 °C. This temperature range included the temperatures experienced by the soil in northwest China (as shown in Table 2). The study investigated the influences of temperature and moisture content on the matric suction of unsaturated soil by examining groups A and B separately. Additionally, the effect of soil type on the temperature dependence of matric suction was explored through a comparative analysis of groups A and B. To ensure the reliability of the test results, six parallel specimens were prepared for each moisture content (mass moisture content) listed in Table 2: three specimens for testing at temperatures above 20 °C and three for testing at temperatures below 20 °C.
Table 2.
Experimental scheme.
| Group | Soil type | Moisture content (%) | Temperature (°C) |
|---|---|---|---|
| A | Loess | 2, 4, 5, 7, 9, 10, 15, 18, 20, 25, 26, 30 | -20, -15, -10, -5, -1, 0, 5, 10, 15, 20, 25, 30, 40, 45 |
| B | Sand | 1, 2, 3, 4, 5, 6, 7, 8, 9, 10, 15, 18 | -20, -15, -10, -5, -1, 0, 5, 10, 15, 20, 25, 30, 40, 45 |
Test procedure
The experimental methods were as follows:
Soil sample preparation
Loess samples with moisture contents of 2%, 4%, 5%, 7%, 9%, 10%, 15%, 18%, 20%, 25%, 26%, and 30% were prepared, along with sand samples having moisture contents of 1%, 2%, 3%, 4%, 5%, 6%, 7%, 8%, 9%, 10%, 15%, and 18%. The soil samples were then placed in sealed containers for 24 h to ensure uniform moisture distribution24. Subsequently, the actual moisture contents of the prepared samples were measured using the microwave oven heating method25.
Specimen preparation
The prepared soil samples were filled layer by layer into the containers (diameter of 100 mm, height of190 mm) and compacted with a compaction degree of 93%. During the filling process, quality control methods were employed to ensure that the desired compaction degree is achieved. The quality of each soil layer was calculated according to Eq. (1). Additionally, to ensure uniform compaction, the thickness of each soil layer should not exceed 5 cm.
 |
1 |
where, M represents the mass of soil required for each layer (g/cm³); r is the radius of the container (cm); ρdmax is the maximum dry density (g/cm³) of the filled soil; γ denotes the compaction degree, with a value of 93% used in this experiment; h is the thickness of each soil layer (cm); and w is the moisture content (%) of the filled soil.
The water potential sensor was then inserted into the soil column at a distance of 50 mm from the top. It was recommended in the sensor manual that before burying the sensor, it was best to wet the sensor with undisturbed soil and wrap it in a spherical shape to ensure that the test soil was in contact with the ceramic disk, and then placed it at the intended measurement location. Subsequently, the specimen should be promptly and securely sealed to prevent any water and vapor exchange between the specimen and the external environment. For reference, a visual representation of the prepared specimen can be observed in Fig. 3.
Fig. 3.
Test procedure.
Temperature control of prepared specimens
The prepared specimens were placed in a high and low temperature test box to regulate the soil temperature, as illustrated in Fig. 3. To measure the matric suction of the specimens under various temperature conditions, the high and low temperature test box was set to the experimental temperatures listed in Table 2. For temperatures above 20 °C, a stepwise heating method was employed to reach the desired experimental temperature. For temperatures below 20 °C, a stepwise cooling method was used to achieve the corresponding test temperature.
Data acquisition
Upon reaching the predetermined temperature, the soil was allowed to stabilize for a minimum of 2 h to ensure consistent temperature distribution throughout. Subsequently, the data acquisition system collected the matric suction data at the specific temperature. This process was repeated to gather data at various temperatures.
Pressure plate method
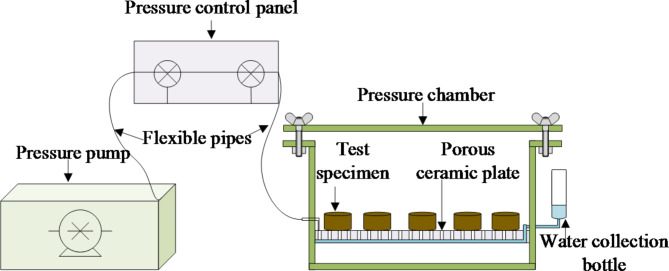
This paper compared experimental results obtained using Pressure plate method (see Fig. 4) at room temperature with those obtained using the water potential method, aiming to validate the reliability of the employed method.
Fig. 4.
Pressure plate method.
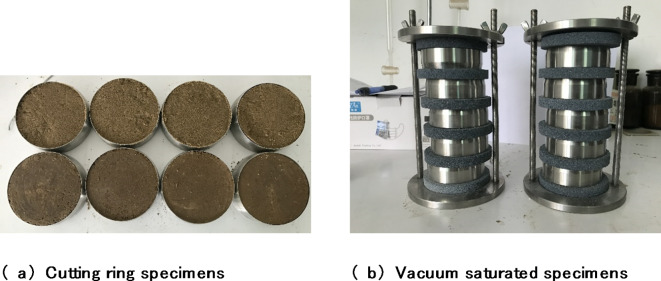
Initially, sand and loess specimens measuring 1 cm in height and 2 cm in inner diameter were prepared, as depicted in Fig. 5. For experimental accuracy, four parallel specimens of each soil type were prepared and installed on a vacuum saturator (Fig. 5). The testing procedures followed ASTM C1699-0926.
Fig. 5.
Test specimens.
Results and analysis
Comparison of water potential method and pressure plate methods
It should be pointed out that the actual measured soil moisture content was slightly different from the preset one, as shown in Table 3.
Table 3.
Comparison between the actual measured soil moisture content and the preset one.
| (Loess) Preset value (%) | 2 | 4 | 5 | 7 | 9 | 10 | 15 | 18 | 20 | 25 | 26 | 30 |
|---|---|---|---|---|---|---|---|---|---|---|---|---|
| (Loess) Measured value (%) | 3 | 4.2 | 6 | 6.6 | 10 | 11 | 15.6 | 19.1 | 20.3 | 25.1 | 25.6 | 28.6 |
| (Sand) Preset value (%) | 1 | 2 | 3 | 4 | 5 | 6 | 7 | 8 | 9 | 10 | 15 | 18 |
| (Sand) Measured value (%) | 0.5 | 2.33 | 2.7 | 3.5 | 4.5 | 5.9 | 6.7 | 7.5 | 8.8 | 10.4 | 14.4 | 18.8 |
Figure 6 illustrates that the matric suction data measured by both the pressure plate method and the water potential method are closely aligned. The discrepancy between the two results may be attributed to the occurrence of hysteresis. The pressure plate method involved a drying (desorption or desaturation) process, where the specimens were first fully saturated under vacuum, then subjected to a predetermined pressure. Water was then expelled from the specimens until equilibrium was reached, and the moisture content was calculated at this pressure. In contrast, the water potential method directly measured the matric suction of a sample at a specific moisture content, resembling the wetting process. This difference likely caused the hysteresis phenomenon27, leading to slight variations in the matric suction data obtained by the two methods. In addition, the limitation of the minimum range of the water potential meter is also the reason for the difference in the results of the two tests. Compared to the pressure plate method, the TEROS 21 water potential sensor demonstrated superior effectiveness in measuring matric suction in the high suction range of the experimental soils, providing a broader measurement capability. Thus, the method proposed in this paper for testing soil matric suction proved to be reliable.
Fig. 6.
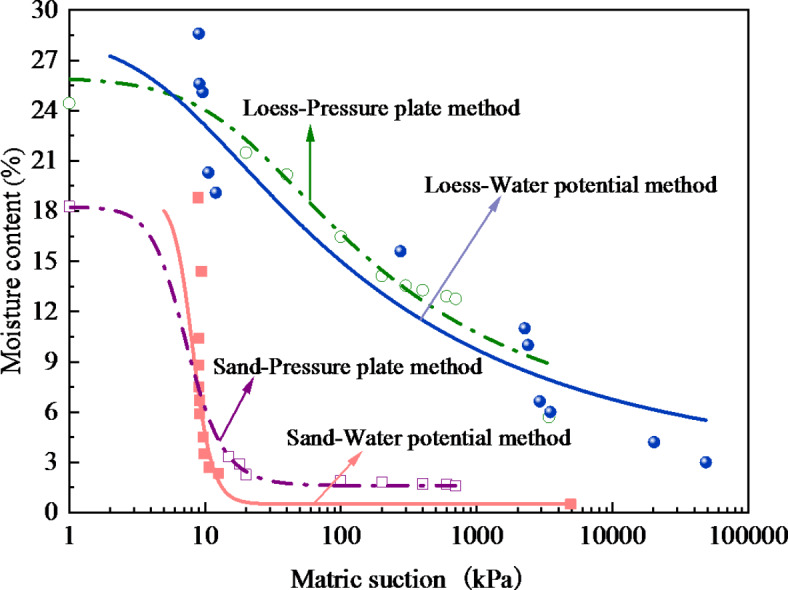
Comparison of two test methods at 20 °C.
The variation in soil matric suction with changing temperatures
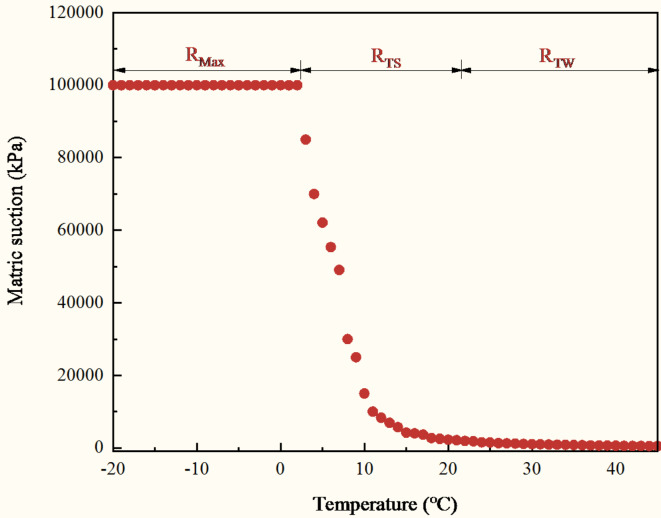
Soil matric suction at different temperatures for loess with 10% moisture content is presented in Fig. 7. It is important to note that the water potential sensor has a maximum measurement range of 100,006 kPa. Hence, the maximum measured matric suction in this experiment was 100,006 kPa.
Fig. 7.
Soil matric suction at different temperatures for loess with 10% moisture content.
Figure 7 illustrates that matric suction varies at different temperatures with the same initial moisture content. At -20 °C, soil matric suction was 100,006 kPa, whereas at 45 °C, it decreased to 557 kPa, representing a nearly 180-fold difference between the two temperatures. Soil temperature significantly influenced soil matric suction, with matric suction decreasing as temperature increased. These findings aligned well with previous studies10,11,28,29. Hence, using soil matric suction values obtained at room temperature to make generalizations across all conditions is not advisable.
Here, the concept of critical temperature (Tcr) was defined. At Tcr, soil matric suction reached the water potential sensor’s maximum range of 100,006 kPa and remained constant as temperature decreased. For instance, for soil with 10% moisture content, Tcr was 3.9 °C (Fig. 7). Figure 7 shows the curve divided into three segments: a flat section parallel to the X-axis, a steep curve, and a gentle curve, highlighting distinct variations in soil water retention behavior with temperature. Thus, variations in soil matric suction with temperature were categorized into the maximum value range (RMax), the highly temperature-sensitive range (RTS), and the weak temperature-sensitive range (RTW). At RMax, the soil matric suction reached the maximum measuring range (100006 kPa) of the water potential sensor and maintained this value. At RTS, temperature significantly influenced soil matric suction, whereas at RTW, temperature showed negligible impact on matric suction.
For soil with 10% moisture content, RTS occurred between 3.9 °C and 20 °C, with soil matric suction decreasing rapidly at a rate of 6063 kPa/°C. Between 20 °C and 45 °C (RTS), matric suction decreased at a slower rate of 73 kPa/°C. Specifically, temperatures above 35 °C had a negligible impact on soil matric suction. Thus, low temperatures appeared to exert a more pronounced influence on soil matric suction. This finding was consistent with the observation by Tan et al.30 that above-room temperatures reduced the disparity in unsaturated soil suction across temperature variations.
Variations in the relationship between matric suction and temperature across varying moisture contents for loess
Variation of matric suction with temperature across different moisture contents
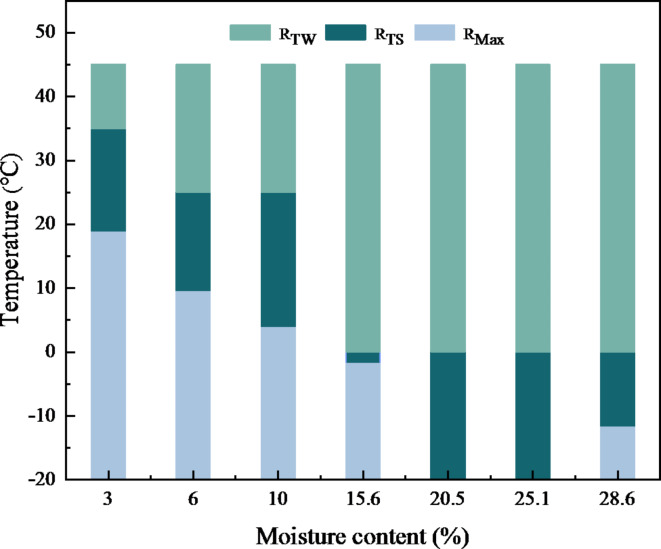
Figure 8 illustrates the variation of matric suction with temperature across different moisture contents. The curves shown in Fig. 8 can be categorized into three regions: RMax, RTS and RTW. Additionally, temperatures exceeding Tcr caused an exponential decrease in matric suction across all moisture contents. Nevertheless, significant differences in the matric suction-temperature relationship were observed under different moisture content conditions. The range of variation in soil matric suction with temperature for different moisture contents was plotted in Fig. 9.
Fig. 8.
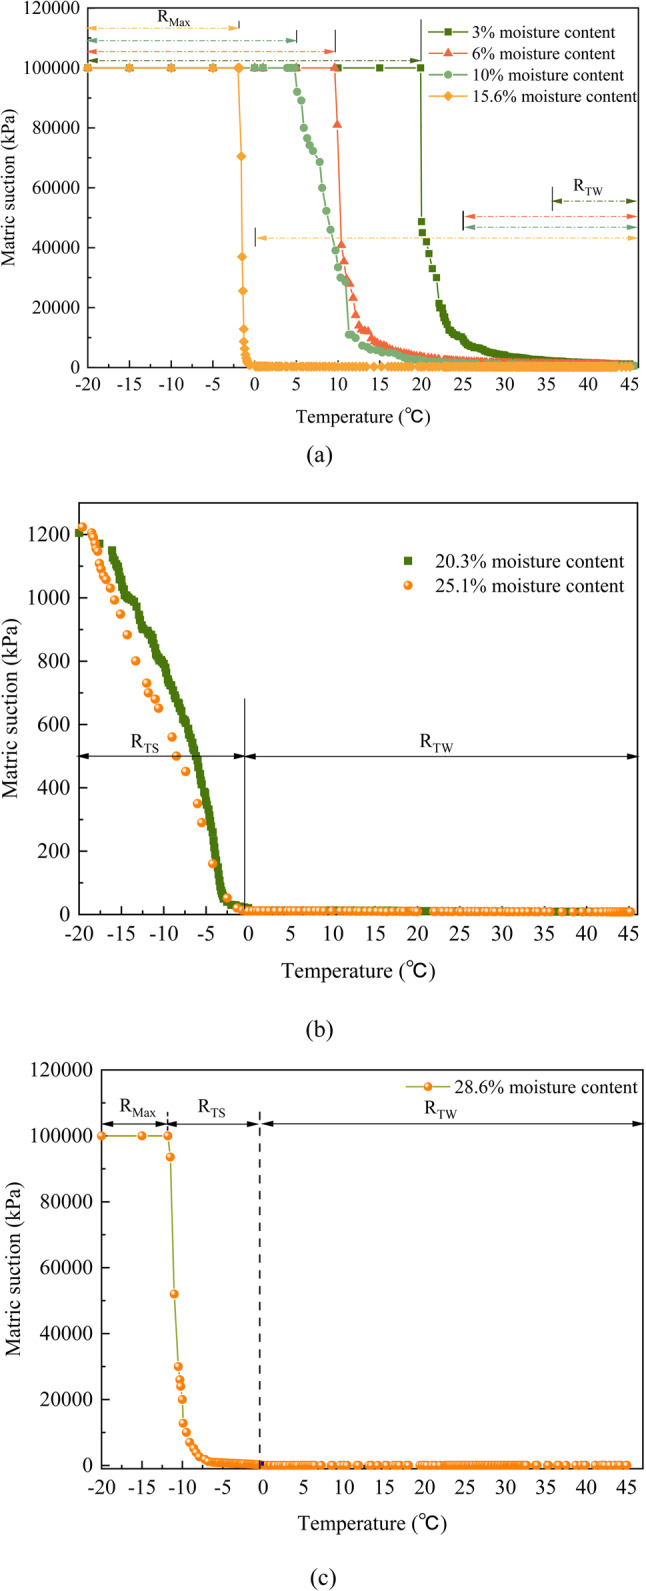
Variations of matric suction with temperature under different moisture content (Loess).
Fig. 9.
Soil matric suction variation interval for different moisture content.
Figure 9 illustrates that at 3% soil moisture content, Tcr is 19 °C, with RMax ranging from − 20 °C to 19 °C. As moisture content increased, Tcr gradually decreased, leading to a reduction in RMax. At 20.3% soil moisture content (see Fig. 8), soil matric suction reached a peak of 1204 kPa at the lowest test temperature of -20 °C, which was significantly below the sensor’s maximum measurement capacity. Consequently, no discernible RMax was observed for soils with 20.3% and 25.1% moisture content. These findings indicated that RMax in unsaturated soils decreased progressively with increasing moisture content. This trend was consistent with the established relationship that increasing moisture content lowered matric suction31.
Conversely, soils with 28.6% moisture content exhibited a Tcr at -12 °C, with RMax ranging between − 12 °C and − 20 °C (Fig. 8). This suggested that at temperatures below 0 °C, matric suction in soils with 28.6% moisture content exceeded that of soils with 25.1% and 20.3% moisture content. This finding appeared contrary to the conventional expectation that matric suction decreased as moisture content increased28,29. This phenomenon can be explained by the freezing of liquid water in the soil at temperatures below 0 °C (Nagare et al.32). As the initial moisture content increased, a greater proportion of liquid water in the soil froze, leading to a reduction in unfrozen moisture content and consequently, an increase in matric suction. In particular, at 28.6% moisture content, the soil became saturated, with a significant amount of free water. Upon reaching freezing temperatures, the free water in the soil froze, resulting in a significant increase in soil matric suction.
Figure 9 further demonstrates the significant influence of moisture content on both RTS and RTW. For instance, at 3% moisture content, RTW ranged from 35 °C to 45 °C, while at 6% and 10%, it spanned 25 °C to 45 °C. At moisture content greater than 15.6%, RTW extended from 1 °C to 45 °C. Consequently, RTW was observed to increase with increasing moisture content.
Variation in the relative decrease rate of matric suction across varying moisture contents
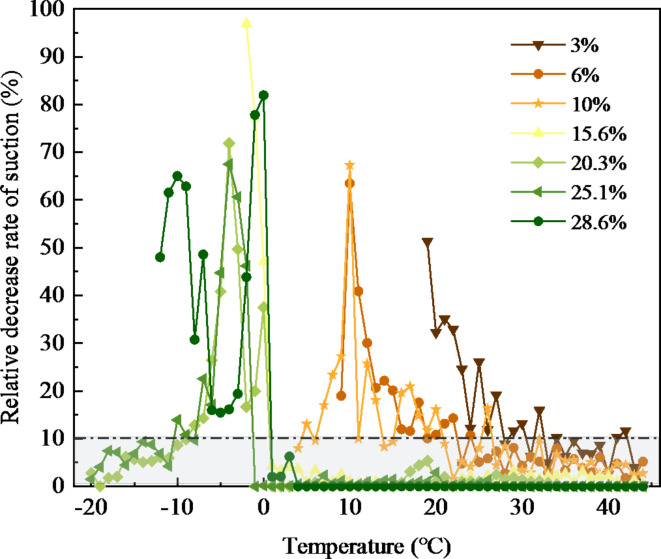
In this study, the rate of change in matric suction for every 1 °C increase in temperature was defined as the relative decrease rate of matric suction (ΔMS), as calculated in Eq. (2). As illustrated in Fig. 10, although matric suction decreased with increasing temperature, the relative decrease rate varied significantly.
 |
2 |
Fig. 10.
ΔMS for different moisture contents.
where, ΔMS the relative decrease rate of matric suction; T(°C) is the temperature; MST is the matric suction (kPa) at T °C; MST+1 is the matric suction (kPa) at (T + 1) °C.
Figure 10 indicates that at low moisture content, temperature significantly influences matric suction. Conversely, for soils with high moisture content (15.6% or higher), ΔMS remained minimal above 0 °C. For instance, at 25 °C, ΔMS decreased from 26.1 to 7.9% as moisture content increased from 3 to 15.6%. Furthermore, for moisture content exceeding 20.3%, ΔMS approaches zero, suggesting temperature had negligible impact on matric suction in high moisture content conditions. Al-Mahbashi et al.33 similarly observed that at high moisture levels, the temperature’s influence remained consistent with findings at room temperature when studying the clay liner retention capacity. Hence, when temperatures exceeded 0 °C, ΔMS decreased progressively with increasing moisture content, indicating that temperature’s impact on matric suction weakened as moisture content increased. Conversely, below 0 °C, ΔMS increased with moisture content due to the freezing of soil water.
Variations in the relationship between matric suction and temperature across varying moisture contents for sand
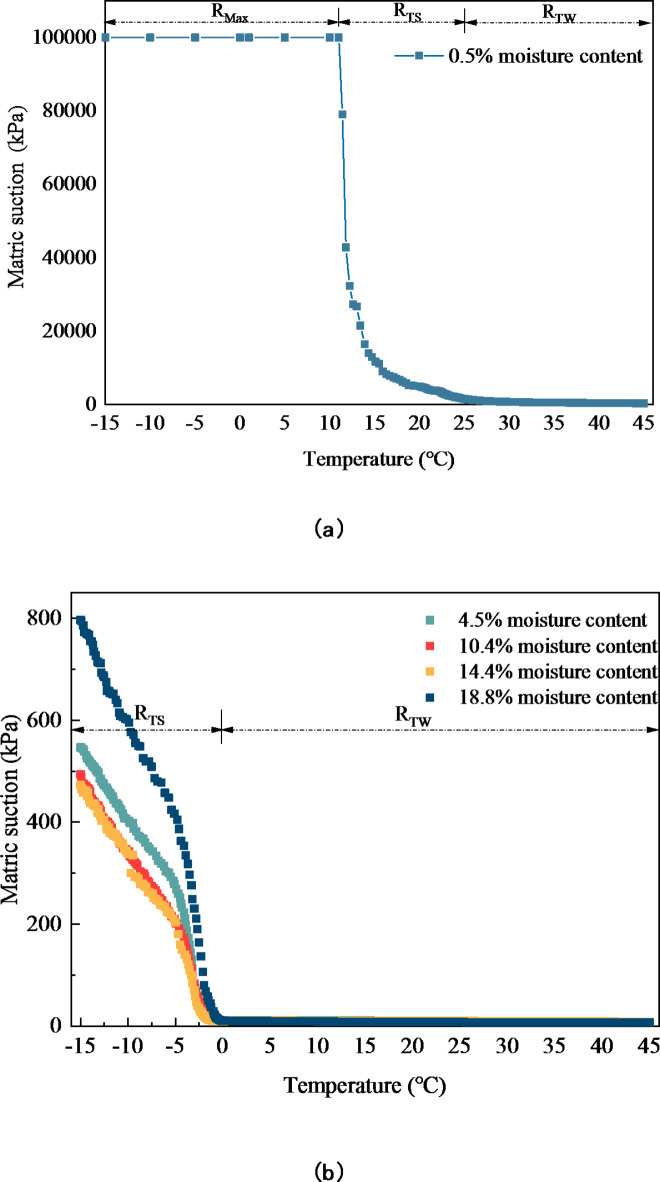
As illustrated in Fig. 11, similar to loess, the matric suction of sand decreases with increasing temperature. It should be noted that due to the 1 kPa accuracy of the sensor used in this study, it may not be able to clearly capture the state of sand matric suction from the saturation zone to the transition zone. However, as this paper focuses only on the variation of sand matric suction with temperatures, the accuracy of the sensor is sufficient for analyzing the trend in the variation of sand matric suction.
Fig. 11.
Variations of matric suction with temperature under different moisture content (Sand).
As shown in Fig. 11, for sand with a moisture content of 0.5%, Tcr was 11 °C. Within the temperature range of 11 °C to 25 °C, the matric suction decreased sharply with rising temperatures, exhibiting a decrease rate of up to 7036 kPa/°C. Beyond 25 °C, the trend of soil matric suction stabilized, with the rate of decrease significantly slowing to 60.7 kPa/°C as temperature increased. These observations indicated that for sand with a moisture content of 0.5%, matric suction was highly sensitive to temperature variations below 25 °C.
For moisture contents ranging from 4.5 to 18.8%, the matric suction of sand decreased with increasing temperature. However, the change was minimal at temperatures above 0 °C, causing the matric suction to approximate a horizontal line as temperature varied. As a result, above 0 °C, temperature had a negligible effect on the matric suction of sand with moisture contents between 4.5% and 18.8%. Zhang et al.12 reached a similar conclusion in their study of the temperature effects on sand mixtures over a range from 20 °C to 60 °C, finding that water holding capacity remained largely unchanged with increasing temperature. However, below 0 °C, the matric suction of sand with moisture contents between 4.5% and 18.8% was significantly affected by temperature. According to Fig. 11b, under negative temperature conditions, the matric suction of sand with a moisture content of 18.8% was higher than that of sand with 4.5% moisture content. This difference was likely due to the fact that at 18.8% moisture content, the sand reached saturation, causing water in the soil to interconnect. As the soil temperature approached freezing, the liquid water within the soil froze, promoting the ice crystal formation. This process significantly reduced the unfrozen water content in the soil. Consequently, this process led to a sharp increase in matric suction. Within the temperature range of -15 °C to 0 °C, the matric suction of sand with moisture contents between 4.5% and 18.8% decreased with increasing temperature, showing decrease rates of 35 kPa/°C, 32 kPa/°C, 31 kPa/°C, and 52 kPa/°C, respectively. This decrease rate was significantly smaller than that of the matric suction of the loess under similar conditions (Fig. 8). Additionally, sand with moisture contents between 4.5% and 18.8% did not reach the maximum matric suction within the testing range, suggesting that, compared to loess, the matric suction of sand was less sensitive to temperature.
Discussions
Mechanisms of temperature effects on the matric suction of unsaturated soils
As shown in Figs. 7, 8 and 11, matric suction generally decreased as temperature increased. Matric suction was commonly described by the balance between the stresses in the fluid phase, capillary forces acting at the interfaces of each phase, and the attraction between water and soil particles34. The temperature dependency of matric suction was primarily due to the temperature dependence of these factors. Research indicated that as temperature increased, surface tension decreased linearly, leading to a decrease in matric suction, a phenomenon that was widely accepted in the literature35. However, Pham et al.,35 pointed out that the main reason for the temperature dependence of matric suction was not the temperature dependence of surface tension, but rather the temperature dependence of the contact angle. When the temperature increased from 20 °C to 200 °C, matric suction decreased by 48.3% considering only the temperature dependence of surface tension. While matric suction decreased by 82.1% when only the temperature dependence of the contact angle was considered. This suggested that the contact angle played a more dominant role than surface tension in explaining the temperature effects on matric suction. It was evident that as the temperature increased, the reduction in matric suction of unsaturated soil was not solely due to the temperature dependence of surface tension.
Furthermore, this study classified the variation of matric suction with temperature into three categories: RMax, RST, and RWT (Fig. 7). In general, when the temperature exceeded 0 °C, the temperature dependence of matric suction decreased as temperature increased (Figs. 8, 10 and 11). Andry et al.36 also demonstrated that the effect of temperature on matric suction was more pronounced when the temperature was below 25 °C. This may be attributed to the influence of water viscosity on soil matric suction (Haridasan & Jensen37), with water viscosity varying more significantly at lower temperatures, thereby amplifying the temperature effect on matric suction at lower temperatures.
Effect of moisture content on the temperature dependence of matric suction
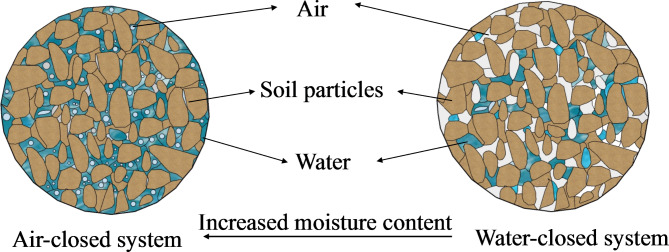
The research presented in this study indicated that when the temperature exceeded 0 °C, the temperature dependence of matric suction decreased as moisture content increased (Figs. 9, 10 and 11). This research result was consistent with the findings of Schneider and Goss38. Salager et al.39 categorized the effect of temperature on matric suction into two components. The first component concerned the temperature dependence of soil matric suction due to the thermal expansion of liquid phase, with this effect being dominant at high moisture content. Especially, when the moisture content approached saturation, the soil system functioned as an air-closed system (Fig. 12). The diameter of water-saturated pores was positively correlated with surface tension and contact angle. As temperature increased, both surface tension and contact angle decreased, leading to a reduction in water-saturated pore size and ultimately lower moisture content40. Furthermore, elevated temperatures cause expansion of closed air bubbles, their volume and expelling pore water, which ultimately reduced pore water content (namely, matric suction)41,42.
Fig. 12.
Soil system.
The second component concerned the temperature dependence of surface tension on matric suction, which became more pronounced as moisture content decreased. However, compared to the contact angle and surface tension, the thermal expansion of water had a lesser effect on matric suction. Consequently, as moisture content decreased, the effect of temperature on matric suction became more significant. Additionally, as moisture content decreased, the adsorbed water film thinned, leading to stronger interactions between water molecules and mineral surfaces. These interactions were more pronounced than those between pure water molecules, explaining why the temperature dependence of unsaturated soil matric suction became increasingly significant as moisture content decreased38. Especially, when the moisture content approached the residual moisture content. the soil system behaved as a closed water system (Fig. 12). Soil matric suction primarily derived from electrostatic attraction between water molecules and soil particle surfaces, which diminished as the distance between them increased43. As soil temperature increased, thermal agitation intensified, causing weakly bound water to detach from soil particles and transition into free water. This led to the expulsion of free water. Moreover, elevated temperatures promote the conversion of adsorbed bound water into free water, further increasing overall water discharge. Liu et al.41 similarly found that at high suction levels, rising temperatures hindered water adsorption and enhanced water desorption processes, thereby reducing water retention capacity.
It is noteworthy that at temperatures below 0 °C, the impact of temperature on soil matric suction became more pronounced with higher moisture content. Below 0 °C, liquid water in soil froze, transitioning from liquid to solid phase, which reduced the unfrozen moisture content and significantly decreased soil particle connectivity. Higher moisture content increased the proportion of liquid water that transitions to ice. At a moisture content of 28.6%, the soil became saturated, forming a closed-air system between soil particles. Upon reaching freezing temperatures, soil experienced a dramatic decrease in unfrozen water content, leading to a notable increase soil matric suction. Wang et al.44 similarly concluded that saturated soil had lower unfrozen moisture content compared to unsaturated soil at the same freezing temperature. Furthermore, lower temperatures corresponded to reduced unfrozen moisture content, which in turn increased matric suction.
Effect of soil type on the temperature dependence of matric suction
By comparing the effects of temperature on the matric suction of loess and sand soils (Figs. 8 and 11), it can be concluded that the temperature dependence of matric suction for loess was greater than that of sand soil. Within the temperature range of -15 °C to 0 °C, the matric suction of sand with 10.4% moisture content decreased with increasing temperature, matric suction decrease rate was 32 kPa/°C (Fig. 11). For loess with 10% moisture content, the matric suction remained at its maximum value (Fig. 7). When the temperature ranged from 20 to 30 °C, the effect of temperature on the matric suction of sandy soil was very small, while the matric suction of loess still decreased at a rate of 123.6 kPa/° C. Similarly, Andry et al.36 studied the effect of various modifiers on the temperature dependence of matric suction for sand, and found that the matric suction of unmodified sand was almost unaffected by temperature changes within the range of 15–25 °C, whereas the addition of modifiers significantly altered the temperature dependence of sand’s matric suction. Similarly, a study by Yang et al.45 suggested that the influence of temperature on the water retention capacity of soil was linked to soil type. This effect was likely due to differences in particle composition and structure. Research indicated that increases in temperature can cause soil particles to expand, leading to a reduction in matric suction. The greater the coefficient of thermal expansion, the more pronounced the effect of temperature on matric suction34. Compared to sand, loess particles were more prone to expansion with rising temperatures, which explained the stronger temperature dependence of matric suction for loess. Additionally, soil particle size and pore structure also affect the temperature dependence of matric suction. This phenomenon may be attributed to the fine granularity of loess particles, which possessed numerous small pores and microporous structures. Loess had numerous small pores and microporous structures. In contrast, sand particles had relatively larger pores and better connectivity. The pore water in loess was more sensitive to volume changes and redistribution due to temperature fluctuations, leading to significant alterations in matric suction. Furthermore, the fine particles in loess had a large surface area, allowing them to adsorb more water and form a thicker adsorption layer. An increase in temperature significantly altered the thickness of this adsorbed water layer, thus influencing the matric suction. Loess also contained higher concentrations of clay minerals, such as illite, which exhibited strong water adsorption capability and high temperature sensitivity. Temperature fluctuations may impact the water adsorption and desorption behaviors of these minerals, subsequently influencing the matric suction. In contrast, sand was primarily composed of quartz, a mineral with weak water adsorption capacity and low sensitivity to temperature fluctuations. In summary, the large coefficient of thermal expansion, fine-grained structure, extensive adsorption layer, intricate pore characteristics, and diverse mineral composition of loess made its matric suction highly sensitive to temperature variations. Conversely, owing to its coarse particle size, simplistic pore structure, thin adsorption layer, and stable mineral composition, the matric suction of sand exhibited far less sensitivity to temperature fluctuations compared to loess.
The fitting performance of mathematical models for soil water characteristic curves at varying temperatures
Given that when the temperature exceeded 0 °C, only the matric suction of sand with a moisture content of 0.5% was significantly influenced by temperature, whereas the matric suction of sand with a higher moisture content was minimally affected, the SWCC model for sand was not discussed further here. Additionally, when the temperature dropped below 0 °C, the measured data exhibited certain errors. Consequently, this study focused on discussing the SWCC models of loess for temperatures above 0 °C.
This article utilized three classic SWCC models, namely Brooks-Corey (BC) (Eq. (3))46, van Genuchten (VG) (Eq. (4))47, and Fredlund-Xing (FX) (Eq. (5))48, to fit the experimental data, and discussed the suitability of each model in fitting matric suction data at different temperatures.
 |
3 |
where, θ is moisture content, θs is the saturated moisture content, θr is the residual moisture content, ψ is the soil suction, ψb is the air-entry matric suction, and λ is the pore size distribution index.
 |
4 |
where, α, n, m (m = 1–1/n) are model fitting parameters, and other parameters have the same meaning as the parameters in Eq. (3).
 |
5 |
where, C(ψ), n, m are model fitting parameters, e is the natural logarithm constant, and other parameters have the same meaning as the parameters in Eq. (3).
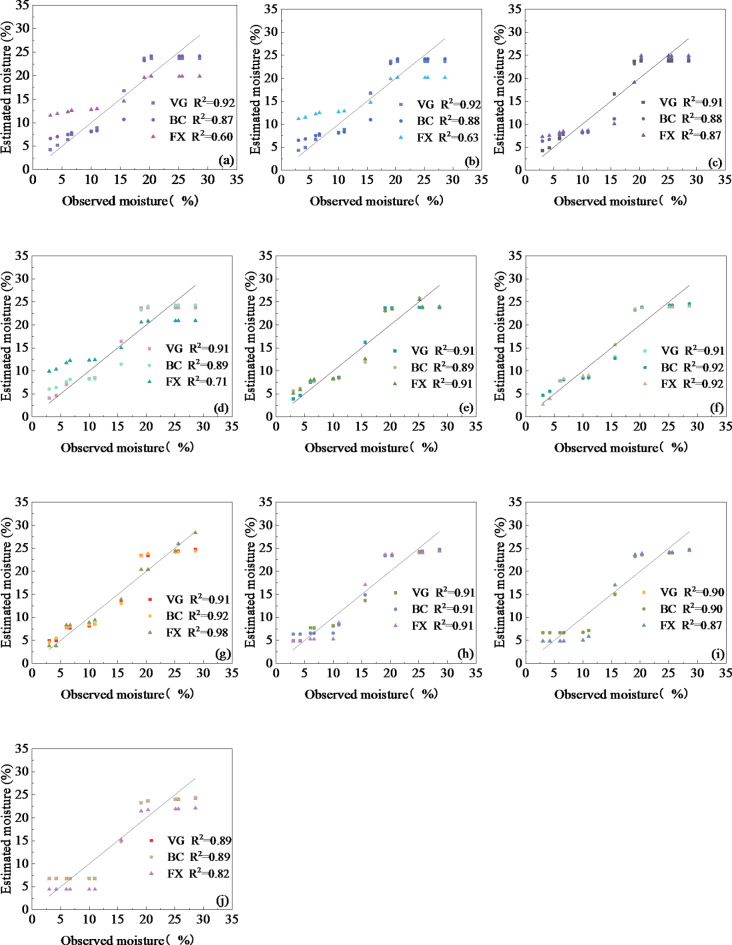
The scatter points shown in Fig. 13 represent moisture values calculated using the BC, VG, and FX models. The line, represented by the function y = x serves as a reference. The closer the scatter points are to this line, the closer the calculated values are to the experimental observations. The reason why there was an error between the observation data and calculation data using the SWCC models may be due to the fact that the SWCC models used for the calculation data were based on the capillary pressure model, ignoring the influence of temperature on the surface hydration of particles8. As shown in Fig. 13, the scatter points tended to be farther from the line when the moisture content was low. This may be attributed to the fact that, at near residual moisture content, temperature influenced the hydration of particle surfaces, primarily affecting the temperature dependence of matric suction. Additionally, the distance between the scatter points and the line was larger when the soil was near saturation, indicating a significant difference between the calculated and observed values. This could be attributed to the fact that the minimum range of the instrument used in this experiment was 9 kPa, which introduced a certain degree of error in the observed data when the soil was near saturation.
Fig. 13.
Observed and estimated moisture content at (a) 45 °C, (b) 40 °C, (c) 35 °C, (d) 30 °C, (e) 25 °C, (f) 20 °C, (g) 15 °C, (h) 10 °C, (i) 5 °C and (j) 1 °C.
Figure 13 illustrates that for soil temperatures exceeding 30 °C, the coefficient of determination for the VG model exceeded 0.91, whereas for the BC model, it was approximately 0.88, and for the FX model, it was even lower. In the temperature range of 15 °C to 25 °C, all three models performed well, with coefficients of determination approaching or exceeding 0.9. For temperatures between 1 °C and 10 °C, both the VG and BC models demonstrated superior fitting compared to the FX model.
The superior performance of the VG model was consistently evident across the SWCCs, while the BC model exhibited strong performance within the 1 –25 °C range, and the FX model excelled between 15 °C and 25 °C. This suggested that the moisture content estimated by the VG model closely matched the measured data across different temperatures, while the BC and FX models were primarily suitable for fitting experimental data around room temperature.
Therefore, utilizing the VG model, values for θs, θr, α, and n at each temperature were determined and subsequently fitted (see Fig. 14) to elucidate the relationship between these parameters and temperature (Table 3). As shown in Table 4, high R² values were observed for θs, θr, α, and n, indicating strong correlations. By substituting these parameters from Table 4 into Eq. (2), a VG model accounting for temperature effects can be developed. Table 4 reveals that as temperature increases, the value of n also increases. A higher value of n indicates a narrower pore size distribution within the soil, suggesting that increasing temperatures may lead to soil compaction, thereby reducing the pore spaces between soil particles. In future research, the authors aim to integrate alterations in soil microstructure to explore the impact of temperature on soil matric suction more comprehensively.
Fig. 14.
The parameters of the VG model at different temperatures (T > 0 °C): (a) θs, (b) α−1, (c) n.
Table 4.
Estimation of VG model parameters.
| Parameter | Function | Adjusted R2 |
|---|---|---|
| θ s | 23.76+7.36/(1+(T/21.12)23.17 | 0.97892 |
| θ r | 0.01 | 1 |
| α | −0.18+0.91/(1+(T/14.45)1.44) | 0.96501 |
| n | 2.25−1.11/(1+(T/35.59)3.59) | 0.99008 |
Conclusions
To further reveal the temperature dependence of matric suction, this study explored the fluctuations in the correlation between matric suction and temperature across various moisture contents for loess and sand, using a user-friendly, time-efficient, comprehensive, and high-precision testing approach. The following conclusions were drawn:
At a given initial moisture content, soil matric suction decreased with increasing temperature. The changes in matric suction with temperature were categorized into three groups: RMax, RTS, and RTW. RMax showed a progressive decline, while RTW demonstrated an upward trend with increasing moisture content.
As temperatures exceeded 0 °C, the influence of temperature on matric suction decreased as moisture content increased. Conversely, below 0 °C, the impact of temperature on matric suction increased with moisture content.
Compared to loess, sand’s matric suction was less sensitive to temperature fluctuations. For sand with moisture content ranging from 4.5 to 18.8%, matric suction exhibited minimal sensitivity to temperatures above 0 °C.
The estimated moisture content obtained from the VG model closely matched the measured data across varying temperatures. BC and FX models were predominantly effective in fitting experimental data near room temperature.
This study used a sensor with an accuracy of 1 kPa to investigate the matric suction of unsaturated soil at different temperatures. Using higher-precision instruments may be more conducive to investigating the matric suction of sand soil. Future research on the matric suction of sand soil at varying temperatures could benefit from the use of more precise instruments. It is recommended to use higher-precision instruments for studying the matric suction of sand soil at different temperatures in the future.
Acknowledgements
This work was supported by the Henan Provincial Science and Technology Research Project (Grant No. 232102241012) and the Natural Science Foundation of Henan University of Technology (Grant No. 31401370). The authors gratefully acknowledge their financial support.
Author contributions
F. L.: Conceptualization, Investigation, Methodology, Data curation, Writing - original draft, Funding acquisition. C.X.: Data curation, Formal analysis, Visualization, Writing - review & editing. M. B.: Investigation, Data curation. X. M.: Supervision, Resources.
Data availability
The authors declare that the data supporting the findings of this study are available within the paper.
Declarations
Competing interests
The authors declare no competing interests.
Footnotes
Publisher’s note
Springer Nature remains neutral with regard to jurisdictional claims in published maps and institutional affiliations.
Contributor Information
Cheng Xu, Email: promisegreat@163.com.
Xuesong Mao, Email: xuesongchd@aliyun.com.
References
- 1.Feng, C. et al. Bayesian updating of soil-water character curve parameters based on the monitor data of a large-scale landslide model experiment. Appl. Sci.10, 5526 (2020). [Google Scholar]
- 2.Liu, F. et al. Isothermal diffusion of water vapor in unsaturated soils based on Fick’s second law. J. Cent. South. Univ.27, 2017–2031 (2020). [Google Scholar]
- 3.Liu, W., Lin, G. C., Liu, Q. P. & Su, X. Hydraulic property variations with depth in a loess mudstone landslide. Sci. Rep.14, 10965 (2024). [DOI] [PMC free article] [PubMed] [Google Scholar]
- 4.Zhou, A. N., Sheng, D. & Carter, J. P. Modelling the effect of initial density on soil-water characteristic curves. Geotechnique62, 669–680 (2012). [Google Scholar]
- 5.Ghavam-Nasiri, A., El-Zein, A., Airey, D. & Rowe, R. K. Water retention of geosynthetics clay liners: Dependence on void ratio and temperature. Geotext. Geomembranes. 47, 255–268 (2019). (2019). [Google Scholar]
- 6.Qiao, X., Ma, S., Pan, G. & &Liu, G. Effects of temperature change on the soil water characteristic curve and a prediction model for the Mu Us Bottomland, Northern China. Water. 11(6), 1235 (2019). (2019).
- 7.Zhou, A. N., Sheng, D. & Carter, J. P. Modelling the effect of initial density on soil-water characteristic curves. Géotechnique62 (8), 669–680 (2012). [Google Scholar]
- 8.Zhang, Y., Zhao, D., Zheng, Q., Huang, Y., Jiang, F., Wang, M. K., Huang, Y. Evaluating the effects of temperature on soil hydraulic and mechanical properties in the collapsing gully areas of south China. Catena. 218, 106549 (2022).
- 9.Uchaipichat, A. Temperature and suction effects on slope stability under undrained condition. Appl. Mech. Mater.858, 98–103 (2016). [Google Scholar]
- 10.Börgesson, L. et al. Thermo-hydro-mechanical characterisation of a bentonite-based buffer material by laboratory tests and numerical back analyses. Int. J. Rock. Mech. Min. Sci.38, 95–104 (2001). [Google Scholar]
- 11.Laloui, L., Salager, S. & Rizzi, M. Retention behaviour of natural clayey materials at different temperatures. Acta Geotech.8, 537–546 (2013). [Google Scholar]
- 12.Zhang, M., Zhang, H., Zhou, L. & Jia, L. Temperature effects on unsaturated hydraulic property of bentonite-sand buffer backfilling mixtures. J. Wuhan Univ. Technol. Mater. Sci. Ed.28, 487–493 (2013). [Google Scholar]
- 13.Azmatch, T. F., Sego, D. C., Arenson, L. U. & Biggar, K. W. Using soil freezing characteristic curve to estimate the hydraulic conductivity function of partially frozen soils. Cold Reg. Sci. Technol.83–84, 103–109 (2012). [Google Scholar]
- 14.Ren, J. & Vanapalli, S. K. Effect of freeze–thaw cycling on the soil-freezing characteristic curve of five Canadian soils. Vadose Zo J. 19 (2020).
- 15.Zhao, G. T., Zou, W. L., Han, Z., Wang, D. X. & Wang, X. Q. Evolution of soil-water and shrinkage characteristics of an expansive clay during freeze-thaw and drying-wetting cycles. Cold Reg. Sci. Technol.186, 103275 (2021). [Google Scholar]
- 16.Qin, B. et al. Temperature effect on water retention curve under high suction and its modeling based on thermodynamics of sorption. Chin. J. Geotech. Eng.34 (10), 1877–1886 (2012). [Google Scholar]
- 17.Wang, T., Lu, J. & Yue, C. Soil-water characteristic curve for unsaturated loess considering temperature and density effect. Rock. Soil. Mech.29 (1), 1–5 (2008). [Google Scholar]
- 18.Yao, Z., Sun, F., Fang, X. & Chen, Z. Water retention characteristics of unsaturated bentonite–sand mixtures under controlled-temperature. Environ. Earth Sci.80, 315 (2021). [Google Scholar]
- 19.Ye, W. M. et al. Temperature effects on the unsaturated permeability of the densely compacted GMZ01 bentonite under confined conditions. Eng. Geol.126, 1–7 (2012). [Google Scholar]
- 20.Jacinto, A. C., Villar, M. V., Gómez-Espina, R. & Ledesma, A. Adaptation of the Van Genuchten expression to the effects of temperature and density for compacted bentonites. Appl. Clay Sci.42, 575–582 (2009). [Google Scholar]
- 21.Romero, E., Gens, A. & Lloret, A. Temperature effects on the hydraulic behaviour of an unsaturated clay. Geotech. Geol. Eng.19, 311–332 (2001). [Google Scholar]
- 22.Zhang, H., Liu, H. & Li, C. Temperature effect of soil water on characteristic curve of Aeolian Sand Subgrade Soil. China J. Highway Transp.33 (7), 42–49 (2020). [Google Scholar]
- 23.Zhu, Z., Sun, D., Zhou, A. & Qiu, Z. Calibration of two filter papers at different temperatures and its application to GMZ bentonite. Environ. Earth Sci.75, 509 (2016). [Google Scholar]
- 24.ASTM D1557-12e1. Standard test methods for laboratory compaction characteristics of soil using modified effort (56,000 ft-lbf/ft3 (2,700 kN-m/m3)), ASTM International, West Conshohocken, PA. (2012).
- 25.ASTM D2216-19. Standard Test Methods for Laboratory Determination of Water (Moisture) Content of Soil and Rock by Mass (ASTM International, 2019).
- 26.ASTM C1699-09. Standard Test Method for Moisture Retention Curves of Porous Building Materials Using Pressure Plates (ASTM International, 2015).
- 27.Pan, G. et al. Experimental investigation on the effect of initial structure on the water retention behavior of Mile clay. Constr. Build. Mater.401, 133000 (2023). [Google Scholar]
- 28.Barclay, A. & Rayhani, M. T. Effect of temperature on hydration of geosynthetic clay liners in landfills. Waste Manag. Res.31, 265–272 (2013). [DOI] [PubMed] [Google Scholar]
- 29.Ni, H. et al. Water retention behavior and double porosity model study of GMZ bentonite considering temperature effects. Eng. Geol.304, 1–9 (2022). [Google Scholar]
- 30.Tan, Y. Z., Hu, X. J., Yu, B. & Liu, Y. The water holding capacity of silt under temperature effect. Yantu Lixue/Rock Soil. Mech.35, 121–127 (2014). [Google Scholar]
- 31.Philip, J. R. & De Vries, D. A. Moisture movement in porous materials under temperature gradients. Trans. Am. Geophys. Union. 38, 222 (1957). [Google Scholar]
- 32.Nagare, R. M., Schincariol, R. A., Quinton, W. L. & Hayashi, M. Effects of freezing on soil temperature, freezing front propagation and water redistribution in peat: laboratory investigations. Hydrol. Earth Syst. Sci.16, 501–515 (2012). [Google Scholar]
- 33.Al-Mahbashi, A. M., Al-Shamrani, M. A. & Dafalla, M. Influence of temperature on the retention capacity of clay liners during wetting and drying. Arab. J. Geosci.14, 383 (2021). [Google Scholar]
- 34.Gao, H., Mingan, S. Effects of temperature changes on soil hydraulic properties. Soil. Tillage Res.153, 145–154 (2015). [Google Scholar]
- 35.Pham, T. A., Hashemi, A., Sutman, M. & Medero, G. M. Effect of temperature on the soil–water retention characteristics in unsaturated soils: Analytical and experimental approaches. Soils Found.63(3), 101301 (2023). [Google Scholar]
- 36.Andry, H. et al. Water retention, hydraulic conductivity of hydrophilic polymers in sandy soil as affected by temperature and water quality. J. Hydrol.373 (1–2), 177–183 (2009). [Google Scholar]
- 37.Haridasan, M. & Jensen, R. D. Effect of temperature on pressure head-water content relationship and conductivity of two soils. Soil Sci. Soc. Am. J.36 (5), 703–708 (1972). [Google Scholar]
- 38.Schneider, M. & Goss, K. U. Temperature dependence of the water retention curve for dry soils. Water Resour. Res.47(3) (2011).
- 39.Salager, S., Youssoufi, E., Saix, C. & M. S., & Effect of temperature on water retention phenomena in deformable soils: Theoretical and experimental aspects. Eur. J. Soil. Sci.61 (1), 97–107 (2010). [Google Scholar]
- 40.Romero, E., Della Vecchia, G. & Jommi, C. An insight into the water retention properties of compacted clayey soils. Géotechnique61, 313–328 (2011). [Google Scholar]
- 41.Liu, Z. R., Ye, W. M., Cui, Y. J., Zhu, H. H. & Wang, Q. Temperature effects on water retention behaviour and structural evolution of GMZ bentonite pellet mixtures. Appl. Clay Sci.222, 106492 (2022). [Google Scholar]
- 42.Romero, E., Gens, A. & Lloret, A. Suction effects on a compacted clay under non-isothermal conditions. Géotechnique53, 65–81 (2003). [Google Scholar]
- 43.Villar, M. V., Gómez-Espina, R. & Lloret, A. Experimental investigation into temperature effect on hydro-mechanical behaviours of bentonite. J. Rock. Mech. Geotech. Eng.2, 71–78 (2010). [Google Scholar]
- 44.Wang, Y. J., Wang, Y. W., Jin, F. Y. & Ma, T. T. Soil–water characteristic curve and freezing characteristic curve of lime improved soil. J. Disaster Prev. Mitigation Eng.40(06), 967–973 (2020). [Google Scholar]
- 45.Yang, Y., Yang, L., Zhao, D., Guo, Y., Lin, J., Jiang, F., … Zhang, Y. Thermal effects on the soil water retention curves and hydraulic properties of benggang soil in Southern China. Water. 16(2), 238 (2024).
- 46.Brooks, R. H. & Corey, A. T. Hydraulic properties of porous media. Hydrol. Paper. 310.1016/j.trc.2012.10.009 (1964).
- 47.Van Genuchten, M. T. A closed-form equation for predicting the hydraulic conductivity of unsaturated soils. Soil. Sci. Soc. Am. J.44, 892–898 (1980). [Google Scholar]
- 48.Fredlund, D. G., Xing, A. & Huang, S. Predicting the permeability function for unsaturated soils using the soil-water characteristic curve. Can. Geotech. J.31, 533–546 (1994). [Google Scholar]
Associated Data
This section collects any data citations, data availability statements, or supplementary materials included in this article.
Data Availability Statement
The authors declare that the data supporting the findings of this study are available within the paper.


