

Abstract
The Maisotsenko cycle-based coolers have gained increasing attention in recent years due to their advantages of low energy consumption and environmental friendliness. Optimizing the model structure and operating conditions is the primary approach for enhancing the cooling performance of dew-point evaporation systems. In this paper, a novel mathematical model of the perforated dew-point evaporative cooler was developed to investigate its cooling performance. The key findings that emerged from this investigation were: (1) Both perforated and non-perforated dew-point evaporative cooling systems exhibited similar trends in relation to the impact of model size and inlet air parameters. (2) The performance of the dew-point evaporative cooler could be enhanced by implementing the perforation method when the total supply air ratio is below 0.5, and optimal performance was achieved with a single-perforation design. (3) The outlet temperature of the dry channel initially showed a downward trend when the supply air ratio was 0.3, and subsequently gradually increased with an elevated supply air ratio. It is worth noting that within the range of 0.5 to 0.6 for the supply air ratio, the minimum outlet air temperature was achieved.
Supplementary Information
The online version contains supplementary material available at 10.1038/s41598-025-85253-2.
Keywords: Cooler, Supply air ratio, Dew-point, Performance, Perforations
Subject terms: Fluid dynamics; Computational science; Design, synthesis and processing
Introduction
With the growing demand for comfortable living environments, the use of artificial refrigeration (air-conditioning) is becoming more widespread, resulting in a substantial increase in building energy consumption. The construction industry accounts for around 40% of global energy consumption and contributes to 25% of greenhouse gas emissions (Zhang et al.,2020). Electric-driven mechanical vapor chillers and cooling towers, which account for 95% of the current cooling market, are the main factors contributing to building energy consumption. The release of chemical refrigerants from them has been widely acknowledged as a significant contributor to the greenhouse effect and depletion of the ozone layer. Additionally, compressor-based coolers significantly increase electricity consumption during warm seasons. Considering the ongoing rise in energy usage for cooling purposes, it is crucial for engineers and scientists to investigate alternative cooling technologies that can efficiently decrease both energy consumption and environmental impact.
The utilization of evaporative cooling, which harnesses the process of water evaporation to achieve air cooling, may be perceived as a viable solution due to its sole reliance on electrical power for air circulation while achieving cooling through water evaporation without any external power input. The three typical types of evaporative cooling systems include air-water direct contact coolers, conventional indirect air coolers with water, and M-cycle (Maisotsenko cycle) indirect coolers (Mahmood et al., 2016). The primary air temperature in direct evaporative cooling systems is reduced through direct water contact, which introduces moisture to achieve air cooling. The increase in humidity, however, can cause discomfort among individuals. Conversely, indirect evaporative cooling systems effectively cool the primary air without introducing additional moisture by ensuring no direct contact between the air and water. Although the power consumption of air-water direct and indirect contact coolers is lower than that of compressor-based air coolers, they are unable to reduce the air temperature below the wet-bulb temperature of the inlet air. However, by utilizing a dew-point evaporative cooler (also known as an M-cycle indirect evaporative cooler), it is possible to achieve outlet air temperatures lower than their wet-bulb temperature. The air is initially cooled in the dry channel before entering the wet channel, allowing for the supply air temperature to be lowered below the wet-bulb temperature and approach the dew-point temperature of the inlet air, as illustrated in Fig. 1. There are two main types of dew-point evaporators: countercurrent and cross flow. While the countercurrent design is regarded as more effective, its commercialization has been difficult because of fabrication problems associated with pure countercurrent heat exchangers (Shahzad et al., 2019). The cross-flow structure is typically implemented by incorporating numerous regularly distributed holes in the working channel, which allows the working air flow to enter the wet channel. At this point, the effect of the hole is not to improve the performance of the dew-point evaporator.
Fig. 1.
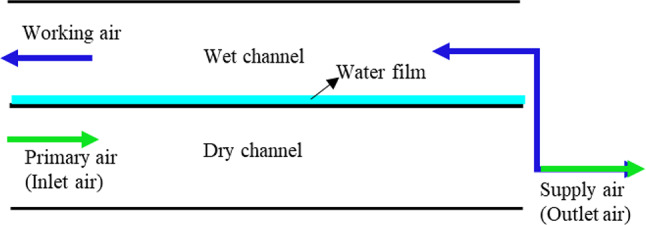
Dew-point evaporative cooler (No perforation).
Despite its larger volume compared to the traditional compression cooler at the same cooling capacity, the dew-point evaporation cooler faces significant limitations in its application within the construction field. The optimization of performance and reduction in size are currently the primary focuses of research on dew-point evaporative coolers. Numerous studies have proposed various configurations to enhance the efficiency of counter flow dew-point coolers, as the counter flow arrangement has been widely acknowledged as the most effective. X. C et al. (2014) studied the performance of an improved dew-point evaporative design by laying small ribs along the channel transverse to the flow direction in order to enhance the heat transfer. The results indicated that the wet-bulb effectiveness would experience a 10–20% increase when the inlet velocity exceeded 1.5 m/s, compared to a cooler without ribs in the channel. Zeng et al. (2014) numerically studied a solar-hybrid one-rotor two-stage desiccant cooling and heating system. The findings demonstrated that the one-rotor two-stage desiccant cooling unit could effectively handle approximately 60% of the humidity load, while solar energy could meet around 40% of the heating demand. Ala Hasan (2010) investigated four types of coolers: three two-stage coolers (counterflow, parallel flow, and combined parallel-regenerative flow), as well as a single-stage counterflow regenerative cooler. The wet bulb cooling efficiency of the two-stage counterflow and single-stage counterflow regenerative coolers was 1.26 and 1.16 respectively.
Perforation was often utilized in cross-flow evaporative cooling models to divert a part of the air from the dry channel to the wet channel, or to reduce the pressure drop in overly long model channels. Anisimov and Pandelidis (2011, 2014) consider the optimal design of the wet channel, particularly in terms of heat and humidity transfer in the perforation pre-cooling section, to be crucial for enhancing the performance of M-cycle evaporator. The one-dimensional ε-NTU heat and mass transfer model was utilized to analyze the heat and humidity transfer in the pre-cooling section. The results indicate that as the number of perforations increases, the perforation model shows progressively worse performance compared to the non-perforated model. However, it is worth noting that by mitigating air pressure loss in the cross-flow channel, perforation can effectively reduce operational costs. Recently, there have been research efforts aimed at enhancing the performance of the evaporative dew-point cooler through utilization of structural perforations, as illustrated in Fig. 2. The perforation in the countercurrent dew point indirect evaporator was expected that the air in the dry channel entered the wet channel from the perforation in advance to form a multi-level evaporation, so as to reduce the air temperature at the outlet of the dry channel. Pandelidis et al. (2015) studied the performance of an exchanger with typical airflows arrangement and an exchanger with perforations along the whole length of the dry channel. The investigation revealed that the ratio of working to main air-flow plays a crucial role in determining the cooling performance of the considered air coolers. The results indicated that the performance of the perforated model exceeded that of the non-perforated model when the supply air ratio was below 0.55. M.W Shahzad et al. (2019) proposed an improved indirect evaporative cooler system for sensible cooling that can be combined with dehumidification processes to achieve sustainable cooling goals. The outlet air of the dry channel was injected at different points into wet channel. Seung et al. (2019) conducted numerical simulations on a perforated countercurrent dew point indirect evaporator, investigating the performance of both single-perforation and three-perforation configurations. The comparative study revealed that the single-perforation model performed better than the three-perforation model, as increasing channel length and decreasing supply air ratio effectively lowered air temperature at the dry channel outlet and enhanced dew-point efficiency. Specifically, using a longer channel length and maintaining the supply air ratio of 65% approached maximum cooling capacity. H. S Dizaji et al. (2019, 2020) investigated the impact of inlet temperatures, humidity levels, mass flow rates and ratios, channel gap size, channel length and height, as well as perforation position on the cooling performance of the cooler. In the current perforated model, single perforation is a slit along the width of the model. The perforation separates the plate and the water film between the wet and dry channels into distinct components. In fact, a perforation of the model consists of a certain number of small holes that do not destroy the integrity of the water film on the wet channel plate.
Fig. 2.
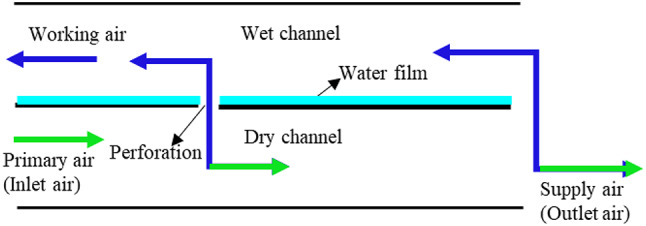
Perforated dew-point evaporative cooler (Single perforation).
The cooling performance of the perforated cooling system may not necessarily show improvement when compared to that of the non-perforated cooling system (Liu et al., 2021). The impact of the number of perforations on system performance has not been comprehensively investigated in existing literature under different supply air ratios. In this paper, a novel model of the indirect perforated dew-point evaporative cooling system has been developed to simulate the processes of heat and mass transfer more accurately. The objective of this paper is to investigate the impact of inlet air conditions, model geometry, total supply air ratio, combinations of supply air ratios at perforations, number of perforations, and position of perforations on the performance of dew-point evaporative coolers.
Perforated counter-flow dew-point evaporative cooling system
Figure 3a shows a schematic general view of the perforated dew-point evaporative cooling model which is extracted from a three-dimensional dew-point evaporative cooler composed of multiple dry and wet channels. This model geometry consists of a pair of parallel dry and wet channels, and a layer of channel plate and water film to separate the channels. There is a row of holes in the middle of the separate channel plate along the width of the model at a certain position. Some of the primary air will enter the wet channel through perforations and the outlet and become part of the working air. The wall surfaces of the wet channel adjacent to the dry channels are uniformly covered by water film as illustrated in Fig. 3b. Heat transfer in the dry channel and heat and mass transfer in the wet channel are related through the energy, mass conservation and diffusion equations for the air, water in the channels illustrated in Fig. 3c. Assuming that the holes are still covered by water film, the energy balance equation is satisfied at the holes as at other non-holes, because the thermal resistance of the middle plate is far less than the thermal resistance of the water film. As shown in Fig. 3b, the air flow at the wet channel perforation is the summary of the air flow at the previous state point and the air flow at the dry channel perforation. In this study, the supply air ratio at the perforation is directly assigned, and the influence of the perforation can be discussed under the condition of uniform flow field. Due to the complexity of heat and mass transfer in countercurrent dew point indirect evaporative cooling models, reasonable assumptions were made for the purpose of numerical calculation. The following assumptions are made to simplify the problem:
Fig. 3.

Configuration and conceptual sketch of the counter-flow dew-point evaporative cooling system.
The model is adiabatic, i.e., there is no heat transfer between the model and the surrounding.
Temperature variation normal to the flow is neglected, and only the temperature variation along the channel is considered.
The flow inside the channels is laminar and fully developed.
Flow is steady and incompressible.
The entire wet channel surface is covered by a layer of stagnant and saturated water film.
The effects of the conductive heat transfer in horizontal direction inside the plate, the water absorbing sheet are negligible.
Governing equations
Using the assumptions, the governing differential equations will be given:
Heat balance:
Dry channel air
 |
Heat transfer plate
 |
Where, the solid wall surface and liquid water layer are considered as a whole in order to.
calculate the equivalent thermal. ( ) is the effective thickness of the plate layer and water
absorbing film,  . (
. ( ) is the effective thermal conductivity of the plate layer and
water absorbing film,  .
.
Water absorbing film
 |
Where, ( ) is the dry air density(air in channels is a dry air-vapor mixture).
Wet channel air
 |
 |
The relationship between the saturation vapor pressure and the saturation temperature is given by the following formula (6) which the range of temperature is 0–200 ℃ (Chen et al. 2016).
 |
 |
Where, (B) is the standard atmospheric pressure; ( ,
, ,
, ,
, ,
, ,
, ) are coefficients of formula (6
The convective mass transfer coefficient and the convective heat transfer coefficient in the wet channel are associated by the Lewis number (Baehr and Stephan, 1998).
 |
For the dew-point evaporative cooling air conditioning system, which are vapor-water mixtures with low diffusivity, the Lewis relation can be regarded as 1.0 (ASHRAE, 1997). The mass transfer coefficients is:
 |
9 |
The physical parameters of the air, water film and aluminum plate are assumed to be constant. The symbols, ρd and ρw are the densities of air-vapor mixture in dry and wet channels respectively. ρd = ρa(1 + Xd), ρw = ρa(1 + Xw). cpd and cpw are the air specific heat at constant pressure in dry and wet channels respectively. cpd=cpw. kd and kw are air thermal conductivity. kp is the plate thermal conductivity. ks is the thermal conductivity of water absorbing film.
The heat transfer coefficients inside the dry and wet channels were approximated by the Nusselt number (Nu)of the developed laminar flow in rectangular shape channels under the condition of the uniform heat flux along the flow direction and the uniform wall temperature at a cross section. The Nusselt numbers (Nu = αd/ k) were all 8.235 (Miyazaki et al., 2011; Cengel,2006) for the dry and wet channels.
Boundary and perforations conditions
The physical modeling of the perforation dew-point evaporative cooler is analogous to that of the non-perforation dew point evaporative cooler. The presence of perforations divides the wet and dry channels in a perforated dew-point evaporative cooler into multiple stages. The air velocity varies in each stage of the dry and wet channels, depending on the number of perforations and the supply air ratio at each perforation. The boundary and perforation conditions are demonstrated using the single-perforation model depicted in Fig. 3. At the inlet of the dry channel (at  ), the air temperature, air velocity and air humidity ratio were specified (
 ,
, and
and  ). Tin, uin and Xin are the temperature, velocity and humidity ratio of the inlet air respectively. At the inlet of the wet channel (at
  ), the air temperature and humidity ratio were the same as the value of the outlet air in dry channel (
 and
and  ). Tout is the temperature of the air at the outlet of the dry channel. The air velocity in wet channel is associated with the air velocity in dry channel through the conservation of mass. There is no heat transfer between the surrounding and both ends of the dry and wet channels (at
  and
and  ). The air velocity of each section in the dry and wet channels can be expressed by the inlet air velocity and the supply air ratio at the perforation (Liu et al., 2021).
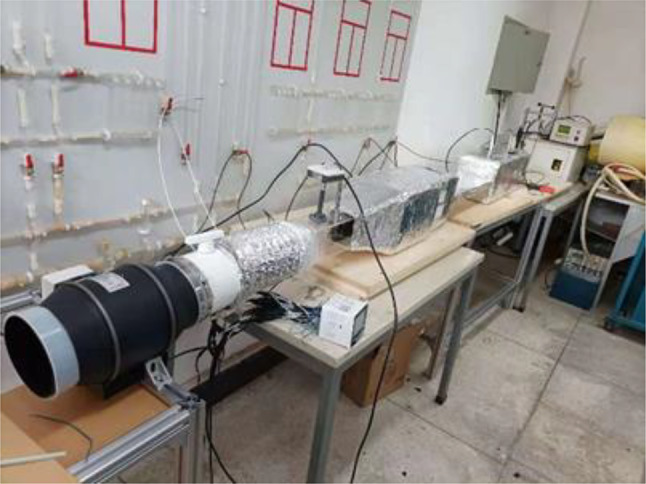
Experiments and model validation
In order to validate the perforated dew-point evaporative cooling model, a unique test-rig was developed which was able to simulate perforated dew-point evaporative cooler working condition. The schematic of the experimental test system is shown in Fig. 4 and the fabricated dew-point evaporative cooler is shown in Fig. 5. The test system mainly consists of two parts: the perforated dew-point evaporative cooler and the auxiliary equipment. The measured parameters included the inlet air velocity (ud), inlet air temperature (Td), and the outlet air temperature and humidity ratio in the dry channel. In order to obtain the supply air ratios at the perforation ( ) and the outlet of the dry channel (
 ), it is necessary to test the airflow rates at the inlet of the dry channel, outlet of the dry channel, and inlet of the wet channel. The dry channel is divided into two segments by a perforation, with
  and
and  representing the ratio of air flow at the outlet and inlet of each segment respectively. The name and characteristics of the instruments can be seen in Table 1. All data was recorded at steady-state condition for different air flow rates and inlet temperatures.
Fig. 4.

Schematic of the perforated dew-point evaporative cooling experiment system.
Fig. 5.
Dew-point evaporative cooler test system.
Table 1.
Instruments use through the experiment.
| Item | Type | Accuracy | Resolution |
|---|---|---|---|
| Air fan | BJ-02 W | / | / |
| Paperless Recorder | THMA | ± 0.2%FS | / |
| T/H sensor | THAS008 | T: ±0.2℃; H: ±2% RH | T: 0.1℃; H: 0.1%RH |
| Wind speed sensor | WD4150 | ± 0.02%FS | 0.1 m/s |
| Anemometer | ST866A | 5% | 0.1 m/s |
The auxiliary equipment includes three parts: water distribution system, inlet air pretreatment system and data acquisition system. The middle plate of perforated dew-point evaporative cooler is a specific ultra-thin copper surface with 0.5 mm thickness. One side of this material is an absorbent 0.2 mm copper foam. The dry and wet channel plates are transparent acrylic plates with a width of 200 mm and a thickness of 0.3 mm. The perforation position (L1/L) is 0.4. The experiments were run for the various operating conditions listed in Table 2, where the highest relative uncertainty of the product air temperature was ± 0.6%.
Table 2.
Detailed parameters of the dew-point evaporative model.
| S/N | Operation parameter | Geometry parameter | ||||||||
|---|---|---|---|---|---|---|---|---|---|---|
| Td (℃) |
Xd (kg/kg)
|
ud (m/s) |
Tout (℃) |
L (m) |
W (m) |
ad (m) |
L1/L | |||
| 1 | 30.1 | 0.0096 | 0.88 | 0.86 | 8 | 24.67 | 1.0 | 0.2 | 0.005 | 0.4 |
| 2 | 35.2 | 0.0096 | 0.88 | 0.86 | 8 | 27.23 | ||||
| 3 | 20.1 | 0.0096 | 0.88 | 0.86 | 8 | 30.44 | ||||
| 4 | 45.1 | 0.0096 | 0.88 | 0.86 | 8 | 32.66 | ||||
| 5 | 49.9 | 0.0096 | 0.88 | 0.86 | 8 | 35.13 | ||||
The one-dimensional simulation analysis method mentioned above was utilized for calculating and simulating the experimental conditions, ensuring consistency. The acquired results were subsequently compared with the experimental data. The numerical calculations were in good agreement with the experimental findings, as shown in Fig. 6, when the inlet air temperature was below 40℃.The one-dimensional model is based on the assumption of uniform flow, negligible longitudinal heat transfer between the water film and heat shield, and utilization of a fitting function curve for temperature and moisture content at the saturated interface of the water film. However, significant deviations arise under conditions characterized by high inlet temperature and large flow rate.
Fig. 6.
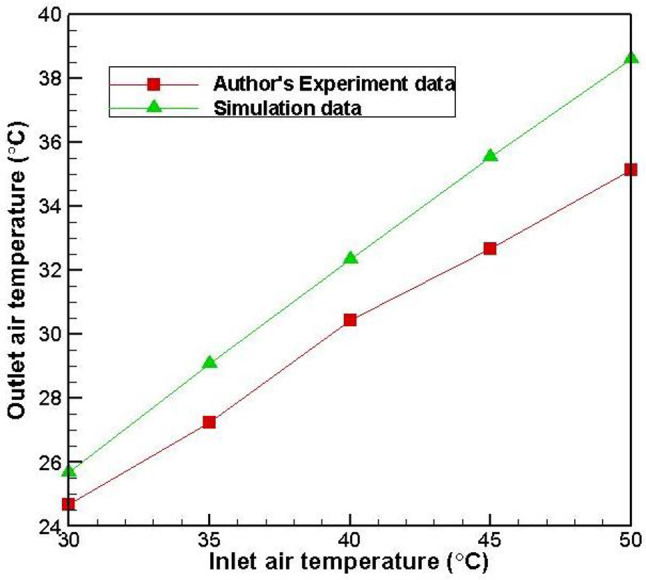
Comparison with the experimental data.
The numerical model was further validated for the perforated dew-point evaporative cooler designs against the experimental results of Dizaji et al. (2018). The channel length ( ) is 1.0 m and channel height (ad) is 5 mm. Inlet air humidity ratio (Xd) is 15 g/kg. The perforation divide the channel length into two uniform stages. Supply air ratios at perforation and dry channel outlet are 0.8 and 0.75, respectively. Inlet air velocity is 8.33 m/s. For the perforated cooling model, the results were shown in Fig. 7, which shows a good agreement with Dizaji et al. (2018).
Fig. 7.
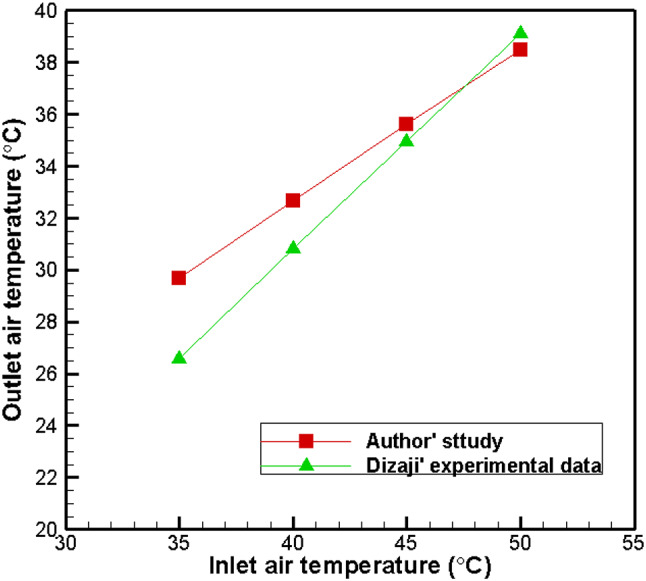
Comparison with Dizaji [16].
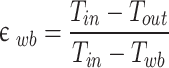
Performance parameters
The effects of perforations, geometrical and operational conditions on the performance of the perforation cooler will be studied in next section. The wet-bulb effectiveness is defined as the ratio of the difference between inlet and outlet air temperature to the difference between inlet air temperature and its wet bulb temperature. The wet-bulb effectiveness is defined as formula (10). The dew-point effectiveness is defined as the ratio of the difference between inlet and outlet air temperature to the difference between inlet air temperature and its dew-point temperature. The dew-point effectiveness is defined as formula (11). The cooling capacity of the cooler is defined as formula (12).
 |
10 |
 |
11 |
 |
12 |
Where, (γ) represents the supply air ratio, which is defined as ratio of dry channel outlet air flow to dry channel inlet air flow.
In the study of the effects of a single parameter on the perforated dew-point evaporative cooler, the simulation results of different groups were obtained under the condition that other parameters remain unchanged. (L is 0.6 m, ad and aw are both 5 mm, ap and as are both 0.5 mm, ud is set at a value of 2 m/s, W is set at a value of 0.3 m, Tin is set at a temperature of 31.2℃and Xin is set at a humidity ratio of 10.15 g/kg.). This study aims to investigate the influence of various inlet air parameters, including velocity, temperature, humidity, and model size conditions such as channel height, length, and total supply air ratio on the performance of a perforated counterflow dew point indirect evaporative cooler. For this purpose, the maximum number of perforations in the model was initially set to four, with their positions distributed as evenly as possible. The supply air ratio at each perforation and at the outlet of the dry channel was maintained at a uniform value. The specific values for 0–4 perforation numbers along with their corresponding positions and associated supply air ratios at both the perforations and dry channel outlet are derived from Table 3. Based on this, further investigation was conducted into the effects of the perforation location, combination of the supply air ratios at perforation and at the outlet of the dry channel on the performance of the evaporator. Data is provided within the supplementary information files.
Table 3.
Models for different number of perforations.
| S/N | Perforation number | Perforation Positions | Supply air ratios |
|---|---|---|---|
| 1 | 0 |

|

|
| 2 | 1 |

|
|
| 3 | 2 |

|
|
| 4 | 3 |

|
|
| 5 | 4 |

|
|


Results and discussion
Effect of the total supply air ratio
Figure 8 shows the outlet air temperature, dew-point effectiveness, wet bulb effectiveness and cooling capacity of the perforation models (zero to four perforations) with the changes of the total supply air ratios when other parameters remain unchanged. As shown in Fig. 8a, the outlet air temperature of all models increases with the increase of the supply air ratio. For the non-perforated model, the outlet temperature increases slowly from 20.3℃ to 26.4℃ with the increase of supply air ratio. Outlet temperature of the perforated models increases rapidly with the increase of the supply air ratio.
Fig. 8.

Effect of supply air ratio (Data is provided within the supplementary information files).
The observation from Fig. 8 also reveals that the perforated model outperforms the non-perforated model when the supply air ratio is less than 0.3, while models with different numbers of perforations exhibit similar performance. Compared to the existing non-perforating dew point evaporation cooling technology, at a supply ratio of 0.1, the outlet temperature decreased from 20.3℃ to 16.3℃, while the wet-bulb effectiveness increased from 98 to 135%, and the dew-point effectiveness increased from 64 to 89%. There was a significant improvement in energy efficiency by approximately 38.2%, as evidenced by an increase in cooling capacity from 3.9 W to 5.4 W for the cooler unit. In comparison with traditional compression refrigeration systems with capacities reaching thousands of watts, evaporation cooling still had a smaller capacity. When the supply air ratio is between 0.3 and 0.5, the performance of the perforated model is gradually lower than that of the non-perforated model with the increase of the supply air ratio. When the supply air ratio is greater than 0.5, the performance of the perforated model is lower than that of the non-perforated model, and the more perforations, the lower the performance. When increasing the supply air ratio to a higher value, such as 0.7, only 3/10 of the incoming airflow enters through perforations and entrances into the wet channel. The airflow velocity in the dry channel remains relatively constant (with most of it not entering into the wet channel). The main factors affecting heat exchange in both channels are still determined by temperature and relative humidity of incoming airflow into the wet channel. When the total supply air ratio remains constant, an increase in the number of perforations results in a decrease in the inflow of low-temperature air through the entrance of the wet channel. When this inflow approaches zero, it is equivalent to reducing the length of the channel.
Therefore, in the subsequent analysis of perforation model performance, the analysis focuses on the case where the supply air ratio is taken as a low value (0.3).
Effect of inlet air velocity
The impact of inlet air velocity on the performance of the model with 0 ~ 4 perforations at a low supply air ratio (γ = 0.3) was demonstrated in Fig. 9. As depicted in Fig. 9, an increase in inlet air velocity leads to a gradual rise in the outlet air temperature of the 0 ~ 4 perforated evaporative cooler model, accompanied by an increase in cooling capacity and a decrease in dew-point and wet-bulb effectiveness. When the inlet air flow velocity exceeded 3 m/s, the performance of the perforated models approximated. The perforated model exhibits a reduction in outlet air temperature of approximately 1.5 °C compared to the non-perforated model, along with an enhancement of about 7% in dew-point and wet bulb effectiveness. Additionally, Fig. 9 illustrates that the outlet air temperature and efficiency of the perforated model closely resemble those of the non-perforated model at a flow rate of 5 m/s, when both models have an inlet air velocity of 9 m/s. Models with 2 ~ 4 perforations demonstrate nearly identical cooling capacities, reaching up to 23.91 W. This represents a significant performance improvement compared to the non-perforated model’s cooling capacity of 17.3 W, amounting to approximately a remarkable increase by around 38.2%.
Fig. 9.

Effect of inlet air velocity (γ = 0.3).
Effect of channel length
Figure 10 illustrates the variation of outlet air temperature, cooling capacity, dew pint and wet bulb effectiveness with channel length when the total supply air ratio is 0.3.
Fig. 10.

Effect of the channel length (γ = 0.3).
As the channel length increases, the outlet air temperature gradually decreases for all evaporative cooler models (0 ~ 4 perforation), while the cooling capacity, dew-point effectiveness, and wet bulb effectiveness gradually increase. The outlet air temperature of the perforated model is approximately 1 °C lower than that of the non-perforated model when the channel length is less than 0.6 m, as illustrated in Fig. 10a. The outlet air temperature of the 2–4 perforation model gradually approaches and eventually surpasses that of the non-perforated model as the channel length exceeds 0.6 m. It should be duly noted that the outlet air temperature of the single-perforation model consistently remains lower than that of the non-perforated counterpart throughout this range.
The dew-point effectiveness and wet bulb effectiveness of the perforated model exhibit a consistently increasing trend with the channel length, as depicted in Fig. 10, mirroring the behavior of cooling capacity. At a channel length of 0.6 m, both single-perforation and two-perforation models demonstrate approximately 10% higher wet bulb effectiveness compared to the non-perforated model, surpassing 100%.
Effect of the channel height (ad)
The relationship between channel height and outlet air temperature, cooling capacity, dew point, and wet bulb effectiveness is depicted in Fig. 11 for a total supply air ratio of 0.3.
Fig. 11.

Effect of channel height (ad).
The outlet air temperature of both the perforated and non-perforated models gradually increases with an increase in channel height, as depicted in Fig. 11, when the total supply air ratio is 0.3. The dew-point effectiveness and wet bulb effectiveness gradually decline in the meantime. The cooling capacity of the perforated model initially increases and then gradually decreases as the channel height increases, reaching its peak at a channel height of 6 mm. In contrast, the cooling capacity of the non-perforated model progressively decreases with an increasing channel height.
The observation in Fig. 11 also indicates that, for channel heights exceeding 6 mm, the perforated model exhibits a lower outlet air temperature and higher cooling capacity, dew-point effectiveness, and wet bulb effectiveness compared to the non-perforated model. The outlet air temperature, cooling capacity, dew-point effectiveness, and wet bulb effectiveness of the perforated models exhibit a high level of similarity. The performance of the dew-point evaporative cooler can be enhanced by employing the perforation method when a low value (0.3) is assigned to the supply air ratio and when the channel height exceeds 5 mm. The performance of the dew-point evaporative cooler remains consistent across different perforation numbers.
Effect of the inlet air temperature
Figure 12 illustrates the correlation between inlet air temperature and outlet air temperature, cooling capacity, dew-point, and wet bulb effectiveness for a total supply air ratio of 0.3.
Fig. 12.

Effect of inlet air temperature.
The outlet air temperature and cooling capacity of both the perforated and non-perforated models show a nearly linear and rapid increase as the inlet air temperature rises, as shown in Fig. 12. Furthermore, there is a gradual improvement in the dew-point and wet bulb effectiveness of the perforated model, while those of the non-perforated model remain essentially unchanged. It can also be seen from Fig. 12 that the outlet air temperature of the perforated dew-point indirect cooler model is lower than that of the non-perforated dew-point indirect cooler, and the cooling capacity, dew-point effectiveness and wet bulb effectiveness of the perforated dew-point cooler are higher than those of the non-perforated dew-point cooler. When the inlet air temperature is 36 °C, the single-perforation model achieves a cooling capacity of 16.48 W with an outlet air temperature of 20.81 °C. Additionally, it demonstrates a dew-point effectiveness of 70% and a wet bulb effectiveness of 104%. However, the outlet air temperature of the four-perforation model measures 21.8 °C, while the cooling capacity stands at 15.42 W. Additionally, the dew-point effectiveness reaches 65%, and the wet bulb effectiveness achieves an impressive 97%. Therefore, it is evident that an increase in perforations results in a decline in performance.
Effect of the inlet air humidity ratio
The performance of the cooling system is illustrated in Fig. 13, showcasing the variations in outlet air temperature, cooling capacity, dew-point, and wet-bulb effectiveness as the inlet air humidity ratio (dry channel) increases.
Fig. 13.

Effect of inlet air humidity ratio.
As can be seen from Fig. 13, with the increase of inlet air humidity, the outlet air temperature and dew-point effectiveness gradually increase, while the cooling capacity decreases, and the wet bulb effectiveness changes little. The outlet air temperature of the perforated model is lower than that of the non-perforated model, while the cooling capacity, dew-point and wet bulb effectiveness are higher than those of the non-perforated model. It can be seen that the perforation method can improve the performance of the evaporative cooler at low supply gas ratio.
Effect of perforation position
The influence of perforation position on the performance of evaporative cooler in low supply air ratios needs to be analyzed. From the above analysis, it can be seen that in most cases, the performance of the single perforation dew-point evaporative cooler is optimal. The influence of perforation position on the performance of evaporative cooler in the single perforation mode is investigated as a primary focus.  and
and  represent the supply air ratio at the perforation and outlet of the dry channel, respectively. The perforation position is indicated by
 . For the non-perforation model, the perforation position (
 ) is equal to 1. The variation of the outlet air temperature, cooling capacity, dew-point and wet-bulb effectiveness for the five combination models of single perforation is depicted in Fig. 14.
Fig. 14.

Effect of perforation position ( ).
).
This variation occurs with changes in the perforation position (L1/L) while maintaining a supply air ratio of 0.3. The outlet air temperature increases linearly and the cooling capacity, dew-point and wet-bulb effectiveness decrease linearly as the L1/L increases from 0.2 to 0.8, as shown in Fig. 14. The closer the perforation position is to the entrance end of the dry channel, the lower the outlet air temperature becomes. The disparity in supply air ratios between the perforation and the dry channel outlet results in a significant difference in the outlet air temperature. It can also be seen from Fig. 14.a that the outlet air temperature of combination 2 ( ) is higher than that of the other four combination models. When the perforation position L1/L>0.5, the outlet air temperature of combination 2 begins to be gradually higher than that of the non-perforated model. For the models of combination 1(
 ), combination 3(
 ) and combination 4(
 ), when the perforation position is 0.2, the outlet air temperature is about 19 °C, the cooling capacity is about 13.3 W, and the dew-point effectiveness and wet-bulb effectiveness are about 72% and 110% respectively. Compared with the non-perforated model, the outlet air temperature is about 8% lower; the cooling capacity is increased by about 17% higher; the dew-point effectiveness is increased by about 10%, and the wet-bulb effectiveness is increased by about 15%.
The perforation position is close to the inlet end, and the cooling capacity is higher. Based on the above analysis, it is evident that the perforation position in close proximity to the inlet end of the dry channel exhibits superior performance at low supply air ratios, while the perforated model outperforms the non-perforated model. Various combinations of supply air ratios exert a significant influence on the evaporative cooler’s performance.
Effect of supply air ratio at perforation and dry channel outlet
The total supply air ratio, the condition of the inlet air, and the dimensions of the model collectively influence the cooling capacity, dew-point effectiveness, and wet bulb effectiveness of the evaporative cooler. The parameters can be derived from the temperature differential between the inlet and outlet air streams. For ease of analysis, the performance of the dew-point evaporative cooler is assessed based on the temperature of the outlet air. Due to its proximity to the inlet end of the dry channel, the perforation position results in a lower outlet air temperature. The discrepancy in supply air ratio between the perforation and the dry channel outlet leads to significant variations in the outlet air temperature. The total supply air ratio was 0.3 and 0.7, and the perforation position L1/L was 0.2 and 0.8, respectively. A total of 12 supply air ratio combinations were set in Table 4.
Table 4.
The combination of supply air ratio at perforation and dry channel outlet. ( ).
).

|
COMB |

|

|
COMB |

|

|
|
|---|---|---|---|---|---|---|---|
| 0.3 | 1 | 0.4 | 0.75 | 5 | 0.7 | 0.43 | |
| 2 | 0.5 | 0.6 | 6 | 0.8 | 0.38 | ||
| 3 | 0.55 | 0.55 | 7 | 0.9 | 0.33 | ||
| 4 | 0.6 | 0.5 | / | / | / | ||
| 0.7 | 1 | 0.75 | 0.93 | 4 | 0.9 | 0.78 | |
| 2 | 0.8 | 0.88 | 5 | 0.95 | 0.74 | ||
| 3 | 0.85 | 0.82 | / | / | / | ||
The aforementioned results were graphed with the supply air ratio at the outlet of the dry channel as the x-axis and the outlet air temperature as the y-axis. The air temperature at the outlet of the dry channel is depicted in Fig. 15, illustrating its variation with the supply air ratio at the outlet while maintaining a total supply air ratio of 0.3 and 0.7, respectively. The results presented in Fig. 15a demonstrate that, at a supply air ratio of 0.3, the outlet air temperature of the dry channel initially decreases and then gradually increases as the supply air ratio at the outlet of the dry channel increases. Notably, when this ratio ranges between 0.5 and 0.6, the lowest recorded outlet air temperature is below 19 °C for this specific configuration. Comparatively, when compared to the non-perforated model, a reduction of approximately 1.6 °C in outlet air temperature is observed alongside a significant enhancement in dew-point effectiveness by 10%, wet bulb effectiveness by 15%, and refrigeration capacity by about 14%. Figure 15b illustrates that as the supply air ratio at the outlet of the dry channel increases, there is a gradual rise in the outlet air temperature. Furthermore, outlet air temperature is observed to be higher than that of the non-perforated dew-point evaporative cooler.
Fig. 15.

Effect of supply air ratio at perforation and dry channel outlet.
Conclusions and future work
In this study, a theoretical finite difference model was developed to analyze the performance of a perforated dew-point evaporative cooling system, which was solved using Fortran programming. The research findings of the counter-flow dew-point evaporative cooling system with perforations are as follows:
The impact of model size and inlet air parameters on the performance of both perforated.
and non-perforated dew-point evaporative cooling systems exhibited similar trends.
(2) The performance of the dew-point evaporative cooler could be enhanced by implementing the perforation method when the total supply air ratio was below 0.5, and optimal performance was achieved with a single-perforation design.
(3) When the supply air ratio was 0.3, the outlet air temperature of the dry channel initially decreased and subsequently exhibited a gradual increase with an elevated supply air ratio at the outlet of the dry channel. Notably, when the supply air ratio ranged from 0.5 to 0.6 at the outlet of the dry channel, it resulted in the lowest recorded air temperature.
The values of the inlet air temperature (31.2℃) and humidity ratio (10.15 g/kg) were obtained from recorded outdoor meteorological data in Lanzhou, Gansu Province, China. The relative humidity was only 35%, more suitable for the use of dew point evaporation cooling technology. With the increase of relative humidity, the dew point temperature gradually increased, and the theoretically achievable air temperature drop decreased. The additional cooling effect of the perforated cooler gradually diminished, but the temperature decrease could still be maintained at approximately 0.5 °C.
The optimization of the cooling efficiency of the perforated dew-point evaporative cooler should consider both manufacturing cost and production complexity. The recommended range for the total supply air ratio is 0.3 to 0.5, while the inlet air velocity should be between 3 m/s and 5 m/s, and the channel height should range from 4 mm to 6 mm. When the supply air ratio is below 0.3, the cooling capacity of the system is insufficient for practical applications. Increasing the inlet air velocity improves performance through perforation methods; however, if it exceeds 5 m/s, the wet-bulb efficiency drops below a certain threshold, making it uneconomical. A ventilation channel narrower than 4 mm increases the difficulty in model-making.
Generally, perforations in the cooler will change the pressure distribution in the dry and wet channels. The next step involves establishing three-dimensional perforated models to dynamically control the supply air ratios at each perforation based on pressure differences, enabling us to investigate the distribution of pressure fields, velocity fields, temperature fields, and relative humidity fields in both wet and dry channels. Additionally, our aim is to analyze the mechanisms of heat and humidity transfer. The implementation of a design for an indirect evaporative cooler with adjustable perforation shape, size, and position allows for the establishment of a performance test platform in the enthalpy difference laboratory. This platform aims to investigate how different perforation parameters affect the cooler’s performance under various operating conditions.
Electronic supplementary material
Below is the link to the electronic supplementary material.
Author contributions
X.L. wrote the main manuscript text.C.J.proposed the framework of the manuscript.Y.L. and S.L.participated in the analysis of experimental data.All authors reviewed the manuscript.
Data availability
The data that support the findings of this study are available provided within the supplementary information files.
Declarations
Competing interests
The authors declare no competing interests.
Footnotes
The original online version of this Article was revised: The original version of this Article contained an error in the spelling of the author Siqiang Lu which was incorrectly given as Siqiang Lyu. In addition, the author Chengjun Jing was incorrectly duplicated.
Publisher’s note
Springer Nature remains neutral with regard to jurisdictional claims in published maps and institutional affiliations.
Change history
2/25/2025
A Correction to this paper has been published: 10.1038/s41598-025-91169-8
References
- Ala Hasan, Indirect evaporative cooling of air to a sub-wet bulb temperature, Applied Thermal Engineering 30 (2010) 2460–2468.
- S.Anisimov, D.Pandelidis. Numerical study of the Maisotsenko cycle heat and mass exchanger. Int J Heat Mass Transf, 2014(75):75–96.
- S.Anisimov, D.Pandelidis. Numerical study of perforated indirect evaporative air cooler. International Journal of Energy for a Clean Environment, 2011(12):239–250.
- ASHRAE. Fundamentals, American Society of Heating, Refrigeration and Air Conditioning Engineers, USA; 1997. [PMC free article] [PubMed]
- Baehr HD, Stephan K. Heat and mass transfer. Berlin: Springer-Verlag; 1998.N.J. Park, Trans.
- Y.A Cengel, Heat and Mass Transfer: A Practical Approach, Mc Graw-Hill Companies, Inc., Singapore, 2006.
- Chen, Yi., Yang, Hongxing., Indirect evaporative cooler considering condensation from primary air: Model development and parameter analysis, Building and Environment, Vol.95 (2016), pp. 330–345.
- X.Cui, K.J Chua, W.M Yang, K.C Ng, K.Thu, V.T Nguyen. Study the performance of an improved dew-point evaporative design for cooling application. Applied Thermal Engineering 63 (2014) 624–633.
- H.S Dizaji, E.J. Hu, L. Chen, S. Pourhedayat, Analytical/experimental sensitivity study of key design and operational parameters of perforated Maisotsenko cooler based on novel wet-surface theory, Applied Energy 262 (2020) 114557.
- H.S Dizaji, E.J. Hu, L. Chen, S. Pourhedayat, Development and validation of an analytical model for perforated (multi-stage) regenerative M-cycle air cooler, Applied Energy 228 (2018) 2176–2194.
- Liu X, Jing C, Zhao Y, et al. Numerical study on performance of the dew point evaporative cooling system[J]. Journal of Thermal Science and Technology, 2021, 16(3).
- M.H Mahmood, M.Sultan, T.Miyazaki, S.Koyama, V.S Maisotsenko. Overview of the Maisotsenko cycle- A way towards dew pointevaporative cooling. Renewable and Sustainable Energy Reviews 66 (2016) 537–555.
- T. Miyazaki, A. Akisawa, A. I Nikai, The cooling performance of a building integrated evaporative cooling system driven by solar energy, Energy and Buildings 43 (2011) 2277–2278.
- D.Pandelidis, S.Anisimov, W.M Worek. Comparison study of the counter-flow regenerative evaporative heat exchangers with numerical methods. Applied Thermal Engineering 84 (2015) 211–224.
- J.O Seung, W.S Muhammad, B Muhammad, C Wongee, K.J Chua, M KumJa, C.N Kim. Approaches to energy efficiency in air conditioning: A comparative study on purge configurations for indirect evaporative cooling.Energy, 2019(168):505–515.
- M.W shahzad, M. Burhan, D.Ybyraiymkul, S.J Oh, K.C Ng. An improved indirect evaporative cooler experimental investigation. Applied Energy 256 (2019) 113934.
- D.Q. Zenga, H. Li, Y.J. Dai, A.X. Xie. Numerical analysis and optimization of a solar hybrid one-rotor two-stage desiccant cooling and heating system. Applied Thermal Engineering 73 (2014) 474–483.
- L.H Zhang, X. Ma, Y.X Wang, R. Song, J. J Li, W. C Yuan, S. S Zhang, The increasing district heating energy consumption of the building sector in China: Decomposition and decoupling analysis, Journal of Cleaner Production, Volume 271,2020,122696.
Associated Data
This section collects any data citations, data availability statements, or supplementary materials included in this article.
Supplementary Materials
Data Availability Statement
The data that support the findings of this study are available provided within the supplementary information files.