

Abstract
It is well known that elite athletes of specific ethnicities and/or nationalities dominate certain sports disciplines (e.g., East Africans in marathon running). However, we do not know the nationalities of the fastest non-professional IRONMAN triathletes. Therefore, this study intended to identify the fastest athletes by country of origin competing in IRONMAN triathlon events, focusing on non-professional age group triathletes. Data from all IRONMAN age group athletes competing worldwide between 2002 and 2022 in all official IRONMAN races were collected. Sex, age group, country of origin of the athletes, location and year of the event, split times, overall race times, and transition times were obtained. Additionally, the dataset was augmented with specific data (i.e. event characteristics such as temperatures for water and air and course characteristics for all three split disciplines) related to the different race locations. We limited the analysis to the top 150 countries by participation (i.e. countries with at least 13 successful finishers records in the sample). A total of 677,320 records of IRONMAN age group triathletes originating from 150 different countries and participating in 443 races over 65 different locations were analyzed. European countries such as Germany, Austria, Denmark, Belgium, Switzerland, Norway, Czechia, Estonia, and Slovenia have the fastest IRONMAN age group athletes. IRONMAN Hawaii, IRONMAN Vitoria-Gasteiz and IRONMAN Hamburg are the fastest races. Hilly running and cycling race courses led to slower race times, while flat surfaces, rolling cycling and ocean swimming led to faster race times. Optimal water temperatures were found at 23–25 °C and optimal air temperature ranged between 19–21 and 25–28 °C. The fastest IRONMAN age group triathletes from European countries such as Germany, Austria, Denmark, Belgium, Switzerland, Norway, Czechia, Estonia, and Slovenia. With the presented results for optimal air and water temperatures and description of the optimal cycling and running course characteristics, IRONMAN age group athletes might be able to select an IRONMAN race with the best conditions in order to achieve a fast IRONMAN race time.
Keywords: Swimming, Cycling, Running, Multisport, Nationality
Subject terms: Environmental sciences, Environmental social sciences
Introduction
Comparative studies have been recurrent in sports science1,2. Generally, these studies are used to verify the performance of countries in different sports disciplines, including the world championships and Olympic Games2. Previous literature has indicated that some countries represent a higher likelihood of being successful in specific sports disciplines, such as basketball in the United States (US)3, Kenya and Ethiopia in long-distance running events4, and Canada in hockey events5. These higher probabilities are related to several factors, including social, economic, cultural, and environmental characteristics6–8.
Usually, these approaches associate the performance of these countries in the most important championships worldwide, to verify those achieving outstanding performance2. Even though most of the studies are developed in the context of elite sports, the popularity of sports among countries also presents important indicators regarding the popularity of sports among nonprofessional athletes9, and the importance of the sport among residents. For example, for endurance sports, previous literature has shown that running is part of the culture of East African countries, also influencing the practice among nonprofessional athletes10,11.
For endurance sports, triathlon events have increased among nonprofessional participants12, especially influenced by events held in the United States, such as the Ironman Hawaii13. The sport became popular among adults of both sexes and different age groups, engaging in this activity with different purposes, including health and well-being benefits, as well as to improve physical capacities and participate in competitions14,15. Previous literature investigating the most successful countries among elite triathletes showed that athletes from the United States presented the best performance, as well as the highest frequency of competitors, and age of peak performance16,17.
Understanding the age demographics of world-class IRONMAN triathletes who emerge victorious and stand out as the fastest is crucial for several reasons18. First, it provides valuable information on the optimal age range for peak athletic performance in long-distance triathlons, offering guidance to both aspiring and experienced athletes on when their training efforts may yield the best results. Additionally, such knowledge helps sports scientists, coaches, and trainers tailor training regimens that consider age-specific physiological changes, helping athletes maximize their potential while minimizing the risk of injury. Moreover, recognizing the age groups dominating IRONMAN competitions contributes to a deeper understanding of the sport’s evolving dynamics and may influence the development of age-specific talent pipelines or training programs19,20. In general, investigating the age demographics of top-performing IRONMAN athletes enhances our understanding of the physiological nuances of the sport and has practical implications for optimizing training strategies across different age cohorts.
Despite the evidence that indicates higher participation and performance indicators among professional athletes from the USA16, these results present important limitations. The most important aspect refers to the different methodological approaches used among different studies, which impair the generalization of the findings; also, the time frame should be considered, in association with the greater interest in studying professional athletes21–23. Understanding the nuanced interplay of biopsychosocial factors and the intricate balance between intrinsic and extrinsic motivation is crucial when delving into the realms of elite performance in both professional and nonprofessional athletes24. The assertion that these factors differ significantly between the two categories raises pertinent questions about the dynamics that influence athletic peak achievements in diverse contexts25. In professional athletes, factors such as genetic predispositions, access to high-level coaching, and optimal training environments may take precedence, while nonprofessional athletes may be driven by personal goals, societal expectations, and the pursuit of holistic well-being.
Researching and identifying the countries from which the fastest non-professional IRONMAN triathletes emerge, along with their age groups, is of significant importance for several reasons. Firstly, such information provides valuable insight into the global distribution of talent in the sport, allowing for a more comprehensive understanding of the geographical patterns of high-performance triathletes outside the professional realm26. This knowledge can be instrumental in the formation of training programs, talent identification strategies, and the allocation of resources within different nations. Second, analyzing the age groups of the fastest non-professional IRONMAN triathletes offers critical data on the optimal stages of life for achieving peak performance in this demanding endurance sport. This information can guide coaches, trainers, and athletes in tailoring training regimens that consider age-related physiological changes and potential peak performance windows27,28. It also helps in the development of age-specific training methodologies to optimize athletic potential at various stages of life. In addition, understanding the demographics of nonprofessional IRONMAN triathletes contributes to a wider promotion of sport and the adoption of a healthy and active lifestyle. Highlighting the diverse age groups and nationalities of successful participants encourages a broader population to participate in triathlons, fostering a sense of inclusivity and inspiration for aspiring athletes.
In summary, researching the countries and age groups of the fastest nonprofessional IRONMAN triathletes is essential for shaping targeted training approaches, fostering global sporting development, and promoting the sport’s inclusivity and accessibility to individuals of all ages and backgrounds26,29. Despite the importance of professional athletes for the representativeness of the countries at the national level, nonprofessional athletes should be studied to amplify the evidence regarding the fastest countries. Therefore, the purpose of this study was to identify the age group of athletes of the fastest countries competing in IRONMAN events between 2002 and 2020. Based upon existing knowledge we hypothesized that the fastest IRONMAN age group triathletes would also originate from the USA.
Methods
Ethical approval
This study was approved by the Institutional Review Board of Kanton St. Gallen, Switzerland, with a waiver of the requirement for informed consent of the participants as the study involved the analysis of publicly available data (EKSG 01/06/2010). The study was conducted following recognized ethical standards according to the Declaration of Helsinki adopted in 1964 and revised in 2013.
Data set and data preparation
Race data from all official IRONMAN races was downloaded from the official IRONMAN website (www.ironman.com) using a Python script. The sex, age group, country of origin of the athletes, location and year of the event, and times for swimming, running, cycling, overall race times, and transition were therefore obtained. The data was inspected for consistency, removing duplicate and/or incomplete records. Similarly, the event location variable was harmonized to map generic values to their actual location. Race times were re-calculated to hours and are expressed with two decimal digits. Additional location specific data was added and merged with the race data, including average air and water temperatures in °Celsius (in integer form, that is, without any decimals), and the type of race course in each split discipline as categorical variables, including the values of rolling, hilly, and flat for the bike and run race courses, and lake, ocean, river, bay, reservoir for the different swim courses. The race records were separately aggregated by event location and by country, to produce two large ranking tables sorted by number of race records (i.e. participation). In doing so, we identified up to 228 different countries in the original data sample, many of them with 1, 2 or 3 records and hence with no statistical interest. We then decided to limit the analysis to the top 150 countries by number of records, which account for 99.94% of the full sample and includes countries with at least 13 race records, while eliminating noise, which is in turn good for computing, interpretation, and overall interest. After the pre-processing and merging of the data, the final dataset consisted of a total of 677,320 finishers´ records (i.e. 544,632 from men and 132,688 from women) from the top 150 countries by number of records, participating in 443 events over 65 different locations between 2002 and 2022.
Statistical analysis
Normality of the race time distributions by sex was checked by visual inspection of race time histograms and calculation of Gaussian overlapping curves. The statistical values of the overall race times (i.e. mean, std, max, and min) were calculated for each of the 65 locations and 150 countries and are displayed in the large ranking tables. The event location ranking table includes specific race course data, including the average air and water temperatures, and the type of race course. An analysis of the race performance by type of race course was done and the results are shown in the form of boxplot charts and accompanying 2-way ANOVA tests that suggest the statistical significance of the different types of swim, bike, and run race courses. The significance level was set at 0.05 in all cases. Several predictive modelling algorithms were tested, including a Multivariate Linear Regressor (MLR) and three Machine Learning (ML) Regressors, a Decision Tree, a Random Forest and a XG Boost Regressor. The predicted variable (i.e. target) was the overall race time (in hours) whilst a total of 17 predictors (i.e. features or factors) were used, including a number of categorical variables that had to be encoded before they could be used with the models. The variable sex (men/women) is encoded as 0 = women and 1 = men. The age group variable is encoded as an integer, representing 5-year groups, with group 18 representing less than 20 years, group 20 from 20 to 24, group 25 from 25 to 29, etc. until group 75 which includes any triathletes older than 75 years of age. The country and event location variables are encoded based on their position in the ranking lists, sorted by participation, and starting with zero. The event location average air and water temperature variables, of numerical type, are used as they are reported on the website of the organizers. The three categorical variables (i.e. swim, bike and run) are converted into dummy variables (binary flags) indicating the presence with 1 and absence with 0, becoming a set of 11 binary variables. Given the large size of the dataset, a hold-out test strategy was used, with 25% of the dataset reserved for model evaluation: 507,076 race records were used for model training, and 169,026 for model evaluation. For each of these models, the Mean Absolute Error (MAE) and the coefficient of determination (R2) were calculated. After training, evaluating, and comparing the three models, XG Boost emerged as the best performer and we present only the results from XG Boost. Model interpretability tools like SHAP or PDP libraries were used to further understand how, according to the models, each predictor influenced the race finish time. All data processing and analysis were performed using Python (www.python.org/) and a Google Colab notebook (https://colab.research.google.com/).
Results
A total of 677,320 IRONMAN finishers´ records (544,632 from men and 132,688 from women) from the top 150 countries by number of records, participating in 443 IRONMAN events over 65 different locations between 2002 and 2022 were analyzed.
Distributions of race finish times by sex
Figure 1 shows the original histograms (bins = 100) of the IRONMAN overall race times by sex, along with calculated (overlapped) Gaussian envelopes.
Fig. 1.

Distribution of age groups by sex.
Ranking tables of event locations and tri-athletes’ countries of origin
The country (Table 1) and the event location (Table 2) ranking tables below show the statistical details of the 150 countries of origin and the 65 race locations considered in this study. The tables are sorted by number of records, so countries (or event locations) with higher participation are at the top. Overall race time statistical values (mean, std, min and max) are displayed in hours, and the mean overall race time column is color coded, with darker cells indicating lower (better) race times. The event location table additionally shows the characteristics of each race course, through the categorical variables swim, bike, run, and the average temperatures for water (°C) and air (°C).
Table 1.
List of origin of the athletes sorted by country with the number of finishers. The race times are color-coded where darker fields represent faster race times.


Table 2.
List of races sorted by the number of finishers. The race times are color-coded where darker fields represent faster race times.


Most of the athletes originated from the USA, followed by United Kingdom, Canada, Australia, Germany, France, Spain, Sweden, Brazil, Austria, and Italy for the 10 first countries.
Figure 2 shows the difference between women and men regarding the race course characteristics for swimming with swimming in a bay, in the ocean, a river, a lake or a reservoir where men were always faster than women. Also for cycling and running (i.e. flat, rolling, or hilly), men were always faster than women.
Fig. 2.

Differences between women and men considering race course characteristics.
Multi linear regression (MLR) ordinary least squares (OLS) regressor
The OLS MLR model (Table 3) obtains a R2 score of 0.128 and the analysis indicates all features have a statistically significant effect on the finish time variable (p < 0.05). No differentiation is made between test and train subsets for the MLR, but the full sample is used for training and evaluation (in-sample testing).
Table 3.
Results of the OLS linear regressor.
| Dep. Variable: | FinishTime | R-squared: | 0.128 |
|---|---|---|---|
| Model: | OLS | Adj. R-squared: | 0.128 |
| Method: | Least Squares | F-statistic: | 7079 |
| Prob (F-statistic): | 0.00 | ||
| No. Observations: | 677,320 | ||
| Df Residuals: | 677,305 | ||
| Df Model: | 14 |
| coef | t | P >|t| | |
|---|---|---|---|
| const | 6.8208 | 655.161 | 0.000 |
| Sex_ID | −0.8765 | −168.384 | 0.000 |
| AgeGroup_ID | 0.0385 | 177.219 | 0.000 |
| Country_ID | −0.0043 | −22.570 | 0.000 |
| EventLocation_ID | −0.0004 | −2.226 | 0.026 |
| Water (°C) | 0.0240 | 25.732 | 0.000 |
| Air (°C) | −0.0392 | − 51.199 | 0.000 |
| Swim_bay | 1.1064 | 148.235 | 0.000 |
| Swim_lake | 1.3009 | 261.018 | 0.000 |
| Swim_ocean | 1.0703 | 198.373 | 0.000 |
| Swim_reservoir | 1.6712 | 130.301 | 0.000 |
| Swim_river | 1.6719 | 234.717 | 0.000 |
| Run_flat | 1.9114 | 300.527 | 0.000 |
| Run_hilly | 2.6612 | 290.393 | 0.000 |
| Run_rolling | 2.2482 | 360.031 | 0.000 |
| Bike_flat | 2.3145 | 417.152 | 0.000 |
| Bike_hilly | 2.4471 | 508.297 | 0.000 |
| Bike_rolling | 2.0591 | 451.106 | 0.000 |
Decision tree and random forest regressors
The first two ML models, attempted over several configurations, obtained best values of MAE of 1.27 and 1.26 h, respectively. They both obtain a best R2 score of 0.25. This is an improvement over the linear MLR model, but still a low R2 score (weak effect) by any measure.
XG boost regressor
The XGB model is built with 50 estimators, max depth of 9 and learning rate of 0.3, to obtain a R2 score of 0.27 over the 25% held-out test set. Whilst the highest score of the three ML models tested, this is still a low R2 score meaning the model can only explain 27% of the variability in the predicted variable, and that more predictors should be considered, if any predictive expectations are to be had. But we can still use the tools in our model interpretability toolset to look for insights into what the model learnt.
SHAP values and features importances for the XG boost model
The SHAP aggregated values chart in Fig. 3 shows how each predicting variable influences the model output, with the factors rated as more important at the top. The country of origin is the most important predictor. The variable age group comes up as the second most important feature but the one that best separates data points. Red dots (i.e. high or older age groups) contribute positively to the race time, whilst shades of purples and blues increasingly move to the left, deducting from the race times. Sex and the location of the event are the next most important predictors. Further down but with clear separation of red and blue data points, hilly running and cycling race courses add to race time (i.e. slower race times), whilst flat surfaces, rolling cycling and ocean swimming deduct from it (i.e. faster race times).
Fig. 3.

SHAP aggregated values for XG Boost Regression model.
Partial dependence plots (PDP) of the XG boost model
The PDP chart is another tool we have to look into our model. PDP charts show how the output of the model varies for each numerical predicting variables (features or factors). According to the XG Boost model PDP charts, men are on average ~ 0.8 h faster than women (Fig. 4), and the fastest athletes are aged 25—34 years (Fig. 5). The XGBoost model shows that a representative set of European countries including Germany, Austria, Denmark, Belgium, Switzerland, Norway, Czechia, Estonia, and Slovenia are the fastest. The USA and a group of Asian countries including Philippines, Malaysia, and Thailand appear to be the slowest (Fig. 6). IRONMAN Hawaii is the IRONMAN race location with the fastest race times, but also IRONMAN Vitoria-Gasteiz and IRONMAN Hamburg are singled out by the XG Boost model among the fastest race courses (Fig. 7). Regarding temperatures, optimal air temperature ranged at 19–21 or 25–28°Celsius (Fig. 8), and optimal water temperatures at 23–25°Celsius (Fig. 9).
Fig. 4.

PDP charts for sex.
Fig. 5.

PDP charts for age group.
Fig. 6.

PDP charts for country of origin of the athletes.
Fig. 7.

PDP charts for the location where the race was held.
Fig. 8.

PDP charts for ambient air temperature during race day.
Fig. 9.

PDP charts for water temperature in the swim course during race day.
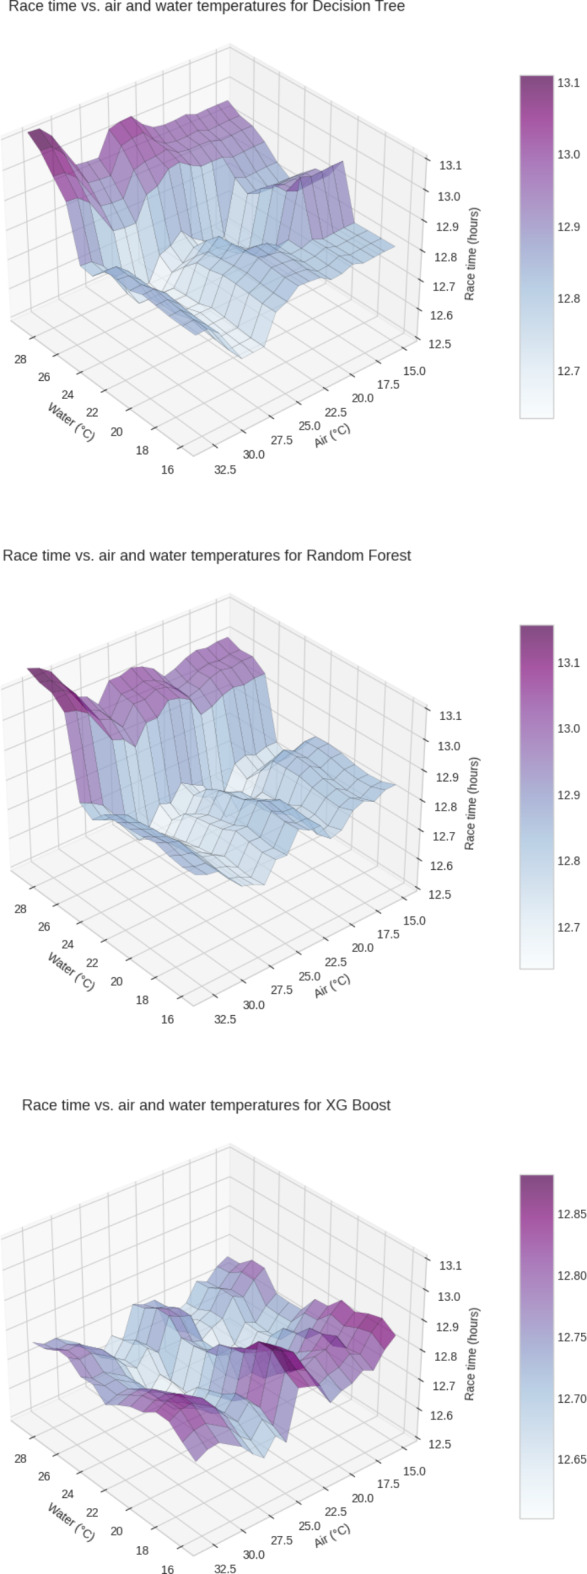
Air and water temperature versus race time—3D interaction charts by model
Figure 10 is an interesting set of 3D charts comparing how each of the three ML models “has learnt” the partial dependence of the race time (target) with the air and water temperature variables together. The third and best performing XG Boost model shows a more detailed (higher resolution) PDP chart.
Fig. 10.
3D interaction air and water temperature with race time.
Discussion
This study aimed to identify the dominant nationalities for nonprofessional IRONMAN triathlon competitions between 2002 and 2020 with the hypothesis that the fastest IRONMAN age group triathletes would originate from the USA. The most important findings were (i) European countries (i.e. Germany, Austria, Denmark, Belgium, Switzerland, Norway, Czechia, Estonia, and Slovenia) have the fastest athletes, (ii) IRONMAN Hawaii, IRONMAN Vitoria-Gasteiz and IRONMAN Hamburg are the fastest races, (iii) optimal air temperature for cycling and running ranged between 19 °C and 21 °C or at 25–28 °C and optimal water temperature for swimming was at 23–25 °C, (iv) the fastest athletes were 25–34 years old, and (v) men were ~ 0.9 h faster than women. The discussion of these findings is challenging, especially due to the lack of evidence in the scientific literature. However, the main finding highlights the importance of adopting similar approaches in order to identify the most successful countries in sports competitions.
European athletes were the fastest
Our first important finding was that European IRONMAN triathletes were the fastest and we could, therefore, not confirm our hypothesis. Unlike the present findings, previous studies investigating the amateur IRONMAN triathletes competing in IRONMAN Hawaii showed that those from North America showed the best results, finishing among the top five athletes23. In this study, the authors considered the total number of participants and the number of athletes in the top five for both sexes, which can be influenced by the place of competition23. The hosting effect has been discussed in the scientific literature as an important performance determinant, especially for family support, fans, and familiarization with environmental characteristics30,31. However, hosting effects are specific for some sports32, demanding additional efforts to understand the hosting effect in triathlon competitions.
We considered only the 150 best countries. These results should be considered in light of the limitations of the study. For example, we consider the mean values to determine the fastest country, which does not represent the totality of the athletes. Therefore, adopting a country-level analysis has important practical implications for the sports sectors in these countries, especially considering the interest of the population in the practice. No previous studies that investigated the fastest nationalities among IRONMAN triathletes found similar results23,33, which impairs the comparisons. However, some similarities between the countries should be considered: the three countries are part of the Northern region, presenting similar population size and economic characteristics. These similarities can influence the sports practice among the adult population and reflect the results achieved at triathlon competitions.
For the top countries by the number of age group records, Germany, Austria, Denmark, Belgium, Switzerland, Norway, Czechia, Estonia, and Slovenia were the fastest. These results are similar to those found by professional IRONMAN 70.3 triathletes21. The emergence of Germany, Austria, Denmark, Belgium, Switzerland, Norway, Czechia, Estonia, and Slovenia within the IRONMAN context may be attributed to a combination of unique factors such as geography, climate, and culture34,35. Many participants are drawn to IRONMAN triathlons as a means to improve their physical capabilities, seeking personal growth and the satisfaction of overcoming a multifaceted challenge36. The competitive aspect also plays a role, with participants aiming to test their limits, set personal records, and, in some cases, compete in organized events. This broader inclusivity, coupled with the diverse motivations behind participation, underscores the evolving and accessible nature of triathlons in contemporary society.
The fastest race courses
A further important finding was that IRONMAN Hawaii was the fastest race course, followed by European race courses such as IRONMAN Vitoria-Gasteiz and IRONMAN Hamburg. The finding that IRONMAN Hawaii is the fastest race course for age group athletes is explained by the fact that IRONMAN Hawaii is the World Championship for IRONMAN triathletes37 where only the best triathletes can compete after qualification for the IRONMAN World Championship38.
The aspect of environmental conditions
An important finding was that optimal air temperature ranged between 19 °C and 21 °C or at 25–28 °C and optimal water temperature was at 23–25 °C. To date, we have no specific knowledge for the ‘best’ temperatures to compete in an IRONMAN triathlon. It is, however, well known that environmental conditions have a considerable influence on endurance performance in running39 and triathlon40 where especially high temperatures impair endurance performance41. Regarding IRONMAN Hawaii, it has been reported that body core temperature increased during the marathon where an increase in body core temperature appeared to make triathletes run more slowly42. The present study shows the optimum race temperatures for both cycling and running where athletes can now select the most appropriate race course for a fast IRONMAN race time.
Regarding water temperature, it is well known that water temperature has a direct effect on swimming performance43. However, little is described in the scientific literature. A very recent study reported that swimming in a river had in female triathletes a greater effect on overall race time than cycling or running40. Whit the present findings, triathletes can also better select an IRONMAN race regarding the swim course temperatures and the influence on overall race time.
The influence of race course characteristics
A last important finding was the IRONMAN race course characteristic had a considerable influence on overall race time where slower race times were achieved with hilly cycling and running courses whilst flat surfaces, rolling cycling and ocean swimming were leading to faster race times. It is well known that the running surface has an influence on running performance especially regarding running-related injuries44,45. Also in cycling, race course characteristics show an influence on race performance46 where especially ascents slow cyclists down47. Changes in elevation during an IRONMAN race have also an influence on pacing during the cycling split48 where downhill segments show an important influence49. The present findings may help IRONMAN triathletes to select an appropriate IRONMAN race for their personal achievements.
Limitations
Despite the use of a data set of nearly 700,000 IRONMAN triathletes and the large time frame of 20 years, we are not sure whether all races correctly measured their split distances. Furthermore, since thousands of athletes compete in an IRONMAN race, athletes can cycle in packages during the cycling split50, although drafting in cycling in an IRONMAN race is not allowed. Drafting while cycling can considerably improve performance, reduce the cycling split time, and improve the subsequent running split performance51. The biopsychosocial factors and intrinsic and extrinsic motivation that led to elite performance in professional and nonprofessional athletes are different. It is extremely important to differentiate and highlight this in the research problem and justification. This could even be the objective of future research. In another way, by analyzing and comparing the athletic achievements of different countries in these events, researchers can discern patterns, trends, and potential influencing factors that contribute to superior athletic performance52. These findings not only contribute to understanding the competitive dynamics within the IRONMAN community but also have broader implications for sports science, training methodologies, and potentially national-level athletic development strategies27. Further, the study may serve as a foundation for future research, helping athletes, coaches, and sports enthusiasts improve their understanding of the factors that contribute to success in this challenging endurance sport.
Conclusion
In summary, we found that IRONMAN age group athletes from European countries such as Germany, Austria, Denmark, Belgium, Switzerland, Norway, Czechia, Estonia, and Slovenia have the fastest IRONMAN race times although IRONMAN Hawaii is the fastest race course worldwide, most likely due to the fact that IRONMAN Hawaii is the IRONMAN World Championship. With the presented results for optimal air and water temperatures and the description of the optimal cycling and running course characteristics, IRONMAN age group athletes might be able to select an IRONMAN race with the best conditions in order to achieve a fast IRONMAN race time.
Author contributions
Conceptualization: Beat Knechtle. Data curation: Beat Knechtle, Elias Villiger. Formal analysis: David Valero. Methodology: Beat Knechtle. Writing – original draft: Beat Knechtle, Mabliny Thuany. Writing – Editing: Katja Weiss, Thomas Rosemann, Pantelis T. Nikolaidis, Rodrigo Luiz Vancini, Marilia Santos Andrade.
Data availability
For this study, we have included official results and split times from the official IRONMAN® website (www.ironman.com) The data sets used and/or analyzed during the current study are available from the corresponding author upon reasonable request.
Declarations
Ethics approval
This study was approved by the Institutional Review Board of Kanton St. Gallen, Switzerland, with a waiver of the requirement for informed consent of the participants as the study involved the analysis of publicly available data (EKSG 01/06/2010). The study was conducted in accordance with recognized ethical standards according to the Declaration of Helsinki adopted in 1964 and revised in 2013.
Competing interests
The authors declare no competing interests.
Footnotes
Publisher’s note
Springer Nature remains neutral with regard to jurisdictional claims in published maps and institutional affiliations.
References
- 1.Carpenter, J., Frank, R. & Huet-Vaughn, E. Gender differences in interpersonal and intrapersonal competitive behavior. J. Behav. Exp. Econ.77, 170–176. 10.1016/j.socec.2018.10.003 (2018). [Google Scholar]
- 2.Choi, Y. H., Wei, Q., Zhang, L. & Choi, S.-J. The impact of cultural distance on performance at the summer olympic games. SAGE Open12(1), 21582440221085264. 10.1177/21582440221085265 (2022). [Google Scholar]
- 3.Berri, D. J., Deutscher, C. & Galletti, A. Born in the USA: National origin effects on time allocation in US and Spanish professional basketball. Natl. Inst. Econ. Rev.232, R41–R50. 10.1177/002795011523200105 (2015). [Google Scholar]
- 4.World Athletics. What it takes to become a Kenyan distance champion: World Athletics, 2022 [cited 2022 20 August]. Available from: https://worldathletics.org/be-active/performance/kenyan-distance-running-reasons-success
- 5.Wattie, N., Schorer, J. & Baker, J. Seeing the forest but not the trees: Heterogeneity in community size effects in Canadian ice hockey players. J. Sports Sci.36(4), 436–444. 10.1080/02640414.2017.1313444 (2018). [DOI] [PubMed] [Google Scholar]
- 6.Cote, J., Macdonald, D., Baker, J. & Abernethy, B. When, “where” is more important than “when": Birthplace and birthdate effects on the achievement of sporting expertise. J. Sports Sci.24(10), 1065–1073. 10.1080/02640410500432490 (2006). [DOI] [PubMed] [Google Scholar]
- 7.Rossing, N. N., Stentoft, D., Flattum, A., Côté, J. & Karbing, D. S. Influence of population size, density, and proximity to talent clubs on the likelihood of becoming elite youth athlete. Scand. J. Med. Sci. Sports28(3), 1304–1313. 10.1111/sms.13009 (2018). [DOI] [PubMed] [Google Scholar]
- 8.Hancock, D. J., Coutinho, P., Côté, J. & Mesquita, I. Influences of population size and density on birthplace effects. J. Sports Sci.36(1), 33–38. 10.1080/02640414.2016.1276614 (2018). [DOI] [PubMed] [Google Scholar]
- 9.Kasović, M., Škrinjarić, B. & Štefan, L. Macro and meso indicators of success pertaining to European countries in elite triathlon. Int. Sci. J. Kinesiol.13(2), 49–56 (2020). [Google Scholar]
- 10.Bale, J. Kenyan running before the 1968 Mexico Olympics. In East African Running (ed. Francis, T.) (Routledge, 2007). [Google Scholar]
- 11.Bale, J. & Sang, J. Kenyan Running: Movement Culture, Geography and Global Change 1st edn. (Routledge, 1996). [Google Scholar]
- 12.Poczta, J. & Malchrowicz-Mosko, E. Mass triathlon participation as a human need to set the goals and cross the borders. How to understand the triathlete?. Olimpianos J. Olympi. Stud.8, 9. 10.30937/2526-6314.v4.id114 (2020). [Google Scholar]
- 13.Dähler, P., Rüst, C., Rosemann, T., Lepers, R. & Knechtle, B. Nation related participation and performance trends in ‘Ironman Hawaii’ from 1985 to 2012. BMC Sports Sci. Med. Rehabil.6, 16. 10.1186/2052-1847-6-16 (2014). [DOI] [PMC free article] [PubMed] [Google Scholar]
- 14.Poczta, J. & Malchrowicz-Mośko, E. From half-marathon to triathlon: sports participation as a reflection of post-materialism processes in polish society. Olimpianos J. Olympic Stud.5, 141–151. 10.30937/2526-6314.v5.id128 (2021). [Google Scholar]
- 15.Sousa, C. V., Nikolaidis, P. T. & Knechtle, B. Ultra-triathlon-Pacing, performance trends, the role of nationality, and sex differences in finishers and non-finishers. Scand. J. Med. Sci. Sports30(3), 556–563. 10.1111/sms.13598 (2020). [DOI] [PubMed] [Google Scholar]
- 16.Rüst, C. A. et al. Nation related participation and performance trends in ‘Norseman Xtreme Triathlon’ from 2006 to 2014. SpringerPlus4(1), 469. 10.1186/s40064-015-1255-5 (2015). [DOI] [PMC free article] [PubMed] [Google Scholar]
- 17.Stiefel, M., Knechtle, B., Rüst, C. A., Rosemann, T. & Lepers, R. The age of peak performance in Ironman triathlon: A cross-sectional and longitudinal data analysis. Extreme Physiol. Med.2(1), 27. 10.1186/2046-7648-2-27 (2013). [DOI] [PMC free article] [PubMed] [Google Scholar]
- 18.Haugen, T. A. et al. Peak age and performance progression in world-class track-and-field athletes. Int. J. Sports Physiol. Perform.13(9), 1122–1129 (2018). [DOI] [PubMed] [Google Scholar]
- 19.Stevenson, J. L., Song, H. & Cooper, J. A. Age and sex differences pertaining to modes of locomotion in triathlon. Med. Sci. Sports Exerc.45(5), 976–984. 10.1249/MSS.0b013e31827d17eb (2013). [DOI] [PubMed] [Google Scholar]
- 20.Piacentini, M. F., Vleck, V. & Lepers, R. Effect of age on the sex difference in Ironman triathlon performance. Movement Sport Sci.10.1051/sm/2019030 (2019). [Google Scholar]
- 21.Thuany, M. et al. A machine learning approach to finding the fastest race course for professional athletes competing in Ironman® 703 races between 2004 and 2020. Int. J. Environ. Res. Public Health20(4), 3619. 10.3390/ijerph20043619 (2023). [DOI] [PMC free article] [PubMed] [Google Scholar]
- 22.Nikolaidis, P. T. et al. Predicting overall performance in Ironman 70.3 age group triathletes through split disciplines. Sci. Rep.13(1), 11492. 10.1038/s41598-023-38181-y (2023). [DOI] [PMC free article] [PubMed] [Google Scholar]
- 23.Puccinelli, P. et al. Origin and age group of the fastest amateur triathletes competing in ‘Ironman Hawaii’ between 2003 and 2019. Sports Med. Health Sci.10.1016/j.smhs.2023.07.008 (2023). [DOI] [PMC free article] [PubMed] [Google Scholar]
- 24.Thuany, M., Viljoen, C., Gomes, T. N., Knechtle, B. & Scheer, V. Mental health in ultra-endurance runners: A systematic review. Sports Med.53(10), 1891–1904. 10.1007/s40279-023-01890-5 (2023). [DOI] [PubMed] [Google Scholar]
- 25.Georgiades, E., Klissouras, V., Baulch, J., Wang, G. & Pitsiladis, Y. Why nature prevails over nurture in the making of the elite athlete. BMC Genom.18(8), 835. 10.1186/s12864-017-4190-8 (2017). [DOI] [PMC free article] [PubMed] [Google Scholar]
- 26.Collins, M. et al. The ACE gene and endurance performance during the South African Ironman Triathlons. Med. Sci. Sports Exerc.36(8), 1314–1320. 10.1249/01.mss.0000135779.41475.42 (2004). [DOI] [PubMed] [Google Scholar]
- 27.González-Ravé, J. M., Hermosilla, F., González-Mohíno, F., Casado, A. & Pyne, D. B. Training intensity distribution, training volume, and periodization models in elite swimmers: A systematic review. Int. J. Sports Physiol. Perform.16(7), 913–926. 10.1123/ijspp.2020-0906 (2021). [DOI] [PubMed] [Google Scholar]
- 28.Nieto-Jimenez, C., Ruso-Álvarez, J., Pardos-Mainer, E. E. & Orellana, J. N. La variabilidad de la frecuencia cardiaca en el control del entrenamiento en un corredor de Ironman. Estudio de caso (Heart Rate Varibility in the training monitoring of an Ironman runner. A case study. Retos37, 339–343. 10.47197/retos.v37i37.73873 (2020). [Google Scholar]
- 29.Nikolaidis, P. T., Kach, I., Rosemann, T. & Knechtle, B. The role of nationality on the pacing of ironman triathletes. Asian J. Sports Med.8(4), e57130. 10.5812/asjsm.57130 (2017). [Google Scholar]
- 30.Mölenberg, F. J. M., de Waart, F., Burdorf, A. & van Lenthe, F. J. Hosting elite sport events to target recreational sport participation: An interrupted time series analysis. Int. J. Sport Policy Polit.12(4), 531–543. 10.1080/19406940.2020.1839530 (2020). [Google Scholar]
- 31.Asgari, B. & Khorshidi, R. The effect of hosting on performance of host countries in summer and winter Olympic Games. Eur. J. Sports Exercise Sci.2(2), 1–6 (2013). [Google Scholar]
- 32.Forrest, D., McHale, I. G., Sanz, I. & Tena, J. D. An analysis of country medal shares in individual sports at the Olympics. Eur. Sport Manag. Quart.17(2), 117–131. 10.1080/16184742.2016.1248463 (2017). [Google Scholar]
- 33.Jürgens, D. et al. An analysis of participation and performance by nationality at “Ironman Switzerland” from 1995 to 2011. J. Sci. Cycl.1(2), 10–20 (2012). [Google Scholar]
- 34.Foley, R. Swimming in Ireland: Immersions in therapeutic blue space. Health Place35, 218–225. 10.1016/j.healthplace.2014.09.015 (2015). [DOI] [PubMed] [Google Scholar]
- 35.Britton, E. & Foley, R. Sensing water: Uncovering health and well-being in the sea and surf. J. Sport Social Issues45(1), 60–87. 10.1177/0193723520928597 (2021). [Google Scholar]
- 36.Çetin, A. Triathletes’ motivational dimensions for participation in ironman, and comparison of these factors with their life satisfaction and achievement perceptions. Int. J. Hum. Move. Sports Sci.7(3), 43–50. 10.13189/saj.2019.070301 (2019). [Google Scholar]
- 37.Knechtle, B. et al. Performance and pacing of professional IRONMAN triathletes: The fastest IRONMAN World Championship ever-IRONMAN Hawaii 2022. Sci. Rep.13(1), 15708. 10.1038/s41598-023-42800-z (2023). [DOI] [PMC free article] [PubMed] [Google Scholar]
- 38.Stiefel, M., Rüst, C. A., Rosemann, T. & Knechtle, B. A comparison of participation and performance in age-group finishers competing in and qualifying for Ironman Hawaii. Int. J. Gen. Med.6, 67–77. 10.2147/IJGM.S40202 (2013). [DOI] [PMC free article] [PubMed] [Google Scholar]
- 39.Mantzios, K. et al. Effects of weather parameters on endurance running performance: discipline-specific analysis of 1258 races. Med. Sci. Sports Exerc.54(1), 153–161. 10.1249/MSS.0000000000002769 (2022). [DOI] [PMC free article] [PubMed] [Google Scholar]
- 40.Zhao, J., Wu, Y. & Zhang, J. A study of triathletes’ race strategies in different competition environments. Heliyon10(8), e29454. 10.1016/j.heliyon.2024.e29454 (2024). [DOI] [PMC free article] [PubMed] [Google Scholar]
- 41.Bouscaren, N., Millet, G. Y. & Racinais, S. Heat stress challenges in marathon versus ultra-endurance running. Front Sports Act. Living13(1), 59. 10.3389/fspor.2019.00059 (2019). [DOI] [PMC free article] [PubMed] [Google Scholar]
- 42.Olcina, G., Crespo, C., Timón, R., Mjaanes, J. M. & Calleja-González, J. Core temperature response during the marathon portion of the ironman world championship (Kona-Hawaii). Front. Physiol.3(10), 1469. 10.3389/fphys.2019.01469 (2019). [DOI] [PMC free article] [PubMed] [Google Scholar]
- 43.Mougios, V. & Deligiannis, A. Effect of water temperature on performance, lactate production and heart rate at swimming of maximal and submaximal intensity. J. Sports Med. Phys. Fitness33(1), 27–33 (1993). [PubMed] [Google Scholar]
- 44.Jafarnezhadgero, A., Eskandari, S., Sajedi, H. & Dionisio, V. C. Long-term effects of running exercises on natural grass, artificial turf, and synthetic surfaces on ground reaction force components in individuals with overpronated feet: A randomized controlled trial. Gait Posture109, 28–33. 10.1016/j.gaitpost.2024.01.016 (2024). [DOI] [PubMed] [Google Scholar]
- 45.Mitchell, C., McDonnell, S., Oganezova, K., Mockler, D. & Fleming, N. The effect of surface compliance on overground running biomechanics. A systematic review and meta-analysis. Sports Biomech.10.1080/14763141.2023.2236058 (2023). [DOI] [PubMed] [Google Scholar]
- 46.Phillips, K. E. & Hopkins, W. G. Determinants of cycling performance: A review of the dimensions and features regulating performance in elite cycling competitions. Sports Med. Open6(1), 23. 10.1186/s40798-020-00252-z (2020). [DOI] [PMC free article] [PubMed] [Google Scholar]
- 47.Wells, M. S. & Marwood, S. Effects of power variation on cycle performance during simulated hilly time-trials. Eur. J. Sport Sci.16(8), 912–918. 10.1080/17461391.2016.1156162 (2016). [DOI] [PubMed] [Google Scholar]
- 48.Pryor, J. L. et al. Pacing strategy of a full ironman overall female winner on a course with major elevation changes. J. Strength Cond. Res.32(11), 3080–3087. 10.1519/JSC.0000000000002807 (2018). [DOI] [PubMed] [Google Scholar]
- 49.Johnson, E. C. et al. Bike and run pacing on downhill segments predict Ironman triathlon relative success. J. Sci. Med. Sport18(1), 82–87. 10.1016/j.jsams.2013.12.001 (2015). [DOI] [PubMed] [Google Scholar]
- 50.Allebosch, G., Van den Bossche, S., Veelaert, P. & Philips, W. Camera-based system for drafting detection while cycling. Sensors20(5), 1241 (2020). [DOI] [PMC free article] [PubMed] [Google Scholar]
- 51.Hausswirth, C. et al. Effect of two drafting modalities in cycling on running performance. Med. Sci. Sports Exerc.33(3), 485–492. 10.1097/00005768-200103000-00023 (2001). [DOI] [PubMed] [Google Scholar]
- 52.Knechtle, B., Rosemann, T. & Nikolaidis, P. The role of nationality in ultra-endurance sports: The paradigm of cross-country skiing and long-distance running. Int. J. Environ. Res. Public Health10.3390/ijerph17072543 (2020). [DOI] [PMC free article] [PubMed] [Google Scholar]
Associated Data
This section collects any data citations, data availability statements, or supplementary materials included in this article.
Data Availability Statement
For this study, we have included official results and split times from the official IRONMAN® website (www.ironman.com) The data sets used and/or analyzed during the current study are available from the corresponding author upon reasonable request.