

Abstract
The rapid expansion of IoT networks, combined with the flexibility of Software-Defined Networking (SDN), has significantly increased the complexity of traffic management, requiring accurate classification to ensure optimal quality of service (QoS). Existing traffic classification techniques often rely on manual feature selection, limiting adaptability and efficiency in dynamic environments. This paper presents a novel traffic classification framework for SDN-based IoT networks, introducing a Two-Level Fused Network integrated with a self-adaptive Manta Ray Foraging Optimization (SMRFO) algorithm. The framework automatically selects optimal features and fuses multi-level network insights to enhance classification accuracy. Network traffic is classified into four key categories—delay-sensitive, loss-sensitive, bandwidth-sensitive, and best-effort—tailoring QoS to meet the specific requirements of each class. The proposed model is evaluated using publicly available datasets (CIC-Darknet and ISCX-ToR), achieving superior performance with over 99% accuracy. The results demonstrate the effectiveness of the Two-Level Fused Network and SMRFO in outperforming state-of-the-art classification methods, providing a scalable solution for SDN-based IoT traffic management.
Keywords: Traffic classification, Software defined networking, Manta ray foraging optimization, Gradient neural network, Recurrent neural network, Spiking neural network
Subject terms: Engineering, Mathematics and computing
Introduction
The integration of SDN and the IoT has revolutionized network management by enabling centralized control, flexibility, and programmability in dynamic and heterogeneous environments1. IoT networks are made up of numerous interconnected devices that generate a variety of traffic models such as video streaming, sensor data, and machine-to-machine communications2. The rapid increase in IoT deployments accompanied by this diversity presents major challenges regarding network management, especially in terms of traffic classification3. The classification of traffic is essential to ensure QoS by correctly prioritizing and managing different types of network traffic4. Traditional traffic classification methods often rely on predetermined or static rules, alongside manual feature selection which makes them ineffective in dynamic SDN based IoT environments5. Therefore, there is need for better sophisticated adaptive and automatic techniques that can work with complex ever-changing patterns found within IoTs type of transmissions bursts6.
In this regard, the current study presents an innovative SDN-based IoT networks traffic classification framework that uses Two-Level Fused Network and SMRFO7. This proposed Two-Level Fused Network structure aims at obtaining multi-level insights into the network through deep learning techniques that take different data layer features as input and concatenate them together8. Consequently, the use of multiple layers of data yields a proper understanding of traffic behaviors which will allow for its classification into subcategories such as delay-sensitive traffic, loss-sensitive traffic, bandwidth-sensitive traffic, and best-effort traffic with very high precision9. Moreover, through the integration of SMRFO algorithm dynamic features can be chosen automatically thus improving its flexibility and effectiveness concerning traffic classification process10. Unlike traditional methods that are limited by their reliance on static features and predefined rules, the SMRFO algorithm continuously adapts to evolving network conditions by optimizing the selection of features that are most relevant for accurate traffic classification11.
The efficacy of the suggested Two-Level Fused Network using SMRFO is evidenced by comprehensive testing done on publicly accessed data sets like CIC-Darknet and ISCX-ToR12. As can be observed from the outcome, the performance metrics of the framework are impressive with an accuracy rate of over 99% surpassing current methods that classify traffic13. Such a high level of precision has been accomplished via leveraging deep learning to understand intricate patterns as well as optimizing SMRFO algorithm hence fitting into varied and dynamic data traffic conditions14. In addition to improving classification accuracy, the proposed architecture enhances the scalability and effectiveness of SDN-based IoT traffic management15. By introducing novel approaches bringing together deep learning with bio-inspired optimization, this study advances network traffic classification techniques while providing respective practical remedies for enhancing QoS to future IoT networks in general. The primary contribution is as follows:
In this framework the data is collected from different datasets and preprocessing is performed to clean the data.
The features are extracted by the Information gain approach which extracts the feature based on entropy.
After completing the feature extraction process, the feature selection is done by SMRFO which is employed to choose the best features from the retrieved features.
Finally, the selected features are passed to the two-level fused classifier for the traffic classification. The RNN and OSNN are combined to form the two-level fused classifier for the classification process.
The organization of the paper is as follows: section "Literature review" describes the recent work carried out for the Traffic classification in SDN and Section "Problem statement" includes the problem statement. Section "Proposed methodology" determines the proposed methodology and section "Results and discussion" provides the result and discussion. Finally, Section "Conclusion" is concluded with the conclusion part.
Literature review
Recent literature highlights advancements in traffic classification for SDN-based IoT networks, focusing on machine learning and deep learning techniques. In 2021, Ren et al.16 presented a tree structural recurrent neural network (Tree-RNN), which used the tree structure to split a huge classification into smaller classifications. Following division, a particular classifier was assigned to each minor classification. When several classifiers were used, Tree-RNN enhanced one another’s performance in classification, and the single classifier issue was resolved. Tree-RNN automatically learns the nonlinear relationship between input and output data without feature extraction because many classifiers were all end-to-end frameworks.
In 2021, D’Angelo and Palmieri17 proposed deep neural network architecture based on autoencoders, in which convolutional and recurrent neural networks were embedded in multiple autoencoders to extract pertinent information about the relationships between the fundamental features (spatial-features) and how they change over time (temporal-features). Machine learning-based classifiers effectively utilize such knowledge, which consists of novel qualities that are not immediately apparent and better represent the most obscure and representative traffic dynamics.
In 202, Liu et al.18 suggested BGRUA, a unique deep learning model, for precisely identifying online services that are operating via HTTPS connections. Bidirectional gated recurrent units (GRUs) and attention mechanisms were used by BGRUA to increase the categorization accuracy of HTTPS traffic. The forward and backward features of the byte sequences in a session were extracted using the bidirectional GRU. Features were given weights based on their contributions to categorization using the attention method.
In 2020, Bhatia et al.19 proposed a multi-level P2P traffic classification method that combines the advantages of statistical-based and heuristic approaches. Several heuristic rules for categorizing P2P traffic have been proposed by examining the behavior of different P2P applications. The traffic that was not yet categorized as P2P was subjected to additional analysis, using the C4.5 decision tree for P2P classification in conjunction with statistical aspects of the traffic.
In 2020, Ahn et al.20 suggested a genetic algorithm-based XAI approach for elucidating the inner workings of deep learning-based traffic classification. This model quantifies the significance of each characteristic to explain the deep learning-based traffic classifier’s method. Furthermore, the approach utilized the genetic algorithm to produce a feature selection mask that identifies significant characteristics throughout the complete feature set.
In 2022, Aouedi et al.21 suggested a novel Deep Learning (DL)–based strategy that combines many models based on Decision Trees. To increase generalization accuracy, this method combines tree-based classifiers using DL in a non-linear blended ensemble approach. The base classifiers and meta-classifiers were the two tiers that make up this ensemble. Decision Tree-based models serve as the basic classifiers at the first level, and DL was utilized as a meta-model to aggregate the base classifiers’ outputs at the second level. The ensemble is appropriate for network traffic classification using two publicly accessible datasets.
In 2020. Lin-Huang et al.22 provided a deep learning-based application-based online and offline traffic classification system running on a software-defined network (SDN) testbed. The SDN testbed’s multilayer perceptron (MLP), convolutional neural network (CNN), and stacked auto-encoder (SAE) make up the deep learning model that was created and resigned in the SDN controller. They used an open network traffic dataset for deep learning training and testing, which includes the seven most widely used applications. To simulate the online traffic service, the dataset traffic samples were re-produced and examined in the SDN testbed using the TCPreplay tool.
In 2021, Pang et al.23 introduced a chained graph model that preserves the chained compositional sequence on the packet stream. Next, CGNN was provided for a traffic categorization technique based on graph neural networks that creates a graph classifier using automatically generated attributes throughout the linked graph.
In 2022, Kim et al.24 presented deep RNN-TCS, a traffic classification technique based on deep recurrent neural networks, for cloud and hybrid edge computing applications. This method reduced training time and resource usage by classifying traffic patterns in real time. The cloud server trains data, creates inferred functions for edge compute nodes, and gathers and saves output labels. This method works better than deep packet inspection and, if sufficient data is provided, it automatically generates classifiers for traffic classification.
In 2024, Nuñez-Agurto et al.25 intend to improve the quality of service and security in software-defined networking by creating a model for traffic classification by application kinds and network assaults using deep learning techniques. The model was deployed using the SEMMA technique, and four algorithms (LSTM, BiLSTM, GRU, and BiGRU) were used to train the classifiers utilizing specific features from two public datasets. These findings highlight the GRU model’s exceptional efficacy in traffic classification.
Problem statement
The reviewed papers on traffic classification in SDN-based IoT networks highlight significant advancements but also reveal several drawbacks that limit their practical implementation. In most studies in SDN-based IoT systems, the challenge of correctly classifying network traffic is essential for improving resource allocation, security, and quality of service, especially in light of the complexity brought forth by encrypted and dynamic traffic patterns. To tackle these issues, recent developments have investigated machine learning (ML) and deep learning (DL) techniques. To increase classification accuracy, for example, methods like bidirectional GRU models with attention mechanisms18, autoencoder-based architectures17, and Tree-RNNs16 have been presented. These methods make use of temporal and spatial feature correlations. To interpret classifier decisions, hybrid approaches have also been used, including explainable AI (XAI) systems that use evolutionary algorithms20 and statistical and heuristic-based approaches19. Testbed-based implementations employing MLP, CNN, and SAE architectures22 and ensemble models integrating decision trees and DL frameworks21 further illustrate the increasing complexity of traffic classification methods. Meanwhile, continuous attempts to strike a compromise between accuracy and efficiency are demonstrated by cutting-edge solutions like real-time RNN-based classifiers for edge computing24 and chained graph neural networks23. In SDN contexts, the most recent research has concentrated on improving classification skills by utilizing BiGRU and GRU models to manage both application-level and attack traffic25. Notwithstanding these developments, it is still difficult to classify heterogeneous and encrypted traffic in a way that is reliable, effective, and understandable. These gaps underline the need for a more holistic approach, combining adaptive algorithms and lightweight models to enhance performance, scalability, and security.
Proposed methodology
Network traffic is naturally classified into a variety of traffic classes using several variables. However, insufficient research has been done on the multilevel traffic classification. Modularity, better application management, or lower risk of bottlenecks are some benefits of this solution. The network administrator can allocate resources effectively by using the data from network traffic analysis. As networking technologies like cloud computing converge, IoT data is expanding quickly. It’s difficult to manage the resources for the increasing demand. For this reason, this study aims to classify the traffic by applying a sophisticated deep-learning approach. The four main stages of the suggested model are covered in the sections that follow.
-
Step 1:
The gathered unprocessed information, represented as
 is first cleaned using the data cleaning technique. The prepared data (pre-processed) is denoted as
  .
. -
Step 2:
Then, knowledge characteristics (features)
 are taken out of the data that was previously processed, and
  .
. -
Step 3:
Further, a new optimization framework called SMRFO is used to choose the best features
 among the retrieved features
-
Step 4:
The selected optimal features
 are transferred to the TCLF-GNN and trained. Then the trained features are transferred to the two-level fused classifier for traffic classification. Two-level fused classifier is the combination of RNN (Recurrent Neural Network) and Optimized SNN (Spiking Neural Network). The outcome from the two-level fused classifier is the predicted outcome. It can further classify the traffic into four categories delay-sensitive, loss-sensitive, bandwidth-sensitive, and best effort based on the application category. Figure 1 demonstrates the model’s planned architecture.
Fig. 1.

Overall Proposed Architecture.
With the proliferation of IoT-capable devices, Software Defined Networking will make the sharing of network resources more effective and enhance IoT service-level agreements. The design of emerging SDN networks consists of three distinct levels: use, oversight, and the information layer. While southern APIs are utilized for interaction between the controller and the information aircraft, southbound APIs are utilized for interaction between the program’s application plane and the control layer. To make the SDN controller intelligent, an additional conceptual layer is known as the knowledge plane8 in the basic SDN architecture. The modified SDN architecture is shown in Fig. 2. The deep learning module in the knowledge plane is responsible for automating difficult network operations like route planning and traffic classification. Flow classifier classifies the traffic based on application type for providing required QoS. A particular knowledge plane application called the flow classifier classifies network traffic using the deep learning model’s outputs. Traffic is categorized according to the kind of application (e.g., bandwidth-sensitive, delay-sensitive) and QoS requirements are assigned appropriately. The flow classifier employs these insights (or outputs) to classify traffic flows into distinct QoS-based classifications, while the deep learning model is in charge of identifying patterns and linkages in network traffic.
Fig. 2.

Proposed SDN architecture.
The general design of the suggested technique is shown in Fig. 2. Using the flow classifier to extract characteristics and classify incoming traffic into QoS-based categories, like delay-sensitive or bandwidth-sensitive, the Deep Learning (DL) module in the knowledge plane communicates with the SDN controller. Following classification, the findings are sent to the SDN controller via northbound APIs, allowing the controller to make well-informed choices regarding resource allocation and routing. Based on these classifications, the SDN controller then dynamically configures the data plane to maximize traffic flow and guarantee that QoS standards are fulfilled. Furthermore, the DL module can receive feedback from the SDN controller, which enables it to gradually increase classification accuracy and develop its models. Intelligent traffic management is seamlessly integrated into the SDN architecture because of this interaction.
Reduced overall latency is necessary for delay-sensitive web traffic, including audiovisual teleconferences, telephone over IP (VOIP), and live video streaming, to preserve its immersive and streamed characteristics. Therefore, from the datasets, audio streaming & VoIP are taken under delay-sensitive class. Sensors with a limited amount of energy make up WSNs, often known as Internet of Things networking. Since these kinds of apps are capable of withstanding a certain amount of delay, the emphasis should be on selecting the optimal packet loss from the beginning to the end link to reduce the number of app-level replays. These applications can be termed as loss-sensitive flows or traffic. In the work, we have considered email and file transfer as loss-sensitive classes since emails contain sensitive and confidential information. They are tolerant of delay but cannot tolerate packet loss. Similar is the case with file transfer where the end users want lossless data transmission. Table 1 below shows the delay and bandwidth requirements of Internet traffic applications.
Table 1.
QoS requirement of Internet applications.
| Application | Bandwidth requirement | Latency requirement |
|---|---|---|
| VOIP/chat | LOW | LOW |
| Mail/browsing | MID | MID |
| Audio/video | HIGH | MID |
| P2P/File transfer | HIGH | BEST EFFORT |
Video streaming applications such as Netflix require very high bandwidth for their transmission, due to which it can be taken into the bandwidth-sensitive application category. Point-to-point (P2P) file transfers are also considered high-bandwidth requirement applications. Therefore, we choose P2P and video streaming under bandwidth-sensitive application types. Any additional non-detrimental bandwidth is considered best-effort communication19. According to the ISP, this type of traffic is insensitive to QoS measurements (jitters, loss of packets, delay, etc.). As a result, the dataset’s best-effort category involves searching and conversation. Table 2 displays each application’s general distribution throughout the data sets, together with the corresponding QoS levels that have been assigned to it.
Table 2.
Applications with respective QoS category.
| Application | QoS category |
|---|---|
| Audio streaming | Delay-sensitive |
| VoIP | Delay-sensitive |
| Video streaming | Bandwidth-sensitive |
| File transfer | Bandwidth-sensitive |
| P2P | Loss-sensitive |
| Loss-sensitive | |
| Browsing | Best effort |
| Chat | Best effort |
Dataset description
There are a ton of free databases for classifying network activity. To assess the effectiveness of the suggested strategy, we used two datasets that are freely accessible in our research: the ISCX-ToR2016 data from the College of New Brunswick in New Brunswick and the just released CIC-Darknet2020 data from the Canadian Institute for Security. Traffic that goes through a VPN or ToR is protected by encryption and referred to as darknet communication. The darknet is often referred to as net observatories, dark time, or black hole watchers36. There are a pair of labels and 85 characteristics in the CIC-Darknet data. Traffic types: VPN, non-VPN, ToR, and non-ToR Service types: P2P, transferring files; electronic mail; VoIP, which stands for video, audio, chat, and surfing. The quantity of example occurrences in the data set is displayed in Tables 3 as well as 4.
Table 3.
CIC-Darknet dataset traffic category.
| Traffic Type | Number of samples |
|---|---|
| Non-Tor | 93,357 |
| Tor | 1393 |
| Non-VPN | 23,864 |
| VPN | 22,920 |
Table 4.
CIC-Darknet dataset application category.
| Application type | Number of samples |
|---|---|
| Audio streaming | 18,065 |
| Browsing | 32,809 |
| Chat | 11,479 |
| 6146 | |
| File transfer | 11,183 |
| P2P | 48,521 |
| Video streaming | 9768 |
| VoIP | 3567 |
ISCX-ToR dataset contains 2 scenarios- A& B. A deals with identifying traffic as ToR or Non-ToR. Scenario B gives the fine-tuning of traffic categories based on applications. According to studies in Ref.18, 15 s is the delay value that provides distinguishing characteristics for a more precise categorization. So, we have used csv file extracted from a 15-s timeout. Scenario B contains 23 features with one label that deals with the application traffic type. Table 5 shows the category of traffic and number of samples in the ToR dataset.
Table 5.
ToR dataset traffic & application category.
| ToR | Non-ToR | Total | Browsing | Chat | Audio streaming | Video streaming | File transfer | VoIP | P2P | Total | |
|---|---|---|---|---|---|---|---|---|---|---|---|
| 5631 | 48,123 | 53,754 | 1194 | 194 | 249 | 510 | 617 | 590 | 1544 | 733 | 5631 |
Data preprocessing
In data preprocessing, we use normalization, vectorization, and oversampling to process the original datasets. Further, we remove rows with missing values or otherwise would affect the performance of the deep learning model. There are rows with NaN and infinity values which are considered missing values. For example, features such as FlowBytes/s, and Bwd PacketLengthStd have NaN entries, and FlowPackets/s, and FlowIATMean have infinity values. Since the dataset contains values in extreme ranges, the Min–Max algorithm is used to normalize or scale the features in the range [0,1]. Additionally, it accelerates the simulation’s convergence and precision. The calculation is given below:
 |
1 |
where  represents the original feature,
  is the normalized feature,
  and
and  represent the maximum and minimum features. Tables 3, 4, and 5 indicate the imbalance in the datasets. The ToR traffic accounts for only 1% of the total network Consequently, the minority groups are oversampled using the SMOTE technology approach. To create artificial members of the minority class, SMOTE first chooses its k-nearest neighbors. The collected raw data.
  is pre-processed and the data obtained as a result of the data-cleaning method is referred to as
  .
.
Feature extraction
Extracting features using prepared information  is the next phase. For this, the feature information gain is extracted from the features. A popular metric for assessing feature importance in deep learning and feature selection is information gain (IG), which quantifies the decrease in entropy (uncertainty) that a feature offers for the target variable. The information Gain approach selects the optimal feature based on entropy. The measurement of uncertainty is expressed probabilistically by entropy. When feature weights are calculated, information gain is the difference in information entropy, which is the amount of information on whether the categorization features are present or not. Information about feature selection is based on the amount of information as well as the feature weights. Information entropy for a dataset with m classes is given by Eq. (2),
 |
2 |
where  is the probability of randomly picking an element of class a.
Equation (3) represent the amount of entropy for all classes.
 |
3 |
Entropy displays the value of variant similarity for an attribute. The computation outcome can be calculated as an additional value for every attribute by deducting the amount of gain from the overall entropy and increasing feature volatility. Equation (4) is used to determine the gain value.
 |
4 |
Throughout the classification procedure, We evaluate a threshold or benefit value limitation that works well to produce the greatest accuracy within the optimal time of execution. This extracted Information gain  features are denoted as
  .
.
Figures 3 and 4 show the feature importance graph based on information gain selected from the dataset28 and dataset10.
Fig. 3.

Feature importance of the CIC-Darknet dataset28.
Fig. 4.

Feature importance of ISCX-ToR dataset10.
Feature selection
Merely utilizing the most pertinent characteristics throughout the process of selecting features is necessary to enhance categorization efficiency. SMRFO, a conceptual improvement of MRFO, is a new optimization framework that we employ in this study. Compared to sequential approaches and pessimistic algorithms, metaheuristic algorithms can frequently identify the best options using less computing work. A high-accuracy optimum subset of the collected data is found using the SMRFO method once the characteristics have been retrieved. The following describes the goal functional used to assess the efficiency of the SMRFO:
 |
5 |
where  is the total quantity of characteristics within the ith set of features, and
  is the degree of precision achieved by the ith value set created via knowledge gains.
  represents the chosen optimum characteristics.
Manta ray foraging optimization algorithm
The metaheuristic optimization method called MRFO was developed based on the feeding habits of manta rays, which are aquatic animals27. It relies on the theory that the manta ray may find food efficiently by combining erratic motions with an effective cruising pattern. To solve problems with optimization, the MRFO method simulates this kind of behavior. To successfully seek the perfect solution, the method integrates two essential components of Manta Ray conduct: randomized investigation and effective migration toward the most suitable option. This attribute renders MRFO a method of optimization that is both versatile and adaptive, enabling its application to a broad spectrum of issues. In a flexible, adaptable, and effective way, MRFO discovers the best solutions. It approximates three different foraging strategies: chain scavenging, cyclone scavenging, and cartwheel feeding. This helps to tackle certain optimization issues and improve performance.
Chain foraging
Manta rays align themselves from their head to their tail to create a feeding chain. People begin moving in a chain ahead of and toward the food from their starting positions. The mathematical framework is as follows, according to Eq. (6),
 |
6 |
 |
7 |
where  represents the location of the
  th person at the time
  in the bth dimensions,
  is a vector of random values in the interval
  , and aN is the weighting factor. The location updating of the ath person is determined by the location.
  of the
  th present person and the location
  of the food being consumed.
Cyclone foraging
Manta Ray, stuck in a path, begins to spiral, seeking prey. A representation of the spiraling motion of manta rays in n-dimensional (n-D) spacetime is given by this formula.
 |
8 |
 |
9 |
where  is the weighted factor and
  is the greatest number of repetitions. The method merges with the investigation and forces SMRFO to accomplish a major goal in the worldwide quest.
 |
10 |
 |
11 |
where  and
and  denote the upper and lower limits of the
  dimensions, respectively, while
  denotes the arbitrary location searching.
Somersault foraging
The fulcrum of this conduct is food and its stance. They therefore constantly relocate to the ideal spot. Here is how this model is formulated according to Eq. (12),
 |
12 |
There are two arbitrary numbers,  and
and  , and they are in the interval
  .
.  is the rotation element.
Algorithm 1.
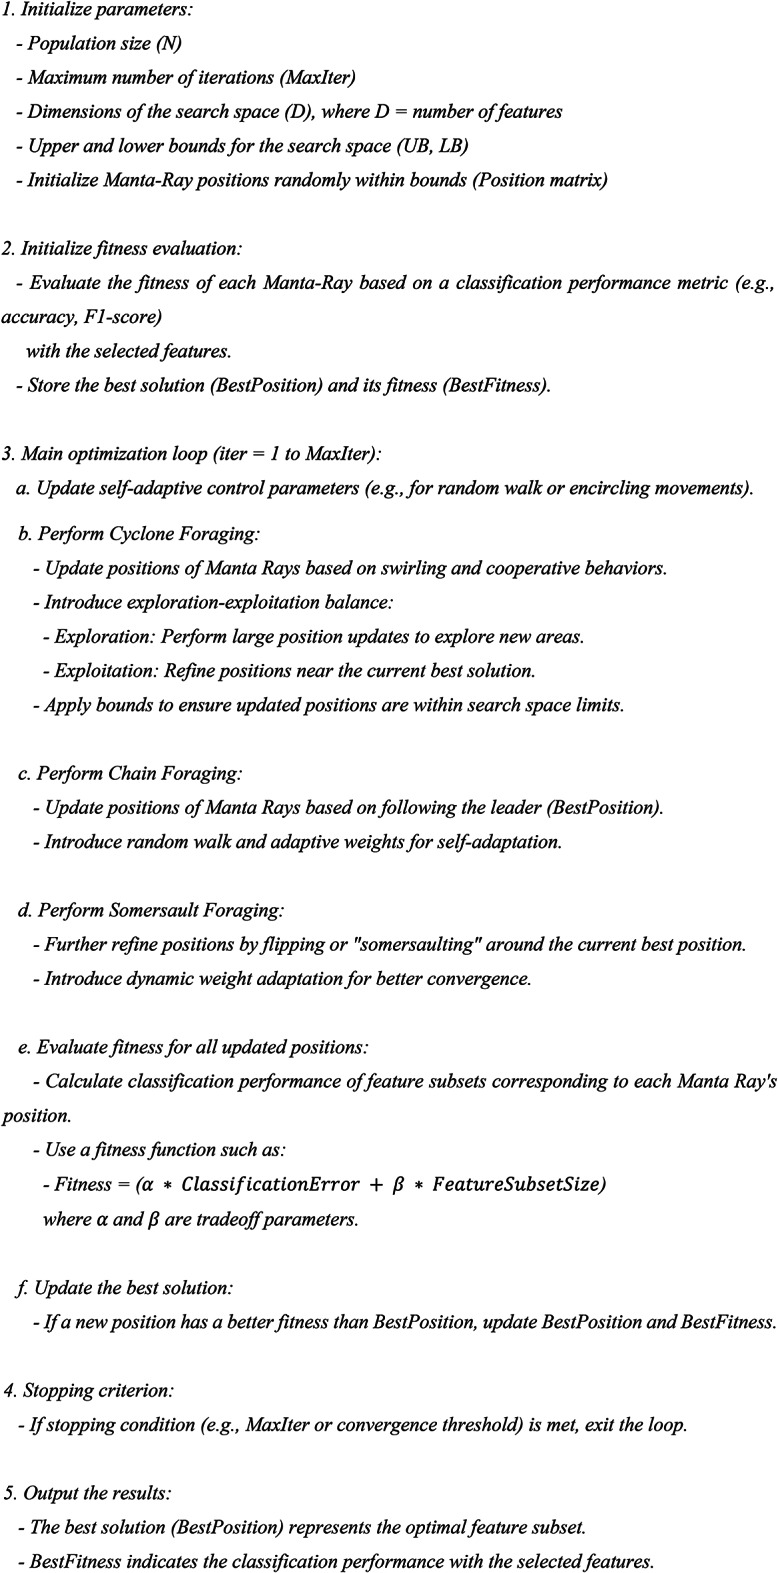
MRFO Algorithm.
Proposed self adaptive MRFO algorithm (SMRFO)
Here, a Self-adaptive MRFO is presented. One of the main issues with the original MRFO algorithm is that it may get trapped into a local minima and gets converged there without presenting an optimal solution. As mentioned earlier, there are three foraging behavior for Manta Rays. Cyclone foraging occurs when the collection amount of plankton is abundant. MRFO can do an extensive search with this technique, which is mostly utilized for exploring 30.
We propose the following novel steps for updating the solutions of cyclone foraging:
Step 1: In the interval  , create a variable that is random
  .
.
Step 2: The answers have been revised in the vortex feeding if  . To improve the weighing component
  , adjust the situation as shown below. In the context of mathematics, this stage is represented by the suggested Eq. (13).
 |
13 |
Step 3: If  , we modify the β factor using Gradient search rule (GSR) from Gradient-based optimizer. This stage is represented quantitatively using the suggested Eq. (14).
 |
14 |
where βmin = 0.2, βmax = 1.2, the present iteration’s worth,  , and the overall number of repetitions,
  , are.
Step 4: The generic Eq. (15) is going to be executed in the event that one or more of the conditions fails,
 |
15 |
where  is the weighted factor and
  is the greatest number of repetitions.
The process merges with the investigation, as has been shown in the equations, and forces SMRFO to accomplish a major goal in the worldwide quest.
Multilevel traffic classification
In this work, we offer a unique multilayer congestion classifier learned with selected optimum characteristics,  , based on TCLF GNN. The two-level fusion classification is made up of an RNN and an OSNN (optimized spiking neural network). RNN and OSNN receive the output of TCLF-GNN as inputs. The result is derived from the combined RNN and OSNN models.
In the suggested multilevel traffic categorization framework, the layered fusion approach—which combines the complementing strengths of Recurrent Neural Network (RNN) and Optimized Spiking Neural Network (OSNN)—plays a crucial role. While OSNN, which was inspired by the human brain, effectively handles event-driven or sparse data, which is typical of IoT sensor traffic, RNN is excellent at managing sequential and temporal data, which makes it perfect for processing traffic like video and audio streams. The layered fusion technique tackles the heterogeneous and varied nature of IoT network traffic by combining these two models, guaranteeing precise classification across a range of application types. This combination improves classification accuracy by allowing the system to capture fine-grained, event-based features (by OSNN) as well as long-term relationships (via RNN). Additionally, the method facilitates multi-level classification, starting with feature extraction using the TCLF-GNN model and then providing precise QoS-specific classifications including best-effort, bandwidth-sensitive, delay-sensitive, and loss-sensitive traffic using RNN and OSNN operating in parallel.
In SDN-based IoT networks, the layered fusion technique also makes resource allocation more efficient by allowing the SDN controller to dynamically distribute resources according to traffic type and QoS requirements. For example, bandwidth-intensive applications like video streaming are given high-throughput resources, while delay-sensitive traffic, like VoIP, can be given priority for low-latency pathways. The framework is nevertheless computationally efficient despite the layered design since RNN analyzes sequential data effectively and OSNN lowers processing costs with its low-latency, event-based architecture. The fusion approach is appropriate for real-time traffic classification in dynamic IoT contexts due to its efficiency. Biologically inspired computation is also introduced by OSNN, which improves the model’s capacity to handle irregular and sparse input with no overhead, guaranteeing scalability and resilience. A key element of the suggested traffic classification system, the fusion approach enhances overall network performance, maximizes resource utilization, and facilitates adaptive QoS management by generalizing across a variety of IoT applications and seamlessly integrating with SDN’s centralized control paradigm.
TCLF based gradient neural network
GNN model is created as the base for classifying the traffic. The descent of gradients is an approach that is commonly used for training artificial intelligence algorithms and neural networks to learn. Particularly in the case of gradient descent, the expense function serves as a gauge, assessing the correctness of the algorithm with every round of variable modifications. During training and testing, it is found that the mean squared error is producing the least amount of loss. The data, which can have up to five decimal places, and the squaring of a small difference result in smaller values, which promote smooth learning and minimal loss. Equation (16) to Eq. (21) illustrates the Root Mean Square Error (RMSE) based on a mathematical equation.
 |
16 |
where  is the entire number of data or observation scores,
  is the projected worth, and
  is the value that was observed.
Considering
 |
17 |
 |
18 |
 |
19 |
 |
20 |
 |
21 |
In addition, the maximum and minimum values were adjusted by subtracting the variation between the real and anticipated values’ averages, where  are the actual values of the
  , respectively, at a given observation
  On the other hand, the predicted values of the model are
  . The obtained features are parallelly transferred to RNN and OSNN.
Recurrent neural network
RNN is used as one of the classifiers in the proposed two-level classifier. Since our datasets contain various temporal and sequential data such as video, audio etc., it is appropriate to select RNN as among its classifiers. The addition of connections spanning nearby time intervals effectively converts feedback artificial neural networks into recurrent networks of neurons and provides a temporal dimension to the framework. The buried component variables  and the present point of data
  are fed into a node with recurring connections at epoch
  . The resultant value
  at every point
  is computed using the node that is hidden data
  at every time
  . The value of the input
  during the moment
  can influence the result
  at the time
  afterward due to the recurring interconnections. Equations (22) and (23), accordingly, provide an algebraic demonstration of it.
 |
22 |
 |
23 |
Every time step  , activity is sent via full borders, much like in a network that is feedforward. For each
  , the destination node is linked to an initial node by dotted lines. The weighted vector across the input data and the concealed layer is represented by
  in this instance. The weighting vector among the layer that is hidden and itself is denoted by
  , whereas the balance vector among the concealed level and the resultant layer is represented by
  . The bias variables matrices
  and
and  can be used by every node to acquire an angle.
Optimized spiking neural network
We use a Spiking Neural Network (SNN) in an optimized form as the other classifier forming the multilevel classifier. SNN adopts a human brain inspired computing model and it takes its input and output as spikes. A series of spikes is called a spike-train. Because of its low computing cost and straightforward hardware integration, the leaky integrate-and-fire model (LIF) is an often-used neuronal paradigm to describe the firing actions of SNNs. In the LIF method, a neuron modifies the membrane potential (m) by Eq. (24),
 |
24 |
The potential across the membrane of neurons  at the time
  is represented by
  , and
, and  indicates pre-synaptic inputs that are based on the synaptic weights and the spike activity of arriving synapse routes at moment
  . When both of the initial two inbound synapse routes pulse at the same time, the amount of presynaptic input is equivalent to the total of the weights of synaptic neurons
  and
and  . Until it exceeds a predetermined threshold, the membrane potential
  continuously updates. The membrane potential
  is then reset after the neuron
  fires the spike. In the LIF neuronal method, where the membrane update sensitivity is set to 1, the membrane updating is stopped after 35 phases, and the subsequent spike is decided by a value that is binary (0 or 1), is used in all baseline models. The RNN and OSNN classifiers combine together for the traffic classification process. The Hyper parameters utilized in training process of proposed classifier is manifested in Table 6.
Table 6.
Hyper parameters used for the training of proposed classifier.
| Parameter | Value |
|---|---|
| Activation function | RELU, SOFTMAX |
| Loss function | TCLF |
| Dropout rate | 0.2 |
| Optimizer | SMRFO |
| Number of epochs | 53 |
| Learning rate | 0.023 |
| Batch size | 248 |
The choice of hyper parameters affects how well a deep learning model performs. Every combination of outcomes is considered in order to determine the best hyper parameters.
We use SMRFO as the optimizer for obtaining the optimized results in terms of fitness function, batch size, maximum epochs, number of hidden layers, etc. The categorical TCLF is employed as the loss function. The performance of TCLF in multi-class classification is the best. Additionally, during the iterative optimization process, the TCLF function has a faster convergence and lower complexity. The proposed methodology’s simulation environment has 53 epochs, and the batch size is 248. For each pair of hidden layers, a rate of dropout of 0.2 is imposed to avoid excessive fitting. Neurons are randomly removed by the dropout layer. It is decided to use the learning rate of 0.023 because it works best for both training and testing sets. Moreover, more enhancements can be done by executing the hyper parameter tuning process. SMRFO is an adaptive learning rate optimization algorithm and is computationally efficient. The multi-level architecture and optimization procedures during the training phase need a large amount of computation cost, while the inference phase is comparatively light, and the SNN offers further efficiency advantages.
Results and discussion
The suggested framework is used in Python. Datasets used are the publicly available ones given as dataset128 and dataset210. The altered Manta-Ray Hunting method is the basis for the visual evaluation presented in this part, which explains the two-level fusion categorization using altered GNN for multilayer traffic categorization. Several current approaches, including PSO31, BWO30, and MRFO29, are used as optimization techniques on the networks. To assess the suggested model, metrics for performance such as the F-measure, accuracy, sensibility, precision, FNR, and FPR are employed.
Evaluation of proposed approach
We use data analysis to evaluate the suggested method’s efficiency in the CIC-Darknet and ISCX-TOR datasets with those of fundamental metaheuristic approaches including MRFO, BWO, and PSO as optimization techniques. The outcomes demonstrate how effective the suggested classification is
-
(i)Accuracy: The percentage of cases (TP and TN) that were correctly classified out of all the instances. It evaluates the model’s overall effectiveness.

25 -
(ii)Precision: The proportion of correctly predicted positive cases, or TP, to all anticipated positive cases. It calculates the proportion of actual traffic that match the predictions.

26 -
(iii)Sensitivity: The percentage of real positive cases that the model accurately detected. It assesses how well the model can identify attacks.

27 -
(iv)F-measure: It measures the harmonic mean of precision and recall. It is a fair assessment of model accuracy, especially for unbalanced data.

28 -
(v)FPR: The proportion of actual negative cases wrongly labeled as positive cases (FP) to all actual negative cases. It shows the number of false alarms.
29 -
(vi)FNR: The proportion of cases in which true positive cases were incorrectly labeled as negative (FN) to all true positive cases. It depicts the percentage of missed detections.

30
Evaluation on dataset 1-CIC-Darknet
Utilizing the CIC-Darknet data as an optimization, we do a test study to evaluate the suggested method’s efficiency against fundamental metaheuristic approaches, including MRFO, BWO, and PSO. Figure 5 shows the measures of accuracy, precision, Fmeasure, FPR, FNR, and sensitivity with learning rates of 60,70 and 80. With a learning rate of 60, the value of accuracy for MRFO, BWO, and PSO is 94.281%, 94.043%, and 95.515% respectively and with the proposed method, the value of accuracy is 97.352%. In learn rate 70, the accuracy value of MRFO is 95.043% and that of PSO and BWO is 96.663% and 96.086%. The proposed method’s accuracy is 98.521%. The accuracy values for MRFO, BWO, and PSO at learn rate 80 are 96.051, 97.551%, and 97.529%, respectively. In the proposed method, at a learn rate of 80, accuracy scores to 99.081%. The proposed method shows higher accuracy, precision, F-measure, and low FNR.
Fig. 5.

Overall performance analysis for dataset 1 (a) Accuracy (b) F-Measure (c) FNR (d) FPR (e) Precision (f) Sensitivity.
Evaluation on dataset 2-ISCX-ToR
With learn rate 60, when the value of accuracy for MRFO, BWO and PSO are 95.515%, 95.842% and 94.281% respectively, in the proposed model, the value of accuracy is 89.99%. The accuracy values for MRFO, BWO, and PSO at learn rate 70 are respectively 96.086%, 96.663%, and 95.594%. In the proposed method, at learn rate 70, accuracy amounts to 90.7%. At learn rate 80, MRFO, BWO, PSO accuracy are 97.691%, 97.561% and 96.594% respectively. In the proposed technique, at learn rate 80, the accuracy is 99.819%. The currently used technique achieves a higher accuracy than the other techniques. The overall analysis of the performance metrics for dataset 2 is shown in Fig. 6.
Fig. 6.

Overall performance analysis for dataset 2 (a) Accuracy (b) F-Measure (c) FNR (d) FPR (e) Precision (f) Sensitivity.
Overall performance of the proposed model
Tables 7 and 8 display the analysis of testing metrics for dataset 1 which is the Darknet dataset and for dataset 2, ie the ISCX-ToR dataset. We have used MRFO, BWO, PSO and then the proposed method which employs the improved version of MRFO (Self Adaptive MRFO) as the optimizer for the purpose of comparison. We have shown the comparison table with a train-test split of 80–20 which gives the optimal results.
Table 7.
80% Training Rate for Dataset 1.
| Methods | MRFO | BWO | PSO | Proposed |
|---|---|---|---|---|
| Accuracy | 96.051 | 97.551 | 97.529 | 99.081 |
| Precision | 96.081 | 97.551 | 97.348 | 99.692 |
| Sensitivity | 94.551 | 96.519 | 96.228 | 98.551 |
| F-measure | 94.561 | 96.009 | 96.008 | 98.091 |
| FPR | 0.0492 | 0.0491 | 0.0356 | 0.0091 |
| FNR | 0.0319 | 0.0351 | 0.0307 | 0.0065 |
Table 8.
80% Training Rate for Dataset 2.
| Methods | MRFO | BWO | PSO | Proposed |
|---|---|---|---|---|
| Accuracy | 97.691 | 97.561 | 96.594 | 99.819 |
| Precision | 97.591 | 97.551 | 96.089 | 99.259 |
| Sensitivity | 96.337 | 96.691 | 95.561 | 98.684 |
| F-measure | 96.021 | 96.365 | 95.392 | 98.553 |
| FPR | 0.0429 | 0.0335 | 0.0419 | 0.0082 |
| FNR | 0.0335 | 0.0301 | 0.0352 | 0.00574 |
To demonstrate the efficacy of this construction, we empirically evaluate the suggested framework with many other DL and ML approaches as the traffic classifiers in the subsequent tables. CNN, RNN, and LSTM are employed as DL approaches, while SVM and Naive Bayes (NB) models are utilized as ML techniques. The suggested model is assessed using performance measures such as the F-measure, remember, accuracy, precision, sensitivity, FNR, and FPR. Tables 9 and 10 present the contrasting metric evaluation for Datasets 1 and 2.
Table 9.
Analysis of comparison metrics for Dataset 1: CIC-Darknet.
| Metrics | CNN | RNN | LSTM | SVM | NB | Proposed |
|---|---|---|---|---|---|---|
| Accuracy | 0.920 | 0.957 | 0.953 | 0.801 | 0.825 | 0.990 |
| Precision | 0.912 | 0.916 | 1.000 | 0.840 | 0.818 | 0.996 |
| Sensitivity | 0.928 | 1.00 | 0.903 | 0.758 | 0.832 | 0.985 |
| F-Measure | 0.891 | 0.928 | 0.921 | 0.774 | 0.799 | 0.980 |
| FPR | 0.028 | 0.028 | 0.023 | 0.019 | 0.025 | 0.009 |
| FNR | 0.010 | 0.007 | 0.004 | 0.004 | 0.009 | 0.006 |
Table 10.
Analysis of comparison metrics for Dataset 2: ISCX-ToR.
| Metrics | CNN | RNN | LSTM | SVM | NB | Proposed |
|---|---|---|---|---|---|---|
| Accuracy | 0.925 | 0.920 | 0.947 | 0.837 | 0.842 | 0.998 |
| Precision | 0.969 | 0.969 | 0.959 | 0.882 | 0.882 | 0.992 |
| Sensitivity | 0.892 | 0.882 | 0.940 | 0.803 | 0.811 | 0.986 |
| F-Measure | 0.901 | 0.896 | 0.921 | 0.816 | 0.820 | 0.985 |
| FPR | 0.025 | 0.020 | 0.023 | 0.019 | 0.022 | 0.008 |
| FNR | 0.087 | 0.098 | 0.032 | 0.089 | 0.079 | 0.005 |
As shown in Tables 9 and 10, various approaches are used to determine the success of the suggested method. The self-adaptive modified Manta Ray Foraging Optimization algorithm (SMRFO) is what gives the projected model its superior accuracy level of 0.99 for Dataset 1 and 0.998 for Dataset 2, which is the greatest value when compared to the current models. After examining the obtained results, the projected model unmistakably records the lowest FPR and FNR, 0.009 and 0.006, respectively, for dataset 1 and 0.008 and 0.005, for dataset 2, which is the lowest value. Therefore, the suggested methodology performs better than the current approaches.
QoS based multi-class traffic classification evaluation
Analysis of traffic classification is shown in Figs. 7 and 8. Ensemble methods and Gradient based optimizers32,33 are the recently used techniques for classifying Darknet traffic and for solving complex optimization problems. But these methods don’t take into account the QoS based classes as the final outcome. Here, using the proposed method, the predicted traffic is classified into 4 classes viz, Delay-sensitive, Loss-sensitive, Bandwidth-sensitive and Best effort. For an 80–20 train-test divided, the outcomes are displayed for the highest possible values of an F-measure, FPR, FNR, accuracy, precision, sensibility, and specificity in the two data. Traffic is classified into four QoS-based groups by comparing metrics using both the improved SMRFO and the fundamental MRFO as the optimization techniques.
Fig. 7.

QoS based traffic classification for Darknet dataset.
Fig. 8.

QoS based traffic classification for ToR dataset.
Table 11 shows the values obtained by comparing the proposed algorithm with the basic MRFO as the optimizer.
Table 11.
Comparison of QoS based 4 class output with basic MRFO & proposed method.
| Metrics | Darknet dataset | ToR dataset | ||
|---|---|---|---|---|
| Basic MRFO | Proposed method | Basic MRFO | Proposed method | |
| Accuracy | 0.816 | 0.99 | 0.853 | 0.99 |
| Precision | 0.856 | 0.996 | 0.899 | 0.992 |
| Sensitivity | 0.773 | 0.985 | 0.818 | 0986 |
| Specificity | 0.858 | 0.928 | 0.899 | 0.928 |
| F-measure | 0.789 | 0.98 | 0.831 | 0.985 |
| FPR | 0.0197 | 0.009 | 0.0194 | 0.008 |
| FNR | 0.0040 | 0.006 | 0.091 | 0.005 |
Table 12 presents a comparison between the suggested approach and the strategies that are currently in use in the scientific literature. The values show the efficiency and superiority of the proposed two-level classifier with the Self-adaptive bio-inspired Manta Ray Foraging optimizer for both datasets (CIC-Darknet and ISCX-ToR). It has been found that TCLF Gradient Neural Network (GNN) exhibits better performance by reporting 99% overall accuracy.
Table 12.
Comparison of existing methods in literature with the proposed method.
| Reference | Dataset | Feature selection method | Traffic classifier used | Optimizer used | Accuracy (%) | Precision (%) | F-measure (%) | FPR | FNR | QoS based class |
|---|---|---|---|---|---|---|---|---|---|---|
| Bilal Sarwar et.al. 202235 | CIC-Darknet | XGB | CNN-LSTM | – | 0.85 | 0.90 | 0.89 | – | – | No |
| Mohanty et al. 202217 | CIC-Darknet | Forward-SFS | Stacking Ensemble model made of Random Forest, K-Nearest Neighbor, and Decision Tree | Adam | 0.978 | – | 0.966 | – | 0.04 | No |
| Habibi Lashkari et al.36 | CIC-Darknet | Forest of Trees | 2D-CNN | Adam | 0.86 | 0.86 | 0.86 | – | – | No |
| Sun. et al.26 | ISCX-TOR | Packet block image | CNN | Adam | 0.933 | 0.959 | 0.89 | – | – | No |
| A.I Owusu Et.al.34 | ISCX-TOR | SFS and Shapley additive explanations (SHAP) | Random Forest Classifier, Decision Trees Classifier and K-Nearest Neighbors Classifier | 0.883 | 0.883 | 0.927 | 0.914 | – | – | No |
| Proposed method | CIC-Darknet | Information gain and SMRFO | 2 level fused classifier-RNN & Optimized SNN | SMRFO | 0.99 | 0.996 | 0.98 | 0.009 | 0.006 | Yes- 4 classes |
| ISCX-ToR | 0.998 | 0.992 | 0.985 | 0.008 | 0.005 |
Conclusion
A novel deep learning-driven system for multiple-level traffic categorization for an SDN-based Internet of Things system is created in this study. The work utilized an altered meta-heuristic method called self-adapting Manta Ray Hunting Optimization to identify the best characteristics in the encoded data. The network traffic is classified into four classes namely, delay-sensitive, loss-sensitive, bandwidth intensive and best effort which could serve as the base for network providers to guarantee the required QoS. A two-level fused classifier based on an improved TCLF-GNN loss function further enhances the classification accuracy. To evaluate the efficacy of the suggested strategy, performance indicators, including the F-measure, sensibility, precision, and accuracy, are presented. The Python framework is used to carry out the suggested design. The suggested technique achieved an accuracy rate of 99% for the ISCX-ToR and CIC-Darknet2020 datasets. On analyzing the observed results, the projected model specifically recorded the lowest FPR and FNR as, 0.009 and 0.006 for Darknet dataset and 0.008 and 0.005 for ToR dataset, which is the least value compared to the existing methods.
Acknowledgements
The author extends the appreciation to the Deanship of Postgraduate Studies and Scientific Research at Majmaah University for funding this research work through the project number (R-2024-1460).
List of symbols

Information entropy for a dataset with
 classes
Entropy value for all classes

Gain value

Root Mean Square Error

Total number of data or observation scores

Observed value at index


Predicted value at index


Weighted difference based on


Weighted average of max and min active values

Weighted average of max and min idle values

TCLF-GNN loss function

Hidden state of RNN at time


Output of RNN at time


Membrane potential of neuron
 at time

Pre-synaptic inputs
Author contributions
M.A. Contributed in Conceptualization, Methodology, Data Curation, Formal Analysis, and Writing—Original Draft.
Data availability
The datasets used in this study are publicly available as follows: 1. Dataset 1: The CIC-Darknet 2020 Internet Traffic dataset was collected from Kaggle and is accessible at CIC-Darknet 2020 Internet Traffic (https://www.kaggle.com/datasets/peterfriedrich1/cicdarknet2020-internet-traffic). 2. Dataset 2: The ISCX-Tor dataset is available through the Canadian Institute for Cybersecurity and can be found at ISCX-Tor Dataset (https://www.kaggle.com/code/luccagodoy/tor-non-tor-traffic-classification).
Declarations
Competing interests
The authors declare no competing interests.
Footnotes
Publisher’s note
Springer Nature remains neutral with regard to jurisdictional claims in published maps and institutional affiliations.
References
- 1.Wang, J., Yan, Z., Wang, H., Li, T. & Pedrycz, W. A survey on trust models in heterogeneous networks. IEEE Commun. Surv. Tutorials24(4), 2127–2162 (2022). [Google Scholar]
- 2.Shafiq, M., Tian, Z., Bashir, A. K., Jolfaei, A. & Yu, X. Data mining and machine learning methods for sustainable smart cities traffic classification: A survey. Sustain. Cities Soc.60, 102177 (2020). [Google Scholar]
- 3.Zhao, J., Jing, X., Yan, Z. & Pedrycz, W. Network traffic classification for data fusion: A survey. Inf. Fusion72, 22–47 (2021). [Google Scholar]
- 4.Singh, M. & Baranwal, G. Quality of service (qos) in internet of things. In 2018 3rd International Conference On Internet of Things: Smart Innovation and Usages (IoT-SIU) (eds Singh, M. & Baranwal, G.) 1–6 (IEEE, 2018). [Google Scholar]
- 5.Ganesan, E., Hwang, I. S., Liem, A. T. & Ab-Rahman, M. S. SDN-enabled FiWi-IoT smart environment network traffic classification using supervised ML models. Photonics8(6), 201 (2021). [Google Scholar]
- 6.Aslam, M. et al. Adaptive machine learning based distributed denial-of-services attacks detection and mitigation system for SDN-enabled IoT. Sensors22(7), 2697 (2022). [DOI] [PMC free article] [PubMed] [Google Scholar]
- 7.Selvi, K. T. & Thamilselvan, R. An intelligent traffic prediction framework for 5G network using SDN and fusion learning. Peer-to-Peer Netw. Appl.15(1), 751–767 (2022). [Google Scholar]
- 8.Salman, O., Elhajj, I. H., Chehab, A. & Kayssi, A. A multi-level internet traffic classifier using deep learning. In 2018 9th International Conference on the Network of the Future (NOF) (ed. Salman, O.) 68–75 (IEEE, 2018). [Google Scholar]
- 9.Heidari, A. & Jabraeil Jamali, M. A. Internet of Things intrusion detection systems: A comprehensive review and future directions. Cluster Comput.26(6), 3753–3780 (2023). [Google Scholar]
- 10.Hassan, I. H., Abdullahi, M., Aliyu, M. M., Yusuf, S. A. & Abdulrahim, A. An improved binary manta ray foraging optimization algorithm based feature selection and random forest classifier for network intrusion detection. Intell. Syst. Appl.16, 200114 (2022). [Google Scholar]
- 11.Abdullahi, M., Hassan, I. H., Abdullahi, M. D., Aliyu, I. & Kim, J. Manta ray foraging optimization algorithm: Modifications and applications. IEEE Access11, 53315–53343 (2023). [Google Scholar]
- 12.Gharehchopogh, F. S., Ghafouri, S., Namazi, M. & Arasteh, B. Advances in manta ray foraging optimization: A comprehensive survey. J. Bionic Eng.21(2), 953–990 (2024). [Google Scholar]
- 13.Kumar, R., Swarnkar, M., Singal, G. & Kumar, N. IoT network traffic classification using machine learning algorithms: An experimental analysis. IEEE Internet Things J.9(2), 989–1008 (2021). [Google Scholar]
- 14.Mohammed, A. R., Mohammed, S. A. & Shirmohammadi, S. Machine learning and deep learning based traffic classification and prediction in software defined networking. In 2019 IEEE International Symposium on Measurements & Networking (M&N) (ed. Mohammed, A. R.) 1–6 (IEEE, 2019). [Google Scholar]
- 15.Guo, A. & Yuan, C. Network intelligent control and traffic optimization based on SDN and artificial intelligence. Electronics10(6), 700 (2021). [Google Scholar]
- 16.Ren, X., Gu, H. & Wei, W. Tree-RNN: Tree structural recurrent neural network for network traffic classification. Expert Syst. Appl.167, 114363 (2021). [Google Scholar]
- 17.D’Angelo, G. & Palmieri, F. Network traffic classification using deep convolutional recurrent autoencoder neural networks for spatial–temporal features extraction. J. Netw. Comput. Appl.173, 102890 (2021). [Google Scholar]
- 18.Liu, X. et al. Attention-based bidirectional GRU networks for efficient HTTPS traffic classification. Inf. Sci.541, 297–315 (2020). [Google Scholar]
- 19.Bhatia, M., Sharma, V., Singh, P. & Masud, M. Multi-level P2P traffic classification using heuristic and statistical-based techniques: A hybrid approach. Symmetry12(12), 2117 (2020). [Google Scholar]
- 20.Ahn, S., Kim, J., Park, S. Y. & Cho, S. Explaining deep learning-based traffic classification using a genetic algorithm. IEEE Access9, 4738–4751 (2020). [Google Scholar]
- 21.Aouedi, O., Piamrat, K. & Parrein, B. Ensemble-based deep learning model for network traffic classification. IEEE Trans. Netw. Serv. Manag.19(4), 4124–4135 (2022). [Google Scholar]
- 22.Lin-Huang, C., Tsung-Han, L., Hung-Chi, C. & Cheng-Wei, S. Application-based online traffic classification with deep learning models on SDN networks. Adv. Technol. Innov.5(4), 216 (2020). [Google Scholar]
- 23.Pang, B., Fu, Y., Ren, S., Wang, Y., Liao, Q., & Jia, Y. (2021). CGNN: traffic classification with graph neural network. Preprint at arXiv:2110.09726.
- 24.Kim, K., Lee, J. H., Lim, H. K., Oh, S. W. & Han, Y. H. Deep RNN-based network traffic classification scheme in edge computing system. Comput. Sci. Inf. Syst.19(1), 165–184 (2022). [Google Scholar]
- 25.Nuñez-Agurto, D. et al. A novel traffic classification approach by employing deep learning on software-defined networking. Future Internet16(5), 153 (2024). [Google Scholar]
- 26.Afuwape, A. A., Xu, Y., Anajemba, J. H. & Srivastava, G. Performance evaluation of secured network traffic classification using a machine learning approach. Comput. Stand. Interfaces10.1016/j.csi.2021.103545 (2021). [Google Scholar]
- 27.Mestres, A. et al. Knowledge-defined networking. ACM SIGCOMM Comput. Commun. Rev.47(3), 2–10 (2017). [Google Scholar]
- 28.Dingledine, R., Mathewson, N. & Syverson, P. Tor: The Second Generation Onion Router (Naval Research Lab, 2004). [Google Scholar]
- 29.Ul Alam, M.Z., Azizul Hakim, A. and Toufikuzzaman, M. Application and Interpretation of Ensemble Methods for Darknet Traffic Classification. In: Proc. 42nd IEEE Symposium on Security and Privacy, San Francisco, CA, USA. pp. 24–27 (2021).
- 30.Mohanty, H., Roudsari, A. H. & Lashkari, A. H. Robust stacking ensemble model for Darknet traffic classification under adversarial settings. Comput. Secur.120, 2022 (2022). [Google Scholar]
- 31.Almomani, A. Darknet traffic analysis, and classification system based on modified stacking ensemble learning algorithms. Inf. Syst. E-Bus Manag.10.1007/s10257-023-00626-2 (2023). [Google Scholar]
- 32.Altbawi, S. M. A. et al. An improved gradient-based optimization algorithm for solving complex optimization problems. Processes11(2), 498 (2023). [Google Scholar]
- 33.Dias, K. L., Pongelupe, M. A., Caminhas, W. M. & de Errico, L. An innovative approach for real-time network traffic classification. Comput. Netw.158, 143–157 (2019). [Google Scholar]
- 34.Tavanaei, A., Ghodrati, M., Kheradpisheh, S. R., Masquelier, T. & Maida, A. Deep learning in spiking neural networks. Neural Netw.111, 47–63 (2019). [DOI] [PubMed] [Google Scholar]
- 35.Elnawawy, M., Sagahyroon, A. & Shanableh, T. Fpga-based network traffic classification using machine learning. IEEE Access8, 175637–175650 (2020). [Google Scholar]
- 36.Zeng, Y., Gu, H., Wei, W. & Guo, Y. Deep-Full-Range: a deep learning-based network encrypted traffic classification and intrusion detection framework. IEEE Access7, 45182–45190 (2019). [Google Scholar]
Associated Data
This section collects any data citations, data availability statements, or supplementary materials included in this article.
Data Availability Statement
The datasets used in this study are publicly available as follows: 1. Dataset 1: The CIC-Darknet 2020 Internet Traffic dataset was collected from Kaggle and is accessible at CIC-Darknet 2020 Internet Traffic (https://www.kaggle.com/datasets/peterfriedrich1/cicdarknet2020-internet-traffic). 2. Dataset 2: The ISCX-Tor dataset is available through the Canadian Institute for Cybersecurity and can be found at ISCX-Tor Dataset (https://www.kaggle.com/code/luccagodoy/tor-non-tor-traffic-classification).