

Abstract
During the hot summer months, the significant temperature disparity between outdoor and indoor air-conditioned spaces can lead to thermal discomfort and pose a potential health risk. Transition areas such as corridors and elevator lobbies, serving as intermediary zones connecting indoors and outdoors, have been found effective in mitigating this thermal discomfort. In this study, three different temperatures (25 °C-case 1, 27 °C-case 2, and 29 °C-case 3) were employed to investigate the dynamic physiological regulation and thermal perception response of individuals when transitioning from an outdoor environment into an indoor neutral room through a transition space. The findings revealed that mTsk decreased by 0.31 °C, 0.13 °C, and 0.07 °C; TSV decreased by 1.63, 1.56, and 0.9 units; while TCV increased by 1.9, 2.16 ,and 0.81units for cases1-3 respectively indicating that an air temperature of around 27 °C is most suitable for achieving optimal comfort levels in these transition spaces. The correlation between UTCI index with MTSV was stronger compared to PET or SET* throughout the entire process; moreover, a better linear relationship was observed between ΔTSV and ΔT than ΔTCV. Furthermore, a second-order polynomial function model was established using dissatisfaction rate at initial entry moment into new environment along with operative temperature difference, resulting in acceptable temperatures ranging from 25.3 °C to 27.93 °C within current experimental conditions.
Keywords: Temperature step, Dynamic thermal sensation, Transition space, Physiological response, Summer commuting
Subject terms: Civil engineering, Environmental social sciences
Introduction
Urbanization has resulted in significant alterations to urban climates, as global warming and the urban heat island effect exacerbate the frequency and severity of hot weather conditions within cities1. To mitigate the adverse impacts of external temperature fluctuations on human activities and well-being, air conditioning is extensively employed in indoor environments to maintain comfortable ambient temperatures2. The recommended temperature range for indoor air conditioning during summer is 25–26 °C considering various environmental factors and energy efficiency considerations. Meanwhile, outdoor temperatures can reach up to approximately 39 °C during summer. This results in a temperature difference of over 10 °C between indoor air-conditioned spaces and natural outdoor environments. When individuals transition from outdoors to indoors, this substantial disparity in temperature can have a profound impact on their bodies, leading to thermal discomfort and potentially even illness or mortality3.
The appropriate control of the thermal environment in the transition space, which serves as a buffer and connection zone between indoor and outdoor areas, can effectively mitigate thermal discomfort caused by temperature differences4. Kwong et al.5 evaluated thermal comfort of enclosed transitional spaces in tropical buildings using subjective response in environment temperature ranging from 26 to 28.8 °C showing 80% satisfaction by seated respondents. Azimi et al.6 simulated grassless and treeless scenarios to study the effect of greening on transitional thermal comfort and validated the results using data collected in the field. Results demonstrate that the average PET in the current situation is 39.81 ℃ in summer (hot sensation) and 5 ℃ in winter (cold sensation). However, regulating the thermal environment in this space requires significant energy consumption. Pitts et al.7 discovered that the energy demand per unit area of the transition space is three times higher than that of other areas within the building, and additional studies have demonstrated substantial energy requirements for heating and cooling this transitional area8. Therefore, to alleviate the impact of sudden changes in thermal conditions on human comfort while also reducing energy consumption in the transition space, it is crucial to establish an optimal air conditioning temperature setting.
Sudden fluctuations in temperature can have adverse effects on human health. The effect of three different air temperature step-changes (S10: 20 °C–10 °C–20 °C, S20: 20 °C–0 °C–20 °C, S40: 20 °C– − 20 °C–20 °C) on human health and thermal comfort was investigated in a severe cold area of China by Lian et al.9. It was observed that these temperature fluctuations were frequently accompanied by symptoms such as peripheral chills, dizziness, rhinorrhea or nasal congestion, dryness of the throat, and shivering. Xiong et al.10 also examined physiological characteristics and thermal sensations under various working conditions involving abrupt temperature changes (S5: 32 °C-37°C-32 °C, S11: 26 °C-37°C-26 °C, and S15: 22 °C-37°C-22 °C). The results indicated symptoms such as dizziness, eyestrain, increased sweating, accelerated breathing rate, and alterations in heart rate due to sudden shifts in temperature. Zhao11 conducted experiments and found that when the temperature difference between two climatic chambers exceeded 5 °C, subjects experienced heightened sensitivity to thermal conditions during acclimatization. A large-scale survey conducted in Jiangsu and Shanghai revealed a strong association between lower indoor temperatures with larger indoor-outdoor temperature differences and an increased risk of neurological disorders, digestive issues, respiratory problems, and discomfort related to skin and mucous membranes12. Li et al.13 through field surveys concluded that Sick Building Syndrome (SBS) is not only associated with poor indoor air quality but also with significant disparities between indoor-outdoor temperatures. Ruojing14 suggested that the discrepancy in temperatures is one of the most crucial factors contributing to air conditioning syndrome after analyzing 56 clinical cases.
In order to mitigate the thermal discomfort associated with sudden temperature changes and reduce the threat posed to human health, several scholars have explored various strategies. Huang15 utilized an elevated design to create shaded spaces that significantly increased occupants’ comfort after entering the outdoors during short-term exposures. Zhai16 used indoor personally controlled fans to remove excess body heat and moisture, which restored subjects’ baseline neutral sensations within 7–8 min of entering a room. Zhang et al.17 found that acceptable temperature steps in hot and humid areas should not exceed 3 °C based on psychological and physiological responses of university students under step changes from medium-warm to medium-cold temperatures in a climate chamber consisting of two adjacent rooms in China’s simulated hot and humid climate; K. Nagano et al.18 investigated constant sedentary metabolic rates under step changes in temperature finding allowable differences between transition space interior building space should not be higher than 3 °C.
Based on the aforementioned research review, it is evident that sudden drops in air temperature during summer are unfavorable for human thermal comfort. Therefore, shaping the thermal environment of the transition space in buildings, particularly air temperature regulation, is crucial for human thermal buffering. Most of the previous studies on temperature steps only considered the inter-transition between non-neutral and neutral temperatures, ignoring the transition temperatures in other public areas, such as corridors, and most of the studies were simulated in climatic chambers, which are not very close to the actual scenarios. In this paper, an experimental platform of “outdoor-transitional space-indoor” is constructed to simulate the change of thermal environment when the occupants enter the neutral room from the hot outdoor area in summer, to study the influence of the thermal environment of the transitional space on the overall comfort of human body. Based on experimental data, three methods are proposed for predicting the appropriate temperature range of the transitional space under various thermal environmental transitions.
Methodology
The study was conducted in July 2023 in Qingdao, China. A total of 40 university students voluntarily participated in this experiment. The experiment replicated the process of commuters entering a building from outdoors, traversing through the transitional space, and subsequently taking the elevator to access an air-conditioned room. We confirmed that all experiments in this study were performed in accordance with the relevant guidelines and regulations.
Experimental conditions and processes
In the experiment, all participants attended a training session aimed at familiarizing them with the experimental procedures and survey questions, and a volunteer was present to record the questionnaires in each experiment. Participants were instructed to abstain from vigorous exercise or consumption of alcohol or caffeinated beverages for 24 h preceding the test. Considering the homogeneity of the outdoor environment in the experiment, days with similar natural characteristics were selected based on weather forecasts, and a standardized weather station was employed for real-time monitoring and recording of key environmental parameters including temperature, humidity, wind speed, and wind direction. The experimental data for further analysis consisted of five days with the closest outdoor environmental parameters as determined from the obtained results. The experimental procedure is illustrated in Fig. 1.
Volunteers were instructed to change into the test suit and wear the temperature sensor and heart rate belt throughout the entire duration. Each volunteer initially spent 20 min in a neutral state inside Room 1, followed by filling out the questionnaire during the final minute.
Volunteers proceeded to enter an outdoor area where they walked at a pace of 30 steps per minute naturally for a period of 10 min, simulating an outdoor commute. During this time, they completed the questionnaire at five-minute intervals.
Subsequently, volunteers entered an indoor transition space with varying temperatures. They walked for one minute, stood for three minutes, and then walked for another minute to simulate passing through this transition space before entering an air-conditioned room.
Finally, volunteers returned to Room 1 which was maintained at a temperature of 25 °C and sat silently for a duration of 20 min. They filled out questionnaires initially at two-minute intervals and later switched to four-minute intervals after eight minutes had passed.
Fig. 1.

Experimental procedure.
In the experiment, volunteers were permitted to read and engage in conversation, but they were prohibited from exchanging any remarks pertaining to the thermal environment or the test conditions. Each volunteer took part in all experimental conditions, with the order of participation being counterbalanced among them.
Experimental platform
This experiment was carried out on the rooftop of the seventh floor of an educational building in and the experimental rooms were arranged as shown in Fig. 2. All rooms had dimensions of 2.8 m × 2.8 m × 3.0 m to accurately simulate an indoor transition space environment. As per previous research by Zhao et al.11, it has been observed that human thermal sensation overshoot occurs when there is a temperature difference exceeding 5℃ between two adjacent rooms. In this particular experiment, the neutral room temperature was set at 25 °C, and thus, it was imperative for the transition space temperature to remain below or equal to 30 °C. Consequently, three different air temperatures (25 °C, 27 °C, and 29 °C) were assigned to the transition space in order to investigate its impact.
Fig. 2.

Floor plan of the laboratory room.
Test methods and questionnaires
Environmental parameters
The environmental parameters were continuously measured throughout the experiments. Air temperature (Ta), relative humidity (RH), Globe temperature (Tg), and air speed (Va) were recorded using calibrated fast response instruments, as presented in Table 1. These measurements generally adhere to the accuracy requirements specified by ISO 7726 standard19. Indoor Ta and RH were monitored every minute at three different heights above the floor (0.1 m, 0.6 m, and 1.1 m) using a Testo 174H thermometer positioned at the center of the room. Tg was measured every minute at a height of 0.6 m from the ground utilizing a JT2011 black bulb thermometer, while Va was recorded every minute at heights of 0.1 m, 0.6 m, and 1.1 m from the ground using JT2020 omnidirectional anemometers placed at two participants’ centers within the room setup. All outdoor environmental parameters were measured at a height of 1.1 m above ground level. According to ASHRAE Standard 5520, due to indoor air temperature closely approximates average radiant temperature, it can be assumed that operative temperature remains consistent with the experimental setup.
 |
1 |
 |
2 |
where D is the globe diameter (D = 0.05 m in this study), and εg is the emissivity (εg = 0.95 in this study).
Table 1.
Ranges and Accuracy of Experimental Instruments.
| Instrument name | Type | Parameters | Measuring range | Accuracy |
|---|---|---|---|---|
| Hygrothermograph | Testo174H |
Air temperature Relative humidity |
-40℃-70℃ 0–100%RH |
± 0.5℃ ± 3%RH |
| Omnidirectional anemometer | JT2020 | Air velocity | 0-5 m/s | ± (0.03 m/s + 2%) |
| Black bulb thermometer | JT2011 | Globe temperature | 0∼ + 120 °C | ± 0.5 °C |
| Skin temperature mater | iButton DS1923 | Skin temperature | -20℃-85℃ | ± 0.1 °C |
| Heart rate meter | Ezon-C009pro | Heart rate | 40-220 bpm | ± 5% |
Physiological measurements
The skin temperature (Tsk) was continuously measured using iButton at 1-min interval, with a total of 4 measurement points of chest, left forearm, left thigh and left leg, and the human measurement points are shown in Fig. 3. The mean skin temperature (mTsk) can be gained as following:
 |
3 |
Fig. 3.

Anthropometric point and questionnaire information.
The heart rate belt was worn on the chest and the heart rate was continuously monitored during the experiment. However, Bröde21 et al. discovered an error in estimating metabolic rate using heart rate according to ISO 899622. Therefore, this study incorporated the relationship equation established by the published studies23–25 and others to derive equations for accurately estimating both metabolic and heart rates for males and females.
 |
4 |
 |
5 |
where HRrest is the heart rate of a human at rest and HR is the heart rate in the experimental state.
Questionnaire survey
The experiment involved 40 healthy university students (20 males and 20 females), with their demographic information presented in Table 2. The experiments were approved by the University Ethics Committee (IRB number: QUT-HEC-2024023) and the informed consent was obtained from all subjects. A prerequisite for participation was residing in Qingdao city for at least one year. Exclusion criteria encompassed recent illness within a week prior to the experiment, diagnosed health conditions such as high blood pressure or neurological problems, regular medication usage, color blindness, or skin diseases affecting temperature perception. During the experiment, participants wore t-shirts, pants, socks, and sneakers with an estimated clothing insulation value of approximately 0.3clo. To capture wear information and subjective thermal perception from participants throughout the study period, a questionnaire was employed. This questionnaire included components assessing Thermal Sensation Vote (TSV), Thermal Comfort Vote (TCV), and Thermal Acceptability Vote (TAV). All three components were scored on a standardized symmetrical 7-point scale as depicted in Fig. 3.
Table 2.
Anthropometric data of volunteers.
| Gender | Sample size | Age(y) | Height(m) | Weight(kg) | BIM(kg/m2) |
|---|---|---|---|---|---|
| Male | 20 | 25.5 ± 3.00 | 178.5 ± 0.04 | 82.35 ± 9.95 | 25.30 ± 2.78 |
| Female | 20 | 25.2 ± 1.27 | 165.1 ± 0.37 | 51.8 ± 3.19 | 18.99 ± 0.63 |
| Total | 40 | 25.39 ± 2.21 | 171.1 ± 0.07 | 64.64 ± 15.99 | 21.79 ± 3.67 |
Data analysis
The data were analyzed using SPSS V27.0, with physiological responses presented as the mean and subjective responses presented as the mean and standard deviation (SD). The significance level for the aforementioned tests was set at 0.05, and statistical significance was observed when P < 0.05.
Moreover, regression analysis was employed in this study to examine the association between environmental parameters, thermal indices (PET/SET*/UTCI), and thermal sensations. The relevant physical parameters (air temperature Ta, humidity RH, wind speed va, and mean radiant temperature Tmrt) as well as individual parameters (age, gender, height, weight, metabolic rate, and clothing thermal resistance) were inputted into the RayMan Pro software for PET and SET* calculations. Additionally, these values were obtained from the project website (www.utci.org) based on the multi-node model for human thermal regulation developed by the UTCI model, with corresponding physical parameters provided for computations.
Results and discussion
The environmental parameters of the outdoor, indoor, and transition spaces are presented in Table 3. The disparity in air temperature and relative humidity between outdoors and indoors was recorded as 5.89 °C and 13.02%, respectively. As the experiment took place during a summer morning, the outdoor air temperature gradually rose by 2 °C over a span of 35 min, while the indoor air temperature stabilized at approximately 25 °C. In the three rooms comprising the simulated transition space (Case 1, Case 2 & Case 3), the air temperatures were regulated to around 25 °C, 27 °C, and 29 °C respectively; with a relative humidity level of about 65% and room air velocity maintained at approximately 0.1 m/s.
Table 3.
Outdoor, indoor and transitional space environments during experiments.
| Parameters | Outdoor environment | Indoor environment | Thermal environment in transition spaces | ||
|---|---|---|---|---|---|
| Case 1 | Case 2 | Case 3 | |||
| Air temperature(℃) | 30.89 ± 1.17 | 25.0 ± 0.45 | 25.08 ± 0.52 | 27.15 ± 0.29 | 28.97 ± 0.37 |
| Relative humidity(%) | 79.00 ± 2.23 | 65.98 ± 1.66 | 66.54 ± 13.7 | 66.03 ± 1.49 | 67.38 ± 0.72 |
| Globe temperature(℃) | 33.86 ± 2.67 | 25.30 ± 0.57 | 25.48 ± 0.64 | 27.18 ± 0.26 | 28.93 ± 0.43 |
| Wind speed(m/s) | 0.91 ± 0.59 | 0.07 ± 0.05 | 0.10 ± 0.05 | 0.07 ± 0.04 | 0.10 ± 0.06 |
Physiological response
The changes in mean skin temperature (mTsk) during the experiment are illustrated in Fig. 4. In the outdoor environment, mTsk gradually increased and tended to decrease as we moved from the outdoor to the transition space. Within the transition space, case1, case2 and case3 decreased by 0.31 °C, 0.13 °C and 0.07 °C, respectively. It indicated the air temperature in transition spaces has the certain effect in mTsk. After entering the 25 °C room from the transition space, the mTsk gradually stabilized for each group. The mTsk returning to the 25 °C room after experiencing different heat exposures was higher than their stabilized temperature prior to the heat exposure, which is consistent with Ji et al.26.
Fig. 4.

Mean skin temperature variation under different operating conditions.
Figure 5 illustrates the changes in average heart rate during the experiment. Upon entering the outdoor area, the heart rates generally increased to around 90 bpm due to the rise in air temperature and metabolic rate. After transferring to the transition space, as the ambient temperature decreased, the heart rates of case1, case2 and case3 decreased by 7.67 bpm, 4.53 bpm, and 3.93 bpm for three cases, respectively, and following returning to the neutral room for meditation, they returned to the stable heart rates prior to the thermal experience. The significance of mTsk and HR at the final minute of the transition space under various operational conditions is presented in Table 4.
Fig. 5.

Mean heart rate variation under different operating conditions.
Table 4.
Significance of variables in transition space for different working conditions.
| Variant | Case1&2 | Case1&3 | Case2&3 |
|---|---|---|---|
| mTsk | 0.032* | 0.000** | 0.06 |
| HR | 0.022* | 0.041* | 0.000** |
| TSV | 0.017* | 0.000** | 0.000** |
| TCV | 0.024* | 0.000** | 0.000** |
The changes in local skin temperatures are presented in Fig. 6. As shown, the sensitivity order was as follows: forearm > leg > thigh > chest. And change values for forearm, leg, thigh and breast are 0.46 °C, 0.35 °C, 0.33 °C, and 0.19 °C in outdoor environment and 0.46 °C, 0.45 °C, 0.40 °C, and 0.25 °C in the transition space, respectively. This finding aligns with the research results of Xiong’s27, which suggest that under the shift in thermal environment conditions, blood circulation primarily focuses on protecting major organs and maintaining core temperature within a narrow range, but legs and hands exhibit greater sensitivity to environmental changes due to their distal location and exposure to indoor air.
Fig. 6.

Skin temperature changes in the forearm, the chest, the thigh and the leg.
Subjective reflection
The temporal variation of the Thermal Sensation Vote (TSV) under the temperature step is illustrated in Fig. 7. Outdoor TSV exhibited a significant increase over time, and upon entering the transition space and being influenced by ambient temperature, the TSV of Cases1, Case2 and Case3 decreased by 1.63, 1.56, and 0.97 respectively. Notably, the initial TSV in Case 1 was lower than subsequent levels observed, indicating an occurrence of overshooting as reported in a similar study28. This finding shows that the magnitude of the temperature step serves as the primary cause for this phenomenon. Upon returning to a neutral room at 25 °C thereafter, there was a rapid decrease in thermal sensation, which stabilized within less than one minute—consistent with previous findings by Xiong et al.27. Furthermore, our experiments revealed a new asymmtry: average thermal sensation vote significantly changed before and after undergoing the step change under neutral conditions; specifically shifting from neutrality prior to experiencing the step change to below neutrality upon returning to a neutral room from a warm environment—aligning with results obtained by Du et al.29.
Fig. 7.

Variation of TSV under different operating conditions.
The temporal variation of the Thermal Comfort Vote (TCV) under the temperature step is illustrated in Fig. 8. Discomfort gradually increased as volunteers were exposed to outdoor conditions, with the TCV greater than -1(‘‘Slightly uncomfortable’’). Upon entering the transition space, thermal comfort rapidly recovered, resulting in respective increases of 1.92, 2.16, and 1.81 for Case1, Case2 and Case3. Due to variations in ambient temperature changes, the rates at which TCV increased differed among the cases: flowing from Case 1 to Case 2 and then to Case 3; indicating that TCV is influenced by the magnitude of step-change experienced. Upon returning to a neutral room temperature of 25 °C, TCV increased rapidly and stabilized within less than 1 min. This pattern is similar to that observed for thermal sensation vote (TSV) changes. The significance of TSV and TCV at the final minute of the transition space under various operational conditions is presented in Table 4.
Fig. 8.

Variation of TCV under different operating conditions.
Methods for predicting acceptable temperature ranges in transition spaces
To investigate the optimal temperature for human thermal comfort in the transition space, the degree of variation of Mean Thermal Sensation Voting (MTSV) is calculated with different thermal indices including Physiological Equivalent Temperature (PET), Standard Effective Temperature (SET*), and Universal Thermal Climate Index (UTCI). Following the research method employed by Gao et al.30, the subjective thermal sensation voting values was averaged corresponding to each 1 °C interval of PET/SET*/UTCI by calculating their mean value. Subsequently, the obtained mean thermal sensation voting values was regressed against their corresponding thermal indices to solve regression equations and establish relationships between MTSV and PET/SET*/UTCI, respectively.
Prediction methods based on thermal sensation and thermal index
Figure 9 demonstrates the fitting degrees between PET, SET*, and UTCI with MTSV in various thermal environments. Overall, UTCI exhibits a significantly superior fitting with MTSV compared to PET and SET*, although the R2 values differ notably across different thermal environments. Specifically, during outdoor walking, UTCI shows a weak linear relationship with MTSV (R2 = 0.482), while PET and SET* exhibit no linear relationship with MTSV. None of the thermal indices demonstrates a linear relationship with MTSV during indoor walking in transitional spaces. However, when sitting indoors, all thermal indices display strong linear relationships with MTSV, characterized by regression coefficients exceeding 0.7.
Fig. 9.
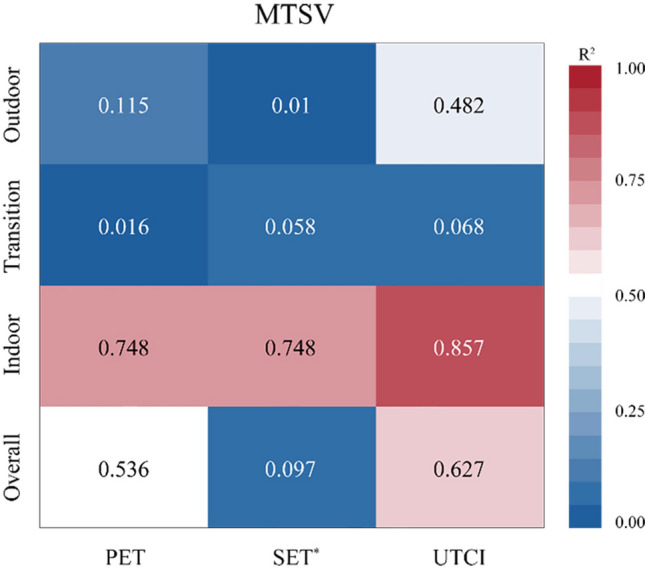
The fitting degree of thermal sensation and thermal index for different operating conditions.
Therefore, the UTCI can serve as a reliable indicator for predicting average thermal sensations experienced during commuting across various thermal environments.
 |
6 |
Prediction methods based on thermal sensation and environmental parameters
To further investigate the relationship between objective parameters and subjective evaluations, as well as to enhance the accuracy of regulating transition space temperature, regression analyses and comparisons were conducted between the ambient temperature difference and the instantaneous changes of TSV and TCV. Figures 10 and 11 illustrate the variations in TSV and TCV with respect to the ambient temperature difference following space transition. Specifically, TSV10min represents subjective evaluations during the last minute spent outdoors, while TSV11min corresponds to subjective evaluations upon entering the transition space. Similarly, TSV15min denotes subjective evaluations during the last minute of being in the transition space, whereas TSV16min refers to subjective evaluations upon entering a neutral indoor room. Consequently, it can be observed that changes in TSV align with changes in temperature directionally, whereas for TCV, the opposite is true.
Fig. 10.

Regression analysis of instantaneous TSV versus ambient temperature difference.
Fig. 11.

Regression analysis of instantaneous TCV versus ambient temperature difference.
The regression analysis of TSV variation with ambient temperature difference for are as follows:
 |
7 |
 |
8 |
The regression analysis of TCV variation with ambient temperature difference are as follows:
 |
9 |
 |
10 |
Prediction methods based on thermal acceptability and environmental parameters
The direct method was employed in this study to determine the acceptable temperature step by directly converting Thermal Acceptability (TAP) into Percent Dissatisfaction (PD). A second-order polynomial function was established to analyze the dissatisfaction rate at the initial moment of entry into the new environment (20% PD) in relation to the difference in operative temperatures. Figure 12 illustrates the regression analysis of the operative temperature step versus dissatisfaction rate for transitioning from outdoor to transition space and from transition space to indoor, respectively. Based on these results and experimental conditions, it can be concluded that the acceptable temperature step from outdoor to transition space ranges from 2.96 °C-5.82 °C, corresponding to a transition space temperature range of 25.07 °C-27.93 °C. Similarly, for transitioning from transition space to indoor, an acceptable temperature step ranging from 0.00 °C -4.90 °C is observed, with a corresponding transition space temperature range of 25.3 °C-30.22 °C considered optimal considering energy consumption factors associated with building use. Thus taking the intersection of the two, the most reasonable temperature range 25.3 °C-27.93 °C.
Fig. 12.
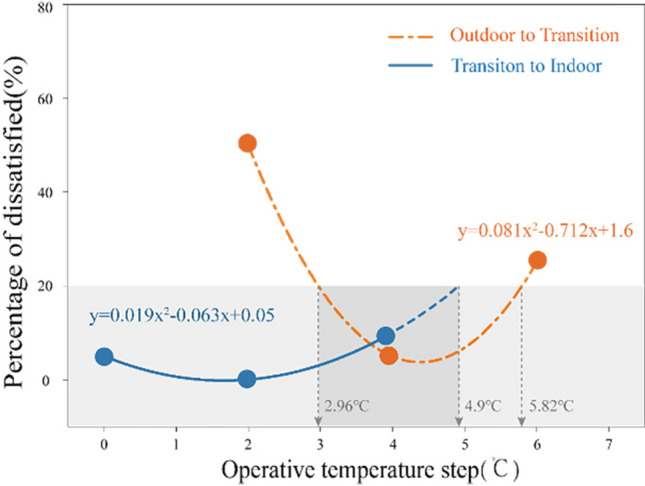
Relationship between dissatisfaction rate and operative temperature step size.
Limitations and future work
The results of this study were obtained by observing subjects as they transitioned from outdoor environments to indoor transitional spaces and finally to indoor neutral rooms. It is important to acknowledge the limitations of this study to accurately interpret the findings.
Firstly, with regards to the experimental design, it is possible that the 20-min preparation (rest) period in this study might not have provided sufficient time for participants to achieve homeostasis. Liu et al.30 reported that skin temperature stabilization took approximately 10–15 min for ascending conditions (25–32 °C, 25–30 °C, 25–28 °C), while descending conditions (32–25 °C, 30–25 °C, 28–25 °C) required around 20 min for temperature stabilization. It should be noted that descending conditions necessitated a longer duration to reach stability compared to ascending conditions.
Furthermore, considering the diverse outdoor environments encountered, a greater number of transitional conditions were observed. To develop a proof-of-concept model that accurately predicts transition space temperatures aligned with human thermal comfort, three representative indoor transition spaces were carefully selected for preliminary investigation. However, it should be noted that these conditions may not encompass all potential real-world scenarios.
Finally, the participants in this study consisted exclusively of school students who shared similar ages, educational backgrounds, and social experiences. This deliberate selection aimed to ensure controlled experimental conditions for enhanced efficiency; however, it is imperative to investigate the direct applicability of these findings to broader social groups and environments. Future research should focus on expanding the sample size in order to enhance the generalizability of the research outcomes.
Conclusions
The thermal comfort of the transition space in summer was investigated by simulating the sudden changes in the thermal environment from the outdoors through the transition space into the indoor air-conditioned room, combined with physiological and psychological indicators. The aim was to determine the appropriate air-conditioning temperature for the indoor transition space. The main findings were as follows:
The air temperature in the transition space exerted a significant influence on the extent of change in mTsk, decreasing it by 0.31 °C, 0.13 °C, and 0.07 °C for the three operating conditions of case1, case2, and case3, respectively. Moreover, distinct body regions displayed varying sensitivities to temperature variations, with forearms being most responsive followed by legs, thighs, and chest consecutively.
Upon transitioning from the outdoor environment, the TSV decreased by 0.31, 0.13, and 0.07 for case1, case2, and case3, respectively, while experiencing an increase in TCV by 1.9, 2.16, and 0.81 correspondingly. These findings suggest that maintaining a temperature of 27 °C is more optimal for the transition space.
During the transition across thermal environments, the UTCI exhibited a closer fit to the MTSV compared to PET and SET*. However, when focusing on the transitional space, none of these three thermal metrics showed a significant linear relationship with the MTSV. The linear relationship between ∆TSV and Ta is more pronounced than that of ∆TCV.
The acceptable temperature range for the transition space in this experiment was predicted using a second-order functional relationship, taking into account thermal acceptability and ambient temperature difference. The resulting range of 25.3–27.93 °C represents the most reasonable temperature based on these factors.
Author contributions
T.Z. and X.M. wrote the main manuscript text, and they prepared all figures. T.Z. and X.M. done the experimental design and completed the experiment. X.M. supervised. All authors reviewed the manuscript.
Funding
National Natural Science Foundation of China,52478093
Data availability
All data generated or analyzed during this study are included in this published article.
Competing interests
The authors declare no competing interests.
Footnotes
Publisher’s note
Springer Nature remains neutral with regard to jurisdictional claims in published maps and institutional affiliations.
References
- 1.Santamouris, M. Recent progress on urban overheating and heat island research. Integrated assessment of the energy, environmental, vulnerability and health impact. synergies with the global climate change. Energy Build.207, 109482 (2020). [Google Scholar]
- 2.Meng, X. Influence of Air-Conditioning intermittent operation on the cooling load from opaque envelopes in residences. Case Stud. Therm. Eng.58, 104393 (2024). [Google Scholar]
- 3.Laschewski, G. & Jendritzky, G. Effects of the thermal environment on human health: an investigation of 30 years of daily mortality data from SW Germany. Climate Res.21, 91–103 (2002). [Google Scholar]
- 4.Pitts, A. & Saleh, J. B. Potential for energy saving in building transition spaces. Energy Build.39, 815–822 (2007). [Google Scholar]
- 5.Ghaddar, N., Ghali, K. & Chehaitly, S. Assessing thermal comfort of active people in transitional spaces in presence of air movement. Energy Build.43(10), 2832–2842 (2011). [Google Scholar]
- 6.Azimi, Z., Kashfi, S. S., Semiari, A. & Shafaat, A. Outdoor thermal comfort in open transitional spaces with limited greenery in hot summer/cold winter climates. Discov. Environ.2(31), 2–31 (2024). [Google Scholar]
- 7.Pitts, A., Saleh, J., Sharples, S. Building transition spaces, comfort and energy use. In 25th Conference of Passive and Low Energy Architecture, 22–24 (Dublin,2008).
- 8.Hui, S. C., Jiang, J. Assessment of thermal comfort in transitional spaces. In Proceedings of the Joint Symposium 2014: Change in Building Services for Future (2014).
- 9.Xiong, J., Lian, Z. W. & Zhang, H. B. Effects of exposure to winter temperature step-changes on human subjective perceptions. Build. Environ.107, 226–234 (2016). [Google Scholar]
- 10.Xiong, J., Lian, Z. W. & Zhou, X. Investigation of subjectively assessed health symptoms and human thermal perceptions in transient thermal environments. Procedi. Eng.121, 212–216 (2015). [Google Scholar]
- 11.Zhao, R. Y. Investigation of transient thermal environments. Build. Environ.42, 3926–3932 (2017). [Google Scholar]
- 12.Cao, B., Shang, Q., Dai, Z. & Zhu, Y. The impact of air-conditioning usage on sick building syndrome during summer in China. Indoor Built. Environ.22(3), 490–497 (2013). [Google Scholar]
- 13.Shanyuan, G. & Lihua, X. Hygienic investigation and evaluation of air-conditioned train. J. Environ. Health14(3), 137 (1997). [Google Scholar]
- 14.Ruojing, P. Prevention and control of air conditioning disease – clinical analysis of 56 air-conditioning syndrome cases. J. Prev. Med. Inf.64 (1995).
- 15.Huang, T. Y., Niu, J. L., Xie, Y. X., Li, J. N. & Mak, C. M. Assessment of “lift-up” design’s impact on thermal perceptions in the transition process from indoor to outdoor. Sustain. Cities Soc.56, 102081 (2020). [Google Scholar]
- 16.Zhai, Y. C. et al. Using personally controlled air movement to improve comfort after simulated summer commute. Build. Environ.165, 106329 (2019). [Google Scholar]
- 17.Zhang, Z. J., Zhang, Y. F. & Ding, E. Acceptable temperature steps for transitional spaces in the hot-humid area of China. Build. Environ.121, 190–199 (2017). [Google Scholar]
- 18.Nagano, K., Takaki, A., Hirakawa, M. & Tochihara, Y. Effects of ambient temperature steps on thermal comfort requirements. Int. J. Biometeorol.50, 33–39 (2005). [DOI] [PubMed] [Google Scholar]
- 19.ISO International Standard 7726. Ergonomics of the thermal environment-instruments for measuring physical quantities (1998).
- 20.ANSI/ASHRAE. Standard 55–2017: Thermal Environmental Conditions for Human Occupancy (2017).
- 21.Bröde, P. & Kampmann, B. Accuracy of metabolic rate estimates from heart rate under heat stress-an empirical validation study concerning ISO 8996. Ind. Health.57, 615–620 (2019). [DOI] [PMC free article] [PubMed] [Google Scholar]
- 22.ISO International Standard 8996. Ergonomics of the thermal environment-instruments for measuring physical quantities (2021).
- 23.Gao, Y., Ge, L. M., Zhong, T. & Meng, X. Effect of water mist stimulation on dynamic thermal response of pedestrians in summer. Build. Environ.246, 110988 (2023). [Google Scholar]
- 24.Zhang, H. & Edward, A. Using a Driving Game to Increase the Realism of Laboratory Studies of Automobile Passenger Thermal Comfort. SAE Tech. Pap. Ser.10.4271/2003-01-2710 (2003). [Google Scholar]
- 25.Meng, X. Analysis on Rotation Timing of Dynamic Rotating Latent-Energy-Storage Envelope (RLESE). Dev. Built. Environ.19, 100498 (2024). [Google Scholar]
- 26.Ji, W. J., Cao, B., Geng, Y., Zhu, Y. X. & Lin, B. R. Study on human skin temperature and thermal evaluation in step change conditions: From non-neutrality to neutrality. Energy Build.156, 29–39 (2017). [Google Scholar]
- 27.Xiong, J., Zhou, X., Lian, Z. W., You, J. X. & Lin, Y. B. Thermal perception and skin temperature in different transient thermal environments in summer. Energy Build.128, 155–163 (2016). [Google Scholar]
- 28.Zhai, Y. C. et al. Transient human thermo physiological and comfort responses indoors after simulated summer commutes. Build. Environ.157, 257–267 (2019). [Google Scholar]
- 29.Du, X. et al. The Response of human thermal sensation and its prediction to temperature step-change (cool-neutral-cool). PLOS One.9, e104320 (2014). [DOI] [PMC free article] [PubMed] [Google Scholar]
- 30.Gao, Y., Meng, L., Li, C. Y., Ge, L. M. & Meng, X. An experimental study of thermal comfort zone extension in the semi-open spray space. Dev. Built. Environ.15, 100217 (2023). [Google Scholar]
Associated Data
This section collects any data citations, data availability statements, or supplementary materials included in this article.
Data Availability Statement
All data generated or analyzed during this study are included in this published article.