Abstract
This longitudinal study sought to identify distinct body mass index (BMI) trajectories and investigate the impact of these level-independent BMI trajectories on the prevalence of thyroid nodules (TN).
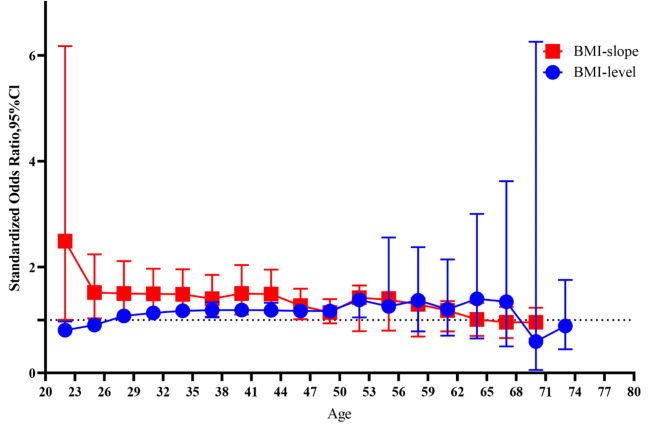
This study encompassed a cohort of 1967 participants from a hospital in China. Utilizing latent class growth mixture modeling (LCGMM), four BMI trajectory groups were identified based on the BMI of individuals without TN from 2017 to 2019. The occurrence of TN in participants was monitored from 2020 to 2021. BMI trajectory classes and age were considered potential risk factors for TN development. After adjusting for covariates, the odds ratios (ORs) of model-estimated BMI levels were confirmed in the 27-50-year age group, ranging from 1.077 (1.000–1.158) to 1.189 (1.072–1.319). Significant associations between model-estimated BMI slope and TN were observed in the 21-47-year-old age group, with ORs varying between 1.270 (1.014, 1.591) and 2.490 (1.004, 6.174). The level-independent BMI trajectories throughout life significantly influenced the risk of TN prevalence. Moreover, controlling BMI growth rate in early adulthood (27–47 years old) emerged as a critical age window for reducing TN prevalence, underscoring its importance in TN prevention strategies.
Supplementary Information
The online version contains supplementary material available at 10.1038/s41598-024-84839-6.
Keywords: Body mass index trajectory, Body mass index slope, Thyroid nodule, Cohort study, Latent class growth mixture modeling
Subject terms: Obesity, Thyroid diseases
Introduction
Concurrent with rapid socioeconomic development and the rise in unhealthy lifestyles, overweight and obesity have gradually become serious threats to public health, with prevalence rates reaching 39% and 13%, respectively1. Concomitantly, the incidence of thyroid nodules (TN) has increased annually, reaching 36.9% according to a 2021 epidemiological survey2. While benign thyroid nodules do not significantly impact health, an estimated 7-15% are malignant3. Additionally, there has been a notable increase in treatments for potentially unnecessary thyroid nodules (including surgery and radiofrequency ablation), consuming substantial medical resources. Consequently, early identification of risk factors for TN is crucial for prevention.
Numerous observational studies have previously identified a positive association between body mass index (BMI) and TN, indicating that the prevalence of TN increases incrementally with rising BMI4–9. Subsequent cohort studies have further explored the strong correlation between TN size and BMI10. To date, several mechanisms have been proposed to elucidate the relationship between overweight or obesity and TN, including insulin resistance/hyperinsulinemia coexistence, chronic systemic proinflammatory states, abnormalities in hormone biosynthesis, and hormonal pathways11, among others. However, some evidence suggests that BMI may not be a risk factor for TN, which could be attributed to the cross-sectional nature of these studies, overlooking dynamic BMI changes12. Consequently, the role of overweight or obesity as a risk factor for TN remains a subject of debate.
To comprehensively examine this complex topic, our study sought to identify distinct BMI trajectories across various age groups by establishing a longitudinal cohort of individuals aged 20–80 years in China from 2017 to 2021. The research aimed to thoroughly investigate the potential association between BMI trajectories and TN, and to pinpoint the critical period for TN development in relation to accelerated BMI increase.
Materials and methods
Study population
A cohort of 1976 participants (1502 males and 468 females) was recruited from a study conducted at the First Affiliated Hospital of Zhengzhou University between January 2017 and December 2021. The incidence of TN was monitored from 2020 to 2021 among participants who had not been diagnosed with TN during the 2017–2019 period.
This research included individuals aged 20–80 years who completed a questionnaire survey, underwent biochemical examination, and thyroid ultrasound examination. The study excluded: (1) Subjects with the body mass index (BMI) ≥ 32 kg/m2; (2) individuals with thyroid-related diseases or undergoing thyroid-related drug treatment; (3) those with severe liver and kidney diseases or tumor diseases; (4) participants with a history of head and neck radiation exposure in childhood; (5) subjects with a family history of thyroid cancer; and (6) pregnant or lactating women. The exclusion of individuals with BMI ≥ 32 kg/m2 was primarily due to their small number, which could introduce statistical bias if included. Moreover, some obese individuals with BMI ≥ 32 kg/m2 may require surgical intervention. All participants provided written informed consent. The Ethical Review Committee of Scientific Research Projects of the First Affiliated Hospital of Zhengzhou University approved this study (No.:2018-KY-56). All methods adhered to relevant guidelines and regulations.
Data collection
At each follow-up, demographic characteristics (age, gender, etc.), disease status, and medication history were collected through face-to-face standardized questionnaire interviews conducted by a designated individual. The weight and height of participants were measured while wearing light clothing without shoes (Sonka, SK-X80, Shenzhen). BMI was calculated using the formula: weight (kg)/height squared (m)2. Blood pressure was measured using an OMRON sphygmomanometer (HBP-9021, Dalian) three consecutive times. The systolic blood pressure (SBP) and diastolic blood pressure (DBP) were recorded as the average of these measurements.
Venous blood samples were obtained from participants after an 8-hour fasting period. The laboratory examination encompassed measurements of fasting plasma glucose (FPG), glycosylated hemoglobin (HbA1c), triglycerides (TG), total cholesterol (TCHO), high-density lipoprotein cholesterol (HDL-C), low-density lipoprotein cholesterol (LDL-C), and serum uric acid (SUA). The triglyceride-glucose (TyG) index was calculated using the following formula: TyG = ln [TG (mg/dl) × FPG (mg/dl)/2]13.
Two experienced sonographers examined the thyroid gland of the subjects using a Philips Affiniti 500 color Doppler ultrasound system. The diagnosis of TN was based on the thyroid imaging reporting and data system criteria14. Participants diagnosed with TN were classified as the TN group, while those without TN constituted the non-TN group.
Statistical analysis
Statistical analysis was conducted using R 4.0.2 software. Normally distributed measurement data were represented as mean ± standard deviation (x ± s), and comparisons between groups were performed using one-way analysis of variance. Counting data were expressed as percentages (%), and rate comparisons were assessed using the χ2 test. The Kaplan-Meier method was employed to calculate the cumulative incidence of TN in each group, while the log-rank test was utilized to compare the cumulative incidence of TN across different BMI trajectory groups. The Cox proportional hazard regression model was applied to analyze the risk of TN in the BMI trajectory groups.
To identify distinct BMI trajectory patterns15, we employed latent class growth mixture modeling (LCGMM). The potential category trajectory of BMI was specified as a function of age. We evaluated several LCGMMs with various trajectory shapes, including linear and nonlinear parameters. By varying the number of groups from 2 to 5 and utilizing the same starting value calculated from the 1-group model, we conducted repeated trajectory analyses to identify potential categories. The class membership of each subject was determined by a latent discrete random variable, with probabilities described by a multinomial logit model according to the covariates. The optimal shape and number of groups were identified based on the following criteria: (1) minimization of Bayesian information criterion; (2) average posterior probability assignment (APPA) exceeding 70%; (3) more than 60% of each group having posterior probabilities > 70%; (4) each group comprising at least 5% of the total population. We utilized the LCMM (version 2.0.2) software package in R (version R (4.2.1)) to estimate the latent class models. Multiple random initial value sets were employed to solve the Class 2–5 LCGMM models repeatedly, based on the Class 1 model, to avoid convergence to local maxima. Ultimately, the best-fitting model according to the aforementioned criteria consisted of four groups with quadratic trajectories.
Additionally, LCGMM computed the estimation of conic parameters, encompassing both fixed effect and random effect parameters. The random effect coefficient signified the deviation between the fixed effect parameters and the observed values for each individual. Furthermore, by integrating fixed effect and individual-specific random effect parameters, 1976 distinct curve parameters were generated for each participant in the research cohort. The BMI level and slope estimated by the model were calculated at three-year intervals for each age point based on the model parameters. The Pearson correlation coefficient was employed to assess the correlation between the BMI model estimation level and BMI slope. Logistic regression analysis was utilized to examine the association between BMI levels and slopes estimated by the model and TN at various ages. P < 0.05 (two-sided test) was considered statistically significant.
Results
BMI trajectory grouping
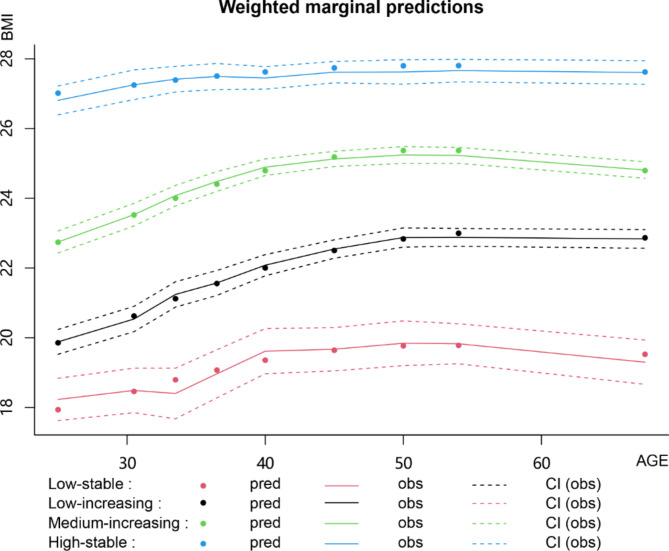
The study included 1,976 subjects (mean age, 41.14 ± 11.49 years), of whom 468 (23.68%) were females, and 347 (17.56%) had TN. Four distinct trajectory groups of BMI were identified and labeled as low-stable (n = 97), low-increasing (n = 653), medium-increasing (n = 784), and high-stable (n = 442). In the low-stable group, BMI fluctuated from 16.15 Kg/m2 at age 24 years to 21.41 Kg/m2 at age 50 years. The low-increasing group showed a BMI increase from 17.25 Kg/m2 at age 21 years to a peak of 28.91 Kg/m2 at age 48 years. The medium-increasing group’s BMI rose from 24.59 Kg/m2 at age 21 years to 29.59 Kg/m2 at age 38 years. In the high-stable group, BMI values ranged from 21.16 Kg/m2 at age 21 years to 29.99 Kg/m2 at age 48 years (Fig. 1).
Fig. 1.
BMI Trajectory groups.
Participants in the high-stable class demonstrated elevated levels of BMI, BP, TC, TG, LDL-C, SUA, and TyG compared to those in other classes (Table S1).
Incidence of TN in different BMI trajectory groups
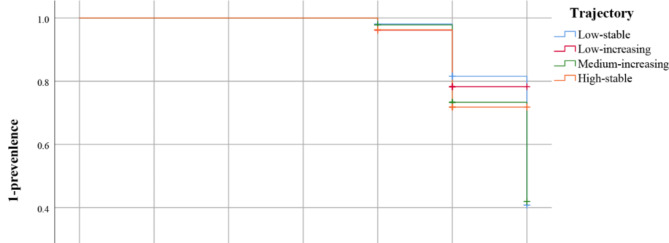
The mean follow-up duration was 4.82 years (range: 3 to 5 years). The highest prevalence of TN was.
at the final follow-up, and the distribution of participants across groups was as follows: 25.11% in the high-stable group, 24.62% in the medium-increasing group, 23.21% in the low-increasing group, and 13.40% in the low-stable group (Fig. 2).
Fig. 2.
Incidence of TN in different BMI trajectory groups.
Risk factors for TN
The univariate Cox regression model revealed that the BMI trajectory groups, age, and FPG were.
independently associated with TN (Table S2). However, the multivariable Cox regression model results indicated that only the BMI trajectory classes and age were independent predictors of TN presence (Table 1).
Table 1.
Multivariate Cox proportional hazard regression model analysis of the risk of TN.
| β | SE | Wald | HR (95%CI) | P value | |
|---|---|---|---|---|---|
| Group | |||||
| Low-stable | 1 | ||||
| Low-increasing | 0.56 | 0.289 | 3.752 | 1.751(0.993 ~ 3.086) | 0.053 |
| Medium-increasing | 0.631 | 0.287 | 4.845 | 1.879(1.072 ~ 3.295) | 0.028* |
| High-stable | 0.64 | 0.293 | 4.758 | 1.896(1.067 ~ 3.367) | 0.029* |
| Age | |||||
| ≥ 60 | 1 | ||||
| 20–60 | 0.499 | 0.151 | 8.849 | 1.567(1.166 ~ 2.107) | 0.003* |
*P<0.05.
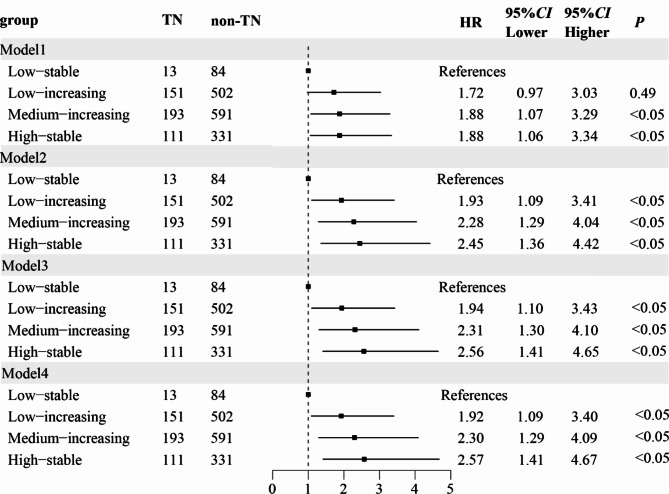
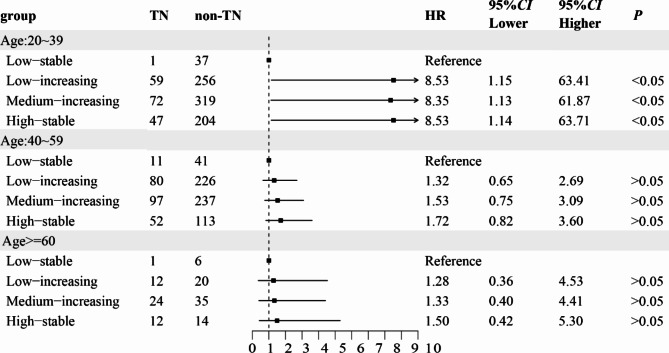
Following additional covariate adjustment, the hazard ratios (HRs) in the low-increasing group, middle-increasing group and the high-stable group were 1.924 (1.087 ~ 3.404), 2.299 (1.294 ~ 4.084) and 2.571 (1.414 ~ 4.675), respectively (Fig. 3, Table S3). Furthermore, considering the elevated risk of TN in individuals aged 20–60 years, we examined the impact of BMI trajectories on TN occurrence within this age subgroup. The findings revealed that as the BMI group increased, the prevalence of TN progressively rose in those aged 20–39 years, but not in other age groups (Fig. 4).
Fig. 3.
Risk model of TN in different BMI trajectory groups. Model 1: unadjusted. Model 2: adjusted for sex and age. Model 3: adjusted for BP based on model 2. Model 4: adjusted for blood lipid, SUA, FBG, HbA1c, and TyG index based on model 3.
Fig. 4.
Age subgroup analysis of TN risk in different BMI trajectory groups.
The relationship between BMI levels and slopes estimated by the model and TN at different ages
Given that the correlations between the BMI model-estimated levels and observed values were significant (P < 0.001), ranging from 0.91 to 0.97 at age points from 21 to 79 years (Fig. S1), our study evaluated the relationship between BMI and TN using the BMI model-estimated level. The OR value gradually increased from 0.809 (0.675–0.970) to 1.189 (1.072–1.319) and then decreased to 1.168 (1.065–1.282) between ages of 21 to 50 years. Furthermore, in analyzing the relationship between the increased velocity of BMI and TN, we primarily observed that the BMI model-estimated level was closely related to the slope of BMI (Fig. S2) (P < 0.001 for all age points except for P = 0.65 at age 57–59 years and P = 0.72 at age 60–62 years). Secondly, the linear slope of BMI level adjustment at ages 21–47 years was significantly associated with the prevalence of TN, with ORs fluctuating between 1.270 (1.014, 1.591) and 2.490 (1.004, 6.174). This evidence demonstrates that the OR value of the model-estimated BMI slope was higher than that of the estimated BMI level during ages 27–47 years (P < 0.001), suggesting that the BMI slope, reflecting the increasing weight velocity, was a more sensitive predictor of TN incidence than BMI level. Due to missing data for ages 73–80 years, we were unable to calculate OR for this range (Fig. 5).
Fig. 5.
Standardized ORs and 95% CIs for TN adopting the model-estimated BMI slope and value from 20 to 80 years in 3-year intervals.
Discussion
In this Chinese cohort study, we identified four distinct trajectories of BMI and determined that both the BMI trajectory group and age were significantly associated with TN. Notably, the study emphasizes the importance of level-independent BMI trajectories from ages 27 to 47 years in assessing the prevalence of TN in later life.
By categorizing BMI into four classes within the 20-80-year age range, this study revealed that TN in the high-stable group exhibited the highest risk, followed by the middle-increasing, low-increasing, and low-stable groups. This pattern indicated that the prevalence of TN gradually increased with the increment of BMI trajectory. The observations in this research aligned with previous studies16–18, which demonstrated that low BMI was a protective factor for TN, while overweight or obesity was a risk factor compared to normal BMI. Notably, the LCGMM analysis employed in this study differed from the methods used in cross-sectional and longitudinal analyses, overcoming the limitation of a single measurement of BMI and reflecting the dynamic changes of BMI throughout the life course. Consequently, these findings confirmed that BMI trajectories during life significantly impacted the prevalence of TN.
Our study further indicated that age was a significant risk factor for TN, demonstrating an increasing trend with advancing age. This finding aligns with several large-scale epidemiological studies19,20. Specifically, the risk of TN increased by 3% for each year of age, 18% for every five years, and 39% for every decade. A possible explanation for this trend is the accumulation of reactive oxygen species in cells as individuals age, leading to the buildup of harmful substances and ultimately promoting the development of TN21. Interestingly, our age subgroup analysis revealed that the prevalence of TN in individuals aged 20–39 years was highest in the high-stable class compared to other trajectories. This suggests that the increase in BMI trajectory may be closely associated with the occurrence of TN in this age group. Consequently, we hypothesize that the accelerated rate of age-related BMI increase is strongly correlated with the prevalence of TN.
In accordance with the above observations, our comprehensive research revealed that the estimated BMI level correlated with the prevalence of TN between ages of 21 and 50 years, suggesting that the estimated BMI level is an appropriate measure for assessing TN risk within this age range. Moreover, our results indicated that the estimated slope of BMI was closely associated with the occurrence of TN, particularly between ages of 21 and 47 years. Notably, the model-estimated BMI slope demonstrated a strong correlation with the BMI level; furthermore, the OR value of the model-estimated BMI slope exceeded that of the estimated BMI level for individuals aged 27–47 years. This suggests that the BMI slope, reflecting the rate of weight increase, serves as a more sensitive predictor of TN incidence compared to BMI level alone. The superiority of BMI slope as a predictor has been corroborated in other disease studies22,23. To our knowledge, this study represents the first to elucidate the relationship between increased BMI rate during ages 27–47 years and the risk of TN occurrence in China.
The critical period model proposed by John Lynch and Ben-Shlomo in the life‐course epidemiology theory24–26 suggests that exposure during a specific period in the life span can have long‐lasting effects on anatomical structure and physiological function, potentially leading to disease. Individuals with a steeper increasing slope of BMI between ages of 27 and 47 years may experience various physiological and metabolic changes. This rapid BMI increase can lead to adipocyte hypertrophy and dysfunction, resulting in systemic low-grade inflammatory responses. The inflammation-induced interleukin production may reduce deiodinase expression, leading to low T3 levels and consequently elevated TSH27, which promotes thyroid follicular cell proliferation and influences the occurrence and development of TN28. Additionally, the rapid BMI increase11 elevates insulin levels, promoting interaction with insulin-like growth factor binding protein. This interaction increases free insulin-like growth factor-1 levels, which binds to insulin-like growth factor-1 receptors expressed by thyroid follicular and C cells29,30. This process further regulates cell proliferation in thyroid tissue30, ultimately affecting TN formation. Our findings suggest that the age range of 27 to 47 years represents a critical window for managing BMI increase velocity to reduce TN occurrence.
This study has several limitations. First, the participants were recruited from a single center, potentially limiting the generalizability of the findings to different regions. However, the study’s utilization of LCGMM as a statistical approach mitigated the limitations associated with single BMI measurements. Second, the absence of certain relevant data, such as genetic information, and the relatively short follow-up period may have introduced statistical bias. Future research should aim to validate these findings through more comprehensive demographic studies with longer follow-up durations.
In conclusion, this study corroborates that BMI trajectories and age are risk factors for TN. Furthermore, it emphasizes that BMI trajectories throughout life, independent of the absolute BMI level, significantly influence the prevalence risk of TN. The findings highlight early adulthood (27–47 years old) as a crucial age window for managing the increased velocity of BMI to reduce the occurrence of TN. This insight holds substantial significance for the primary prevention of thyroid nodules.
Electronic supplementary material
Below is the link to the electronic supplementary material.
Acknowledgements
The authors thank everyone who has contributed to this research, including medical writers, proofreaders (TopEdit [www.topeditsci.com]), and editors.
Author contributions
HY wrote and edited the manuscript. SD was responsible for planning and executing the research activity. SY and JC performed data analysis. YY helped to collect samples and data. QQ was in charge of the project. All authors had read and agreed to this version of the manuscript.
Funding
The study was supported by the Henan Province Medical Science and Technology Research Plan (LHGJ20210354, LHGJ20230317).
Data availability
The datasets from the corresponding author during the current study are available upon reasonable request.
Declarations
Competing interests
The authors declare no competing interests.
Footnotes
Publisher’s note
Springer Nature remains neutral with regard to jurisdictional claims in published maps and institutional affiliations.
Contributor Information
Suying Ding, Email: fccdingsy@zzu.edu.cn.
Qian Qin, Email: qinqianzzdx@126.com.
References
- 1.Organization, W. H. Obesity and overweight[OL]. -06-09)[2021-11-12]. https://www.who.int/news-room/fact-sheets/detail/obesity-and-overweight (2021).
- 2.Liang, Y. et al. Detection of thyroid nodule prevalence and Associated Risk factors in Southwest China: a study of 45,023 individuals undergoing physical examinations. Diabetes Metab. Syndr. Obes.16, 1697–1707. 10.2147/DMSO.S412567 (2023). [DOI] [PMC free article] [PubMed] [Google Scholar]
- 3.Wong, R., Farrell, S. G. & Grossmann, M. Thyroid nodules: diagnosis and management. Med. J. Aust209, 92–98. 10.5694/mja17.01204 (2018). [DOI] [PubMed] [Google Scholar]
- 4.Yao, Y. et al. Thyroid nodules in centenarians: prevalence and relationship to lifestyle characteristics and dietary habits. Clin. Interv Aging13, 515–522. 10.2147/CIA.S162425 (2018). [DOI] [PMC free article] [PubMed] [Google Scholar]
- 5.Zhang, F. et al. The relationship and gender disparity between thyroid nodules and metabolic Syndrome Components based on a recent Nationwide Cross-sectional Study and Meta-Analysis. Front. Endocrinol. (Lausanne)12, 736972. 10.3389/fendo.2021.736972 (2021). [DOI] [PMC free article] [PubMed] [Google Scholar]
- 6.Zheng, L. et al. An epidemiological study of risk factors of thyroid nodule and goiter in Chinese women. Int. J. Clin. Exp. Med.8, 11379–11387 (2015). https://www.ncbi.nlm.nih.gov/pubmed/26379953 [PMC free article] [PubMed] [Google Scholar]
- 7.Morna, M. T. et al. Prevalence and characterization of asymptomatic thyroid nodules in Assin North District, Ghana. PLoS One17, e0263365. 10.1371/journal.pone.0263365 (2022). [DOI] [PMC free article] [PubMed] [Google Scholar]
- 8.Xu, W. et al. Relationship of anthropometric measurements to thyroid nodules in a Chinese population. BMJ Open.5, e008452. 10.1136/bmjopen-2015-008452 (2015). [DOI] [PMC free article] [PubMed] [Google Scholar]
- 9.Hu, L., Li, T., Yin, X. L. & Zou, Y. An analysis of the correlation between thyroid nodules and metabolic syndrome. Endocr. Connect.9, 933–938. 10.1530/EC-20-0398 (2020). [DOI] [PMC free article] [PubMed] [Google Scholar]
- 10.Ahmadi, S. et al. Point of Care Measurement of Body Mass Index and thyroid nodule Malignancy Risk Assessment. Front. Endocrinol. (Lausanne)13, 824226. 10.3389/fendo.2022.824226 (2022). [DOI] [PMC free article] [PubMed] [Google Scholar]
- 11.Ayturk, S. et al. Metabolic syndrome and its components are associated with increased thyroid volume and nodule prevalence in a mild-to-moderate iodine-deficient area. Eur. J. Endocrinol.161, 599–605. 10.1530/EJE-09-0410 (2009). [DOI] [PubMed] [Google Scholar]
- 12.Guo, H. et al. The prevalence of thyroid nodules and its relationship with metabolic parameters in a Chinese community-based population aged over 40 years. Endocrine45, 230–235. 10.1007/s12020-013-9968-0 (2014). [DOI] [PubMed] [Google Scholar]
- 13.Guerrero-Romero, F. et al. The product of triglycerides and glucose, a simple measure of insulin sensitivity. Comparison with the euglycemic-hyperinsulinemic clamp. J. Clin. Endocrinol. Metab.95, 3347–3351. 10.1210/jc.2010-0288 (2010). [DOI] [PubMed] [Google Scholar]
- 14.Gharib, H. et al. American Association of Clinical Endocrinologists, American College of Endocrinology, and Associazione Medici Endocrinologi Medical Guidelines for clinical practice for the diagnosis and management of thyroid Nodules–2016 update. Endocr. Pract.22, 622–639. 10.4158/EP161208.GL (2016). [DOI] [PubMed] [Google Scholar]
- 15.Lennon, H. et al. Framework to construct and interpret latent class trajectory modelling. BMJ Open8, e020683. 10.1136/bmjopen-2017-020683 (2018). [DOI] [PMC free article] [PubMed] [Google Scholar]
- 16.Lai, X. et al. [Detection rate of thyroid nodules in routine health check-up and its influencing factors: a 10-year survey of 309 576 cases]. Nan Fang Yi Ke Da Xue Xue Bao40, 268–273. 10.12122/j.issn.1673-4254.2020.02.20 (2020). [DOI] [PMC free article] [PubMed] [Google Scholar]
- 17.Xu, L. et al. Prevalence and associated metabolic factors for thyroid nodules: a cross-sectional study in Southwest of China with more than 120 thousand populations. BMC Endocr. Disord21, 175. 10.1186/s12902-021-00842-2 (2021). [DOI] [PMC free article] [PubMed] [Google Scholar]
- 18.Song, B. et al. Association of thyroid nodules with adiposity: a community-based cross-sectional study in China. BMC Endocr. Disord18, 3. 10.1186/s12902-018-0232-8 (2018). [DOI] [PMC free article] [PubMed] [Google Scholar]
- 19.Kwong, N. et al. The influence of patient age on thyroid nodule formation, Multinodularity, and thyroid Cancer risk. J. Clin. Endocrinol. Metab.100, 4434–4440. 10.1210/jc.2015-3100 (2015). [DOI] [PMC free article] [PubMed] [Google Scholar]
- 20.Reiners, C. et al. Prevalence of thyroid disorders in the working population of Germany: ultrasonography screening in 96,278 unselected employees. Thyroid14, 926–932. 10.1089/thy.2004.14.926 (2004). [DOI] [PubMed] [Google Scholar]
- 21.Lopez-Otin, C. et al. The hallmarks of aging. Cell 153: 1194 – 217. 10.1016/j.cell.2013.05.039 (2013). [DOI] [PMC free article] [PubMed]
- 22.Fan, B. et al. Body Mass Index trajectories during Young Adulthood and Incident Hypertension: a longitudinal cohort in Chinese Population. J. Am. Heart Assoc.8, e011937. 10.1161/JAHA.119.011937 (2019). [DOI] [PMC free article] [PubMed] [Google Scholar]
- 23.Wang, N., Xu, Z. & Pei, D. Association of distinct gamma-glutamyltransferase trajectories with incident hyperglycemia using latent class growth mixture modeling: a longitudinal cohort study of Chinese adults. Diabetes Res. Clin. Pract.190, 109968. 10.1016/j.diabres.2022.109968 (2022). [DOI] [PubMed] [Google Scholar]
- 24.Ben-Shlomo, Y. & Kuh, D. A life course approach to chronic disease epidemiology: conceptual models, empirical challenges and interdisciplinary perspectives. Int. J. Epidemiol.31, 285–293. https://www.ncbi.nlm.nih.gov/pubmed/11980781 (2002). [PubMed] [Google Scholar]
- 25.Kuh, D. et al. Life course epidemiology. J. Epidemiol. Community Health57, 778–783. 10.1136/jech.57.10.778 (2003). [DOI] [PMC free article] [PubMed] [Google Scholar]
- 26.Lynch, J. & Smith, G. D. A life course approach to chronic disease epidemiology. Annu. Rev. Public. Health26, 1–35. 10.1146/annurev.publhealth.26.021304.144505 (2005). [DOI] [PubMed] [Google Scholar]
- 27.Mancini, A. et al. Thyroid Hormones, Oxidative Stress, and Inflammation. Mediators Inflamm. 2016: 6757154. 10.1155/2016/6757154 (2016). [DOI] [PMC free article] [PubMed]
- 28.Li, Z. et al. The effect of inflammation on the formation of thyroid nodules. Int. J. Endocrinol.2020(9827349). 10.1155/2020/9827349 (2020). [DOI] [PMC free article] [PubMed]
- 29.Blanc, E. et al. Association between worse metabolic control and increased thyroid volume and nodular disease in elderly adults with metabolic syndrome. Metab. Syndr. Relat. Disord13, 221–226. 10.1089/met.2014.0158 (2015). [DOI] [PubMed] [Google Scholar]
- 30.van der Laan, B. F., Freeman, J. L. & Asa, S. L. Expression of growth factors and growth factor receptors in normal and tumorous human thyroid tissues. Thyroid5, 67–73. 10.1089/thy.1995.5.67 (1995). [DOI] [PubMed] [Google Scholar]
Associated Data
This section collects any data citations, data availability statements, or supplementary materials included in this article.
Supplementary Materials
Data Availability Statement
The datasets from the corresponding author during the current study are available upon reasonable request.


