

Abstract
In this study, the effects of six operating conditions on the performance of a 3 kW- ORC (organic Rankine cycle) system were investigated. The results of experiments show that, despite differences in the physical parameters of the three working fluids used, the performance of the ORC system was similar. Further, the cooling water temperature (CWT) was strictly controlled, but the experimental results were affected by the condensation temperature, however the experimental system can maintain stable operation. Since generators are affected by different factors, the variation in generator generation fluctuates over a wide range during steady state operation of the system. The theoretical shaft work of the expander and generator power generation of the system using R245fa exceeds that of the other two working fluids due to the density. It had a maximum generator power conversion efficiency of 64.651% under C1 condition, maximum exergy efficiency of 27.346% under C3 condition; the system has a maximum cycle efficiency of 9.543% and a cold energy utilization efficiency of 5.633%, under C6 conditions; although maximum power generation (1.019 kW) and maximum net work (1.321 kW), the total exergy loss of the system also reached its maximum value (13.756kw) under C5 condition.
Keywords: Organic Rankine cycle, System performance, Working fluid filling quantity, High boiling point working fluid, Low boiling point working fluid
Subject terms: Energy science and technology, Energy harvesting, Energy infrastructure, Energy storage, Renewable energy
Introduction
Progress and development in science, technology and human life come at the cost of environmental damage. To achieve the goals of energy conservation and carbon emanation reduction, several measures are required, such as (1) reducing the usage of fossil fuels, (2) improving the efficiency of fossil energy usage, and (3) searching for more cost-effective and cleaner energy sources. Most of the high-temperature waste heat generated by fossil fuels gets fully utilized, but the utilization rate of low-temperature waste heat, which accounts for the largest proportion, is relatively low. ORC systems can fully utilize some waste heat and achieve the conversion between “heat-work” in the turbine through gas expansion1,2.
Organic working fluids, as a medium for energy transfer, are widely used in fields such as refrigeration, heat pumps, and energy recovery3,4. Owing to the variety and complexity of organic working fluids, the selection and use of working fluids within each system is not only subject to strict limitations, but also requires consideration of the impact on the environment5. The ORC system is a typical system capable of applying organic working fluids for energy recovery and utilization. With different algorithms and model optimization, organic working fluids suitable for a system can be quickly screened using theoretical methods6.
Miao et al.7 constructed an optimization model of the system under actual different operating conditions (DOC) by considering the influence of external environmental factors in the basic ORC system model. The theoretical output shaft power of the expander is significantly improved after the model optimization, and the optimization model can well predict the system results and behaviors. Yang et al.8 used an unranked genetic algorithm for multi-objective optimization to establish an environmental and economic evaluation index model for ORC systems, and analyzed the impact of using four different work fluids on system performance through different evaluation indexes. According to their results, compared with R245fa, R1244yd(Z) improved by 3.3%, 10.4%, and 16% in terms of system thermal efficiency, economic cost, and levelized power generation cost, respectively. Zhang et al.9 analyzed the effects of condensation temperature on ORC systems by selecting nine dry and isentropic fluids with matching characteristics of working pumps and organic fluids. They found that not all working fluids could be applied to ORC systems, and each applicable working fluid requires a corresponding working pump. Zhang et al.10 used three machine learning algorithms to investigate the thermodynamic performance of a 1 kW-class ORC system using propane as the working fluid. The three algorithms could accurately predict the evaluation indexes (theoretical output shaft power of the expander, cooling source efficiency, and total exergy loss), however the prediction accuracy of each algorithm for the three indexes was not the same. Xiao et al.11 investigated the effects of system non-design conditions (heat and cold source parameters) on system performance using R245fa—ORC system. Further studies have found that the performance of ORC systems varies under DOC strategies, the output work of the expander increases with the mass flow, while the system’s thermal efficiency decreases accordingly.
By changing the HTC, CST, pump frequency, work fluid type and system structure, it is the main method and measure to realize the experimental system operating under variable working conditions. Through experimental research, not only can we study the influence of the work fluid on the system performance, but also get the performance of the work fluid under the actual operating conditions12.
Declaye et al.13 experimentally investigated the change rule of R245fa-ORC performance under DOC by taking the system cycle efficiency and power-to-heat ratio as evaluation indexes. It was found that the condensing temperature has a large influence on the power-to-heat ratio, the system can obtain the maximum cycle efficiency when the temperature of the cold and hot sources is 97.5 °C and 26.6 °C, respectively. Shu et al.14 conducted an experimental study in different vehicle ORC systems to investigate the effects of working fluids R245fa and R123 on waste heat recovery. They found that R245fa absorbed more heat than R123, and the size of expander applicable to R245fa and R123 was also different. Feng et al.15 studied the operating characteristics of ORC systems using R123 at different mass flows and heat source temperatures (HST). At different HST, the mass flow of working fluids affected system performance under different laws; expander cavitation could be avoided only by ensuring the inlet superheat of the expander at a certain level. Jiang et al.16 investigated the effects of the presence or absence of a working pump on the performance of ORC systems using R245fa in the same low-temperature waste heat (LTWH) utilization experimental system. Pang et al.17 investigated the performance of R245fa and R123 with the net power of ORC system as the evaluation index at a unchanged HST and mass flow rate. The R245fa-ORC system could obtain a maximum net power (1.56 kW) at a HST of 110 °C, and the R123-ORC system could obtain a maximum net work efficiency (4.4%) at a HST of 120 °C. Feng et al.18 investigated the changing law of R245fa-ORC system performance during independent/grid-connected operation for power generation. They found that in different operation modes, the speed operation range of the expander was not the same; the power consumed by the pump in the independent operation mode was higher than that in the grid-connected operation mode. Cao et al.19 investigated the system performance of an ORC system in the steady and transient states in the off-grid mode. During the operation of the experimental system, the inlet superheat of the expander was affected by the generation frequency and load; moreover, the performance of ORC system was optimized when the external load and system generation capacity matched. Jang et al.20 conducted an experimental study on a 1 kW-class micro-ORC system using R245fa at different mass flow as well as HST and CST. The differential pressure between the expander inlet and outlet was more reflective of the expander output work than the pressure ratio, and the generator power was positively correlated with the expander speed. Lin et al.21 conducted a variable heat source power study using R245fa in a 10 kW ORC test system. The performance parameters of the test system were affected by the pressure ratio and superheat, and the temperature difference between heat exchanger pinch points affected the system performance parameters. Han et al.22 investigated the effects of working fluid flow and HST on system performance in an R245fa-ORC system. They found that a suitable of WFFQ could improve system output performance, and the output work of the expander was affected by the mass flow. Gao et al.23 conducted an experimental study in an R290-ORC system using  as the cooling source. They found that different evaporating pressures could be obtained at different flow rates of the
  , and system pressure drop had an extremely important effect on power generation. Zhang et al.24 investigated the effects of different HST on the capacity of ORC system. Accordingly, system capacity and HST were found to be directly linked; moreover, the higher the system capacity, the higher the efficiency and output work of the system. Feng et al.25 studied the maximum net output work and thermal efficiency of ORC system based on experiments and machine learning (neural network) to investigate the effects of DOC on the ORC system. The thermal efficiency was observed to be insensitive to changes in mass flow, but the net output work increased with the mass flow. Zhang et al.26 conducted experimental research using three different content volume ratios of scroll expanders in the same R245fa-ORC system. Further research revealed a mutual influence between the internal volume ratio of the expander and system pressure difference, and different internal volume ratios of the expander correspond to different system pressure differences.
Due to the zero CO2 emissions of hydrofluoroalkenes, they can be used as a substitute for hydrofluorocarbons as the working fluid for ORC systems. Molés et al.27 conducted an experimental study on ORC systems using R245fa and R1233zd(E). They concluded that the net power generation efficiency of the system and total efficiency of the expander were similar for different working fluids; R245fa exhibited higher thermal and electrical power than R1233zd(E) owing to the density of working fluids. Yang et al.28 studied and analyzed the feasibility of R1233zd(E) instead of R245fa in the same ORC system. They found the thermodynamic performance expressions of R1233zd(E) in the same ORC system to be the same. Eyerer et al.29 investigated the application of R1224yd(Z), R1233zd(E), and R245fa in waste heat power generation under the same experimental conditions. R1233zd(E)-ORC exhibited poor compatibility with sealing materials, and the overall performance of R245fa-ORC was higher than that of R1224yd(Z)-ORC and R1233zd(E)-ORC. Yang et al.30 investigated and analyzed the feasibility of R1234ze(z), R1233zd(E), and R1336mzz(E) instead of R245fa in the same ORC test system. They also analyzed the variation rules of system thermal efficiency and net output work at mass flow and rotational speed. They found that R245fa was second only to R1233zd(E) with maximum thermal efficiency as the objective function, while R245fa-ORC was optimal with maximum net output work as the evaluation index. Tsai et al.31 used R1233zd(E) as the working fluid to experimentally investigate the variation rule of system performance of a 300 —class ORC system under DOC. The differential pressure, superheat, and expander rotational speed were observed to be positively correlated with system efficiency.
A review of previous literature revealed that most of the analyses and studies on different fluids in the same ORC system have been conducted by constructing a system model to screen organic fluids, without experimentally investigating the effects of different working fluids. Moreover, the effects of the working fluid filling quantity (WFFQ) on system performance have not been considered in detail. In this study, the effects of six DOC on system performance were investigated using an identical ORC experimental platform. While previous research has extensively investigated the performance of ORC systems, there is a lack of experimental studies examining the effects of different working fluids and filling quantities on system performance under varying operating conditions. The novelty of this study lies in considering the performance of three types of hydrofluorocarbons (one high boiling point and two low boiling points) under the same operating conditions from the perspectives of system economy and environmental protection, and the experimental system can achieve stable operation. The remainder of this paper is organized as follows. Section “Organic Rankine Cycle System”, gives a brief introduction to the experimental system. Section“Results and Discussion” first investigates the steady state operation law of operating parameters during operation, followed by the analysis of HST, working fluid type, and WFFQ on system performance parameters. Finally, Sect “Conclusions”, presents the conclusions drawn from the study. These experiments provide some guidance and significance to the research on ORC systems by considering the influence of system performance parameters of six DOC.
Organic Rankine cycle system
Experimental system
A schematic diagram of the operation of a basic ORC based on a pure working fluids is shown in Fig. 1. It is worth noting that this is the most commonly used system in theoretical and experimental research. The heat source, cold source, working fluids, and lubricant subsystem together constituted the experimental system. These different subsystems interacted with each other through the fluids flowing through the corresponding working parts. At each operating point (1–16), the physical changes of the working fluids within the working component are reflected; the parameters measured at these state points allow for theoretical or experimental analysis of the performance changes of the ORC system.
Fig. 1.

ORC system operation principle.
The experimental rig of the ORC system is shown in Fig. 2. All subsystems and working parts except the cooling tower are shown in Fig. 2(a). The crossflow cooling tower used in the cooling system is shown in Fig. 2(b). The CWT in the experimental system was mainly controlled by manually adjusting the cooling fan. Owing to the significant effect of the CWT on ORC system output performance, the cooling fan must be carefully controlled in the experiment to avoid major impact of the CWT on experimental results18. In the experimental system, heat conduction oil was used to simulate the LTWH; it was also used for temperature adjustment through the 80 heating rod. L-QB300 was used as the heat conduction oil, it does not decompose at temperatures lower than 300 ℃, thus not affecting experimental results owing to changes in the nature of heat conduction oil within the range of experimental HST. The scroll expander used in the experimental power generation system was modified from an automobile refrigeration compressor with a rotational speed of 2000
 ; with R134a as the refrigerant, the inlet and outlet differential pressure and compression ratios were 1.17
 and 4.589, respectively. Further, a single-phase asynchronous generator was used with a rated speed and generating power of 1500
 and 5000
 , respectively. The power generated by the generator was consumed through 12 bath lamps (275
 each). The generator and expander were connected by a belt using pulleys of the same diameter; thus, the expander speed was considered the generator speed. The expander speed was recorded using a UT372 laser tachometer, and the collected data were transferred to a computer system via a data cable. The basic information of the sensors used in the experiment is shown in Table 1.
Fig. 2.

ORC experimental system. (a) Experimental bench, (b) Cooling tower, (c) Schematic diagram of the system.
Table 1.
Basic Information of Sensors.
| Value | Sensor type | Range | Accuracy |
|---|---|---|---|
| p | Pressure transmitter | 0 ~ 2.5 MPa | 0.5% |
| T | Platinum | −50 ~ 200 ℃ | 1/3B |
| m | Coriolis mass flowmeter | 0 ~ 0.8333kg/s | 0.2% |
| V | Volumetric flow meter | 0 ~ 50m3/h | 0.5% |
| n | Laser velocimeter | 10-9999rpm | ± (0.04% + 2) |
Selection of working fluids
Various working fluids can be used in ORC systems. To avoid damage to the ozone layer due to leakage of working fluids, it is necessary to select working fluids with an ozone depletion potential of zero. Two working fluids with low boiling point and critical temperatures (R134a and R227ea) and one working fluid with higher boiling point and critical temperature (R245fa) were selected for study and analysis in the same experimental system, considering the experimental ambient temperature and economics.
Thermodynamic analysis
The temperature, pressure, flow rate, and power generation were recorded by the experimental system shown in Fig. 2. The output characteristics of the working components and system were obtained using Eqs. (1)–(18).
Formulas (1) - (4) are the basic performance analysis of four working components, and the net power of the system is shown in formula (5).
 |
1 |
 |
2 |
 |
3 |
 |
4 |
 |
5 |
The isentropic efficiency, inlet and outlet pressure difference, pressure ratio, and enthalpy difference of the expander are shown in formulas (6) - (9).
 |
6 |
 |
7 |
 |
8 |
 |
9 |
Exergy loss of working pump ( ), exergy loss of evaporator (
 ), exergy loss of expander (
 ) and exergy loss of condense (
 ), total exergy loss of the system (
 ) and system exergy efficiency (
 ), the formula is as in (10)-(15):
 |
10 |
 |
11 |
 |
12 |
 |
13 |
 |
14 |
 |
15 |
Generator power generation efficiency20, system cycle efficiency32and cold energy utilization efficiency27, the formula is as in (16)-(18):
 |
16 |
 |
17 |
 |
18 |
In the experiment, the ODP of all three working fluids was 0, so the impact on the ODP was not considered. Only the impact on the GWP was considered, and the impact of GWP on the environment was treated at the cost of exergy.
 |
19 |
Results and discussion
The temperature, pressure, mass / volume flow, and power generation used in the analysis of data results were stored in the computer using a PLC data acquisition system, and all experimental data were collected once per second. Each experimental condition was run for at least 20 , and the best steady state operating performance of 6
 was selected for the analysis of data and conclusions.
Experimental analysis and discussion were performed under DOC of the system. Steady-state experimental characterization and analysis of effects of WFFQ were determined by varying the HST and type of organic work fluid at a constant frequency of the working pump ( = 16
= 16 ); the former was performed at a constant WFFQ of 10 kg, while the latter had different filling quantities (5, 6, 7, 8, 9, and 10 kg). Therefore, the experimental operating conditions could be uniformly summarized, as presented in Table 2.
Table 2.
Experimental operating conditions.
| Name of condition | Temperature of heat source | Working fluids |
|---|---|---|
| C1 | 100℃ |
R134a R245fa R227ea |
| C2 | ||
| C3 | ||
| C4 | 120℃ | |
| C5 | ||
| C6 |
Steady-state experimental properties
Figure 3 shows the variation in temperature ( and
and  ) and flow rate (
 and
and  ) of cold and heat sources with operating time under DOC of the system. To ensure that the experimental results remained unaffected by the hot and cold sources, the
  ,
,  and
and  ,
,  were varied within a certain range. Owing to the small load of the condenser and cooling tower, the CWT continuously increased in the experiment. Meanwhile, the CWT directly affected system performance; therefore, to avoid a significant impact on experimental results, the CWT was controlled within a certain range33.
Fig. 3.

Cooling and heating source temperature and flow rate. (a) Heat transfer oil temperature, (b) Heat transfer oil flow rate, (c) Cooling water temperature, (d) Cooling water flow rate.
The variation in  and
and  with the operating time is shown in Figs. 3(a) and (b). Owing to the low temperature of the simulated heat source established for the experiment, the performance of heat transfer oil did not produce large changes. Additionally, the fluctuation in changes in the
  and
and  in the experimental system was low; therefore, it did not significantly affect the experimental results. The variation in CWT of the condenser with running time is shown in Fig. 3(c). In the experiment, the cooling tower fan was mostly manually controlled to regulate the CWT. However, owing to the considerable length of the cooling water pipeline, the CWT of the condenser was somewhat delayed; therefore, significant changes were observed in the CWT. Moreover, because the cooling tower was placed outdoors, the CWT was more susceptible to ambient temperature. Figure 3(d) shows the variation in cooling water flow rate. Despite large fluctuations in the CWT, it did not have a considerable impact on cooling water flow.
Figure 4 shows the variation in working fluids mass flow ( ) under DOC. When the WFFQ and frequency of the working pump were constant, the variation in
  was jointly determined by each operating parameter in the system. In case of uncontrollable ambient temperatures, careful control of the CWT enabled the control of
  within a certain range; it is noteworthy that although it can affect system performance, it can also avoid the appearance of large error results. Under C1, C2, C3, C4, C5, and C6 operating conditions, the
  varied from 0.090 to 0.091
 , 0.118 to 0.119
 , 0.077 to 0.078
 , 0.087 to 0.088
 , 0.115 to 0.116
 , and 0.071 to 0.072
 , respectively.
Fig. 4.

The variation in working fluids mass flow under DOC.
Figure 5 shows the variation in temperature ( ) and pressure (
 ) at the expander inlet with the operating time under DOC. The
  and
and  of the working fluids at the inlet of the expander were determined by the physical parameters of the working fluid considering the filling quantity and HST to be constant. As evident from Fig. 4, the mass flow of the working fluid entering the evaporator under DOC was not the same, thus affecting its heat absorption in the evaporator; the more heat absorbed by the working fluid in the evaporator, the higher its evaporation pressure and temperature. With high temperature heat sources, the expander inlet temperature fluctuated more, while the inlet pressure fluctuated less. However, high expander inlet pressures lead to higher system investment costs owing to additional safety measures. However, the fluctuation range of inlet pressure and temperature of the expander is much higher than that of outlet pressure and temperature.
Fig. 5.

Expander inlet temperature and pressure. (a) pressure, (b) Temperature.
Figure 6 shows the variation in expander outlet temperature ( ) and pressure (
 ) with the operating time under DOC. The expander outlet pressure was simultaneously affected by the inlet pressure, oil–gas separator, and ambient temperature; therefore, the fluctuation range of the outlet pressure was larger. The expander outlet temperature was less affected by external factors; thus, its fluctuation range was smaller.
Fig. 6.

Expander outlet temperature and pressure. (a) pressure, (b) Temperature.
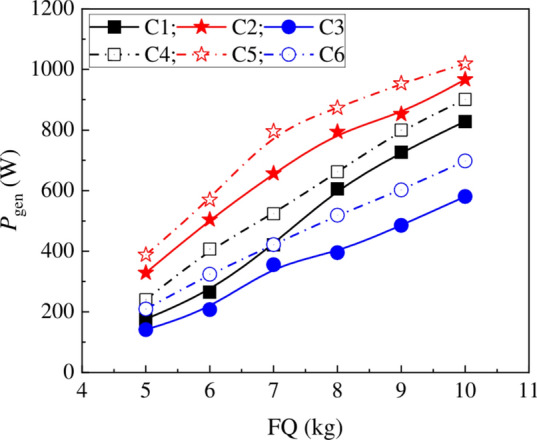
Figure 7 shows the variation in generator’s power generation ( ) with the operating time under DOC. Under a constant generator load, the
  was directly affected by the expander speed as well as fundamentally affected by the differential pressure between the
  and
and  , which are analyzed in detail in Fig. 13. The
  was affected by the expander speed and changes in its own performance. The greater the
  , means that the higher the speed of the expander, the faster the flow of the mass in the system; making the CWT in the condenser increases rapidly, need to adjust the cooling tower fan many times, so that the CWT changes within a certain range; however, due to the cooling water pipeline is longer, so the generator power generation is affected by the CWT of the CWT exists a certain degree of hysteresis. Therefore, among the data that can be directly monitored in Figs. 3, 4, 5, 6, 7, the fluctuation amplitude of generator power generation change is the largest.
Fig. 7.

Generator power generation.
Fig. 13.
The change rule of system power generation with the WFFQ.
Effect of working fluids filling quantity
Figure 8 shows the scroll expander inlet and outlet differential pressure ( ) and expansion ratio (
 ) with the HST and WFFQ of the change rule. When the type of working fluid was unchanged, the inlet and outlet pressures and temperatures of the expander increased with the HST and WFFQ. However, the increment in
  of the expander exceeded that in
  ; therefore, the
  between the expander inlet and outlet also increased. Similarly, the
  increased with the HST and WFFQ. Due to the fact that the low boiling point working fluids R134a and R227ea are easily affected by temperature at the inlet and outlet of the expander, the range of pressure difference between the inlet and outlet of the expander is relatively large.
Fig. 8.

Differential pressure and expansion ratio of expander. (a) Differential pressure, (b) Expansion ratio.
Figure 9 shows the change rule of heat transfer oil temperature difference ( ) with the HST and WFFQ. As shown in Fig. 3(a), under a constant
  , its temperature was easily affected by ambient temperature, despite the heat transfer oil circuit being insulated. However, as the WFFQ increased, the
  exhibited an irregular trend. It should be noted that the
  between the import and export of heat-conducting oil in the evaporator reflects the degree of heat transfer between the working fluid and heat-conducting oil in the evaporator; the larger the
  , the more heat is absorbed by the working fluid in the evaporator, and the higher the efficiency of the utilization of heat source. The
  between the inlet and outlet of thermal oil is not only affected by the mass flow of the working fluid, but also by the CWT; the larger the mass flow of the working fluid, the more heat is absorbed from the heat transfer oil; similarly, the lower the CWT, the greater the
  of the heat transfer oil. When the WFFQ was increased from 5 to 10 kg, the maximum increment in
  between the heat transfer oil inlet and outlet was 1.289, 1.814, 1.237, 2.231, 2.078, and 1.415 C under C1, C2, C3, C4, C5, and C6 operating conditions, respectively.
Fig. 9.

Temperature difference in heat transfer oil.
Figure 10 shows the change rule of the expander rotation speed ( ) and isentropic efficiency (
 ) with the HST and WFFQ. The HST and WFFQ affect the differential pressure between the
  and
and  . This indirectly affects the rotation speed of expander, the
  increases with the HST and WFFQ. However, the
  tends to decrease as the HST and WFFQ increase because the expansion process of working fluids in the expander becomes gradually imperfect with the increasing mass flow. When using R227ea in the system, the expander maintains a high
  . It is noteworthy that the
  reflects the ability of the working fluid to function in the expander. When the WFFQ was increased from 5 to 10
 , the changes in
  under C1, C2, C3, C4, C5, and C6 working conditions were 528.670–1156.726
 , 555.761–1274.464
 , 468.616–1069.286
 , 723.998–1459.880
 , 780.843–1576.984
 , and 608.268–1159.101
 , respectively; while the variations in isentropic efficiency were 60.883–65.559%, 52.649–77.051%, 79.299–84.970%, 61.107–68.256%, 65.128–82.055%, and 88.729–92.104%, respectively.
Fig. 10.

Expander of rotation speed and isentropic efficiency. (a) Rotation speed, (b) Isentropic efficiency.
Figure 11 shows the change rule of  of the expander with the WFFQ and the HST. The
  and
and  of inlet and outlet of the expander are directly affected by the
  ,
,  ,
,  and
and  . The higher the critical temperature of the working fluid, the greater the
  of the expander. The
  increases with the increase of WFFQ and HST. When increasing the WFFQ and the HST, the working fluid can absorb more heat, resulting in an increase in the inlet and outlet temperatures and pressures of the expander, thereby increasing the
  of the expander. At the same mass flow, as the
  between the inlet and outlet increases, the theoretical output shaft power of the expander will also increase. The theoretical output shaft power of the expander is directly affected by the
  of the expander. When the WFFQ increases from 5 to 10
 , the range of
  of the expander under C1, C2, C3, C4, C5, and C6 operating conditions is 6.652–14.707
 , 8.769–16.233
 , 9.153–13.725
 , 11.089–17.937
 , 11.676–18.644
 , and 12.399–16.015
 , respectively.
Fig. 11.

Enthalpy difference between inlet and outlet of expander.
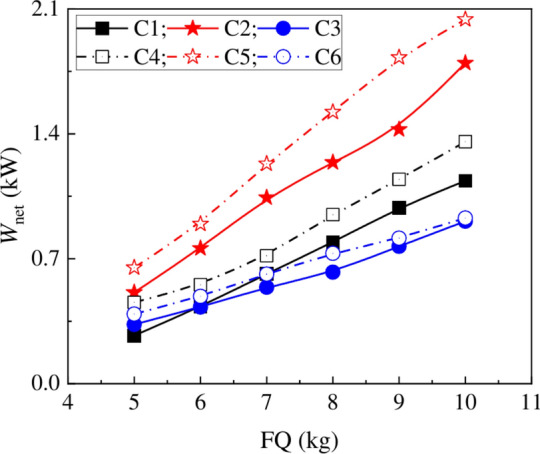
The change rule of net work of the system ( ) with the WFFQ is shown in Fig. 12. In many studies, working fluid screening and system comparisons were performed with the
  as the objective function. Therefore, the
  has a significant impact on system performance; the higher the
  , the higher the efficiency of waste heat utilization10. As shown in Eq. (5), the
  is the difference between the theoretical shaft work of the expander and power consumed by the working pump; both these parameters are affected by the difference in enthalpy between the inlet and outlet, and thus by the component inlet and outlet pressures and temperatures of the working fluid. The increase in theoretical shaft work of the expander exceeded the increase in power dissipated by the working pump; hence, the net system work increased with the WFFQ and HST. When the WFFQ was increased from 5 to 10 kg, the net system work changed in the range of 0.289 to 1.137
 , 0.512 to 1.799
 , 0.322 to 0.910
 , 0.455 to 1.356
 , 0.650 to 2.041
 , and 0.390 to 0.928
 under C1, C2, C3, C4, C5, and C6 working conditions, respectively.
Fig. 12.
The change rule of net work of the system with the WFFQ.
Figure 13 shows the change rule of  with the HST and WFFQ. Under a constant generator load,
  mainly depends on the generator speed, therefore,
 increases with the HST and WFFQ. Because the generator and expander are connected by pulleys of the same diameter, the amount of power generated depends on the expander speed, ignoring the effect of unsynchronized rotational speed of the pulleys. It is evident from Fig. 10(a) that the expander speed was directly affected by the
  and
and  ; the larger the differential pressure, the larger the radial force on the orbiting scroll teeth, which will increase the expander speed, thus increasing the generator’s power output. However, the rotor and stator temperatures also increase at higher generator speeds, decreasing the generator current; therefore, the generator needs to overcome more resistance at higher speeds, resulting in lower variation in
  . When the WFFQ was increased from 5 to 10
 , the variation range of
  under C1, C2, C3, C4, C5, and C6 working conditions was 176.136–829.176
 , 328.824–966.981
 , 141.214–580.696
 , 239.827–901.167
 , 388.355–1019.252
 and 209.547–697.932
 , respectively.
Figure 14 shows the four main working components exergy loss with the HST and WFFQ change rule. As shown in the figure, in the ORC system, the heat exchanger exergy loss constituted the highest percentage of overall system exergy loss, followed by the expander, and the working pump was the smallest. For these four working components, the higher the WFFQ and HST, the greater the component exergy loss. When the HST was unchanged, the system exergy loss increased with the working fluid quantity. The exergy loss when using R227ea in the evaporator and expander is significantly lower than that of R134a and R245fa; in the condenser, due to the highest boiling point, critical temperature, and vapor density of R245fa, the cooling water needs to absorb more heat during the condensation process in order to turn the working fluid into a liquid, resulting in the maximum heat loss in the condenser; in the working fluid pump, due to the lower temperature rise of R245fa compared to R134a and R227ea, the exergy loss will be significantly lower than that of R134a and R227ea.
Fig. 14.

The change rule of exergy loss of working components with the WFFQ. (a) Evaporator, (b) Condenser, (c) Expander, (d) Pump.
Figure 15 shows the change rule of the total exergy loss of the system ( ) with the WFFQ and the HST. The
  increases with the increase of HST and WFFQ. As the R245fa-ORC system has the highest
  , the
, the  is also the highest. As shown in the figure, when using R134a and R227ea as working fluids, the
  will gradually become the same. When the WFFQ increases from 5 to 10 kg, the range of changes in the
  under C1, C2, C3, C4, C5, and C6 operating conditions is 5.787–10.808
 , 6.986–11.919
 , 6.985–10.965
 , 7.526–12.486
 , 8.432–13.756
 , and 8.503–12.464
 , respectively.
Fig. 15.

The change rule of total exergy loss with the WFFQ.
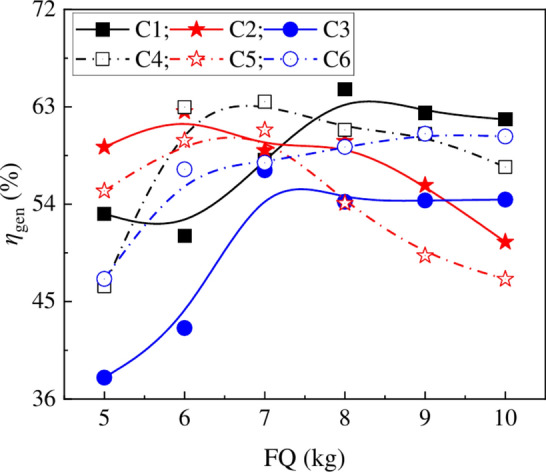
Figure 16 shows the change rule of generator power conversion efficiency ( ) with the HST and WFFQ. As shown in Eq. (14), the
  is directly proportional to generator power generation and inversely proportional to theoretical shaft work of the expander; therefore, the generator can achieve high power conversion efficiency. The generator’s power generation is mainly controlled by the generator speed, by controlling the differential pressure between the expander inlet and outlet. Theoretically, the greater the differential pressure between the expander inlet and outlet, the higher the expander speed. However, because the increment in generator power generation is smaller than that in theoretical shaft work of the expander, the
  tends to decrease with increase in the WFFQ. The decrease in incremental generator power generation can be attributed to the increase in generator speed that leads to increased internal resistance, which must be overcome. Meanwhile, the increase in theoretical shaft power increment of the expander is caused by the increase in
  and
and  . Therefore, the higher the
  , the more power the generator produces. Although the R245fa-ORC system has the highest
  , the theoretical output shaft power of the expander is also the highest, resulting in a lower
  of the system. Due to the lower theoretical output shaft power of the expander in R134a and R227ea ORC systems, the
  is higher than that in R245fa-ORC systems. When the WFFQ was increased from 5 to 10 kg, the variation range of generator power conversion efficiency under C1, C2, C3, C4, C5, and C6 working conditions was 53.104–64.651%, 50.512–62.561%, 37.978–57.140%, 46.427–63.478%, 47.079–60.858%, and 47.095–60.515%, respectively.
Fig. 16.
The change rule of generator power conversion efficiency with the WFFQ.
Figure 17 shows the change rule of system cycle efficiency ( ) with the HST and WFFQ. It is evident from Eq. (17) that the
  is determined by the theoretical shaft power of the expander, power dissipated by the working pump, and heat absorbed by the working fluids. As shown in the figure, the higher the HST, the higher the
  . Although the high HST can promote the absorption of more heat by the working fluids, it also increases the theoretical shaft work of the expander and pumping power consumption. Thus, the incremental work done by the expander and working pump evidently increases in comparison to the amount of heat absorbed by the working fluids, thereby increasing the
  with the HST. Similarly, with the gradual increase in WFFQ, working fluids in the evaporator absorb more heat, moving the working fluids in and out of the evaporator, expander, and condenser with increase in temperature and pressure differences, thereby improving the
  . When the WFFQ was increased from 5 to 10 kg, the
  changed in the range of 3.046–6.439%、3.664–3.647%、5.602–8.668%、4.440–7.309%、4.523–7.069% and 7.433–9.649% under C1, C2, C3, C4, C5, and C6 working conditions, respectively.
Fig. 17.

The change rule of system cycle efficiency with the WFFQ.
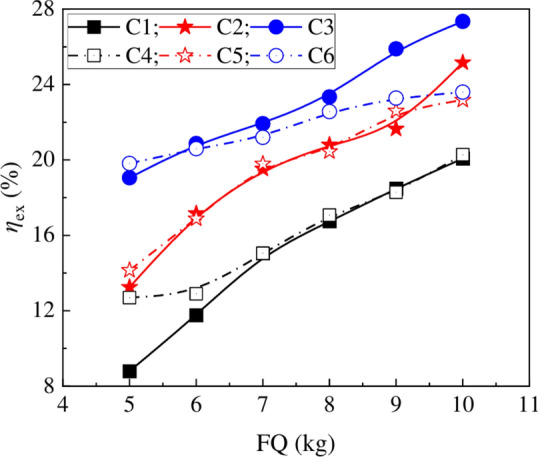
Figure 18 shows the change rule of system exergy efficiency ( ) with the WFFQ and HST. The
  is simultaneously affected by the total exergy loss and net power of the system, and increases with the increase of HST and WFFQ; the lower the HST, the higher the system’s heat loss. Increasing the HST will also increase the
  and
and  , so increasing the HST will not increase the
  . When the WFFQ was increased from 5 to 10 kg, the
  changed in the range of 8.799–20.074%, 13.249–25.161%, 19.049–27.346%, 12.692–20.275%, 14.149–23.176%, and 19.813–23.596% under C1, C2, C3, C4, C5, and C6 working conditions, respectively.
Fig. 18.
The change rule of system exergy efficiency with the WFFQ.
Figure 19 shows the change rule of  with the WFFQ and the HST. The
  reflects the condensation efficiency of the cold source on the working fluid exhaust during the condensation process, which increases with the increase of the WFFQ and the HST. The
  is directly proportional to the amount of electricity generated and inversely proportional to the amount of heat dissipated by the working fluid. Due to the influence of the physical properties of the working fluid, in R134a and R227ea ORC systems, the increase in power generation exceeds the heat dissipation of the working fluid, resulting in a higher
  . Although the R245fa-ORC system generates a large amount of electricity, its mass flow is also the highest, so the increase in electricity generation is less than the increase in heat dissipation of the working fluid, resulting in lower
  than the R134a and R227ea-ORC systems. When the WFFQ increases from 5 to 10 kg, the range of changes in
  under C1, C2, C3, C4, C5, and C6 operating conditions is 6.636–15.181%, 12.505–23.675%, 12.211–21.383%, 8.271–13.086%, 13.912–22.123%, and 12.013–15.200%, respectively.
Fig. 19.

The change rule of system cold energy utilization rate with the WFFQ.
Analysis of Environmental Impact
Figure 20 shows the variation of the system’s exergy cost with the amount of liquid filled when using different fluid working fluids. According to formula(19), the exergy cost is simultaneously affected by the mass flow rate of the working fluid and GWP. When using R134a and R227ea in the system, the change trend of environmental exergy cost is relatively slow due to the small difference in mass flow rate and GWP value of the working fluid. Due to the highest GWP of R227ea, the environmental treatment cost is also higher; when using R227ea as the fluid working fluid in the system, a higher cost is required to eliminate the impact on the environment. When the system uses R134a, R245fa, and R227ea as fluid working fluids, and the HST and WFFQ are 120 ℃ and 10 respectively, the system’s exergy costs are 5.711, 5.541, and 12.713
 respectively.
Fig. 20.

The change rule of exergy cost with the WFFQ.
Conclusion
In this study, the variations in heat and cold source temperature and flow rate, expander inlet and outlet temperature and pressure, working fluids mass flow, and generator power generation with the operating time were analyzed using the proposed ORC experimental platform. Accordingly, the differential pressure between the expander inlet and outlet, rotational speed and pressure ratio, isentropic efficiency of expander, system net work, exergy loss of evaporator, condenser, expander, and working pump; generator power conversion efficiency, and change rule of system cycle and exergy efficiencies were quantitatively analyzed. Through this study, the following four main conclusions can be drawn:
(1) The CWT affected the performance of working components by influencing the temperature and pressure of working fluids entering and leaving the evaporator, condenser, expander, and working pumps, essentially affecting all operating parameters of the system. The power generated by the generator was determined by combining various parameters within the system; therefore, it is susceptible to different factors because the fluctuations in variation are the largest during steady state operation.
(2) The net system work and power generation is an important index for evaluating the efficiency of heat source utilization in ORC systems, its maximum value was observed to be 2.041
 and 1.019
 under the C5 operating condition, respectively.
(3) The total exergy loss of the system increased with the HST and WFFQ. Additionally, the exergy loss of the evaporator was observed to be significantly higher than that of the expander and working pumps. Therefore, to reduce the exergy loss in evaporators, the system structure should be improved or a mixture of working fluids should be used.
(4) The closer the rated speeds of the expander and generator, the higher the generator power conversion efficiency and higher the generator’s power output. The system obtained a maximum generator power conversion efficiency of 64.651% under the C1 operating condition. The system cycle and exergy efficiency were observed to be 9.649% and 23.596% under C6 and C3 operating conditions, respectively. R227ea has a higher efficiency in utilizing heat sources than R134a and R245fa.
In practical ORC system applications, it is necessary to consider the return on investment. Through the research in this article, suitable working fluids style and WFFQ can be selected for the system at different HST, which will help improve the system’s economy and promote the development of ORC systems in the field of waste heat recovery.
Based on the above analysis, although the system has been studied and analyzed under different operating conditions, there are still certain limitations in this study. In order to maintain consistency in experimental conditions, no analysis of system performance was conducted at higher pressures and different condensation temperatures due to the influence of the design pressure and speed of the scroll expander used. Therefore, in future research, working fluids with higher boiling points and better environmental performance should be selected for analyzing the impact of system performance. And the impact of the WFFQ should be predicted through detailed modeling.
Acknowledgements
The study and the related experiment were supported by the National Natural Science Foundation of China (Grant No. 51675254, 51966009).
Acronyms
- h
Specific enthalpy, kJ/kg
- p
Pressure, kPa
- s
Specific entropy, kJ/kg•K
- T
Temperature, K or ℃
- W
Power, kW
- cond
Condenser
- CWT
Cooling water temperature
- DOC
Different operating conditions
- evap
Evaporator
- exp
Expander
- FQ
Filling Quantity
- HST
Heat source temperatures
- ORC
Organic Rankine cycle
- pp
Pump
- wf
Working fluids
- WFFQ
Working fluid filling quantity
Subscripts
- 0
Dead state
- 1–16, i
State points
- ex
Exergy
- is
Isentropic
- th
Thermal
Author contributions
Credit authorship contribution statement Jian Sun: Conceptualization, Methodology, Software, Writing –original draft. Bin Peng: Conceptualization, Methodology, Writing – review & editing, Supervision.
Funding
The National Natural Science Foundation of China,51675254
Data availability
The datasets used and/or analysed during the current study available from the corresponding author on reasonable request.
Declarations
Competing interests
The authors declare no competing interests.
Footnotes
Publisher’s note
Springer Nature remains neutral with regard to jurisdictional claims in published maps and institutional affiliations.
References
- 1.Ludovic, G., Arnaud, L., Adriano, D. & Vincent, L. Performance of a radial-inflow turbine integrated in an ORC system and designed for a WHR on truck application: An experimental comparison between R245fa and R1233zd. Appl. Energy186, 408–422 (2017). [Google Scholar]
- 2.Li, L., Ge, Y. T., Luo, X. & Tassou, S. Experimental investigations into power generation with low grade waste heat and R245fa Organic Rankine Cycles (ORCs). Appl. Therm. Eng.115, 815–824 (2017). [Google Scholar]
- 3.Bao, J. J. & Zhao, L. A review of working fluid and expander selections for organic Rankine cycle. Renew. Sustain. Energy Rev.24, 325–342 (2013). [Google Scholar]
- 4.Liang, K. A review of linear compressors for refrigeration. Int. J. Refrig.84, 253–273 (2017). [Google Scholar]
- 5.Chowdhury, A. S. & Ehsan, M. M. A critical overview of working fluids in organic rankine, supercritical rankine, and supercritical brayton cycles under various heat grade sources. Int. J. Thermofluids20, 100426 (2023). [Google Scholar]
- 6.Su, W., Zhao, L. & Deng, S. Group contribution methods in thermodynamic cycles: Physical properties estimation of pure working fluids. Renew. Sustain. Energy Rev.79, 984–1001 (2017). [Google Scholar]
- 7.Miao, Z., Xu, J. L. & Zhang, K. Experimental and modeling investigation of an organic Rankine cycle system based on the scroll expander. Energy134, 35–49 (2017). [Google Scholar]
- 8.Yang, J. Y., Gao, L., Ye, Z. H., Hwang, Y. H. & Chen, J. P. Binary-objective optimization of latest low-GWP alternatives to R245fa for organic Rankine cycle application. Energy217, 119336 (2021). [Google Scholar]
- 9.Zhang, X. X., Zhang, Y. & Wang, J. F. Evaluation and selection of dry and isentropic working fluids based on their pump performance in small-scale organic rankine cycle. Appl. Therm. Eng.191, 116919 (2021). [Google Scholar]
- 10.Zhang, Y. et al. Comparison of random forest, support vector regression, and long short term memory for performance prediction and optimization of a cryogenic organic rankine cycle (ORC). Energy280, 128146 (2023). [Google Scholar]
- 11.Xiao, M. et al. Multi-condition operating characteristics and optimization of a small-scale ORC system. Energy290, 130099 (2023). [Google Scholar]
- 12.Park, B. S., Usman, M., Imran, M. & Pesyridis, A. Review of organic rankine cycle experimental data trends. Energy Convers. Manag.173, 679–691 (2018). [Google Scholar]
- 13.Declaye, S., Quoilin, S., Guillaume, L. & Lemort, V. Experimental study on an open-drive scroll expander integrated into an ORC (Organic Rankine Cycle) system with R245fa as working fluid. Energy55, 173–183 (2013). [Google Scholar]
- 14.Shu, G. Q., Zhao, M. R., Tian, H., Huo, Y. Z. & Zhu, W. J. Experimental comparison of R123 and R245fa as working fluids for waste heat recovery from heavy-duty diesel engine. Energy115, 756–769 (2016). [Google Scholar]
- 15.Feng, Y. Q. et al. Operation characteristic of a R123-based organic Rankine cycle depending on working fluid mass flow rates and heat source temperatures. Energy Convers. Manag.131, 55–68 (2017). [Google Scholar]
- 16.Jiang, L. et al. Investigation on a small-scale pumpless Organic Rankine Cycle (ORC) system driven by the low temperature heat source. Appl. Energy195, 478–486 (2017). [Google Scholar]
- 17.Pang, K. C. et al. Experimental study on organic Rankine cycle utilizing R245fa, R123 and their mixtures to investigate the maximum power generation from low-grade heat. Energy133, 636–651 (2017). [Google Scholar]
- 18.Feng, Y. Q. et al. Experimental investigation of a R245fa-based organic Rankine cycle adapting two operation strategies: Stand alone and grid connect. Energy141, 1239–1253 (2017). [Google Scholar]
- 19.Cao, S. et al. Steady and transient operation of an organic Rankine cycle power system. Renew. Energy133, 284–294 (2019). [Google Scholar]
- 20.Jang, Y. & Lee, J. Comprehensive assessment of the impact of operating parameters on sub 1-kW compact ORC performance. Energy Convers. Manag.182, 369–382 (2019). [Google Scholar]
- 21.Lin, C. H. et al. Investigations on experimental performance and system behavior of 10 kW organic Rankine cycle using scroll-type expander for low-grade heat source. Energy177, 94–105 (2019). [Google Scholar]
- 22.Han, Y. Q., Zhang, Y. M., Zuo, T., Chen, R. L. & Xu, Y. Experimental study and energy loss analysis of an R245fa organic Rankine cycle prototype system with a radial piston expander. Appl. Therm. Eng.169, 114939 (2020). [Google Scholar]
- 23.Gao, W. Z., Wu, Z. J., Tian, Z. & Zhang, Y. Experimental investigation on an R290-based organic Rankine cycle utilizing cold energy of liquid nitrogen. Appl. Therm. Eng.202, 117757 (2022). [Google Scholar]
- 24.Zhang, Y. F. et al. Effect of heat source supplies on system behaviors of ORCs with different capacities: An experimental comparison between the 3 kW and 10 kW unit. Energy254, 124267 (2022). [Google Scholar]
- 25.Feng, Y. Q. et al. Experimental investigation and machine learning optimization of a small-scale organic Rankine cycle. Appl. Therm. Eng.224, 120120 (2023). [Google Scholar]
- 26.Zhang, H. H. et al. The parametric analysis on the system behaviors with scroll expanders employed in the ORC system: An experimental comparison. Energy268, 126713 (2023). [Google Scholar]
- 27.Molés, F., Navarro-Esbrí, J., Peris, B. & Mota-Babiloni, A. Experimental evaluation of HCFO-1233zd-E as HFC-245fa replacement in an Organic Rankine Cycle system for low temperature heat sources. Appl. Therm. Eng.98, 954–961 (2016). [Google Scholar]
- 28.Yang, J. Y., Sun, Z. Y., Yu, B. B. & Chen, J. P. Experimental comparison and optimization guidance of R1233zd(E) as a drop-in replacement to R245fa for organic Rankine cycle application. Appl. Therm. Eng.141, 10–19 (2018). [Google Scholar]
- 29.Eyerer, S., Dawo, F., Kaindl, J., Wieland, C. & Spliethoff, H. Experimental investigation of modern ORC working fluids R1224yd(Z) and R1233zd(E) as replacements for R245fa. Appl. Energy240, 946–963 (2019). [Google Scholar]
- 30.Yang, J. Y., Ye, Z. H., Yu, B. B., Ouyang, H. S. & Chen, J. P. Simultaneous experimental comparison of low-GWP refrigerants as drop-in replacements to R245fa for Organic Rankine cycle application: R1234ze(Z), R1233zd(E), and R1336mzz(E). Energy173, 721–731 (2019). [Google Scholar]
- 31.Tsai, Y. C. et al. Experimental validation of a 0.3 kW ORC for the future purposes in the study of low-grade thermal to power conversion. Energy285, 129422 (2023). [Google Scholar]
- 32.Chang, J. C., Hung, T. C., He, Y. L. & Zhang, W. P. Experimental study on low-temperature organic Rankine cycle utilizing scroll type expander. Appl. Energy155, 150–159 (2015). [Google Scholar]
- 33.Eyerer, S., Wieland, C., Vandersickel, A. & Spliethoff, H. Experimental study of an ORC (Organic Rankine Cycle) and analysis of R1233zd-E as a drop-in replacement for R245fa for low temperature heat utilization. Energy103, 660–671 (2016). [Google Scholar]
Associated Data
This section collects any data citations, data availability statements, or supplementary materials included in this article.
Data Availability Statement
The datasets used and/or analysed during the current study available from the corresponding author on reasonable request.