

Abstract
The transsulfuration (TSS) pathway is an alternative source of cysteine for glutathione synthesis. Little of the TSS pathway in antioxidant capacity in sickle cell disease (SCD) is known. Here, we evaluate the effects of TSS pathway activation through cystathionine beta-synthase (CBS) to attenuate reactive oxygen species (ROS) and ferroptosis stresses in SCD. A vital contribution of the TSS pathway in sustaining cysteine levels is detected only under hemin exposure or physiological but not supraphysiological cystine supplement. Mechanistic studies show that hemin suppresses CBS expression to inhibit the TSS pathway and de novo cysteine biosynthesis. By contrast, the expression of CBS is inducible by dimethyl fumarate (DMF) through nuclear factor erythroid 2-related factor 2 (NRF2) activation and CpG islands DNA hydroxymethylation. DMF induces the expression of L-2-hydroxyglutarate dehydrogenase (L2HGDH) to downregulate L-2-hydroxyglutarate (L2HG) and increase global and locus-specific DNA hydroxymethylation levels. This DMF-upregulated DNA hydroxymethylation affects CBS locus chromatin structure modifications and upregulates gene expression. Our results suggest that CBS of the TSS pathway plays an important role in maintaining cysteine levels under restricted cystine availability or excess hemin exposure, and CBS upregulation by DMF increases the cellular glutathione levels to protect against ROS and ferroptosis stress in SCD.
Subject terms: Metabolomics, Metabolomics
Mechanism of the transsulfuration pathway in sustaining cysteine levels to attenuate reactive oxygen species and ferroptosis stresses in erythroblasts of sickle cell disease.
Introduction
Sickle cell disease (SCD) is an inherited hematological disorder caused by an A to T mutation in the adult β-globin gene with the product of hemoglobin S which polymerizes under hypoxia conditions1,2. SCD patients have aberrant metabolic regulation of fumarate, glutamate, glycine, malate, and other metabolites involved in glycolysis, nucleotide catabolism, and glutathione metabolism3–6. In addition, during vaso-occlusive episodes, SCD patients show distinct metabolite profiles from those at steady-state7–10. Alterations of these metabolites contribute to the regulation of hypoxic response, red blood cell sickling, inflammation, and clinical disease severity11. However, the mechanism of metabolic dysregulation in affecting the progress and disease severity of SCD has not been well characterized, especially when exposed to excess hemin.
Notably, SCD endures overwhelming oxidative stress and consumes significant amounts of cysteine for glutathione (GSH) synthesis. Compared to healthy controls, SCD patients have significantly lower erythrocyte GSH and cysteine concentrations12 and a faster rate of GSH synthesis, suggesting that the endogenous cysteine supply is insufficient to meet all anabolic demands. Therefore, cysteine may be a conditionally essential amino acid in individuals with SCD for the synthesis of GSH. Interestingly, N-acetylcysteine (NAC) which readily enters cells to convert to cysteine for GSH generation, is an important antioxidant13. We and others have shown in clinical trials that NAC supplement displays pleiotropic effects against inflammation, vasomotor symptom, and formation of dense red blood cells14,15.
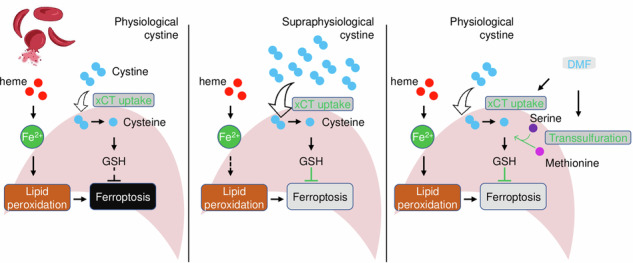
The cellular antioxidant capacity to defend against oxidative stress is regulated by the synthesis and use of GSH. The primary source of cystine in GSH synthesis is available through the cystine-glutamate antiporter xCT. In addition, cellular cysteine is also available through the transsulfuration (TSS) pathway from the sulfur-containing amino acid methionine. The TSS pathway is active in the liver and brain; however, its function in other tissues, especially during erythropoiesis, is poorly understood. Remarkably, the TSS pathway is compensatively activated when the extracellular source of cystine is restricted or under extreme oxidative stress conditions. For example, cystine availability in cancers is limited that the TSS pathway is activated to provide an alternative source of cysteine16. Of the factors that participate in the TSS pathway, cystathionine beta-synthase (CBS) and cystathionine γ-lyase (CSE) mediate the first two rate-limiting steps of TSS by condensing serine with homocysteine to cystathionine and then cysteine. Enzymatic activity dysregulation of CBS has been frequently linked to aberrant redox homeostasis. Interestingly, CBS is upregulated by transcription factors such as nuclear factor erythroid 2-related factor 2 (NRF2)17, SP1/318, and NFY18 and its upregulation confers resistance against ferroptosis in ovarian cancer cells17. However, whether excess hemin exposure from the hemolysis in SCD will affect CBS expression and the generation of GSH in oxidative and ferroptosis stress response has not been investigated.
Notably, excess hemin exposure exacerbates the disease severity of SCD19,20 and heme-scavenging strategies such as intravenous infusion of hemopexin are propective21,22. We and others also demonstrated that hemin induces the expression of NRF2 in SCD erythroblasts and animal models and such effect is mitigated by administration of dimethyl fumarate (DMF)23,24, an FDA-approved drug for the treatment of multiple sclerosis. DMF has been shown to suppress the proinflammatory condition of SCD in animal models25, suggesting its therapeutic potential for individuals with SCD. DMF was also shown to diminish the metabolic flux of glutamine to the tricarboxylic acid (TCA) cycle and divert it towards GSH biosynthesis26. As an inducer of NRF2, DMF could promote SLC7A11 and GPX4 expression, increase cellular cystine and glutathione levels, and mediate anti-oxidative stress effects. Interestingly, DMF was found to induce cysteine biosynthesis26, elevate cellular GSH levels27, and present an NRF2-independent effect through posttranslational protein succinylation28,29. In addition, DMF mediates a time-course-dependent effect to induce DNA hypomethylation on reactive oxygen species (ROS) regulatory genes such as NRF2, CES1-3, GSTA1-5, NOX1-5, NQO1, and TXNRD130. Notably, genes involved in the TSS pathway, cystine uptake and glutathione recycling (such as CBS, CSE, SLC7A11 and GSR) were DNA hypomethylated after DMF treatment30, supporting a regulatory effect of DMF on these pathways. Though the mechanism for DMF function is still not fully understood, published reports support the therapeutic potential of DMF in oxidative stress regulation in alleviating SCD symptoms.
In this study, we investigated the regulation of the TSS pathway in SCD erythroblasts under hypoxia and excess hemin exposure conditions. We demonstrated that the TSS pathway is ineffective in supraphysiological cystine concentrations but is critical under physiological cystine supplementation or excess hemin exposure in SCD erythroblasts. Hemin suppresses the TSS pathway CBS expression and interferes with de novo cysteine biosynthesis and GSH generation, leading to elevated oxidative stress. This suppressive effect of hemin is reversible by DMF, which induces CBS expression in an NRF2-dependent and independent manner. Our findings support the therapeutic potential of DMF in SCD treatment.
Results
DMF activates the TSS pathway in SCD erythroblasts
To investigate the mechanism of DMF on ferroptosis regulation, we conducted untargeted LC-MS using erythroblasts generated from CD34+ stem cells isolated from the peripheral blood of SCD patient. The erythroblasts were treated with hemin (75 μM), the oxidized form of heme, under hypoxic condition (1% O2), with or without 50 μM DMF in a two-phase culture system31 (Supplementary Fig. 1). These treatment conditions were chosen to mimic excess heme from chronic hemolysis and systemic hypoxic conditions that occur in SCD patients1,2,11. Of note, hemolysis is a fundamental feature of SCD and resulting excess hemin exposure32 while hypoxia has been shown to induce the expression of fetal hemoglobin33,34, and promote the transition from expansion to differentiation during stress erythropoiesis35. Of 305 metabolites analyzed by LC-MS, 53 showed significantly different abundance between DMF and PBS treatments (Fig. 1A, Supplementary Table 3, p < 0.05). Metabolomic pathway analysis demonstrated that these metabolites are involved in sulfurate amino acids metabolism, with respect to cysteine, and glutathione synthesis (Fig. 1B).
Fig. 1. DMF activates the TSS pathway in SCD erythroblasts.

A Volcano plot analysis of the abundance of different metabolites of DMF and PBS-treated day 12 SCD erythroblasts. The fold change (DMF/PBS) (x-axis) and t-tests (y-axis) threshold of p < 0.05 were determined using MetaboAnalyst (n = 3 replicates per treatment). 2HG 2-hydroxyglutarate, Cth cystathionine, GCC γ-Glutamylcysteine, GSH glutathione, Hcy homocysteine, SAM S-Adenosyl methionine. B The 53 metabolites that displayed significantly different abundances between DMF and PBS treatments were subjected to the pathway enrichment (y axis, enrichment p values) and pathway topology analyses (x axis, pathway impact values, indicative of the centrality and enrichment of a pathway) in the Pathway Analysis module of MetaboAnalyst 6.0 (n = 3 replicates per group, p < 0.05). The circle color indicates the level of enrichment significance, with yellow being low and red being high. The size of a circle is proportional to the pathway impact value. C DMF alters the levels of the glutathione and metabolites of the TSS pathway. The indicated metabolites were quantified by LC-MS (n = 4 replicates per treatment). D Schematic depiction of the cellular TSS pathway for the metabolism of homocysteine (Hcy) to Cystathionine (Cth) and Cysteine (Cys), mediated by cystathionine beta-synthase (CBS) and cystathionine γ-lyase (CSE) detected by 13C3 serine tracing. E Quantification of 13C3 serine incorporation into serine, Cth and Cys under PBS and DMF conditions. F The cystine uptake efficacy of SCD erythroblasts was determined by a BioTracker Cystine-FITC Live Cell Dye followed by flow cytometry analysis. G The cellular ROS levels were determined by H2DCFDA flow cytometry. H The cellular ferroptosis levels were determined by Bodipy C11 flow cytometry. Data represents the mean ± SD of 3–4 biological replicates. *p < 0.05.
Subsequent biochemistry assays confirmed that DMF significantly increases GSH, cystathionine, and cysteine levels, along with moderately increased homocysteine levels (Fig. 1C), suggesting DMF targets the TSS pathway. During the transsulfuration, the sulfur atom of methionine was transferred to serine to yield cysteine. To further demonstrate activation of the TSS pathway by DMF, we investigated the metabolism of serine for de novo cysteine biosynthesis by 13C3-serine tracing (Fig. 1D). Incubation with 13C3-serine as an extracellular serine source for 6 h resulted in almost complete labeling of the intracellular serine pool (Fig. 1E). Under 13C3-serine tracing, isotope-labeled cystathionine and cysteine were significantly increased after DMF treatment (Fig. 1E). In addition, DMF increased SCD erythroblasts cystine uptake capability (Fig. 1F), while the ROS and ferroptosis stresses were alleviated (Fig. 1G, H). These results support the ability of DMF to attenuate ROS and ferroptosis stress in SCD erythroblasts through TSS pathway activation.
CBS selectively replenishes the GSH levels under cystine-restricted conditions
Multiple critical enzymes are involved in the normal function of the TSS pathway, including CBS and CSE, which catalyze the first two steps of de novo cysteine generation, from homocysteine to cystathionine and then cysteine. To investigate the function of CBS in this process, we silenced its expression by CRISPR/cas9 mediated gene knockout strategy (sgCBS) in SCD erythroblasts (Fig. 2A). Surprisingly, no difference between sgCBS and sgRNA controls was detected for intracellular cysteine or GSH levels (Supplementary Fig. 2A, B). In addition, serine metabolism to cystathionine, cysteine, and GSH as traced with 13C3-serine showed no detectable GSH biosynthesis from the TSS pathway (Supplementary Fig. 2C). These observations indicate that CBS is insignificant in GSH synthesis through the TSS pathway under current experimental conditions.
Fig. 2. CBS-regulated TSS pathway activity is dependent on cystine availability.

A Western blot analysis of SCD erythroblasts expressing sgRNA control (sgControl) or two independent sgRNA against CBS gene (sgCBS-1 and sgCBS-2). B, C The cellular ROS and ferroptosis levels were determined for day 12 SCD erythroblasts cultured with 292 μM cystine (C292) or without cystine (C0) by H2DCFDA and Bodipy C11 staining followed by flow cytometry. Biochemical assay determined cellular cysteine, GSH, GSSG levels and their ratio in SCD erythroblasts expressing sgCBS or with CBS ectopic expression under different extracellular cystine supplements at 0 μM (D), 30 μM (E) and 292 μM (F). G Western blot analysis of SCD erythroblasts expressing sgControl, sgCBS and ectopic CBS expression. A codon-optimized CBS construct (CBSOPT) achieved the CBS ectopic expression. *, endogenous CBS; **, exogenous CBSOPT, which is ~7KDa larger than endogenous CBS with the following features: an N-terminal HA tag, a 1st 5 amino acids long linker, CBSOPT, followed by a FLAG tag, a 2nd 34 amino acids long linker, and C-terminal 2A linker peptide sequence (in the order of N to C terminal). Data represents the mean ± SD of four biological replicates. *p < 0.05.
Previously, CBS was found to contribute to replenishing GSH pools under cystine-restricted conditions at 30–50 μM16. Of note, the commercial Iscove’s Modified Dulbecco’s Medium (IMDM) and Serum Free Expansion Medium (SFEM), which were used as the basal medium for erythroblast cultures, contain a supraphysiological concentration of cystine at 292 μM as compared to physiological plasma concentration of 40–75 μM cysteine in SCD patients, which decreased further to 30–60 μM during vaso-occlusive pain episodes36. We also conducted studies in the SCD mouse model to gain additional evidence for this observation. Similar cysteine levels at 35–68 μM were observed in SCD mouse plasma (Supplementary Fig. 2D). In addition, since cysteine levels in the bone marrow where stress erythropoiesis occurs in SCD patients are unavailable, as a surrogate, we determined cystine levels in SCD mouse spleen, where stress erythropoiesis occurred. We observed that spleen tissue has cystine content at 10–45 μM which is even less than in plasma (Supplementary Fig. 2D). Therefore, we speculated that CBS is nonfunctional under supraphysiological cystine concentrations and investigated its function in a customized culture media containing cystine at a physiological concentration of 50 μM or less. Under cystine-restricted conditions, SCD erythroblasts showed significantly increased ROS and ferroptosis signals by 2’,7’-dichlorofluorescein (DCF) and Bodipy-C11 staining (Fig. 2B, C), confirming that cystine restriction elevates oxidative and ferroptosis stress.
Next, we determined whether sgCBS could affect the TSS pathway activity and GSH generation at different cystine levels. Compared to sgRNA controls, sgCBS significantly reduced intracellular cystathionine, cysteine, and GSH levels; however, such effects are diminished by increasing extracellular cystine supplement at 30 μM and completely lost at 292 μM (Fig. 2D–F). To further support the impact of CBS on replenishing GSH levels under cystine-restricted conditions, we expressed a codon-optimized CBS (CBSOPT), which is resistant to the designed sgRNA (Fig. 2G), and hypothesized that its expression will restore the activity of the TSS pathway and GSH generation. As expected, CBSOPT expression increases cysteine and GSH levels under cystine-restricted conditions (Fig. 2D). Similarly, the CBSOPT effect on cysteine and GSH levels is detectable when extracellular cystine was supplied at 30 μM (Fig. 2E) and these effects were diminished when cystine was supplied at a supraphysiological concentration at 292 μM (Fig. 2F). Further, to demonstrate an essential role of CBS in contributing to the cysteine and GSH generation, SCD erythroblasts were treated with a CBS inhibitor aminooxyacetic acid (AOAA). We observed that AOAA treatment decreases cysteine and GSH levels while increases ROS and ferroptosis stresses in SCD erythroblasts (Supplementary Fig. 3). Together, these findings suggest that CBS refuels cysteine pools for GSH synthesis through de novo cysteine biosynthesis under cystine restricted conditions.
TSS pathway activity is suppressed by excess hemin under hypoxia, and the suppression is reversible through DMF treatment
The afore findings suggest that supplementing cystine at physiological concentrations is a prerequisite for investigating the function of CBS in SCD erythroblasts. However, in the presence of hypoxia and excess hemin exposure along with supraphysiological concentrations of cystine, we readily detected the ability of DMF in contributing cysteine availability (Fig. 1), suggesting that in such culture conditions, the TSS pathway is active, and CBS contributes to the regulation of cysteine biosynthesis. To clarify how the TSS pathway is activated, we first evaluated the effects of hypoxia in the presence of supraphysiological concentrations of cystine. Importantly, along with an induction of HIF1α, in SCD erythroblasts cultured in the absence of hemin, we detected a significantly decreased CBS expression under hypoxia compared to normoxia (Supplementary Fig. 4), suggesting hypoxia affects the TSS pathway.
Since the hallmark of SCD is chronic hemolysis with excess hemin producing significant levels of oxidative stress, we speculate that hemin may modulate TSS pathway function. To evaluate this potential, we conducted metabolic profile analyses by LC-MS. We found that hemin increases S-Adenosyl methionine (SAM) levels but not S-Adenosyl-L-homocysteine (SAH). In contrast, the levels of cystathionine decreased significantly (Supplementary Fig. 5A, B), suggesting a hemin-mediated suppression of TSS pathway. To investigate the mechanism in detail, we next determined the expression of the TSS pathway enzymes with excess hemin, which significantly reduced the expression of CBS, but not that of CSE (Fig. 3A). Since the methionine cycle and the TSS pathway are closely connected with the former providing homocysteine for utilization in the latter, we determined the expression of the factors involved in the methionine cycle. Hemin showed negligible effect on the expression of most factors such as MAT1A; however, the expression of S-adenosylhomocysteine hydrolase (AHCY), the enzyme that converts S-adenosylhomocysteine to homocysteine, was slightly reduced under hemin treatment (Fig. 3A). These findings suggest that excess hemin exposure impairs SCD erythroblasts GSH synthesis through downregulation of the TSS pathway CBS and methionine cycle AHCY.
Fig. 3. Hemin suppresses, while DMF activates the TSS pathway.

A Western blot determined the effect of hemin on the expression of factors involved in the TSS pathway and methionine cycle. B Western blot determined the effect of DMF on the expression of factors involved in the TSS pathway, cystine uptake and GSH generation. C Biochemical assays determined the effects of hemin and DMF treatment on SAM and SAH. D Quantification of 13C3 serine tracing into serine, Cth and Cys under hemin and hemin/DMF treatments. Data represents the mean ± SD of three biological replicates. *p < 0.05.
To ascertain the role of DMF in activating the TSS pathway, we asked whether DMF could induce the expression of factors suppressed by hemin. DMF treatment induced the expression of CBS with no effect on CSE expression (Fig. 3B), along with a slightly increased expression of AHCY (Fig. 3B). In addition, consistent with the findings reported elsewhere, we found DMF induces the activation of NRF2, and NRF2 targets such as those involved in cystine uptake (SLC7A11) and GSH biosynthesis (GCLM and GCLC, the mediator and catalytic subunits of GCL) (Fig. 3B). To evaluate whether these changes will affect the metabolic profiles induced by hemin, we measured SAM and SAH levels, where SAM accumulation by hemin was reduced by DMF treatment (Fig. 3C). We also evaluated the metabolism of serine to cystathionine and following GSH synthesis with 13C3-serine tracing. DMF treatment was found to significantly increase the metabolism of serine to cystathionine and GSH, compared to hemin treatment alone (Fig. 3D).
DMF mediates NRF2-dependent and independent mechanisms on TSS pathway CBS activation
DMF activates NRF2, the master regulator for the antioxidative stress response, to regulate the expression of proteins involved in iron hemostasis, and GSH synthesis such as HMOX1, NQO1, FTH, FTL, SLC40A1 in a variety of cellular systems37. We also found that DMF induces NRF2 expression in erythroblasts and SCD mice for gene expression involved in ferroptosis and ROS stress response. RNA and protein analyses showed that NRF2 silencing by shNRF2 significantly decreased (Fig. 4A, B), whereas NRF2 ectopic overexpression increased the expression of CBS along with antioxidant factors such as NQO1 and GCLC (Fig. 4C). To determine whether DMF regulates CBS expression through NRF2, we determined the binding of NRF2 in the CBS gene locus. In silico examination of CBS promoter by Jaspar software38 predicted one putative antioxidant response element (ARE) ~ 5 kb upstream of the transcription start site, which is highly associated with H3K4Me1, H3K4Me2, H3K4Me3, and H3K9Ac histone marks (Supplementary Fig. 6). Indeed, the transcription activity of the ARE motif was significantly induced by DMF treatment while ARE motif mutants showed reduced activities (Supplementary Fig. 6B). Subsequent chromatin immunoprecipitation assay (ChIP) showed that NRF2 binds to the locus but not the downstream exon 7 region (Fig. 4D). Furthermore, the association of active histone codes H3K4Me3 and H3K9Ac was significantly reduced after NRF2 silencing (Fig. 4E) and DMF treatment increases both NRF2 association and active histone codes at the CBS gene ARE motif (Fig. 4F). These data support an NRF2-dependent effect of DMF on CBS expression regulation.
Fig. 4. NRF2 upregulates CBS expression.

A Western blot determined the effects of NRF2 silencing (shNRF2, three different constructs) on the expression of NQO1, CBS, and other factors involved in GSH generation and utilization. B qRT-PCR determined the effects of shNRF2 on NQO1, CBS, GCLC and GCLM transcripts. C Effect of ectopic NRF2 expression (NRF2OE) on NQO1, CBS, and factors involved in GSH generation and utilization. D ChIP assay determined NRF2 binding to putative ARE motif (4970 bp upstream of transcription start site) and exon 7 of CBS gene. ChIP assay determined the association of NRF2, H3K4Me3, and H3K9ac with the CBS ARE motif after shNRF2 (E) or DMF treatment (F). G Western blot determined the effect of DMF on the expression of NQO1, CBS, and factors involved in GSH generation and utilization in shNRF2 SCD erythroblasts. H ChIP assay determined the association of H3K4Me3, H3K9ac, and NRF2 with the CpG island of CBS gene. Data represents the mean ± SD of three biological replicates. *p < 0.05.
To further confirm an NRF2-dependent effect of DMF, we compared the expression of those ferroptosis-related factors including CBS in shNRF2 cells. Surprisingly, we still detected an induction effect of DMF on most of the factors studied despite NRF2 silencing (Fig. 4G), raising the possibility of an NRF2-independent mechanism mediated by DMF.
In erythroleukemia K562 cells, in addition to the above identified NRF2 binding ARE motif, there is also a strong association of active histone codes (such as H3K4Me3, H3K9Ac, H3K27Ac, H3K79Me2) upstream of the transcription start site (Supplementary Fig. 6A), indicating those cis-elements may participate in CBS gene regulation. As expected, in SCD erythroblasts, DMF treatment induces a strong association of H3K4Me3 and H3K9Ac in the region (Fig. 4H). In addition, CBS is regulated by DNA methylation39. Indeed, there are five CpG islands in the CBS gene locus with the longest CpG island containing 232 CG dinucleotides next to the transcription start site (Supplementary Fig. 6A), suggesting DNA methylation modifications may affect CBS gene transcription. To assess this potential, we treated SCD erythroblasts with DNA methylation inhibitor 5-Azacytidine (5AZA) and found global and CBS locus DNA demethylation along with CBS induction (Supplementary Fig. 6C–E). Notably, no putative NRF2 binding ARE motif was predicted by Jaspar in the proximal CpG island (Supplementary Fig. 6A), and ChIP analysis did not detect NRF2 binding in the CpG island (Fig. 4H). Therefore, the CpG island contributes to DMF-mediated CBS regulation in an NRF2-independent manner. Subsequent studies were conducted to define the mechanism of DMF-mediated CBS induction through changes in DNA methylation.
DMF upregulates DNA hydroxymethylation
We first determined whether DMF treatment mediates global or CBS locus-specific DNA methylation/hydroxymethylation (5mC/5hmC) modifications. In Day 12 DMF-treated SCD erythroblasts, we observed a global increase of 5hmC levels, though no obvious effect on 5mC was detected (Fig. 5A, Supplementary Fig. 7A). In addition, DMF treatment increased DNA 5hmC but not 5mC levels in the CBS gene promoter CpG island (Fig. 5B), suggesting that DNA methylation played a role in the mechanism of DMF regulation of CBS gene expression.
Fig. 5. DMF activates L2HGDH expression.

A Dot-blot determined the effect of DMF on global DNA hydroxymethylation (5hmC). Methyl Blue (MB) staining is conducted for DNA loading control. B ChIP assay determined the CBS gene CpG island 5mC and 5hmC levels. C The effects of DMF (100 μM) on L2HG levels. D Western blot determined the effects of DMF on L2HGDH expression. E Western blot determined the expression of L2HGDH in SCD erythroblasts expressing sgControl, two independent sgRNA against L2HGDH (sgL2HGDH-1 and sgL2HGDH-2) and L2HGDHOPT. *, endogenous L2HGDH; **, exogenous L2HGDHOPT. F Dot-blot determined the effect of sgL2HGDH and L2HGDHOPT on global DNA 5mC/5hmC levels CBS expression. Methyl blue staining (MB) is for loading control. G The effects of cell-permeable L2HG (TFMB-L2HG, 0.5 mM) treatment along with DMF (50 and 100 μM) on DNA 5hmC modification. The effects of sgL2HGDH (H) and L2HGDHOPT (I) on CBS expression. ChIP analysis determined the 5hmC modifications in the CBS gene CpG island under sgL2HGDH (J) and TFMB-L2HG treatment (K). Data represents the mean ± SD of 3–4 biological replicates. *p < 0.05.
To investigate whether these DMF-mediated alterations are related to the expression changes of DNA methylation modifiers, we determined the expression of DNA methyltransferases (DNMTs) and TET methylcytosine dioxygenases (TETs) in cultured Day 12 SCD erythroblasts. While the expression of DNMT3B, DNMT3L, and TET1 is barely detectable in SCD erythroblasts, the expression of DNMT1, DNMT3A, TET2 or TET3 was not significantly changed at the mRNA or protein level after DMF treatment (Supplementary Fig. 7B, C), indicating their irrelevance to the 5hmC changes induced by DMF.
Importantly, the enzymatic activity of TETs is regulated by 2-oxoglutarate (2OG) as a cofactor and suppressed by metabolites such as 2-hydroxyglutarate (2HG) as a competitor of 2OG. Therefore, we speculated that DMF could affect 2OG or 2HG levels to affect DNA methylation and revisited the initial LC-MS analyses which showed there are significantly reduced levels of 2HG, but not 2OG after DMF treatment (Fig. 1A). There are two 2HG enantiomers: D-2-hydroxyglutarate (D2HG) and L-2-hydroxyglutarate (L2HG), with the former predominantly generated from IDH1 mutants and PHGDH while L2HG is primarily generated from the promiscuous activity of LDHA and MDH1/2 under hypoxic or acidic conditions and converted back to 2OG by L2HGDH. Since D2HG and L2HG are indistinguishable in standard LC-MS, to determine which 2HG enantiomer(s) is affected, we adapted a chiral N-(p-toluenesulfonyl)-L-phenylalanyl chloride (TSPC) derivation followed by liquid chromatography with tandem mass spectrometry (LC-MS/MS) analysis24,40. DMF treatment decreased the level of L2HG, but not that of D2HG (Fig. 5C), and induced L2HGDH expression (Fig. 5D). Indeed, L2HGDH silencing or addition of cell permeable L2HG reduced global DNA 5hmC modifications (Fig. 5E–G), and the expression of CBS (Fig. 5H, I), while overexpression of a codon-optimized L2HGDH (L2HGDHOPT), which is resistant to the designed sgRNA, reverses this effect (Fig. 5E, F). In addition, 5hmC suppression induced by L2HG treatment is partially restored by DMF treatment (Fig. 5G). Accordingly, the expression changes of L2HGDH by sgL2HGDH, L2HG treatment, or L2HGDHOPT led to decreased or increased DNA hydroxymethylation in the CBS promoter CpG island (Fig. 5J, K).
Notably, hemin treatment increases while DMF treatment decreases SAM levels (Fig. 3C). SAM is the universal methyl donor for DNA methylation. Therefore, SAM level changes after hemin or DMF treatment may affect CBS expression as well. To evaluate this potential, DNA methylation and hydroxymethylation were determined in the SAM treated SCD erythroblasts. Treatment of SAM was found to increase both global and CBS gene locus specific DNA methylation (Supplementary Fig. 7D, E). These findings suggest that DMF, in addition to NRF2 activation on antioxidant response, could affect L2HGDH expression, L2HG and SAM levels to modify DNA 5mC and 5hmC modifications and CBS expression in SCD erythroblasts.
DMF diminishes ferroptosis stress in SCD mice
Previously, we showed that DMF decreases the expression of plasma proinflammatory factors such as Il1a and Tnfα in SCD mice25 (Supplementary Fig. 8). Indeed, DMF was found to decrease ROS and ferroptosis signals in spleen and liver tissues with significantly reduced 4-HNE protein adducts (Fig. 6A, B) and decreased iron levels (Fig. 6B). In addition, tissue levels of malondialdehyde (MDA), a lipid peroxidation marker, were reduced in DMF treated SCD mice than control mice (Fig. 6C). Consistently, DMF significantly induced the expression of antioxidant proteins such as Nqo1 and Gpx4, which are critical for detoxification reaction and GSH utilization (Fig. 6A). In addition, Cox2, the marker of lipid peroxidation during ferroptosis, was significantly reduced after DMF treatment. In agreement, we observed that cellular GSH levels and the ratio of GSH/GSSG were increased in DMF treatment group (Fig. 6D). These findings suggest that DMF presents anti-inflammatory and oxidative/ferroptosis stress defense effects in SCD mice.
Fig. 6. DMF reduces ferroptosis in SCD mice.

A Western blot determined the effects of DMF on the indicated protein factors in SCD mouse spleen Ter119+ erythroblasts. B The liver and spleen tissues of SCD mice after chronic DMF treatment were subjected to H&E, 4HNE, and iron Prussian Blue staining. The SCD mouse spleen Ter119+ erythroblasts were analyzed for lipid peroxidation by malondialdehyde (MDA) assay (C), the levels of GSH, GSSG, and their ratios (D). Data represents the mean ± SD of 5–8 mice per treatment. *p < 0.05.
As further support, we determined the expression levels of TSS pathway factors in spleen erythroblasts of SCD mice under chronic DMF treatment. In agreement with in vitro findings, DMF treatment induced the expression of Cbs, Ahcy, and NRF2 targets such as Gclc, Gclm, and Slc7a11, but not that of Cse (Fig. 6A). Together, these results support that DMF activates the TSS pathway and thus contributes to the regulation of cellular oxidative and ferroptosis stress response.
Next, we determined whether DMF presents NRF2 and DNA hydroxymethylation-dependent mechanisms in regulating the antioxidant and anti-ferroptosis genes in spleen Ter119+ cells of SCD mice. In mouse Gpx4, Cbs, and Gclc gene loci, in silico Jaspar on transcription factor binding analysis predicted NRF2 binding ARE motifs in individual locus and UCSC Genome Browser screen identified CpG islands (Supplementary Fig. 9). However, in Nqo1 and Slc7a11 loci, only ARE motifs are predicted while no CpG island was identified in 15 kb surrounding the transcription start site of both genes (Supplementary Fig. 9). In contrast, in Ahcy locus, only CpG islands but not ARE motif were identified (Supplementary Fig. 9). Consistently, by ChIP assay, we detected significant NRF2 binding in Nqo1 and Slc7a11 loci, along with induced association of H3K4Me4 and H3K9Ac after DMF treatment (Fig. 7A, B), without an effect on 5hmC association (Fig. 7A, B), suggesting both genes were regulated by DMF in an NRF2-dependent but not 5hmC-dependent regulatory manners. On the other hand, we detected significant increased 5hmC but not 5mC signals after DMF treatment in Ahcy locus (Fig. 7C), demonstrating a DNA hydroxymethylation dependent regulatory effect of DMF. In Cbs, Gclc and Gpx4 loci, both NRF2 binding and 5hmC levels increased along with active histone codes after DMF treatment (Fig. 7D–F), indicating a dual mechanism of DMF on their regulation dependent on both NRF2 binding and DNA hydroxymethylation. Together, these observations further support that DMF mediates gene locus-specific regulatory mechanism in an NRF2, DNA hydroxymethylation dependent or both to produce protective effect against ferroptosis in SCD.
Fig. 7. DMF regulates ferroptosis genes in NRF2 and DNA hydroxymethylation-dependent manners in SCD mice.

Spleen Ter119+ erythroblasts of SCD mice under DMF and PBS treatment were determined the chromatin structure in the Nqo1 (A), Slc7a11 (B), Ahcy (C), Cbs (D), Gclc (E), and Gpx4 (F) gene loci by ChIP assay for the association of NRF2, H3K4Me3 and H3K9Ac (left) and MeDIP/hMeDIP for DNA methylation/hydroxymethylation (5mC/5hmC) (right). IgG was used as an antibody control. The schematic of genes is shown above the panels with the arrow indicating the transcription start site, the predicted NRF2 binding antioxidant response element (ARE) motifs in black bars, and CpG islands in green bars. The distance of the ARE motifs and CpG islands to the transcription start site of individual genes is not to scale. Data represents the mean ± SD of four biological replicates (n = 4). *p < 0.05.
Discussion
Here we investigated the contribution of the TSS pathway to the antioxidant and ferroptosis stress regulation in SCD erythroblasts. Under physiological cystine supplementation, excess heme exposure suppresses the TSS pathway and leads to elevated ferroptosis; however, the ferroptosis stress is alleviated with supraphysiological cystine supplement, though under which the TSS pathway is nonfunctional. On the contrary, activation of the TSS pathway under physiological cystine supplement is achieved under DMF treatment through enhanced CBS expression and cystine uptake to protect against ferroptosis in SCD erythroblasts. Mechanistically, DMF regulates the expression of factors involved in the de novo cysteine synthesis (CBS), cystine uptake (SLC7A11), and GSH generation (GCLC, GCLM) through NRF2-dependent and independent pathways. The NRF2-dependent effect was identified through the antioxidative response element in target gene loci, while NRF2-independent effects act through DNA 5hmC modifications via the regulation of the metabolite L2HG.
Ferroptosis is an iron-dependent regulated cell death due to accumulated lipid peroxidation and involved in physiological processes such as embryonic erythropoiesis and aging. There is a significant age-dependent increase in ferroptosis in the kidney, spleen, liver, ovary, uterus, cerebellum, and bone marrow, accompanied by iron accumulation41. Ferroptosis is also involved in oxidative stress, inflammation, and cell death in pathological and malignant conditions. One of the interesting factors in ferroptosis regulation in SCD is through heme oxygenase 1 (Hmox1), which cleaves heme to form biliverdin and thus plays a protective role in vascular function42–45. A recent study reported that Hmox1 activation induces heme accumulation and drives cardiomyopathy through ferroptosis induction, whereas inhibition of Hmox1 reduced cardiac damage in SCD46. Such Hmox1 upregulation leads to iron overload, elevated levels of lipid peroxidation and ferroptosis stress to exacerbate SCD disease condition. In contrast, ferroptosis inhibition via iron chelation or lipid radical scavenges blocked this Hmox1 activation-induced cardiac damage, supporting a ferroptosis targeting therapeutic strategy to alleviate cardiomyopathy in SCD46.
In hematopoietic stem cells (HSC), histone deubiquitinase MYSM1 was shown to mediate the vulnerabilities of HSC to ferroptosis stress by regulating protein synthesis. Loss of MYMS1 in HSCs disrupts iron hemostasis and results in increased ferroptosis, which could be rescued with ferroptosis inhibitors such as liproxstatin-147. In addition, loss of glutathione peroxidase 4 (GPX4), a central regulator of ferroptosis, leads to hemolytic anemia and increases spleen erythroid progenitor death through receptor-interacting protein 3 (RIP3)-dependent necroptosis signaling48. Specifically, mature red blood cells are enucleated, and organelles such as mitochondria are extruded in healthy conditions. They seldomly suffer from lipid peroxidation and subsequent ferroptosis originating from oxidative phosphorylation49. However, in sub-healthy conditions such as SCD, there is significant retention of mitochondria, large amounts of heme iron and molecular oxygen in red blood cells, which are therefore susceptible to ferroptosis stress. Indeed, such abnormal presence of mitochondria in circulating red blood cells causes increased oxygen consumption, ROS generation, and hemolysis in SCD patients50,51. These well-characterized findings show that immature red blood cells suffer ferroptosis stress from iron accumulation and oxygen during stress erythropoiesis, while ferroptosis is rarely detectable in normal red blood cells.
Our initial attempt to investigate the contribution of the TSS pathway and CBS regulation to the cysteine pool failed when cells were cultured under supraphysiological cystine concentrations. Indeed, other than cystine, amino acids such as glutamine, methionine, serine, leucine, and glucose were at two to five-fold higher concentrations than those in the plasma of healthy human subjects. The contribution of these metabolites was only detectable when cells were cultured under physiological conditions. Therefore, we explored the ferroptosis regulation of SCD erythroblasts under physiological cystine supplementation. Our results showed that the contribution of the TSS pathway on de novo cysteine synthesis and GSH generation is only detectable under cystine-restricted conditions, and such function is dimmed when cystine is supplemented at supraphysiological concentrations.
By activating several proteins involved in the TSS pathway and cystine uptake, including CBS, SLC7A11, GCLC, and GCLM, DMF increased GSH levels and produced a ferroptosis scavenging effect. This regulatory effect of DMF was identified through NRF2-dependent and independent mechanisms with NRF2 binding to ARE motifs and increasing DNA 5hmC of individual gene regulatory regions involved in the TSS pathway, cystine uptake, and GSH generation. The regulatory effect of NRF2 on those genes was well documented through antioxidative response element binding in the promoter or enhancers of target genes. However, several genes, such as AHCY, were identified without characterized ARE motifs. Other genes, although with ARE motifs, present CpG islands in their proximal promoters such as GCLC and GCLM, which are characterized by significant association of active histone codes such as H3K4Me1-3, H3K9Ac, H3K27Ac, and H3K79Me2, suggesting a regulatory role of CpG islands in chromatin modifications. By defining global and gene-specific DNA 5hmC modifications, we demonstrated that DMF induces 5hmC modifications to influence loci-specific chromatin structure through L2HGDH to reduce the levels of L2HG. The latter is a competitor of 2-Oxoglutarate-dependent dioxygenases such as Ten-eleven translocation methylcytosine dioxygenase and therefore induces DNA hydroxymethylation and gene upregulation52.
Interestingly, rising evidence supports the anti-ferroptosis effects of DMF in malignant, pathological, and physiological conditions53,54. However, DMF can also mediate pro-ferroptosis effects by GSH succinylation55, impairs NF-κB/STAT3 signaling56, and potentiates oxidative cell death57. Interestingly, DMF is also shown to regulate ferroptosis in a time-dependent manner, inducing ferroptosis in a short period but repressing ferroptosis in a long period58. These distinct effects of DMF indicate a cellular context-dependent manner in ferroptosis regulation, and more additional studies are required to dissect the mechanisms in erythroblasts. Notably, in the condition of excess hemin exposure and hypoxia, our findings suggest an important contribution of the TSS pathway and its regulation by DMF for de novo cysteine synthesis and GSH generation in protecting against the oxidative and ferroptotic stresses in SCD erythroblasts. Indeed, excess hemin and iron contents and hypoxic stress in the tissues including spleen and liver exacerbated SCD clinical severity59–62; therefore, in vivo studies in SCD mice to demonstrate in more detail a physiological significance of the TSS pathway in alleviating oxidative and ferroptosis stress are warranted. Nevertheless, our findings in erythrocytes and previously published in SCD cardiac tissues46 support that, in addition to inflammation suppression23 and fetal globin induction31,63,64, DMF displays anti-oxidative and ferroptosis stress effects to alleviate SCD clinical severity, and therefore, might be pursued as a new treatment option.
Methods
Animal experiments
The humanized Townes SCD transgenic (B6;129-Hbatm1(HBA)Tow Hbbtm2(HBG1,HBB*)Tow/Hbbtm3(HBG1,HBB)Tow/J) mouse65 was obtained from Jackson Laboratories (https://www.jax.org/strain/013071) as breeders. The female mice (homozygous for Hbatm1(HBA)Tow and heterozygous for Hbbtm2(HBG1,HBB*)Tow and Hbbtm3(HBG1,HBB)Tow [hα/hα::βA/βS], sickle-cell trait mice) and male mice (homozygous for both Hbatm1(HBA)Tow and Hbbtm2(HBG1,HBB*)Tow [hα/hα::βS/βS], sickle SCD mice) were bred to generate SCD mice. Mouse genotyping was performed with gene specific primers, summarized in Supplementary Table 1. We have complied with all relevant ethical regulations for animal use. All animal studies were approved by the Augusta University Institutional Animal Care and Use Committee (#2019-1010). Two to three-month-old of both sexes SCD mice were treated with 50 mg/kg DMF (#242926, Sigma) every other day for 4 weeks. DMF is prepared at 15 mg/ml in DMSO, a mouse of 30 g needs 1.5 mg (50 mg/kg), that is 100 µL and dilute in 300 µL PBS and intraperitoneally injected. Control mice were treated with the same amount of DMSO after diluted in PBS. At the end of treatment, mice were euthanized by asphyxiation with CO2 and peripheral blood, spleen single cell population were analyzed for the ROS, ferroptosis levels by DCF and Bodipy-C11 staining followed by flow cytometry analysis. Iron and 4HNE levels in the spleen and liver tissues are stained with Prussian blue staining (#IW-3010, IHC world) and immunohistochemistry (IHC) staining.
Cell culture
Erythroid progenitors from SCD patients were generated with peripheral blood mononuclear cells (PBMN) followed by CD34+ cell selection (#17856, StemCell Technologies). The anonymous collection of discarded blood samples from SCD children undergoing chronic transfusion was classified as exempt by the Institutional Review Board at Augusta University and did not require informed consent. No sex information of the cell source was available. SCD erythroid progenitors were cultured in a modified two-phase liquid culture system24. Briefly, during phase 1, cells were grown in Iscove’s Modified Dulbecco medium (IMDM) with 15% fetal bovine serum (FBS), 15% human AB serum, 10 ng/mL interleukin-3, 50 ng/mL stem cell factor and 2 IU/mL erythropoietin (Sigma-Aldrich, St. Louis, MO). Phase 2 was initiated on day 7 with a similar medium without stem cell factor and interleukin 3. On day 12 of culture, SCD erythroblasts were collected for the indicated analyses. Day 10 cultured SCD erythroblasts were treated with 75 μM hemin (#51280, Sigma) (dissolved in 0.25 M NaOH then neutralized with HCL to pH7.4), 50 μM dimethyl fumarate (#242926, Sigma) (dissolved in DMSO), 0.5 mM (2S)-Tetrahydro-5-oxo-2-furancarboxylic acid (TFMB-L2HG) (#SML2563, Sigma) (dissolved in DMSO), 0.5 mM S-(5′-Adenosyl)-L-methionine iodide (SAM) (#A4377, Sigma) (dissolved in water), and cultured under hypoxia (1% O2) using Heracell™ 150i incubator equipped with an Oxygen (O2) sensor and Nitrogen (N2) gas supply and analyzed on day 12 of culture.
Cell culture with customized medium. Since no commercial cystine-free IMDM is available, we customized IMDM based on a DMEM medium (#D9800-28, USBiological, Salem, MA) without amino acids, glucose, sodium bicarbonate, and sodium pyruvate. Briefly, sodium bicarbonate, glucose, sodium pyruvate, and all 20 amino acids (except cystine and serine), biotin (B4639, Sigma), and vitamin B12 (V6629, Sigma) were added to the DMEM medium (#D9800-28, USBiological, Salem, MA) to match standard IMDM, supplement with 15% human AB serum and 15% dialyzed FBS (#SH300790340, Cytiva Hyclone), along with 10 ng/mL interleukin-3, 50 ng/mL stem cell factor and 2IU/mL erythropoietin. The cystine is added separately at final 0, 5 or 48.3 mg/L (equivalent to 0, 30, and 292 μM), depending on experiments. Serine is added at 10.5 mg/L, which is skipped in isotopic tracing assays.
Amino acids L-Alanine (AAA1580414), L-Cystine (AAA1376218), L-Glutamine (AAA1420118), L-Histidine (AAA1762718), L-Methionine (AAA1031822), L-Phenylalanine (AAA1323814), L-Proline (AAA1019914), L-Serine (AC132660250) and L-Tyrosine (AAA1114118) were obtained from Thermo Fisher. Amino acids L-Arginine (A5131), L-Asparagine (A4159), L-Aspartic acid (A9256), L-Glutamic acid (G1251), L-Glycine (G8898), L-Lysine (L5626), L-Leucine (L8000), L-Isoleucine (I2752), L-Threonine (T8625), L-Tryptophan (T8941), and L-Valine (V0500) were obtained from Sigma.
ROS and lipid peroxidation assay
Day 12 cultured SCD erythroblasts under different treatments were incubated with 5 μM 2’-7’-dichlorodihydrofluorescein diacetate (H2DCFDA) (#D6883, Sigma) for 30 min at 37 °C, washed with PBS, and analyzed on a BD LSR-II flow cytometer for ROS level. Lipid ROS levels were measured through oxidation of the Bodipy™ 581/591 C11 (#D3861, Invitrogen) according to the manufacturer’s instructions. Briefly, cells were stained with C11-Bodipy (2 µM) for 30 min at 37 °C. Cells were collected and washed with PBS once, and cellular fluorescence was determined similarly by flow cytometry. ROS and lipid peroxidation data were analyzed with FlowJo V.10.1 software.
Lentiviral infection
For lentiviral packaging, HEK293FT cells (#R70007, Invitrogen) were cultured in DMEM medium supplemented with 10% FBS and penicillin/streptomycin. After one passage, cells were plated into 10 cm dishes at 50% confluency. On the next day, targeting plasmids (sgRNA or overexpression) were co-transfected with pMD2.G (#12259, Addgene) and psPAX2 (#12260, Addgene) plasmids at 1:1:1 molar ratio using Lipofectamine 2000 (#11668019, Thermo Fisher) at 1:2.5 ratio. Viral supernatants were harvested twice at 48- and 72-hrs post-transfection. The combined viral supernatant was centrifuged and filtered at 0.45 μm. Filtered viral supernatant was then concentrated by Lenti-X Concentrator (#631232, Takara) following the manufacturer’s instruction and the virus pellet was resuspended in 1/100th of the original volume using cold DMEM. Concentrated virus was added to day 2 cultured CD34+ erythroid progenitors in the presence of 8 μg/ml polybrene. The cells were then spin-infected at 2000 rpm for 90 min at 37 °C. After spin infection, the supernatant was removed, and fresh culture medium was added. Antibiotic selection (puromycin 1.5 μg/ml, Blasticidin 5 μg/ml, or both) was started 36 h post-transduction.
Immunoblotting
Proteins were extracted from cultured SCD erythroblasts or spleen Ter119+ erythroblasts with modified RIPA buffer (150 mM NaCl, 50 mM Tris, pH 7.5, 1% NP40, 0.25% Na-deoxycholate) plus protease inhibitor cocktail (Sigma) and stored at −80 °C up to processing. The protein concentration was determined with the Bradford protein assay (Bio-Rad). An estimated 15 μg whole cell extract was loaded per well on 10%-12% SDS-PAGE gel and transferred onto nitrocellulose membrane (Bio-Rad). Membranes were washed with PBST, blocked with 5% non-fat milk, and incubated with the antibodies indicated (Supplementary Table 2). Secondary antibodies (donkey anti-rabbit IgG-HRP, goat anti-mouse IgG-HRP, and Donkey anti-Goat IgG-HRP) and detection were performed according to routine laboratory practices.
sgRNA constructs and gene expressing codon optimized (OPT) plasmid constructs
sgRNA control and constructs against CBS and L2HGDH were designed targeting GTATTACTGATATTGGTGGG (sgControl) (#230080, Addgene), GGAGCAGACAACCTACGAGG (sgCBS-1) (#230081, Addgene), TGGCAGTGCTGGCAGCACGG (sgCBS-2) (#230082, Addgene), GATATAGTCATCGTTGGTGG (sgL2HGDH-1) (#230083, Addgene), and CACCAGACTGGACATAACAG (sgL2HGDH-2) (#230084, Addgene) and constructed in lentiCRISPR v2-Blast (#83480, Addgene) for Blasticidin selection at a final concentration of 5 μg/ml.
CBSOPT and L2HGDHOPT constructs. The human CBS and L2HGDH gene cDNAs were synthesized with Twist Bioscience (South San Francisco, CA), with the sgRNA targeting regions replaced with “wobble” mutations. In addition, HA and FLAG expression tags were added to both 5’ and 3’ ends, respectively. The CBSOPT and L2HGDHOPT were then constructed in pCDH-CMV-Nluc-P2A-copGFP-T2A-Puro (#73037, Addgene), with the Nluc-P2A-coGFP genes removed. The final predicted expression of both CBSOPT and L2HGDHOPT were MYPYDVPDYALQISCBSOPT (or L2HGDHOPT)DYKDDDDKKSRGPGRATGAAANSAVDGTAGPGSTGSRVDGSGEGRGSLLTCGDVEENPGP (with the features: HA tag, amino acid linker 1, CBSOPT (or L2HGDHOPT), FLAG, amino acid linker 2, T2A self-cleavage site, in the order of N to C terminal) (#230088 and #230089, Addgene). The lentiviral particles for CBSOPT and L2HGDHOPT constructs were generated similarly with the packaging system as those for sgRNA but selected with puromycin at a final concentration of 1.5 μg/ml. Both CBSOPT and L2HGDHOPT are about 7KDa larger than the endogenous ones.
NRF2 shRNA and overexpression. The NRF2 silencing was achieved by infecting lentiviral particles produced by employing co-transfection of pLKO.1 shRNA and packaging vectors in HEK 293FT cells. The shRNA constructs against NRF2 were designed targeting guggcugcucagaauugcaga (shNRF2-1), guaagaagccagauguuaaga (shNRF2-2), and gcuccuacugugaugugaaau (shNRF2-3) (#230086 and 230087, Addgene). The shRNA control (shCtl) construct targets cuaagguuaagucgcccucg. Ectopic NRF2 expression was achieved with pLenti-CMV-NFE2L2-Puro (#181919, Addgene). After lentiviral transduction, SCD erythroblasts were selected with 1.5 μg/ml puromycin until analysis.
CBS promoter antioxidant response element (ARE) report assay. The DNA sequence spanning the CBS gene ARE motif located 4970 bp upstream of the transcript start site and its mutants were cloned into a GFP expressing reporter pEGFP-N1 (PT3054, Clontech) with sequence specific primers (Supplementary Table 1). The sequence containing CMV promoter of the vector pEGFP-N1 was removed before ARE motif plasmid construction. Plasmids of wildtype and mutants of ARE motifs were transfected to K562 (#CRL-3344, ATCC), an erythroleukemia cell, along with pDsRed1-N1 (PT3405, Clontech), which is used as a transfection efficacy control. GFP and RFP expressions were detected by FACS assay.
Metabolite LC-MS/MS analysis
Extracts were prepared and analyzed by LC-MS/MS to determine the relative abundances of intracellular metabolites. Briefly, metabolites from 3 × 10⁶ cells were extracted on ice with 0.8 ml pre-cold 80% methanol (−80 °C), and cell rupture was achieved by a Bullet Blender Storm 24 (Next Advance, Troy, NY) with metal beads, followed by five freeze-thaw out cycles. Insoluble material was pelleted by centrifugation at 10,000 rpm for 10 min. The metabolite extract from the supernatants was vacuum dried with Genevac EZ-2 plus Evaporator (SP Industries, Warminster, PA). Samples were reconstituted in 30–60 μl 50% acetonitrile, followed by vortexing for 30 sec, and then centrifuged at 10,000 rpm for 10 min at 4 °C. The supernatant was collected for LC-MS analysis using 5 μl of each sample.
High-performance liquid chromatography. An Ultimate 3000 UHPLC (Dionex) was coupled to the Q Exactive-Mass plus spectrometer (QE-MS, Thermo Scientific) for metabolite separation and detection. For additional polar metabolite analysis, a HILIC method was used, with an Xbridge amide column (100 × 2.1 mm internal diameter, 3.5 μm; Waters), for compound separation at room temperature.
Analysis of Mass Spectrometry Data. Data was collected using MassHunter software (Agilent). Metabolites were identified, and their peak area was recorded using MassHunter Quant. Metabolite identity was established using a combination of an in-house metabolite library developed using pure purchased standards, the NIST library, and the Fiehn library. Metabolites of low concentrations are not quantifiable. Statistical analysis was performed using Metaboanalyst 6.0 (https://www.metaboanalyst.ca/), and a heatmap showing the relative intensity of compounds in the various samples was generated. Metabolite pathway analysis was conducted in the Pathway Analysis module of MetaboAnalyst 6.0. All metabolites were normalized with total analyzed cell numbers for analysis. For metabolite clustering analysis, average linkage hierarchical clustering was performed in the Statistical Analysis module of MetaboAnalyst 6.0 using Euclidian distance as a similarity metric. For PCA analysis, all metabolites were used following quantile-normalization in the Statistical Analysis module of MetaboAnalyst 6.0.
Stable isotope tracing
For isotope tracing experiments, day 10 SCD erythroblasts were cultured with the treatment of hemin, DMF, or both for 40 h. Cells were then collected and cultured in the serine-free customized IMDM medium. For the tracing13,C3-serine was added to a final concentration of 100 μM and cultured for an additional 6 h of hemin, DMF or both treatments. At the end of the tracing, metabolites were extracted with 80% methanol. Each sample (8 μl) was injected onto an Agilent Poroshell 120 EC-C18 (100 × 2.1 mm, 2.7 um) in a Shimadzu Nexera UHPLC system at a flowrate of 0.2 ml/min using a gradient elution created between buffer A (10 mM tributylamine aqueous solution adjusted pH to 4.95 with 15 mM acetic acid) and buffer B of methanol, from 10% to 40% (buffer B) in 30 min at room temperature. The effluent was ionized via ion electrospray in negative mode on a TSQ Quantiva triple-quadrupole mass spectrometry with the following instrument settings: ion spray voltage 2500 V, sheath gas 28, ion transfer tube temperature 325, aux gas 8, and FWHM of 0.7 for both Q1/Q3 resolution. The optimal collision energy and RF lens were determined using purchased standards for each metabolite. MRM data were analyzed using Skyline software (version 20.0, University of Washington) to quantify metabolites for flux analysis. Retention times and mass fragmentation signatures of all metabolites were validated using pure standards. Ion pairs with various isotope labels were derived based on the precursors’ and fragments’ chemical structures and molecular weights. The abundance of each mass isotopomer was then mathematically corrected to eliminate natural abundance isotopes and normalized to the protein content of each sample.
GSH and GSSG assay
Reduced (GSH) and oxidized (GSSG) glutathione measurements were performed using a GSH/GSSG-Glo™ Assay Kit (Promega). Briefly, flash-frozen tissue samples were homogenized in ice-cold PBS containing 2 mM EDTA (1 ml PBS/EDTA per 10 mg tissue) using a Dounce homogenizer. The extracts were centrifuged at 10,000 rpm for 10 min at 4 °C, and the supernatant was collected and used immediately for the assay at a dilution of 1:10 in PBS/EDTA. Luminescence was read by a victor3 1420 multilabel counter (Perkin Elmer).
Cysteine assay
On day 12, cultured erythroblasts were harvested, washed with PBS buffer once, and resuspended in distilled water. The intracellular amino acids were extracted by boiling for 10 min. The supernatant was collected after centrifugation and protein content was determined. Cysteine levels in the supernatant were measured by a Cysteine Assay Kit (#MAK255, Sigma) and the cysteine standards. Cysteine levels after different treatments were compared after normalization to cell numbers.
Cystine uptake assay
The cystine uptake assay was conducted with BioTracker Cystine-FITC Live Cell Dye (#SCT047, Sigma). Briefly, SCD Day 10 erythroblasts were cultured at indicated conditions, and Cystine-FITC was added to cultured SCD erythroblasts at 100 µM for 45 min, allowing uptake. The cells were then collected and washed, followed by quantification of cellular levels of Cystine-FITC by flow cytometry analysis.
S-Adenosyl methionine quantification assay
Intracellular SAM levels were quantified with Bridge-It S-Adenosyl Methionine (SAM) Fluorescence Assay (#1-1-1003, Mediomics). In brief, 1 × 10⁵ spleen Ter119+ cells were pelleted in PBS, resuspended in 30 μl of Buffer CM and incubated at 24 °C for 1 h, with occasional vortex. Samples were cleared by centrifugation at 4 °C 10,000 rpm for 5 min, and the supernatants were analyzed and quantified with the SAM standard curve.
Cellular lipid ROS assay
Lipid ROS levels were measured through oxidation of the C11-Bodipy lipid peroxidation sensor (Thermo Fisher Scientific) according to the manufacturer’s instructions. Briefly, cells were stained with C11-Bodipy (2 µM) for 30 min at 37 °C. Cells were collected and washed with PBS once, and cellular fluorescence was determined by flow cytometry and data were collected by BD FACSCanto and analyzed with FlowJo V.10.1 software.
Lipid peroxidation (MDA) assay
The intracellular MDA contents were measured with the MDA assay kit (#MAK085, Sigma) based on thiobarbituric acid (TBA) reactivity. Briefly, cultured SCD erythroblasts or mouse spleen Ter119+ cells were harvested and lysed. Then, after protein quantification of the lysate, MDA working solution was added and heated at 95 °C for 60 min. Next, the supernatant was collected after centrifuging at 1000 rpm for 10 min at 4 °C, and then measured at 532 nm with a microplate reader. The relative cellular MDA concentration was presented as a percentage of control after normalized to protein contents.
Cytokine LEGENDPlex assay
SCD mice plasma samples were 2-fold diluted, and cytokine levels were assessed with mouse LEGENDplex inflammation panel 13-plex kit (#740150, BioLegend) per manufacturer’s instructions. Cytokine levels were acquired using a FACSCanto II flow cytometer (BD Biosciences) and analyses were performed using LEGENDplex data analysis software (BioLegend).
Quantification of 2HG enantiomers
2HG quantification in SCD erythroblasts was performed as we previously described24 by liquid chromatography–mass spectrometry (LC-MS/MS) after derivatization using N-(p-Toluenesulfonyl)-L-phenylalanyl Chloride (TSPC) on the LC-ESI-MS/MS system. Data was acquired using Thermo Xcalibur 4.0 Software (Thermo Scientific, Waltham, MA USA) MS data processing and analysis were made using Skyline software (V20, MacCoss Lab, University of Washington, Seattle, WA). The 2HG content of experimental samples was determined by interpolation using 2HG peak areas measured in the standards. Concentrations of D2HG and L2HG were normalized to cell numbers.
mRNA expression analysis
Total RNA was isolated using the RNeasy Mini kit (#12183018A, Thermo Fisher). cDNA was synthesized with the iScript™ cDNA Synthesis Kit (#170-8891, Biorad) and subjected to quantitative real-time PCR using SYBR Green Supermix (#172-5272, Biorad). All the data were normalized to ACTB. Sequences of qPCR primers can be found in Supplementary Table 1.
DNA dot-blot analysis
Genomic DNA from erythroblasts was extracted using phenol:chloroform:isoamyl alcohol (25:24:1) and precipitated with ethanol before dissolving in water. Following RNase treatment and denaturation, serially diluted DNA was spotted on Hybond-N+ membranes (#RPN203B, Amersham Biosciences). Membranes were blocked with 5% non-fat milk and incubated with mouse anti-5mC (#61480, Active motif) or anti-5hmC (#39999, Active motif) followed by a horseradish peroxidase-conjugated antibody (Santa Cruz Biotechnology). The ECL Prime Detection Kit (Thermo Fisher) detected the signal. Cross-linked membranes were incubated with 0.02% methylene blue to validate uniform DNA loading.
Methylated DNA immunoprecipitation (MeDIP) and hydroxymethylated DNA immunoprecipitation (hMeDIP)
Purified genomic DNA was sonicated and subjected to agarose gel electrophoresis and DNA fragments between 150–200 bp were recovered. Purified DNA was denatured by heating and MeDIP and hMeDIP were conducted with 5mC or 5hmC antibodies as we previously described64. The 5mC and 5hmC immunoprecipitation signals were determined using gene-specific primers (Supplementary Table 1). qPCR was performed on immunoprecipitated DNA using SYBR Green Supermix. The enrichment of the target loci was normalized with input DNA.
Chromatin immunoprecipitation assays
ChIP experiments were conducted using ChIP-IT High Sensitivity Kit (ab185913, Abcam) with adaptations. Chromatins were sonicated to 200–1000 bp and immunoprecipitated with antibodies against NRF2, H3K4Me3, and H3K9Ac and determined with gene-specific primers (Supplementary Table 1). Normal rabbit IgG (#I8410, Sigma) was used as a non-specific antibody control. qPCR was performed on immunoprecipitated DNA using SYBR Green Supermix.
Statistics and reproducibility
Data from at least three independent biological replicates were reported as the mean ± SD. Statistical differences were determined by an unpaired Student’s t test or two-way ANOVA with the corresponding two-tailed significance determined. Statistical analysis was performed using GraphPad Prism 9 software (GraphPad Software Inc., San Diego, CA), and differences were considered significant at p < 0.05.
Reporting summary
Further information on research design is available in the Nature Portfolio Reporting Summary linked to this article.
Supplementary information
Description of Additional Supplementary Materials
Acknowledgements
We thank the pediatric SCD patients and nurses for their contribution to the collection of blood samples. We thank Dr. Peng Gao from the Metabolomics Core Facility at Northwestern University for conducting the LC-MS metabolomic analysis. These studies used the resources of the Augusta University Proteomics and Mass Spectrometry Core at Georgia Cancer Center. This research was supported by the Augusta University Intramural Pilots Project to X.Z. and B.P. (IGPP00055) and National Institute of Diabetes and Digestive and Kidney Diseases grants to X.Z. (R01DK119762 and R01DK139694).
Author contributions
C.X., J.P., and X.Z. designed and performed experiments, analyzed the data, and wrote the manuscript. W.X., Y.C. N.J., and W.Z. performed experiments and analyzed the data. H.S. and A.H. provided reagents and analyzed the data. B.S.P. and X.Z. conceived the ideas, oversaw the project and wrote the manuscript. All the authors reviewed the data and provided critical feedback to shape the research, analysis and manuscript.
Peer review
Peer review information
Communications Biology thanks Chao Mao and the other, anonymous, reviewer(s) for their contribution to the peer review of this work. Primary Handling Editors: Rosie Bunton-Stasyshyn & Mengtan Xing. A peer review file is available.
Data availability
All data generated or analyzed during this study are included in the article and Supplementary files, or available from the corresponding author on reasonable request. The source data file underlying all graphs can be found in Supplementary Data. Metabolomics data are provided in the Supplementary Tables 3, 4. Uncropped images of every blot in the manuscript are shown in Supplementary Figs.. Source data are provided with the paper. The plasmids generated in the work have been deposited to Addgene. All uncropped pictures are shown in Supp. Figs. 11 and shared through Figshare 10.6084/m9.figshare.27822531.v1.
Competing interests
The authors declare no competing interests.
Footnotes
Publisher’s note Springer Nature remains neutral with regard to jurisdictional claims in published maps and institutional affiliations.
Supplementary information
The online version contains supplementary material available at 10.1038/s42003-024-07424-7.
References
- 1.Rodgers, G. P., Walker, E. C. & Podgor, M. J. Mortality in sickle cell disease. N. Engl. J. Med.331, 1022–1023 (1994). [DOI] [PubMed] [Google Scholar]
- 2.Rees, D. C., Williams, T. N. & Gladwin, M. T. Sickle-cell disease. Lancet376, 2018–2031 (2010). [DOI] [PubMed] [Google Scholar]
- 3.Darghouth, D. et al. Pathophysiology of sickle cell disease is mirrored by the red blood cell metabolome. Blood117, e57–e66 (2011). [DOI] [PubMed] [Google Scholar]
- 4.Culp-Hill, R. et al. Effects of red blood cell (RBC) transfusion on sickle cell disease recipient plasma and RBC metabolism. Transfusion58, 2797–2806 (2018). [DOI] [PMC free article] [PubMed] [Google Scholar]
- 5.Mariani, R., Trombini, P., Pozzi, M. & Piperno, A. Iron metabolism in thalassemia and sickle cell disease. Mediterr. J. Hematol. Infect. Dis.1, e2009006 (2009). [DOI] [PMC free article] [PubMed] [Google Scholar]
- 6.Kato, G. J. Defective nitric oxide metabolism in sickle cell disease. Pediatr. Blood Cancer62, 373–374 (2015). [DOI] [PubMed] [Google Scholar]
- 7.Klouda, T., Raybagkar, D., Bernstein, B. & Apollonsky, N. Changes in Blood Profile from Steady State in Patients with Sickle Cell Anemia Admitted for Vaso-occlusive Crisis and Acute Chest Syndrome. Adv. Hematol.2020, 3656717 (2020). [DOI] [PMC free article] [PubMed] [Google Scholar]
- 8.Cardoso, E. C. et al. Changes in heme levels during acute vaso-occlusive crisis in sickle cell anemia. Hematol. Oncol. Stem Cell Ther. 10.1016/j.hemonc.2021.08.002 (2021). [DOI] [PubMed]
- 9.Abdulwahab, H. et al. Whole blood transcriptomic analysis reveals PLSCR4 as a potential marker for vaso-occlusive crises in sickle cell disease. Sci. Rep.11, 22199 (2021). [DOI] [PMC free article] [PubMed] [Google Scholar]
- 10.Silva, D. G. H., Belini Junior, E., de Almeida, E. A. & Bonini-Domingos, C. R. Oxidative stress in sickle cell disease: an overview of erythrocyte redox metabolism and current antioxidant therapeutic strategies. Free Radic. Biol. Med65, 1101–1109 (2013). [DOI] [PubMed] [Google Scholar]
- 11.Sun, K. & Xia, Y. New insights into sickle cell disease: a disease of hypoxia. Curr. Opin. Hematol.20, 215–221 (2013). [DOI] [PubMed] [Google Scholar]
- 12.Reid, M., Badaloo, A., Forrester, T. & Jahoor, F. In vivo rates of erythrocyte glutathione synthesis in adults with sickle cell disease. Am. J. Physiol. Endocrinol. Metab.291, E73–E79 (2006). [DOI] [PubMed] [Google Scholar]
- 13.Faintuch, J., Aguilar, P. B. & Nadalin, W. Relevance of N-acetylcysteine in clinical practice: fact, myth or consequence? Nutrition15, 177–179 (1999). [DOI] [PubMed] [Google Scholar]
- 14.Pace, B. S. et al. Effects of N-acetylcysteine on dense cell formation in sickle cell disease. Am. J. Hematol.73, 26–32 (2003). [DOI] [PubMed] [Google Scholar]
- 15.Nur, E. et al. N-acetylcysteine reduces oxidative stress in sickle cell patients. Ann. Hematol.91, 1097–1105 (2012). [DOI] [PMC free article] [PubMed] [Google Scholar]
- 16.Zhu, J. et al. Transsulfuration Activity Can Support Cell Growth upon Extracellular Cysteine Limitation. Cell Metab.30, 865–876 e865 (2019). [DOI] [PMC free article] [PubMed] [Google Scholar]
- 17.Liu, N., Lin, X. & Huang, C. Activation of the reverse transsulfuration pathway through NRF2/CBS confers erastin-induced ferroptosis resistance. Br. J. Cancer122, 279–292 (2020). [DOI] [PMC free article] [PubMed] [Google Scholar]
- 18.Ge, Y., Konrad, M. A., Matherly, L. H. & Taub, J. W. Transcriptional regulation of the human cystathionine beta-synthase -1b basal promoter: synergistic transactivation by transcription factors NF-Y and Sp1/Sp3. Biochem. J.357, 97–105 (2001). [DOI] [PMC free article] [PubMed] [Google Scholar]
- 19.Ghosh, S. et al. Extracellular hemin crisis triggers acute chest syndrome in sickle mice. J. Clin. Invest123, 4809–4820 (2013). [DOI] [PMC free article] [PubMed] [Google Scholar]
- 20.Gbotosho, O. T., Kapetanaki, M. G. & Kato, G. J. The Worst Things in Life are Free: The Role of Free Heme in Sickle Cell Disease. Front. Immunol.11, 561917 (2020). [DOI] [PMC free article] [PubMed] [Google Scholar]
- 21.Belcher, J. D. et al. Haptoglobin and hemopexin inhibit vaso-occlusion and inflammation in murine sickle cell disease: Role of heme oxygenase-1 induction. PLoS One13, e0196455 (2018). [DOI] [PMC free article] [PubMed] [Google Scholar]
- 22.Merle, N. S. et al. Intravascular hemolysis activates complement via cell-free heme and heme-loaded microvesicles. JCI Insight3, 10.1172/jci.insight.96910 (2018). [DOI] [PMC free article] [PubMed]
- 23.Belcher, J. D. et al. Control of Oxidative Stress and Inflammation in Sickle Cell Disease with the Nrf2 Activator Dimethyl Fumarate. Antioxid. Redox Signal26, 748–762 (2017). [DOI] [PMC free article] [PubMed] [Google Scholar]
- 24.Xi, C. et al. Nrf2 sensitizes ferroptosis through l-2-hydroxyglutarate-mediated chromatin modifications in sickle cell disease. Blood142, 382–396 (2023). [DOI] [PMC free article] [PubMed] [Google Scholar]
- 25.Krishnamoorthy, S. et al. Dimethyl fumarate increases fetal hemoglobin, provides heme detoxification, and corrects anemia in sickle cell disease. JCI Insight2, 10.1172/jci.insight.96409 (2017). [DOI] [PMC free article] [PubMed]
- 26.Ocana, M. C. et al. New insights in the targets of action of dimethyl fumarate in endothelial cells: effects on energetic metabolism and serine synthesis in vitro and in vivo. Commun. Biol.6, 1084 (2023). [DOI] [PMC free article] [PubMed] [Google Scholar]
- 27.Albrecht, P. et al. Effects of dimethyl fumarate on neuroprotection and immunomodulation. J. Neuroinflammation9, 163 (2012). [DOI] [PMC free article] [PubMed] [Google Scholar]
- 28.Schulze-Topphoff, U. et al. Dimethyl fumarate treatment induces adaptive and innate immune modulation independent of Nrf2. Proc. Natl Acad. Sci. USA113, 4777–4782 (2016). [DOI] [PMC free article] [PubMed] [Google Scholar]
- 29.Piroli, G. G. et al. Identification of Novel Protein Targets of Dimethyl Fumarate Modification in Neurons and Astrocytes Reveals Actions Independent of Nrf2 Stabilization. Mol. Cell Proteom.18, 504–519 (2019). [DOI] [PMC free article] [PubMed] [Google Scholar]
- 30.Carlstrom, K. E. et al. Therapeutic efficacy of dimethyl fumarate in relapsing-remitting multiple sclerosis associates with ROS pathway in monocytes. Nat. Commun.10, 3081 (2019). [DOI] [PMC free article] [PubMed] [Google Scholar]
- 31.Zhu, X., Li, B. & Pace, B. S. NRF2 mediates gamma-globin gene regulation and fetal hemoglobin induction in human erythroid progenitors. Haematologica102, e285–e288 (2017). [DOI] [PMC free article] [PubMed] [Google Scholar]
- 32.Kato, G. J., Steinberg, M. H. & Gladwin, M. T. Intravascular hemolysis and the pathophysiology of sickle cell disease. J. Clin. Invest127, 750–760 (2017). [DOI] [PMC free article] [PubMed] [Google Scholar]
- 33.Grek, C. L., Newton, D. A., Spyropoulos, D. D. & Baatz, J. E. Hypoxia up-regulates expression of hemoglobin in alveolar epithelial cells. Am. J. Respir. Cell Mol. Biol.44, 439–447 (2011). [DOI] [PMC free article] [PubMed] [Google Scholar]
- 34.Feng, R. et al. Activation of gamma-globin expression by hypoxia-inducible factor 1alpha. Nature610, 783–790 (2022). [DOI] [PMC free article] [PubMed] [Google Scholar]
- 35.Xiang, J., Wu, D. C., Chen, Y. & Paulson, R. F. In vitro culture of stress erythroid progenitors identifies distinct progenitor populations and analogous human progenitors. Blood125, 1803–1812 (2015). [DOI] [PMC free article] [PubMed] [Google Scholar]
- 36.Zhou, Y. et al. Amino acid signature during sickle cell pain crisis shows significant alterations related to nitric oxide and energy metabolism. Mol. Genet Metab.137, 146–152 (2022). [DOI] [PubMed] [Google Scholar]
- 37.Ma, Q. Role of nrf2 in oxidative stress and toxicity. Annu. Rev. Pharm. Toxicol.53, 401–426 (2013). [DOI] [PMC free article] [PubMed] [Google Scholar]
- 38.Mathelier, A. et al. JASPAR 2016: a major expansion and update of the open-access database of transcription factor binding profiles. Nucleic Acids Res.44, D110–D115 (2016). [DOI] [PMC free article] [PubMed] [Google Scholar]
- 39.Wang, C. et al. CBS promoter hypermethylation increases the risk of hypertension and stroke. Clinics74, e630 (2019). [DOI] [PMC free article] [PubMed] [Google Scholar]
- 40.Cheng, Q. Y. et al. Sensitive Determination of Onco-metabolites of D- and L-2-hydroxyglutarate Enantiomers by Chiral Derivatization Combined with Liquid Chromatography/Mass Spectrometry Analysis. Sci. Rep.5, 15217 (2015). [DOI] [PMC free article] [PubMed] [Google Scholar]
- 41.Zheng, H., Jiang, L., Tsuduki, T., Conrad, M. & Toyokuni, S. Embryonal erythropoiesis and aging exploit ferroptosis. Redox Biol.48, 102175 (2021). [DOI] [PMC free article] [PubMed] [Google Scholar]
- 42.Brune, B. & Ullrich, V. Inhibition of platelet aggregation by carbon monoxide is mediated by activation of guanylate cyclase. Mol. Pharm.32, 497–504 (1987). [PubMed] [Google Scholar]
- 43.Duckers, H. J. et al. Heme oxygenase-1 protects against vascular constriction and proliferation. Nat. Med.7, 693–698 (2001). [DOI] [PubMed] [Google Scholar]
- 44.Otterbein, L. E., Foresti, R. & Motterlini, R. Heme Oxygenase-1 and Carbon Monoxide in the Heart: The Balancing Act Between Danger Signaling and Pro-Survival. Circ. Res.118, 1940–1959 (2016). [DOI] [PMC free article] [PubMed] [Google Scholar]
- 45.Belcher, J. D. et al. Heme oxygenase-1 is a modulator of inflammation and vaso-occlusion in transgenic sickle mice. J. Clin. Invest116, 808–816 (2006). [DOI] [PMC free article] [PubMed] [Google Scholar]
- 46.Menon, A. V. et al. Excess heme upregulates heme oxygenase 1 and promotes cardiac ferroptosis in mice with sickle cell disease. Blood10.1182/blood.2020008455 (2021). [DOI] [PMC free article] [PubMed] [Google Scholar]
- 47.Zhao, J. et al. Human hematopoietic stem cell vulnerability to ferroptosis. Cell186, 732–747 e716 (2023). [DOI] [PMC free article] [PubMed] [Google Scholar]
- 48.Canli, O. et al. Glutathione peroxidase 4 prevents necroptosis in mouse erythroid precursors. Blood127, 139–148 (2016). [DOI] [PMC free article] [PubMed] [Google Scholar]
- 49.Nishizawa, H., Yamanaka, M. & Igarashi, K. Ferroptosis: regulation by competition between NRF2 and BACH1 and propagation of the death signal. FEBS J.290, 1688–1704 (2023). [DOI] [PubMed] [Google Scholar]
- 50.Jagadeeswaran, R. et al. Pharmacological inhibition of LSD1 and mTOR reduces mitochondrial retention and associated ROS levels in the red blood cells of sickle cell disease. Exp. Hematol.50, 46–52 (2017). [DOI] [PMC free article] [PubMed] [Google Scholar]
- 51.Gallivan, A. et al. Reticulocyte mitochondrial retention increases reactive oxygen species and oxygen consumption in mouse models of sickle cell disease and phlebotomy-induced anemia. Exp. Hematol.122, 55–62 (2023). [DOI] [PubMed] [Google Scholar]
- 52.Wang, T. X. et al. The oncometabolite 2-hydroxyglutarate produced by mutant IDH1 sensitizes cells to ferroptosis. Cell Death Dis.10, 755 (2019). [DOI] [PMC free article] [PubMed] [Google Scholar]
- 53.Qi, D. et al. Dimethyl fumarate protects against hepatic ischemia-reperfusion injury by alleviating ferroptosis via the NRF2/SLC7A11/HO-1 axis. Cell Cycle22, 818–828 (2023). [DOI] [PMC free article] [PubMed] [Google Scholar]
- 54.Yang, Y. et al. Dimethyl fumarate prevents ferroptosis to attenuate acute kidney injury by acting on NRF2. Clin. Transl. Med11, e382 (2021). [DOI] [PMC free article] [PubMed] [Google Scholar]
- 55.Zheng, L. et al. Fumarate induces redox-dependent senescence by modifying glutathione metabolism. Nat. Commun.6, 6001 (2015). [DOI] [PMC free article] [PubMed] [Google Scholar]
- 56.Schmitt, A. et al. Dimethyl fumarate induces ferroptosis and impairs NF-kappaB/STAT3 signaling in DLBCL. Blood138, 871–884 (2021). [DOI] [PubMed] [Google Scholar]
- 57.Singhal, R. et al. HIF-2alpha activation potentiates oxidative cell death in colorectal cancers by increasing cellular iron. J. Clin. Invest.131, 10.1172/JCI143691 (2021). [DOI] [PMC free article] [PubMed]
- 58.Mantione, M. E. et al. Disrupting pro-survival and inflammatory pathways with dimethyl fumarate sensitizes chronic lymphocytic leukemia to cell death. Cell Death Dis.15, 224 (2024). [DOI] [PMC free article] [PubMed] [Google Scholar]
- 59.Al-Salem, A. H. Splenic complications of sickle cell anemia and the role of splenectomy. ISRN Hematol.2011, 864257 (2011). [DOI] [PMC free article] [PubMed] [Google Scholar]
- 60.Meier, E. R. & Rampersad, A. Pediatric sickle cell disease: past successes and future challenges. Pediatr. Res81, 249–258 (2017). [DOI] [PubMed] [Google Scholar]
- 61.Ebert, E. C., Nagar, M. & Hagspiel, K. D. Gastrointestinal and hepatic complications of sickle cell disease. Clin. Gastroenterol. Hepatol.8, 483–489 (2010). [DOI] [PubMed] [Google Scholar]
- 62.Noronha, S. A. Cardiac causes of hypoxia in sickle cell disease. Prog. Pediatr. Cardiol.56, 101192 (2020). [Google Scholar]
- 63.Zhu, X., Xi, C., Thomas, B. & Pace, B. S. Loss of NRF2 function exacerbates the pathophysiology of sickle cell disease in a transgenic mouse model. Blood131, 558–562 (2018). [DOI] [PMC free article] [PubMed] [Google Scholar]
- 64.Zhu, X. et al. NRF2 mediates gamma-globin gene regulation through epigenetic modifications in a beta-YAC transgenic mouse model. Exp. Biol. Med.245, 1308–1318 (2020). [DOI] [PMC free article] [PubMed] [Google Scholar]
- 65.Ryan, T. M., Ciavatta, D. J. & Townes, T. M. Knockout-transgenic mouse model of sickle cell disease. Science278, 873–876 (1997). [DOI] [PubMed] [Google Scholar]
Associated Data
This section collects any data citations, data availability statements, or supplementary materials included in this article.
Supplementary Materials
Description of Additional Supplementary Materials
Data Availability Statement
All data generated or analyzed during this study are included in the article and Supplementary files, or available from the corresponding author on reasonable request. The source data file underlying all graphs can be found in Supplementary Data. Metabolomics data are provided in the Supplementary Tables 3, 4. Uncropped images of every blot in the manuscript are shown in Supplementary Figs.. Source data are provided with the paper. The plasmids generated in the work have been deposited to Addgene. All uncropped pictures are shown in Supp. Figs. 11 and shared through Figshare 10.6084/m9.figshare.27822531.v1.