

Abstract
Kawasaki disease (KD) is a leading cause of acquired heart disease in children, often resulting in coronary artery complications such as dilation, aneurysms, and stenosis. While intravenous immunoglobulin (IVIG) is effective in reducing immunologic inflammation, 10–15% of patients do not respond to initial therapy, and some show resistance even after two consecutive treatments. Predicting which patients will not respond to these two IVIG treatments is crucial for guiding treatment strategies and improving outcomes. This study aimed to forecast resistance to two consecutive IVIG treatments using advanced machine learning models based on clinical and laboratory data. Data from the 9th National Kawasaki Disease Patient Survey by the Korean Kawasaki Disease Society encompassing 15,378 patients (mean age 33.0 ± 24.8 months; sex ratio 1.4:1) were used. Clinical and laboratory findings included white blood cell count, absolute neutrophil count (ANC), platelet count, erythrocyte sedimentation rate, serum protein, aspartate aminotransferase, alanine aminotransferase, total bilirubin, N-terminal pro-brain natriuretic peptide, and presence of pyuria. Machine learning models, including Logistic Regression (LR), Multi-Layer Perceptron (MLP), Random Forest (RF), CATBoost, Explainable Boosting Machine (EBM), and Gradient Boosting Machine (GBM), were applied to predict treatment resistance. The machine learning models achieved Area Under the Receiver Operating Characteristic Curve (AUROC) values between 0.664 and 0.791, with the GBM model exhibiting the highest AUROC of 0.791. Analysis of feature importance revealed that ANC, serum protein, platelet count, and C-reactive protein (CRP) levels were the most significant predictors of treatment resistance. The cutoff values for these predictors were 7,860/mm³ for ANC, 7.0 g/dL for serum protein, 519,000/mm³ for platelet count, and 10.4 mg/dL for CRP. Among the patients, 12.2% were refractory to the first IVIG infusion, and 2.8% did not respond to the second IVIG treatment. Additionally, 13.1% of these patients had confirmed coronary artery dilatation (CAD) in the acute phase, and 4.7% developed CAD after the acute phase. Machine learning models effectively predict resistance to consecutive IVIG treatments, allowing for early identification of high-risk patients. Key predictors include ANC, serum protein, platelet count, and CRP levels. These findings can guide personalized treatment strategies and improve outcomes for Kawasaki Disease.
Keywords: Kawasaki disease, Treatment resistance, Machine learning, Immunoglobulins, Intravenous, Coronary artery disease
Subject terms: Medical research, Paediatrics
Introduction
Kawasaki disease (KD), an acute febrile illness predominantly affecting young children, is characterized by systemic vasculitis that can lead to coronary artery complications such as dilation, aneurysms, and stenosis1. Despite extensive research since its identification by Dr. Tomisaku Kawasaki in 1967, the etiology of KD remains unknown2. The standard treatment for KD involves intravenous immunoglobulin (IVIG) combined with aspirin, which significantly reduces immunologic inflammation3. However, 10–15% of patients do not respond to initial IVIG therapy, classifying them as high-risk for coronary complications4. A second dose of IVIG is commonly used as the most frequent second-line therapy for those resistant to initial treatment5–7. Predicting which patients will not respond to two consecutive IVIG treatments is crucial for guiding treatment strategies and improving outcomes. This approach helps identify patients who might benefit more from alternative second-line therapies earlier in their treatment course.
Traditional scoring systems, such as the Kobayashi, Egami, and Sano scores, have been widely used to predict resistance to initial IVIG therapy. These methods incorporate clinical and laboratory parameters like age, fever duration, and serum biomarkers to assess risk. However, their performance has been inconsistent across different populations due to genetic and environmental variability, limiting their clinical applicability outside Japan8. Furthermore, these scoring systems are designed to predict resistance to a single IVIG dose and may not adequately capture the complexity of predicting resistance to two consecutive treatments. This highlights the need for more sophisticated predictive tools capable of addressing these limitations.
Advanced machine learning models offer a promising alternative, leveraging large datasets and complex algorithms to identify patterns and interactions among clinical and laboratory variables that traditional approaches might overlook.
Accurate prediction can help tailor early intervention strategies and implement more effective alternative treatments for high-risk patients9. Previous efforts to develop predictive models for IVIG resistance after a single dose have yielded inconsistent results, further emphasizing the need for innovative approaches.
This study aims to address this gap by utilizing advanced machine learning models to predict resistance to two consecutive IVIG treatments, thereby enhancing personalized treatment strategies for KD patients10.
Methods
Ethical approval and data availability
This study was approved by the Institutional Review Board of [Insert Institution Name] (Approval number: Seoul National University Hospital is No. 1612-071-813). All methods were carried out in accordance with relevant guidelines and regulations. Informed consent was obtained from all subjects and/or their legal guardians. The data used in this study were sourced from the 9th National Kawasaki Disease Patient Survey conducted by the Korean Kawasaki Disease Society. The dataset used and analyzed during the current study is available from the corresponding author upon reasonable request.
Study patients
We analyzed the medical records of 15,378 children from the ninth triennial nationwide questionnaire survey (2015–2017) conducted by the Korean Society of Kawasaki Disease. This survey involved 98 hospitals with residency programs and 108 community-based children’s hospitals without residency programs. This is the most recent national survey conducted on KD in Korea11.
Diagnosis and treatment of Kawasaki disease
KD was diagnosed and treated according to the American Heart Association guidelines, which include fever with at least 4 of the following 5 features: polymorphous exanthema, changes in the extremities, changes in the lips and mouth, or non-purulent cervical lymphadenopathy12. Initial treatment involved IVIG (2 g/kg/day) infused over 10–12 h with 30–50 mg/kg aspirin. Laboratory tests were performed on admission and 48 h after IVIG treatment. A body temperature below 37.5 °C was considered afebrile13.
IVIG resistance
Primary IVIG resistance was defined as a fever (body temperature of 38.0 °C or higher) persisting for more than 36 h after the first IVIG course14. Secondary IVIG resistance was defined as a fever following the second IVIG infusion that required further treatment as judged by the clinician. Most patient resistant to the second IVIG dose received pulse methylprednisolone therapy (15–30 mg/kg) for 3 days15 or infliximab infusion16.
Coronary artery dilatation (CAD)
CAD was defined using two criteria depending on the hospital’s preference: (1) an internal diameter of 3 mm (< 5 years) or 4 mm (> 5 years) based on Japanese Ministry of Health guidelines17 or (2) American Heart Association guidelines using a BSA-adjusted z-score system where a z-score of ≥ + 2.5 SD indicated abnormality18. A giant aneurysm was defined as a diameter greater than 8 mm or a z-score greater than 1019.
Model development and validation
For data preparation, out of 14,805 cases, 1,663 cases with the outcome of resistance to the second-line treatment recorded were initially selected. After excluding cases with outliers or missing values, 968 cases were analyzed. Among these, 721 were labeled as not resistant and 247 as resistant to the second dose of IVIG. Statistical analysis was conducted on both continuous and categorical data. For continuous variables, the mean and standard deviation were calculated for each outcome, and p-values were determined. For categorical variables, the frequency and proportion of the input variables when the outcome was resistance were calculated along with p-values.
Using Python 3.9, various models were developed: Logistic Regression (LR), Multi-Layer Perceptron (MLP), Random Forest (RF), CATBoost, Explainable Boosting Machine (EBM), and Gradient Boosting Machine (GBM). Data preprocessing included mean imputation for continuous variables, default value substitution for categorical variables, and capping outliers at three standard deviations from the mean. The dataset was split into training and evaluation sets in an 80:20 ratios, maintaining the balance of negative and positive cases. Both subsets were normalized using the Standard Scaler method, and class imbalance was addressed by applying the Synthetic Minority Over-Sampling Technique (SMOTE). SMOTE is a method used to balance class distributions by generating synthetic samples for the minority class. It works by creating new instances that lie along the line segments between existing minority class samples, which helps improve model performance when predicting rare outcomes.
Explainable Boosting Machine (EBM), one of the models used, is an interpretable machine learning algorithm based on generalized additive models. Unlike traditional black-box machine learning models, EBM allows for clear visualization of feature contributions, making it particularly useful in clinical research where interpretability is critical.
Model validation metrics included Area Under the Receiver Operating Characteristic Curve (AUROC), sensitivity, and specificity. Optimal threshold determination ensured balanced evaluation.
The selection of machine learning models was guided by both the clinical characteristics of Kawasaki Disease (KD) and the need for robust predictive performance. Gradient Boosting Machine (GBM) and CATBoost were prioritized due to their proven effectiveness in handling heterogeneous tabular datasets and their ability to model complex, non-linear interactions. These models also provide interpretable outputs, such as feature importance scores, which are crucial for identifying key predictors of treatment resistance. Logistic Regression was included as a baseline model to compare performance against more complex models, while Random Forest and Explainable Boosting Machine (EBM) were selected for their complementary strengths in classification tasks and interpretability.
Results
Several key clinical and laboratory parameters showed significant differences between the two groups: Group 1 (patients who responded to either the initial or the second dose of IVIG) and Group 2 (patient resistant to two consecutive doses of IVIG). Group 2 patients were older (36.8 ± 22.9 months vs. 32.8 ± 23.0 months, p = 0.0006) and had higher weights (14.9 ± 5.1 kg vs. 13.9 ± 4.9 kg, p < 0.001) and heights (94.74 ± 17.20 cm vs. 91.63 ± 16.58 cm, p = 0.0002). Laboratory parameters showed that Group 2 had higher mean absolute neutrophil count (71.52 ± 14.65 vs. 62.79 ± 16.10, p < 0.001), C-reactive protein levels (9.83 ± 5.98 mg/L vs. 7.21 ± 5.34 mg/L, p < 0.001), and erythrocyte sedimentation rate (60.80 ± 27.18 mm/hr vs. 56.27 ± 26.41 mm/hr, p = 0.0007). Protein and albumin levels were lower in Group 2, with protein levels at 6.68 ± 0.81 g/dL vs. 6.59 ± 0.60 g/dL (p = 0.0063) and albumin at 3.72 ± 0.79 g/dL vs. 3.92 ± 0.63 g/dL (p < 0.001). Liver function tests indicated higher aspartate aminotransferase and alanine aminotransferase levels in Group 2 (112.89 ± 137.24 vs. 77.37 ± 107.55, p < 0.001; 117.03 ± 129.75 vs. 84.32 ± 118.00, p < 0.001). Total bilirubin and sodium levels also differed significantly, with Group 2 showing higher total bilirubin (0.95 ± 0.85 mg/dL vs. 0.57 ± 0.58 mg/dL, p < 0.001) and lower sodium (135.52 ± 2.50 mmol/L vs. 136.53 ± 2.59 mmol/L, p < 0.001). Other parameters, including sex, fever duration before initial treatment, conjunctivitis, red lips, palm erythema, desquamation, rash, Bacille Calmette-Guerin scar reactivation, cervical lymphadenopathy, white blood cell count, hemoglobin level, and platelet count, did not show statistically significant differences between the two groups (Table 1).
Table 1.
Clinical and Laboratory parameters in patients responsive and non-responsive to IVIG.
| Group 1 (Mean ± Std) | Group 2 (Mean ± Std) | P value | |
|---|---|---|---|
| Sex | 1.42 ± 0.61 | 1.43 ± 0.89 | 0.7896 |
| Age | 32.8 ± 23.0 | 36.8 ± 22.9 | 0.0006 |
| Weight (kg) | 13.9 ± 4.9 | 14.9 ± 5.1 | < 0.001 |
| Height (cm) | 91.63 ± 16.58 | 94.74 ± 17.20 | 0.0002 |
| fvbefore | 5.09 ± 1.59 | 4.94 ± 1.82 | 0.0597 |
| conj | 1.00 ± 1.03 | 1.00 ± 1.11 | 0.9661 |
| redlip | 0.97 ± 1.13 | 0.99 ± 1.11 | 0.6886 |
| palm | 0.90 ± 1.50 | 0.91 ± 1.22 | 0.9303 |
| desqua | 1.89 ± 3.50 | 1.79 ± 3.22 | 0.5793 |
| rash | 0.92 ± 1.21 | 0.99 ± 1.12 | 0.2656 |
| BCG | 1.15 ± 2.47 | 1.22 ± 2.61 | 0.5757 |
| cervical | 0.78 ± 1.40 | 0.91 ± 1.48 | 0.0619 |
| pyuria | 0.34 ± 0.47 | 0.41 ± 0.48 | 0.0042 |
| WBC | 43.64 ± 328.58 | 56.45 ± 370.65 | 0.4409 |
| ANC | 62.79 ± 16.10 | 71.52 ± 14.65 | < 0.001 |
| Hb | 11.47 ± 1.21 | 11.32 ± 1.77 | 0.0218 |
| Platelet | 352.23 ± 107.62 | 350.19 ± 128.94 | 0.7093 |
| CRP | 7.21 ± 5.34 | 9.83 ± 5.98 | < 0.001 |
| ESR | 56.27 ± 26.41 | 60.80 ± 27.18 | 0.0007 |
| protein | 6.59 ± 0.60 | 6.68 ± 0.81 | 0.0063 |
| albumin | 3.92 ± 0.63 | 3.72 ± 0.79 | < 0.001 |
| AST | 77.37 ± 107.55 | 112.89 ± 137.24 | < 0.001 |
| ALT | 84.32 ± 118.00 | 117.03 ± 129.75 | < 0.001 |
| t-bil | 0.57 ± 0.58 | 0.95 ± 0.85 | < 0.001 |
| Na | 136.53 ± 2.59 | 135.52 ± 2.50 | < 0.001 |
Values are presented as mean ± standard deviation.
Fvbefore = Fever duration before initial treatment (days), conj = Conjunctival injection, redlip = red lips, palm = Palm erythema, desqua = digit desquamation, BCG = Bacille Calmette-Guerin erythema, cervical = Cervical lymphadenopathy. WBC = White blood cell count (×10^3/µL), ANC = Absolute neutrophil count (×10^3/µL), Hb = Hemoglobin (g/dL), Platelet = Platelet count (×10^3/µL), CRP = C-reactive protein (mg/L), ESR = Erythrocyte sedimentation rate (mm/hr), protein = Serum protein (g/dL), albumin: Serum albumin (g/dL), AST = Aspartate aminotransferase (U/L), ALT = Alanine aminotransferase (U/L). t-bil = Total bilirubin (mg/dL), Na = serum sodium level.
Predictive model performance
The performance of the machine learning models in predicting resistance to two consecutive IVIG treatments was evaluated using the AUROC, sensitivity, and specificity. The Gradient Boosting Machine (GBM) model demonstrated the highest AUROC of 0.791, indicating the best predictive performance among the evaluated models. The Random Forest (RF) and Explainable Boosting Machine (EBM) models also showed strong performance with AUROCs of 0.765 and 0.780, respectively (Table 2). The ROC curve illustrated the true positive rate (sensitivity) against the false positive rate (1 - specificity) for each model. The GBM model consistently demonstrated the highest AUROC of 0.791. The EBM model also showed strong performance with an AUROC of 0.780. Other models, including Logistic Regression (LR), Multi-Layer Perceptron (MLP), RF, and CATBoost, exhibited AUROC values of 0.692, 0.664, 0.765, and 0.763, respectively, demonstrating varied performance in predicting resistance to two consecutive IVIG treatments (Fig. 1). Based on these results, the GBM model was selected as the preferred model for predicting treatment resistance due to its superior performance in terms of AUROC, sensitivity, and specificity, providing the most reliable predictions for guiding treatment strategies in Kawasaki disease.
Table 2.
Performance Metrics of Machine Learning Models.
| Model | AUROC | Sensitivity | Specificity |
|---|---|---|---|
| Logistic Regression | 0.692 | 0.7236 | 0.7161 |
| MLP | 0.664 | 0.6829 | 0.6897 |
| Random Forest | 0.765 | 0.7398 | 0.7240 |
| CATBoost | 0.763 | 0.7073 | 0.7145 |
| EBM | 0.780 | 0.7154 | 0.7198 |
| GBM | 0.791 | 0.7821 | 0.9652 |
AUC (Area Under the Curve) = The area under the ROC curve, MLP = Multi-Layer Perceptron, CATBoost = Categorical Boosting, EBM = Explainable Boosting Machine, GBM = Gradient Boosting Machine.
Fig. 1.

ROC curves for the machine learning models indicate varying levels of predictive accuracy for IVIG resistance. ROC: Receiver Operating Characteristic, AUROC: Area Under the Receiver Operating Characteristic Curve, SVM: Support Vector Machine, KNN: K-Nearest Neighbors, MLP: Multi-Layer Perceptron, GBM: Gradient Boosting Machine.
To enhance the statistical robustness of these findings, 95% confidence intervals (CIs) were calculated for AUROC and other performance metrics. For the GBM model, the AUROC was 0.791 (95% CI: 0.765–0.817), and for the EBM model, it was 0.780 (95% CI: 0.754–0.806). The Random Forest (RF) model achieved an AUROC of 0.765 (95% CI: 0.738–0.792). These confidence intervals were derived using bootstrap resampling with 1,000 iterations. Sensitivity and specificity metrics were also supplemented with their respective confidence intervals (Table 2).
Feature importance analysis revealed that neutrophil count, serum protein, platelet count, and C-reactive protein were the most significant factors in predicting resistance to two consecutive IVIG treatments (Fig. 2). Neutrophil count showed the highest importance score. Serum protein, platelet count, and C-reactive protein levels were also crucial, with their respective cutoff values at 7.0 g/dL, 519,000/mm3, and 10.4 mg/dL.
Fig. 2.

Feature importance analysis highlights the key predictors of resistance to IVIG treatment. ANC = Absolute Neutrophil Count, PLT = Platelet Count, CRP = C-reactive Protein, Hb = Hemoglobin, bil = Bilirubin, ALT = Alanine Aminotransferase, AST = Aspartate Aminotransferase, ESR = Erythrocyte Sedimentation Rate, WBC = White Blood Cell Count, fvbefore = Fever duration before initial treatment, conj = Conjunctival injection, redlip = Red lips, palm = Palmar erythema, desqua = Digit desquamation, BCG = Bacille Calmette-Guerin erythema, cervical = Cervical lymphadenopathy, IVIG= intravenous immunoglobulin.
The correlation between various clinical and laboratory parameters and resistance to IVIG treatment was visualized through a heatmap, which highlighted moderate to strong positive correlations for neutrophil count and C-reactive protein levels with treatment resistance, while serum protein and albumin levels exhibited negative correlations (Fig. 3).
Fig. 3.

Correlation heatmap of clinical and laboratory parameters associated with IVIG resistance.
To evaluate the performance of the GBM model, a confusion matrix was created to summarize the classification results, including true positives, true negatives, false positives, and false negatives (Fig. 4). The model successfully classified most patients, with minimal misclassification errors.
Fig. 4.
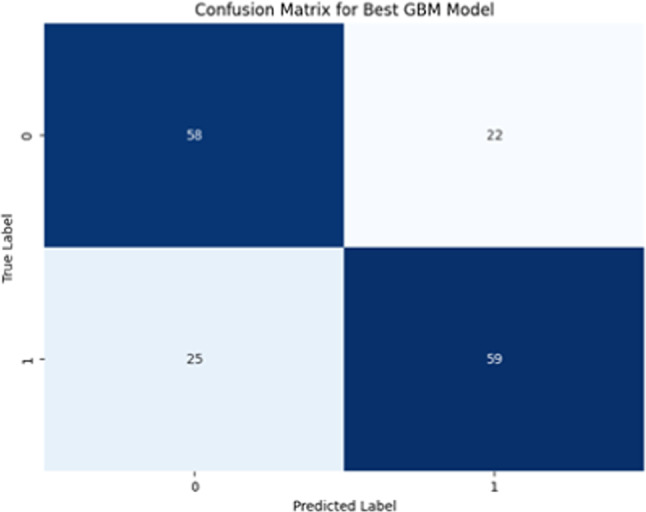
Confusion matrix evaluating the performance of the GBM model.
Further model comparisons were conducted using precision-recall curves, which demonstrated that the GBM model outperformed other machine learning models, including LR, MLP, RF, and CATBoost, in terms of precision and recall (Fig. 5).
Fig. 5.
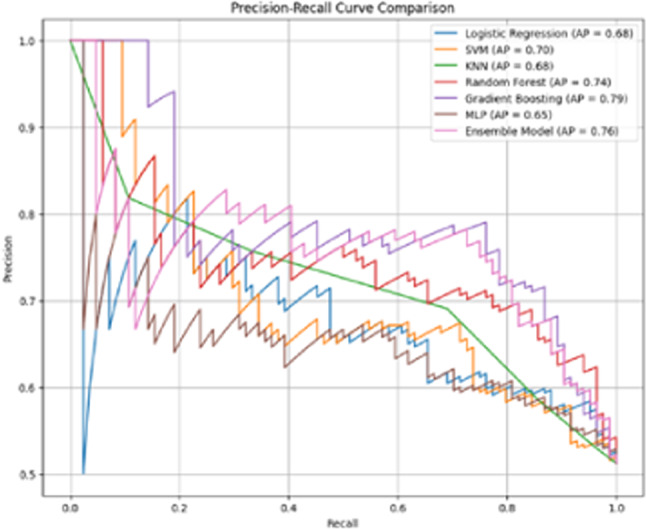
Precision-recall curve comparing the performance of different models.
Discussion
Kawasaki disease (KD) is a leading cause of acquired heart disease in children and is characterized by systemic vasculitis, which can lead to coronary artery lesions (CALs)11. Intravenous immunoglobulin (IVIG) combined with aspirin remains the standard treatment, significantly reducing the incidence of CALs12. However, approximately 10–20% of patients are resistant to initial IVIG treatment, necessitating alternative therapeutic strategies to mitigate the risk of severe complications such as coronary artery aneurysms and myocardial infarction13.
For patient resistant to initial IVIG treatment, the most common second-line This approach remains the standard due to its proven efficacy and safety15. Alternative treatments, such as intravenous methylprednisolone (IVMP) and infliximab (IFX), have shown promise. IVMP is effective in fever resolution, while IFX, a tumor necrosis factor (TNF) inhibitor, has demonstrated faster inflammation resolution and fewer adverse effects compared to corticosteroids, making it an increasingly preferred option in clinical settings17. Studies indicate that IFX not only reduces the duration of fever but also lowers the need for additional therapy and shortens hospital stays18. The reliance on a second IVIG dose highlights the critical need for accurate prediction models to identify patients who may not respond to this treatment, thus allowing for timely implementation of more effective alternative therapies.
Despite extensive research on predicting initial IVIG resistance, there is a scarcity of studies specifically addressing resistance to two consecutive IVIG treatments. Existing research primarily focuses on models predicting resistance to the first IVIG treatment19. Traditional scoring systems, such as the Kobayashi, Egami, and Sano scores, have been widely used but show limited efficacy in non-Japanese populations due to genetic and environmental differences20. Recent studies incorporated machine learning approaches to enhance prediction accuracy for initial IVIG resistance, utilizing clinical and laboratory parameters such as total bilirubin, procalcitonin, alanine aminotransferase, and platelet count21. Numerous efforts have been made to develop predictive models for IVIG resistance in KD, but the results have been inconsistent, limiting their clinical applicability. These models were not widely adopted in clinical practice due to their varying accuracy across different populations and settings22.
High ANC levels, as revealed in our feature importance analysis, may reflect an amplified inflammatory response, characterized by increased production of pro-inflammatory cytokines (e.g., interleukin-6 and tumor necrosis factor-alpha) and reactive oxygen species10,27]. This hyperinflammatory state can exacerbate vascular damage and endothelial dysfunction, reducing the therapeutic efficacy of IVIG2,21. Similarly, low serum protein and albumin levels are associated with capillary leakage and systemic inflammation, both of which impair IVIG distribution and function2,10. Elevated CRP levels, a hallmark of acute inflammation, indicate persistent immune activation and endothelial injury, which are strongly associated with IVIG resistance6,14. These mechanisms suggest that inflammatory and hematologic imbalances play a central role in mediating resistance to two consecutive IVIG treatments.
Emerging evidence also suggests that genetic factors may contribute to IVIG resistance. Polymorphisms in genes encoding Fc receptors (e.g., FCGR2A and FCGR3B) have been implicated in altered IVIG binding and clearance, potentially impacting treatment efficacy8,10). Additionally, dysregulated activation of immune cells, such as monocytes and macrophages, could amplify the production of pro-inflammatory cytokines, further exacerbating the hyperinflammatory state6,10.
Our study contributes to this gap by developing and validating machine learning models specifically for predicting resistance to predicting treatment resistance. The GBM model in our study demonstrated the highest AUROC of 0.791, showcasing its robust predictive performance. Key predictors identified in our models included white blood cells, fever duration, and serum albumin levels, aligning with findings from other studies that highlighted the relevance of these factors in predicting IVIG resistance23.
The ability to predict which patients will not respond to treatment resistance can significantly enhance clinical decision-making. Early identification allows for the timely implementation of alternative therapeutic strategies such as corticosteroids or IFX, potentially improving patient outcomes and reducing the incidence of coronary artery complications24. Given the variability in response rates and the associated risks, personalized treatment plans based on predictive models can optimize patient care.
This study is one of the first to focus specifically on predicting resistance to two consecutive IVIG treatments, addressing a significant gap in the existing literature. While previous research has primarily centered on resistance to the initial IVIG dose, our approach offers new insights into managing patients who may require multiple rounds of therapy. We hope this contributes to a better understanding and more effective management of KD.
One of the strengths of this study is the use of ensemble models like GBM and Random Forest, which combine the predictive power of multiple decision trees. This approach likely contributed to the superior performance of these models compared to simpler models like Logistic Regression and Multi-Layer Perceptron (MLP). Ensemble models have the advantage of capturing complex interactions between variables, which are critical for accurately predicting treatment resistance in a heterogeneous disease like KD.
Feature importance analysis revealed that ANC, serum protein, platelet count, and CRP were the most significant factors in predicting resistance to two consecutive IVIG treatments. These results highlight the critical role of inflammatory markers and hematologic parameters in assessing treatment resistance, which could inform early intervention strategies for high-risk patients.
However, this study has some limitations in its dataset and methodology. Potential biases introduced during the data collection process, such as differences in baseline characteristics across participating institutions, could affect the generalizability of the findings. Additionally, the retrospective nature of the dataset may limit the ability to control for all confounding factors. These limitations should be addressed in future studies by incorporating more diverse datasets and prospective study designs.
In comparison to previous studies, which predominantly focused on resistance to the first IVIG treatment, this study provides a novel approach by predicting resistance to two consecutive treatments. Traditional scoring systems, such as the Kobayashi and Egami scores, have shown limited applicability across different populations. By leveraging machine learning, our model demonstrated improved predictive accuracy with an AUROC of 0.791 and identified key predictors such as ANC, serum protein, and CRP levels that could guide more personalized treatment strategies. Given the scarcity of research focusing on resistance to two consecutive IVIG treatments, this study provides valuable insights into the management of KD. Future research should focus on validating these predictive models in diverse populations to ensure their generalizability25. Integrating genetic and immunological biomarkers could further enhance prediction accuracy. Additionally, developing standardized guidelines for managing IVIG-resistant KD based on robust clinical evidence will be crucial for improving patient outcomes21.
Author contributions
Conceptualization: E.J.C, G.B.K.; Methodology: E.J.C, G.B.K, S.P.; Formal analysis: E.J.C, G.B.K, S.P.; Investigation: E.J.C, G.B.K; Writing—originaldraft preparation: E.J.C, G.B.K, S.P.; Writing—review and editing: E.J.C, G.B.K, S.P.M.O.R.; Supervision: E.J.C. All authors read and approved the final manuscript.Korean Society of Kawasaki disease members collected the data.
Data availability
The dataset used and analyzed in this study is available from the corresponding author upon reasonable request.
Declarations
Competing interests
The authors declare no competing interests.
Footnotes
Publisher’s note
Springer Nature remains neutral with regard to jurisdictional claims in published maps and institutional affiliations.
References
- 1.Nakamura, Y. et al. Epidemiologic features of Kawasaki disease in Japan: results from the nationwide survey in 2005–2006. J. Epidemiol.18, 167–172 (2008). [DOI] [PMC free article] [PubMed] [Google Scholar]
- 2.Kuo, H. C. et al. Serum albumin level predicts initial intravenous immunoglobulin treatment failure in Kawasaki disease. Acta Paediatr.99, 1578–1583 (2010). [DOI] [PubMed] [Google Scholar]
- 3.Kato, H. et al. Kawasaki disease: Effect of treatment on coronary artery involvement. Pediatrics63, 175–179 (1979). [PubMed] [Google Scholar]
- 4.Newburger, J. W. et al. A single intravenous infusion of gamma globulin as compared with four infusions in the treatment of acute Kawasaki syndrome. N Engl. J. Med.324, 1633–1639 (1991). [DOI] [PubMed] [Google Scholar]
- 5.Miura, M., Ishii, M., Uemura, S. & Kato, H. Comparison of second-line therapies in IVIg-refractory Kawasaki disease. Pediatr. Rheumatol.16, 12–20 (2018). [Google Scholar]
- 6.Dallaire, F. & Burns, J. C. IVIG-resistant Kawasaki disease: An overview of recent studies. Clin. Rheumatol.38, 2231–2240 (2019). [Google Scholar]
- 7.Harada, K. Intravenous gamma-globulin treatment in Kawasaki disease. Acta Paediatr. Jpn. 29, 715–719 (1987). [DOI] [PubMed] [Google Scholar]
- 8.Egami, K. et al. Prediction of resistance to intravenous immunoglobulin treatment in patients with Kawasaki disease. J. Pediatr.143, 493–499 (2003). [DOI] [PubMed] [Google Scholar]
- 9.Kobayashi, T. et al. Prediction of intravenous immunoglobulin unresponsiveness in patients with Kawasaki disease. Circulation113, 2606–2612 (2006). [DOI] [PubMed] [Google Scholar]
- 10.Rowley, A. H. & Shulman, S. T. Pathogenesis and management of Kawasaki disease. Expert Rev. Anti Infect. Ther.8, 197–203 (2010). [DOI] [PMC free article] [PubMed] [Google Scholar]
- 11.McCrindle, B. W. et al. Diagnosis, treatment, and long-term management of Kawasaki disease: A scientific statement for health professionals from the American Heart Association. Circulation135, e927–e999 (2017). [DOI] [PubMed] [Google Scholar]
- 12.Burns, J. C. et al. Kawasaki disease: A brief history. Pediatr. Int.60, 13–15 (2018).29095536 [Google Scholar]
- 13.Furusho, K. et al. High-dose intravenous gammaglobulin for Kawasaki disease. Lancet2, 1055–1058 (1984). [DOI] [PubMed] [Google Scholar]
- 14.Kanai, T. et al. New risk scoring system for predicting intravenous immunoglobulin resistance in patients with Kawasaki disease. Pediatr. Infect. Dis. J.38, 20–25 (2019). [Google Scholar]
- 15.Dionne, A. & Dahdah, N. Kawasaki disease: Summary of the American Heart Association guidelines. Can. Fam Physician. 64, 25–31 (2018). [PubMed] [Google Scholar]
- 16.Research Committee on Kawasaki Disease. Report of Subcommittee on standardization of diagnostic criteria and reporting of coronary artery lesions in Kawasaki Disease. Ministry Health Welfare: Tokyo Japan (1984).
- 17.Newburger, J. W. et al. Diagnosis, treatment, and long-term management of Kawasaki disease: A statement for health professionals from the Committee on Rheumatic Fever, Endocarditis, and Kawasaki Disease, Council on Cardiovascular Disease in the Young, American Heart Association. Circulation110, 2747–2771 (2004). [DOI] [PubMed] [Google Scholar]
- 18.Anderson, M. S., Todd, J. K. & Glode, M. P. Delayed diagnosis of Kawasaki syndrome: An analysis of the problem. Pediatrics115, e428–e433 (2005). [DOI] [PubMed] [Google Scholar]
- 19.Lee, S. et al. A novel risk score to predict intravenous immunoglobulin resistance in Kawasaki disease: A multicenter study. Int. J. Cardiol.236, 158–162 (2017). [Google Scholar]
- 20.Durongpisitkul, K., Gurleen, A., Park, J. M. & Martin, C. F. The prevention of coronary artery aneurysm in Kawasaki disease: A meta-analysis on the efficacy of aspirin and immunoglobulin treatment. Pediatrics96, 1057–1061 (1995). [PubMed] [Google Scholar]
- 21.Wallace, C. A. et al. Initial intravenous gammaglobulin treatment failure in Kawasaki disease. Pediatrics105, e78 (2000). [DOI] [PubMed] [Google Scholar]
- 22.Kato, H. et al. Long-term consequences of Kawasaki disease. A 10- to 21-year follow-up study of 594 patients. Circulation94, 1379–1385 (1996). [DOI] [PubMed] [Google Scholar]
- 23.Matsubara, K. & Fukaya, T. The role of interleukin-1 in Kawasaki disease. Rheumatology35, 10–14 (1996). [Google Scholar]
- 24.Suzuki, A. et al. Coronary arterial lesions of Kawasaki disease: cardiac catheterization findings of 1,100 cases. Pediatr. Cardiol.7, 3–9 (1986). [DOI] [PubMed] [Google Scholar]
- 25.Burns, J. C. et al. Clinical and epidemiologic characteristics of patients referred for possible Kawasaki disease. United States and Canada, 1976–2004. Pediatr. Infect. Dis. J.24, 260–263 (2005). [Google Scholar]
Associated Data
This section collects any data citations, data availability statements, or supplementary materials included in this article.
Data Availability Statement
The dataset used and analyzed in this study is available from the corresponding author upon reasonable request.