

Abstract
Fanconi anemia (FA) is a rare genetic disease characterized by high phenotypic and genotypic heterogeneity, and extreme chromosome fragility. To better understand the natural history of FA, identify genetic risk and prognostic factors, and develop novel therapeutic strategies, the Spanish Registry of Patients with FA collects data on clinical features, chromosome fragility, genetic subtypes, and DNA sequencing with informed consent of participating individuals. In this article, we describe the clinical evolution of 227 patients followed up for up to 30 years, for whom our data indicate a cumulative cancer incidence of 86% by age 50. We found that patients with lower chromosome fragility had a milder malformation spectrum and better outcomes in terms of later‐onset hematologic impairment, less severe bone marrow failure, and lower cancer risk. We also found that outcomes were better for patients with mutations leading to mutant FANCA protein expression (genetic hypomorphism) than for patients lacking this protein. Likewise, prognosis was consistently better for patients with biallelic mutations in FANCD2 (mainly hypomorphic mutations) than for patients with biallelic mutations in FANCA and FANCG, with the lack of the mutant protein in patients with biallelic mutations in FANCG contributing to their poorer outcomes. Our results regarding the clinical impact of chromosome fragility and genetic hypomorphism suggest that mutant FA proteins retain residual activity. This finding should encourage the development of novel therapeutic strategies aimed at partially or fully enhancing mutant FA function, thereby preventing or delaying bone marrow failure and cancer in patients with FA.
Clinical Trial Registration number: NCT06490510.
1. INTRODUCTION
Fanconi anemia (FA) is a rare genetic disease and it is considered to be one of the most common gene‐related causes of aplastic anemia and leukemia. Prevalence is 1–9/1 000 000 persons and expected prevalence at birth is >1/160 000. 1 FA carrier frequency has been estimated as 1:181 and 1:93 in the United States and Israel, respectively. 2
Up‐to‐date, 23 genes 3 , 4 involved in the FA/BRCA DNA repair pathway have been identified as causative factors for FA; all, except for FANCB (X‐linked) 5 and RAD51 (FANCR) (autosomal dominant inheritance), 6 , 7 associated with autosomal recessive inheritance. Phenotypic variation is high in patients with FA, even in those with the same mutation and the same involved gene. The characteristic features of patients with FA include congenital malformations, bone marrow failure (BMF), and an increased risk of cancer, 8 particularly leukemia and solid tumors. Common treatments are surgery for some congenital malformations and solid tumors, and allogenic hematopoietic stem cell transplantation (aHSCT) for BMF and leukemia. 9 New promising treatments are expected to improve survival and quality of life for patients with FA in the near future. 10 , 11
The cells of patients with FA exhibit spontaneous chromosome fragility, 12 , 13 which increases after treatment with crosslinking agents. 14 , 15 For this reason, FA is most commonly diagnosed by identifying chromosome or chromatid breaks after diepoxybutane (DEB) treatment of in vitro cultured peripheral‐blood T cells. 16 , 17 , 18 In patients with somatic mosaicism, chromosome fragility in peripheral blood can decrease over time. 19 When bone marrow mosaicism is high, therefore, it is necessary to test the fibroblasts for chromosome fragility to confirm the diagnosis, especially when mutational analysis is not available or is inconclusive. Mutational analysis is increasingly used, as it reveals not only the gene that causes the disease, but also the specific mutation, thereby facilitating genetic counseling, carrier detection, prenatal and preimplantation diagnosis, and the application of advanced gene therapies. 20
Since the severity and clinical evolution of FA may differ depending on the mutated gene and even the mutation type, 21 it is important to analyze the relationship between the phenotype and genotype of patients with FA. This study of 227 patients in the Spanish Registry of Patients with FA, using data collected over approximately 30 years, aims to throw light on epidemiological aspects related to FA in Spain and to evaluate the clinical impact of chromosome fragility and mutation type.
2. METHODS
2.1. Registry
The Spanish Registry of Patients with FA, initially created by the Centro de Investigaciones Energéticas Medioambientales y Tecnológicas (CIEMAT) and currently hosted at the Centro de Investigación Biomédica en Red de Enfermedades Raras (CIBERER) under the GENRARE Project framework, includes biological and clinical data on Spanish patients with FA dating back to 1998. All patients in the registry are diagnosed with FA based on clinical findings and the results of DEB chromosome fragility tests of T cells or of gene complementation studies.
Patients or legal guardians give signed consent for registry inclusion, and all relevant ethical regulations are followed. This study was approved by the Ethics Committee of Hospital de Sant Pau, Barcelona (IIBSP‐PFA‐2024‐47).
For the registry, the onset of hematologic impairment is determined according to criteria established by the International Fanconi Anemia Registry (IFAR), namely, at least one of the following: absolute neutrophil count <1 × 10³/μL, hemoglobin <100 g/L, platelets <100 × 103/μL 22 ; or a diagnosis of myelodysplastic syndrome (MDS) or acute myeloid leukemia.
2.2. Population
The results of this study are based on clinical, genetic, and chromosome fragility data collected, from 1998 to January 2021, from 227 patients (living and deceased) included in the Spanish Registry of Patients with FA. Also included in the chromosome fragility analyses were 34 FA mutation carriers (mostly siblings of patients with FA) and 406 control individuals.
2.3. Affected gene
Gene complementation studies with retroviral vectors or whole exome sequencing were performed to identify the affected gene. Phenotypic hypersensitivity to mitomycin C was corrected after retroviral infection with FA genes in blood T cells or fibroblasts, as previously described. 23 , 24 Whole exome sequencing was performed as previously described. 20
2.4. Definition of mosaicism
According to the criteria used in Ramírez et al. 19 in 2021, for the purposes of this study, patients with mosaicism were defined as having fewer than 50% of T cells with chromosome aberrations following DEB treatment.
2.5. DEB T cell chromosome fragility testing
The FA diagnosis was confirmed via a chromosome fragility test of peripheral‐blood T cells, performed as described previously. 19 , 25 , 26 , 27 Briefly, after stimulation with phytohemagglutinin, blood cultures were treated with and without DEB (0.1 μg/mL), and metaphase spreads were then obtained and stained with Giemsa (25–50 metaphases with 46 chromosomes per patient and condition). The metaphases were studied using a Leitz Aristoplan microscope or Zeiss Imager M1 microscope coupled to a computer‐assisted metaphase finder (Metasystems, Werfen SAU, Barcelona, Spain).
For the purposes of this study, chromosome fragility was expressed as the percentage of aberrant cells (% aberrant cells) or as the number of aberrations per aberrant cell (aberrations/aberrant cell), both expressions of chromosome fragility correlated with each other. The % aberrant cells measure was used to compare chromosome fragility between patients with FA compared to controls and to carriers, and between patients with biallelic mutations in the FANCD2 gene and patients with biallelic mutations in the FANCA or FANCG genes. In all our other studies, chromosome fragility was expressed as aberrations/aberrant cell.
To study the effect of chromosome fragility on BMF and solid tumor development, patients with FA were classified according to their chromosome fragility after DEB treatment. The distribution median (4.07 aberrations/aberrant cell) was used as the cut‐off point to obtain two groups (Figure S1): patients with low chromosome fragility (≤4.07 aberrations/aberrant cell), and patients with high chromosome fragility (>4.07 aberrations/aberrant cell).
2.6. FANCA protein absence or presence
In our cohort, 135 patients with confirmed mutations in FANCA were classified in two groups by predicted protein expression according to mutation type, that is, as patients with a total absence of protein and as patients with some mutant protein expression. Mutations that probably led to total protein absence were nonsense mutations (e.g., c.295 C>T/p.Gln99Ter), indel frameshift mutations that produce premature stop codons, or large deletions (one or more exons), whereas mutations that probably led to mutant protein expression were missense mutations and in‐frame deletions (c.3788_3790delTCT/p.Phe1263del).
2.7. Cell lines
Western blot (WB) was used to analyze FANCA protein absence or presence in 16 fibroblast or lymphoblastoid cell lines from patients with biallelic mutations in FANCA. A cell line was analyzed by WB when (i) both mutations were identifiable, (ii) the cell line was not genetically reverted, and (iii) the cell line showed proper growth. Two additional cell lines from two donors without FA were used as controls for wild‐type FANCA expression. Our studies were further enriched by the 10 additional cell lines analyzed by Castellà et al. 28 in 2011.
2.8. Western blot
WB was performed as previously described. 10 , 29 Briefly, whole‐cell protein extracts were prepared using the RIPA buffer, immunodetection was performed using an anti‐human FANCA primary antibody (Rb‐anti‐FANCA Bethyl‐A301‐980A, 1:1000), and anti‐vinculin (Rb‐anti‐vinculin abcam‐ab129002; 1:5000) was used as an internal loading control.
2.9. Statistics
Three‐way comparisons were performed using the non‐parametric Kruskal–Wallis test (ANOVA), and two‐way comparisons were performed using Dunn's multiple comparison test after non‐parametric ANOVA or the Mann–Whitney non‐parametric test to compare two independent samples. Percentage distributions were statistically compared using the chi‐square test. Survival was determined using the Kaplan–Meier method and survival curves were compared using the log‐rank (Mantel–Cox) test. Survival and cumulative incidences were calculated with censoring at the last follow‐up. Fit with a Gaussian distribution was evaluated using the Kolmogorov–Smirnov test, and non‐parametric tests were used when the distribution was not Gaussian. Statistical analyses were performed using GraphPad Prism and SPSS software. Multivariate Cox regression was performed using SPSS to analyze the effects of clinical data, chromosome fragility, and mutations on patient survival. In all analyses, statistical significance was established as p < .05. Multiple testing correction was applied when necessary.
3. RESULTS
3.1. Spanish FA population
To determine FA prevalence in Spain, we analyzed the number of patients with FA born over a 10‐year timespan (2006–2015). In that decade, 4.7 million people were born, 30 of whom 47 had FA according to the Spanish Registry of Patients with FA. Consequently, assuming Hardy–Weinberg equilibrium and the inclusion of all newborns with FA in the registry, estimated prevalence in Spain is 1/100000 live births and estimated carrier frequency is 1:167.
Of the 227 patients included in the registry (1998–January 2021), 116 were women and 111 were men (51% and 49%, respectively). At the time of our analysis, 60 of the 130 surviving patients were children and 70 were adults (46% and 54%, respectively). According to IFAR criteria, 183 of the 227 patients had hematologic disease (82%), 91 (40%) required aHSCT, 30 (13%) had solid tumors, and 38 (17%) had leukemia or MDS (Figure 1A).
FIGURE 1.
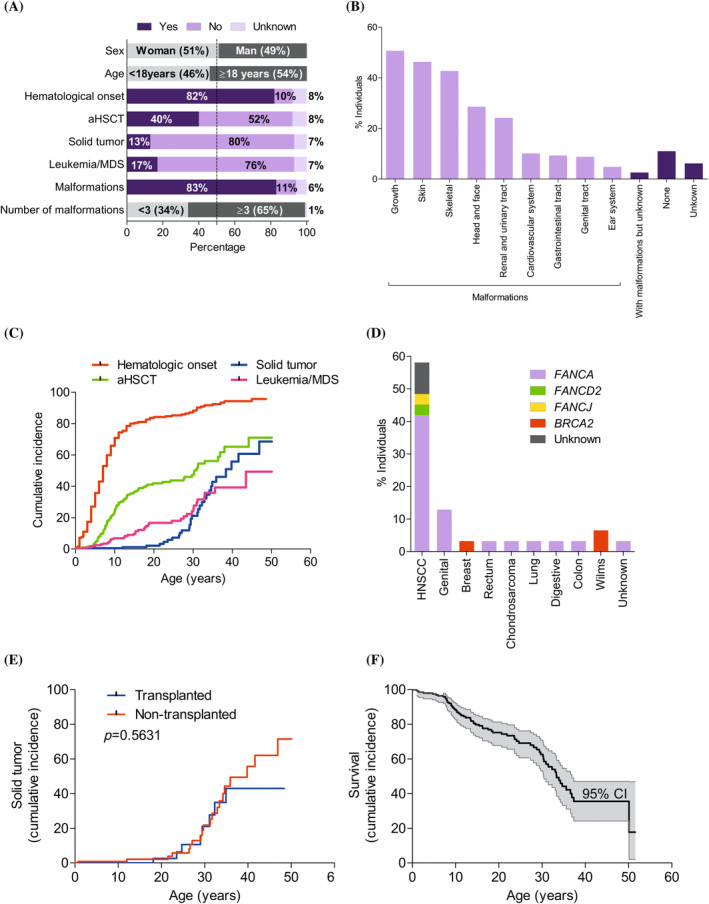
Description and clinical evolution of 227 (living and deceased) Spanish patients with Fanconi anemia (FA). (A) Patients with FA distributed according to sex and age (gray), by hematologic impairment onset, allogenic hematopoietic stem cell transplantation (aHSCT), solid tumor, leukemia or myelodysplastic syndrome (MDS), and malformations (yes: Dark purple; no: Light purple; no clinical data: Pale purple), and by malformations classified as <3 or ≥3 (gray). The vertical dashed line denotes 50% of the population. (B) Patients with each type of malformation, sorted from most to least frequent. (C) Cumulative incidence for hematologic impairment onset (red), aHSCT (green), leukemia and MDS (pink), and solid tumor (blue). (D) Patients with each type of solid tumor, with the different colors indicating the percentage of individuals in each complementation group (FANCA: purple, FANCD2: green, FANCJ: yellow, BRCA2: red; and unknown: gray). Note that only the first solid tumors are shown for four individuals who developed two different solid tumors in their lifetime: Head and neck squamous cell carcinoma (HNSCC) then lung cancer; HNSCC then breast cancer; solid rectal tumor then HNSCC; and breast cancer then colon cancer. (E) No differences were observed in the cumulative incidence of solid tumors between transplanted patients (blue; n = 91) and non‐transplanted patients (red; n = 117). Of the transplanted patients, 8 developed solid tumors, and of the non‐transplanted patients, 21 developed solid tumors. (F) Survival by age is denoted by a black line and the 95% confidence interval (CI) is denoted by the shaded region. Curves were compared using the log‐rank (Mantel–Cox) test. [Color figure can be viewed at wileyonlinelibrary.com]
Of the 117 non‐transplanted patients, 15 (13%) developed leukemia or MDS. Of the 30 patients with solid tumors, 8 developed the tumor post‐transplantation and 21 did not require transplantation up to January 2021 (the transplantation status of the remaining patient is unknown). Of the 38 patients with leukemia or MDS (none of whom developed post‐transplantation leukemia or MDS), 23 required transplantation following leukemia or MDS development, and 15 did not undergo transplantation.
Most patients (189; 83%) had congenital malformations, and of these, 123 (65%) had ≥3 malformations (Figure 1A). The most frequent congenital malformations were short stature and skin and skeletal abnormalities, followed by head, face, kidney, and urinary tract alterations (Figure 1B). Skin pigmentation alterations and short stature were most frequent in patients with <3 malformations and ≥3 malformations, respectively.
3.2. Natural history of FA
Cumulative incidence rates for key clinical events in the Spanish Registry of Patients with FA are shown in Figures 1C and S2A–F.
The cumulative incidence of hematological impairment increased rapidly during childhood to reach 79% by age 13 (95% confidence interval [CI]: 76–82%), slowing down thereafter to reach 90% by age 40 (Figures 1C and S2A). The median hematologic impairment onset age was 7 years, and consequently, the cumulative incidence of aHSCT increased drastically in the first decade of life, reaching 25% by age 10 (95% CI: 16–35%) (Figures 1C and S2B), to then slow down, and around age 30 (probably due to higher rates of leukemia and MDS) this incidence increased again, reaching 71% by age 44 (95% CI: 60–80%) (Figures 1C and S2C).
While BMF mainly occurred mainly in the first decades of life, solid tumors tended to develop in later decades. The cumulative incidence of solid tumors in patients aged up to 20 years was <3% (95% CI: 0–27%); note that the upper CI of 27% is explained by two patients in our cohort with Wilms [kidney] tumors, which typically develop in early childhood (Figures 1C and S2D). However, after age 20, the cumulative incidence of solid tumors began to increase—most dramatically after age 30—to reach 69% (95% CI: 53–80%) by age 47. The risk of developing a solid tumor by 38 years of age was calculated as 50%.
The most common solid tumors were head and neck squamous cell carcinoma (HNSCC), followed by solid tumors in the genitals, and to a lesser degree, in the breast, rectum, bones, lung, digestive system, colon, and kidney. Breast and (Wilms) kidney tumors were only present in patients with two BRCA2 mutations (Figures 1D and S2E). aHSCT was observed not to increase the solid tumor risk (p = .5631; Figure 1E). Analysis of the global cancer (solid + hematologic) incidence revealed that FA was associated with a cancer risk of 50% at 33 years, increasing to 86% by 50 years (Figure S2F).
The high incidence of cancer, BMF, and post‐transplantation complications, together with the lack of effective treatment for solid tumors, accounted for the reduced life expectancy of patients with FA (Figure 1F). Most especially, the crucial impact of cancer on these patients is highlighted by the fact that only 50% are expected to survive to age 33, and only 18% to age 50 (95% CI: 2–47%) (Table S1).
3.3. Chromosome fragility as a prognostic factor for FA
In peripheral blood, chromosome fragility was spontaneously and more markedly observed in T cells after DEB treatment, both for the aberrations/aberrant cell and % aberrant cells measures (Figures 2A,B and S3A,B). High chromosome fragility was observed in patients with FA compared with both the control population and the FA gene mutation carriers (controls and carriers had the same level of chromosome fragility).
FIGURE 2.
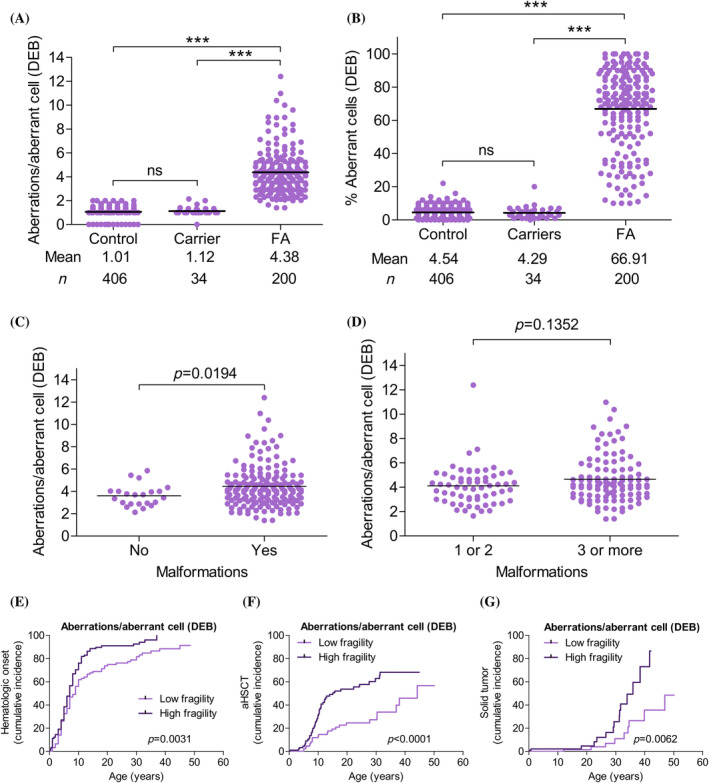
Chromosome fragility as a predictive factor in Fanconi anemia (FA) evolution. Chromosome fragility after diepoxybutane (DEB) treatment is expressed as aberrations/aberrant cell and as percentage aberrant cells. (A and B) No differences in chromosome fragility were observed between controls and monoallelic FA mutation carriers. Patients with FA had greater chromosome fragility than controls and carriers. Three‐way comparisons were performed using the Kruskal–Wallis non‐parametric test (ANOVA; p < .0001), and two‐way comparisons were performed using Dunn's non‐parametric multiple comparison test. (C and D) Patients with malformations showed greater chromosome fragility than patients without malformations (p = .0194), while no chromosome fragility differences were observed between patients with <3 and with ≥3 malformations (p = .1352). Comparisons between the groups were performed using the Mann–Whitney non‐parametric test. (E and G) Patients with FA classified, according to aberrations/aberrant cell after DEB treatment, in a low or high chromosome fragility group (≤4.07 and >4.07 aberrations/aberrant cell, respectively), where 4.07 is the median aberrations/aberrant cell distribution for the Spanish FA population (see Figure S1). (E) Cumulative incidence for hematologic impairment onset. Patients with low chromosome fragility (light purple) showed later onset (p = .0031) than patients with high chromosome fragility (dark purple). (F) Cumulative incidence for allogenic hematopoietic stem cell transplantation (aHSCT). Patients with low chromosome fragility (light purple) had less need for aHSCT (p < .0001) than patients with high chromosome fragility (dark purple). (G) Cumulative incidence of solid tumors. Patients with low chromosome fragility (light purple) had a lower risk than patients with high chromosome fragility (dark purple). Curves were compared using the log‐rank (Mantel–Cox) test (GraphPad Prism software). [Color figure can be viewed at wileyonlinelibrary.com]
In our cohort, patients with malformations had greater chromosome fragility than patients without malformations (p = .0194; Figure 2C); however, no differences were found on comparing patients with <3 malformations and with ≥3 malformations (p = .1352; Figure 2D).
In terms of the effect of chromosome fragility on BMF and solid tumor development, on comparing the low and high chromosome fragility groups (see Section 2 and Figure S1), it was observed that patients with low chromosome fragility had later‐onset hematologic impairment (p = .0031, Figure 2E), less need for aHSCT (p < .0001, Figure 2F), and a lower risk of solid tumor development (p = .0062) (Figure 2G). When only non‐mosaic patients were analyzed, the effect of chromosome fragility on the need for aHSCT and on solid tumor development was corroborated (Figure S4A–C).
3.4. FANCA protein absence as a risk factor for patients with FA
A schematic representation of FANCA protein with point mutations and indels for our patients is shown in Figure S5. We studied 238 alleles with mutational information from 138 patients harboring point mutations or indels in FANCA, the most frequent of which were as follows: c.295C > T (the most frequent mutation in Spanish Gypsies), accounting for 13.3% of FANCA mutated alleles and 10.6% of all mutated alleles in the complementation groups; and c.3788_3790delTCT (the most frequent mutation in patients with FA worldwide), accounting for 11.7% of FANCA mutated alleles and 9.4% of all mutated alleles in the complementation groups. Of the patients with FANCA mutations, 16.8% had one or two FANCA alleles with the c.3788_3790delTCT mutation, and 12.7% had one or two alleles with the c.295C>T mutation.
For the 135 patients for whom protein absence or presence could be predicted, FANCA expression according to FANCA mutation type was as follows: 64% had biallelic mutations that probably led to total protein absence, and 36% probably had some mutant protein expression. Results for a WB analysis of FANCA—performed to confirm protein absence or presence in patient‐derived cell lines (Table S2; Figure S6A,B)—showed 85% concordance with the predictions according to mutation type. Comparing the protein absence and presence groups, we observed that the patients with some mutant protein expression showed later‐onset hematologic impairment (p = .0003; Figure 3A), less need for aHSCT (p = .0292; Figure 3B), and a lower tendency to develop leukemia or MDS (p = .0901; Figure 3C). However, no effect was observed regarding the cumulative incidence of solid tumors (Figure 3D; p = .9905). Improved survival was observed in patients with some mutant protein expression (p = .0025; Figure 3E; Table S1), especially up to age 30, when the impact of hematologic impairment was high; after age 30, the survival curves of both groups converged.
FIGURE 3.
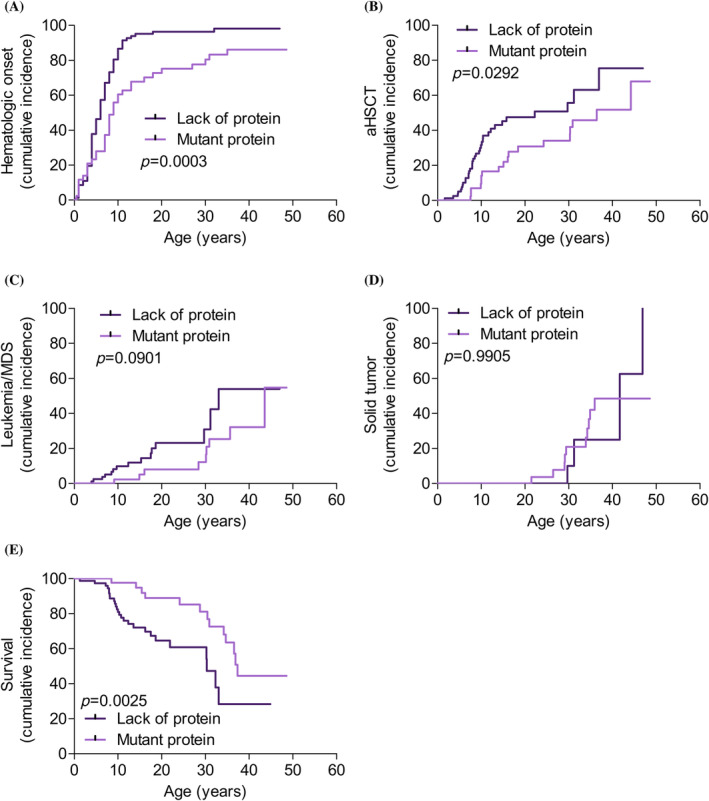
Patients with some mutant FANCA protein expression have better outcomes than patients with total protein absence. Cumulative incidence for 135 patients classified according to predicted protein expression based on FANCA mutation type: Total FANCA protein absence (dark purple), and some FANCA protein expression (light purple). (A) Hematologic impairment onset. (B) Allogenic hematopoietic stem cell transplantation (aHSCT). (C) Leukemia and myelodysplastic syndrome (MDS). (D) Solid tumor. (E) Survival. Curves for the two groups were compared using the log‐rank (Mantel–Cox) test (GraphPad Prism software). [Color figure can be viewed at wileyonlinelibrary.com]
3.5. Complementation group as a risk factor in FA evolution
Of the 217 patients with FA whose complementation group was obtained, 80% had two allele mutations in FANCA. 20 FANCD2 and FANCG were the next most frequently observed genes, at 6.5% and 5.5%, respectively, and all the other mutations were below 3% (fewer than six individuals per group). Only the most frequent gene groups were included in our complementation group analysis, namely, the FANCA, FANCD2, and FANCG groups, with 173, 14, and 12 patients, respectively.
Regarding the three groups, the FANCD2 group had lower chromosome fragility in terms of % aberrant cells after DEB treatment (52%) than either the FANCA (68%) or FANCG (75%) groups (Figure 4A). All patients in the FANCD2 and FANCG groups had malformations, compared to just 86% of those in the FANCA group (Figure S7A). The proportion of ≥3 malformations in the FANCD2 group was higher than in the FANCA (p = .0002) or FANCG (p = .0007) groups (Figure S7B).
FIGURE 4.
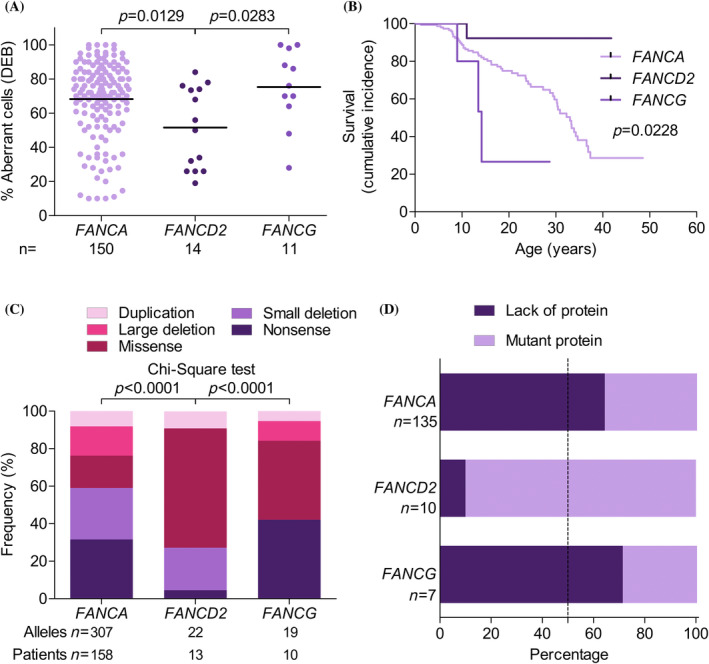
Patients with biallelic mutations in FANCD2 have better outcomes than patients with biallelic mutations in FANCA or FANCG. (A) Percentage aberrant cells after diepoxybutane (DEB) treatment in the peripheral blood of patients with FANCA (light purple), FANCD2 (dark purple), and FANCG (intermediate purple). Two‐way comparisons were performed using the Mann–Whitney non‐parametric test (GraphPad Prism software). (B) Survival curves for patients with FANCA (light purple), FANCD2 (dark purple), and FANCG (intermediate purple). Curves were compared using the log‐rank (Mantel–Cox) test (GraphPad Prism software). (C) Percentage of alleles in patients with FANCA, FANCD2, and FANCG according to mutation type: Duplication (light pink), large deletion (intermediate pink), missense mutation (dark pink), small deletion (light purple), and nonsense mutation (dark purple). Patients with mutations in FANCD2 had more alleles with missense mutations and fewer alleles with nonsense mutations compared to patients with mutations in FANCA and FANCG. Comparisons were made using the chi‐square test. (D) Percentage patients with FANCA, FANCD2, and FANCG with mutations leading to total protein absence (dark purple) or some mutant protein expression (light purple). [Color figure can be viewed at wileyonlinelibrary.com]
Regarding FA clinical evolution, patients with FANCD2 mutations had better outcomes than those with FANCA and FANCG mutations. Data were not available on solid tumors, leukemia or MDS in the patients with FANCG mutations, given that most of them had died before the typical age of development of these diseases (Figure 4B). Comparing the other two groups, fewer patients with FANCD2 mutations required aHSCT (p = .0471) (Figure S7C) or developed leukemia or MDS (p = .0107) compared to patients with FANCA mutations (Figure S7D). No significant differences were observed between those two groups in terms of the percentage of patients with solid tumors (p = .1828) (Figure S7E); however, this result should be interpreted with care as only one patient with FANCD2 mutations developed a solid tumor during the analysis period. Survival was greatest in the patients with FANCD2 mutations, at around 90% at age 40—well above the rates for the FANCA and FANCG groups (29% and 0%, respectively).
Regarding mutated alleles, most FANCD2 mutations (60%) were missense mutations (under 5% were nonsense mutations); in FANCA, nonsense mutations accounted for 32% and missense mutations for 17%; and in FANCG, nonsense mutations accounted for the highest proportion of alleles (42%) (Figure 4C). Most patients with FANCD2 mutations (90%) showed mutant protein expression (only a single patient of the 14 had two truncated proteins), compared to only 36% of FANCA patients and 29% of FANCG patients (Figure 4D).
4. DISCUSSION
This study describes the clinical impact of chromosome instability and mutational profile in 227 patients included in the Spanish Registry of Patients with FA between 1998 and January 2021. Estimated prevalence of FA is 1/100000 live births, although this figure may be higher due to undiagnosed patients not included in the registry. Carrier frequency, at approximately 1:167, is higher than in the United States (1:181) and lower than in Israel (1:93), 2 with the differences explained by the effects of founder mutations in each population.
FA incidence was similar for both sexes in our cohort, as reported elsewhere. 22 , 31 , 32 The increase in the proportion of adults in the cohort of living patients points to the fact that FA is no longer exclusively a pediatric disease. Many children with FA now reach adulthood, owing to extensive translational and clinical research leading to early diagnosis, new and improved treatments, and optimized aHSCT protocols. This has important implications for healthcare, as it highlights the importance of transitioning healthcare from pediatric to adult clinicians to ensure the best possible care for adult patients with FA.
The cumulative incidence rates we report for hematologic impairment (81%), aHSCT (40%), solid tumor development (13%), and leukemia or MDS (17%) are similar to results reported elsewhere, 22 , 31 , 32 while the congenital malformations rate of 83% for our cohort falls within the range reported in the literature. 21 , 31 , 32 , 33
Some patients with FA do not have malformations or do not develop BMF. Such occult FA cases are likely to be diagnosed in adulthood due to infertility 34 or the development of a solid tumor and severe toxicity following chemotherapy or radiotherapy. 35 This issue, extensively discussed by Alter et al., 36 points to the need to consider the possibility of FA in patients with early‐onset solid tumors independent of hematologic manifestations. Given that the classification of malformations differs between countries and registries, extensive national and international FA studies are needed that use identical malformation classification criteria. Use of Human Phenotype Ontology standardized vocabulary, for instance, could throw light on correlations between patient phenotypes, diagnoses, and clinical evolution.
The main FA threat for adults is the development of hematologic cancer or solid tumors, both of which currently face many limitations in terms of effective treatment. Life expectancy for these patients is much lower than for the general population; in our cohort, only one patient has survived beyond age 50 (53 years).
Regarding survival, we observed three stages as follows: a stable period lasting up to age 10 (88% survival); decline from ages 10 to 20 (74% survival); and further decline after age 20. The effect of aHSCT on the development of solid tumors remains controversial: some studies have reported an increase in solid tumor incidence in transplanted patients, 8 , 37 , 38 whereas this effect was not observed in our study nor in other previous studies. 22 , 31 , 32 Further studies are clearly necessary to clarify whether aHSCT, specific conditioning protocols, or the development of acute or chronic graft versus host disease are risk factors for solid tumor development.
A main characteristic of patients with FA is the high chromosome fragility of their cells, especially after treatment with DNA interstrand crosslinking agents. Apoptosis or genomic instability may develop in these patients, given that tissues with a high replication rate are likely to develop chromosome fragility. Excess apoptosis may be the main cause of malformations during embryonic development and in childhood BMF, while genomic instability may be the main driver of cancer in adulthood. As expected, chromosome breakage was clearly greater in our cohort of patients with FA compared to both controls and carriers. Consistent with an autosomal recessive pattern, no differences were found between the controls and heterozygous mutation carriers. Interestingly, since high chromosome fragility was associated with poorer outcomes in terms of malformations, early‐onset hematologic impairment, a need for aHSCT, and a high risk of solid tumor development, chromosome fragility can be considered a novel prognostic factor for patients with FA.
When the effect of FANCA gene mutation was studied, we observed that, compared to patients with mutant FANCA protein expression, patients lacking the FANCA protein had earlier hematologic impairment onset and a higher risk of developing leukemia or MDS, as previously observed for a smaller cohort. 39 Those patients also showed a greater need for aHSCT and lower survival. However, consistent with previous reports, 39 no differences in the solid tumor development risk were observed between those two groups. Consequently, mutations leading to the presence, as opposed to the absence, of a mutant FANCA protein are biomarkers of better outcomes in terms of hematologic evolution and survival and are suggestive of a hypomorphic effect. In our cohort, the most common FANCA mutations were c.295 C>T (p.Gln99Ter), which led to total protein absence, and c.3788_3790delTCT (p.Phe1263del), which led to mutant protein expression. The latter mutation has elsewhere been described as the most frequently occurring mutation, not only in Spain, but also worldwide. 28 , 40 Those observations warrant the search for new drugs that can fully or partially restore the functionality of mutant proteins and so improve the clinical prognosis of patients with FA.
Note that the smaller number of patients with two mutated alleles in FANCD2 and FANCG may affect the interpretation of our comparative findings for the three main FA groups (FANCA, FANCD2, and FANCG). We observed that patients with two mutated FANCD2 alleles had lower chromosome fragility, more malformations, less need for aHSCT, lower leukemia and MDS incidence, and better survival. In contrast, patients with FANCG mutations showed a more severe phenotype than patients with FANCA mutations, as reported elsewhere. 39 The better clinical evolution of patients in the FANCD2 complementation group is explained by the fact that 60% of the mutated alleles were missense mutations, and that 90% of the patients showed some mutant protein that may function partially within the DNA repair pathway. This finding is consistent with previous data demonstrating FANCD2 hypomorphism. 41 In a recent study, we demonstrated that a hypomorphic BRCA2 allele retaining 37–54% of normal repair function in an adult patient with FANCD1 mutations was sufficient to delay blood disease onset by some 30 years. 35 This would suggest that prognosis—compared to that for patients with total protein absence—is improved in patients with hypomorphic mutations that result in the expression of mutant FA proteins with reduced functionality. This observation opens the door to novel therapeutic strategies aimed at reactivating or rescuing the FA/BRCA pathway in patients with hypomorphic mutations.
In summary, we found the following: (a) patients with FA and with high chromosome fragility had a greater need for aHSCT and were at a greater risk of developing solid tumors; (b) patients with some mutant FA protein expression experienced better hematologic evolution and, consequently, survived for longer than patients with mutations resulting in total protein absence; (c) patients with FANCD2 mutations (primarily hypomorphic) had better outcomes than patients with FANCA or FANCG mutations; and (d) phenotypes were more severe for patients with FANCG mutations. In view of those findings, therefore, chromosome fragility, genetic subtype, and mutation type, as possible indicators of BMF and cancer risk, should be taken into account in the care of patients with FA. Finally, our results should encourage the development of novel therapeutic strategies that facilitate partial or total restoration of the FA/BRCA repair pathway, thereby preventing or delaying BMF and cancer in patients with FA.
AUTHOR CONTRIBUTIONS
María José Ramírez, Roser Pujol, Cristina Díaz‐de‐Heredia, Julián Sevilla, Juan Antonio Bueren, and Jordi Surrallés planned the study. María José Ramírez, Roser Pujol, Jordi Minguillón, Massimo Bogliolo, Ilaria Persico, Debora Cavero, Paula Río, Susana Navarro and José A. Casado performed experiments. Francisco Almazán, M. Luisa Antelo, Bienvenida Argilés, Isabel Badell, Marta Baragaño, Cristina Beléndez, Mar Bermúdez, Marta Bernués, María Isabel Buedo, Estela Carrasco, Albert Català, Dolors Costa, Isabel Cuesta, Rafael Fernandez‐Delgado, Ana Fernández‐Teijeiro, Ángela Figuera, Marta García, Ainhoa Gondra, Macarena González, Soledad González Muñiz, Ines Hernández‐Rodríguez, Fátima Ibañez, Nicholas John Kelleher, Francisco Lendínez, Mónica López, Ricardo López‐Almaraz, Inmaculada Marchante, Carmen Mendoza, José Nieto, Emilio Ojeda, Salvador Payán‐Pernía, Irene Peláez, Inmaculada Pérez de Soto, Raquel Portugal, María A Ramos‐Arroyo, Alexandra Regueiro, Ana Rodríguez, Jordi Rosell, Raquel Saez, José Sánchez, Martha Sánchez, MªLeonor Senent, María Tapia, Juan Pablo Trujillo‐Quintero, José Manuel Vagace, Jaime Verdú‐Amorós, Victória Verdugo, Isabel Vidales, Jasson Villarreal, Cristina Díaz‐de‐Heredia and Julián Sevilla provided patient's samples and clinical data. Juan Bueren and Aurora de la Cal are Managers of the Registry. Almudena Bailador, Antonio Sánchez de la Fuente, Miguel López de Heredia have contributed to the Registry. María José Ramírez analyzed the data, performed the statistical analysis and created the figures. María José Ramírez, and Jordi Surrallés wrote the manuscript and all co‐authors interpreted and discussed the data and reviewed the manuscript.
FUNDING INFORMATION
This study has been funded by Ministerio de Ciencia e Innovación through the project “The Fanconi anemia/BRCA pathway: Genomic medicine and advanced therapies” (FABRAT, PID2021‐122411OB‐I00/AEI/10.13039/501100011033/FEDER, UE); the Instituto de Salud Carlos III (ISCIII) and fondos Next Generation EU: Plan de Recuperación, trasformación y resiliencia de la UE through the project “Reposicionamiento de afatinib para HNSCC en pacientes con anemia de Fanconi” (ICI22/00076); the ICREA‐Academia program, Fundació Institut Català de Recerca i Estudis Avançats 2018; SGR‐Cat 2021 (AGAUR) through the project “Genomic medicine and rare diseases group” (2021‐SGR‐00835, 2023–2025). CIBERER is an initiative of the Instituto de Salud Carlos III, Spain.
CONFLICT OF INTEREST STATEMENT
J.S. has signed agreements in the last 3 years (advisory boards, service provision, research collaboration, or material transfer) with Boehringer Ingelheim, Glaxo Smith Kline, Moderna Therapeutics, Roche, Rocket Pharmaceuticals and Pfizer.
P.R., S.N., and J.A.B. receive funding and have licensed the PGK‐FANCA‐WPRE* lentiviral vector to Rocket Pharmaceuticals Ltd., and P.R., S.N., and J.A.B. are inventors on patents filed by CIEMAT, CIBERER, and Fundación Jiménez Díaz, and may be entitled to receive financial benefits from the licensing of such patents. J.A.B is a consultant to Rocket Pharmaceuticals.
J.A.B. receives honorariums as a consultant, holds stock options and has received funding for research on gene therapy from Rocket Pharmaceuticals. Cofounder of KiJi Therapeutics.
All the other authors declare that they have no conflict of interest.
PATIENT CONSENT STATEMENT
Informed consent was obtained from all individual participants included in the study.
Supporting information
Appendix S1: Supporting information.
ACKNOWLEDGMENTS
We would like to thank all participating patients and their families, the Fundación Anemia de Fanconi, and financial institutions for supporting this study: Ministerio de Ciencia e Innovación (FABRAT, PID2021‐122411OB‐I00/AEI/10.13039/501100011033/FEDER, UE); Instituto de Salud Carlos III (ISCIII) and Next Generation EU (ICI22/00076); ICREA‐Academia program, Fundació Institut Català de Recerca i Estudis Avançats, Agència de Gestió d'Ajuts Universitaris i de Recerca (2021‐SGR‐00835, 2023‐2025); Centro de Investigación Biomédica En Red en Enfermedades Raras (CIBERER); and Fanconi Anemia Research Foundation (FARF).
Ramírez MJ, Pujol R, Minguillón J, et al. Prognostic significance of mutation type and chromosome fragility in Fanconi anemia. Am J Hematol. 2025;100(2):272‐284. doi: 10.1002/ajh.27520
[Correction added on 20 December 2024, after first online publication: The corresponding author, Dr. Jordi Surrallés, first affiliation has changed.]
DATA AVAILABILITY STATEMENT
The data that support the findings of this study are available on request from the corresponding author. The data are not publicly available due to privacy or ethical restrictions.
REFERENCES
- 1. Orphanet . Orphanet. 2023. https://www.orpha.net/
- 2. Rosenberg PS, Tamary H, Alter BP. How high are carrier frequencies of rare recessive syndromes? Contemporary estimates for Fanconi anemia in the United States and Israel. Am J Med Genet A. 2011;155a(8):1877‐1883. [DOI] [PMC free article] [PubMed] [Google Scholar]
- 3. Knies K, Inano S, Ramirez MJ, et al. Biallelic mutations in the ubiquitin ligase RFWD3 cause Fanconi anemia. J Clin Invest. 2017;127(8):3013‐3027. [DOI] [PMC free article] [PubMed] [Google Scholar]
- 4. Kuehl J, Pickel S, Xue Y, Zhang Y, Wang W, Schindler D. Biallelic mutations in FAAP100 predispose to Fanconi anemia (FA). Fanconi Anemia Research Fundation Scientific Symposium (p. 26). 2018.
- 5. Meetei AR, Levitus M, Xue Y, et al. X‐linked inheritance of Fanconi anemia complementation group B. Nat Genet. 2004;36(11):1219‐1224. [DOI] [PubMed] [Google Scholar]
- 6. Ameziane N, May P, Haitjema A, et al. A novel Fanconi anaemia subtype associated with a dominant‐negative mutation in RAD51. Nat Commun. 2015;6:8829. [DOI] [PMC free article] [PubMed] [Google Scholar]
- 7. Wang AT, Kim T, Wagner JE, et al. A dominant mutation in human RAD51 reveals its function in DNA interstrand crosslink repair independent of homologous recombination. Mol Cell. 2015;59(3):478‐490. [DOI] [PMC free article] [PubMed] [Google Scholar]
- 8. Rosenberg PS, Alter BP, Ebell W. Cancer risks in Fanconi anemia: findings from the German Fanconi anemia registry. Haematologica. 2008;93(4):511‐517. [DOI] [PubMed] [Google Scholar]
- 9. Murillo‐Sanjuán L, González‐Vicent M, Argilés Aparicio B, et al. Survival and toxicity outcomes of hematopoietic stem cell transplantation for pediatric patients with Fanconi anemia: a unified multicentric national study from the Spanish Working Group for bone marrow transplantation in children. Bone Marrow Transplant. 2020;56(5):1213‐1216. [DOI] [PubMed] [Google Scholar]
- 10. Montanuy H, Martínez‐Barriocanal Á, Antonio Casado J, et al. Gefitinib and Afatinib show potential efficacy for Fanconi anemia‐related head and neck cancer. Clin Cancer Res. 2020;26(12):3044‐3057. [DOI] [PubMed] [Google Scholar]
- 11. Rio P, Navarro S, Wang W, et al. Successful engraftment of gene‐corrected hematopoietic stem cells in non‐conditioned patients with Fanconi anemia. Nat Med. 2019;25(9):1396‐1401. [DOI] [PubMed] [Google Scholar]
- 12. Ramírez MJ, Minguillón J, Loveless S, et al. Chromosome fragility in the buccal epithelium in patients with Fanconi anemia. Cancer Lett. 2020;472:1‐7. [DOI] [PubMed] [Google Scholar]
- 13. Schroeder TM, Anschütz F, Knopp A. Spontaneous chromosome aberrations in familial panmyelopathy. Humangenetik. 1964;1(2):194‐196. [DOI] [PubMed] [Google Scholar]
- 14. Auerbach AD. A test for Fanconi's anemia. Blood. 1988;72(1):366‐367. [PubMed] [Google Scholar]
- 15. German J, Schonberg S, Caskie S, Warburton D, Falk C, Ray JH. A test for Fanconi's anemia. Blood. 1987;69(6):1637‐1641. [PubMed] [Google Scholar]
- 16. Auerbach AD. Fanconi anemia diagnosis and the diepoxybutane (DEB) test. Exp Hematol. 1993;21(6):731‐733. [PubMed] [Google Scholar]
- 17. Auerbach AD. Fanconi anemia and its diagnosis. Mutat Res. 2009;668(1–2):4‐10. [DOI] [PMC free article] [PubMed] [Google Scholar]
- 18. Auerbach AD. Diagnosis of Fanconi anemia by diepoxybutane analysis. Curr Protoc Hum Genet. 2015;85:8.7.1‐8.7.17. [DOI] [PMC free article] [PubMed] [Google Scholar]
- 19. Ramírez MJ, Pujol R, Trujillo‐Quintero JP, et al. Natural gene therapy by reverse mosaicism leads to improved hematology in Fanconi anemia patients. Am J Hemat. 2021;96(8):989‐999. [DOI] [PubMed] [Google Scholar]
- 20. Bogliolo M, Pujol R, Aza‐Carmona M, et al. Optimised molecular genetic diagnostics of Fanconi anaemia by whole exome sequencing and functional studies. J Med Genet. 2020;57(4):258‐268. [DOI] [PubMed] [Google Scholar]
- 21. Altintas B, Giri N, McReynolds LJ, Best A, Alter BP. Genotype‐phenotype and outcome associations in patients with Fanconi anemia: the National Cancer Institute cohort. Haematologica. 2022;108(1):69‐82. [DOI] [PMC free article] [PubMed] [Google Scholar]
- 22. Kutler DI, Singh B, Satagopan J, et al. A 20‐year perspective on the International Fanconi Anemia Registry (IFAR). Blood. 2003;101(4):1249‐1256. [DOI] [PubMed] [Google Scholar]
- 23. Casado JA, Callén E, Jacome A, et al. A comprehensive strategy for the subtyping of patients with Fanconi anaemia: conclusions from the Spanish Fanconi Anemia Research Network. J Med Genet. 2007;44(4):241‐249. [DOI] [PMC free article] [PubMed] [Google Scholar]
- 24. Hanenberg H, Batish SD, Pollok KE, et al. Phenotypic correction of primary Fanconi anemia T cells with retroviral vectors as a diagnostic tool. Exp Hematol. 2002;30(5):410‐420. [DOI] [PubMed] [Google Scholar]
- 25. Auerbach AD. Diagnosis of fanconi anemia by diepoxybutane analysis. Curr Protoc Hum Genet. 2003; 37:8.7.1‐8.7.15. [DOI] [PMC free article] [PubMed] [Google Scholar]
- 26. Auerbach AD. Diagnosis of Fanconi anemia by diepoxybutane analysis. Curr Protoc Hum Genet. 2015;85(8):7.1‐7.17. [DOI] [PMC free article] [PubMed] [Google Scholar]
- 27. Castella M, Pujol R, Callén E, et al. Chromosome fragility in patients with Fanconi anaemia: diagnostic implications and clinical impact. J Med Genet. 2011;48(4):242‐250. [DOI] [PubMed] [Google Scholar]
- 28. Castella M, Pujol R, Callén E, et al. Origin, functional role, and clinical impact of Fanconi anemia FANCA mutations. Blood. 2011;117(14):3759‐3769. [DOI] [PMC free article] [PubMed] [Google Scholar]
- 29. Hernández G, Ramírez MJ, Minguillón J, et al. Decapping protein EDC4 regulates DNA repair and phenocopies BRCA1. Nat Commun. 2018;9(1):967. [DOI] [PMC free article] [PubMed] [Google Scholar]
- 30. INE‐Instituto Nacional de Estadística sf‐a. Instituto Nacional de Estadística . 2023; https://www.ine.es/.
- 31. Risitano AM, Marotta S, Calzone R, Grimaldi F, Zatterale A. Twenty years of the Italian Fanconi Anemia Registry: where we stand and what remains to be learned. Haematologica. 2016;101(3):319‐327. [DOI] [PMC free article] [PubMed] [Google Scholar]
- 32. Steinberg‐Shemer O, Goldberg TA, Yacobovich J, et al. Characterization and genotype‐phenotype correlation of patients with Fanconi anemia in a multi‐ethnic population. Haematologica. 2020;105(7):1825‐1834. [DOI] [PMC free article] [PubMed] [Google Scholar]
- 33. Fiesco‐Roa MO, Giri N, McReynolds LJ, Best AF, Alter BP. Genotype‐phenotype associations in Fanconi anemia: a literature review. Blood Rev. 2019;37:100589. [DOI] [PMC free article] [PubMed] [Google Scholar]
- 34. Krausz C, Riera‐Escamilla A, Chianese C, et al. From exome analysis in idiopathic azoospermia to the identification of a high‐risk subgroup for occult Fanconi anemia. Genet Med. 2019;21(1):189‐194. [DOI] [PubMed] [Google Scholar]
- 35. Castells‐Roca L, Gutiérrez‐Enríquez S, Bonache S, et al. Clinical consequences of BRCA2 hypomorphism. NPJ Breast Cancer. 2021;7(1):117. [DOI] [PMC free article] [PubMed] [Google Scholar]
- 36. Alter BP, Giri N, McReynolds LJ, Altintas B. Fanconi anaemia: a syndrome with distinct subgroups. Br J Haematol. 2022;197(4):467‐474. [DOI] [PMC free article] [PubMed] [Google Scholar]
- 37. Alter BP, Giri N, Savage SA, Rosenberg PS. Cancer in the National Cancer Institute inherited bone marrow failure syndrome cohort after fifteen years of follow‐up. Haematologica. 2018;103(1):30‐39. [DOI] [PMC free article] [PubMed] [Google Scholar]
- 38. Rosenberg PS, Socié G, Alter BP, Gluckman E. Risk of head and neck squamous cell cancer and death in patients with Fanconi anemia who did and did not receive transplants. Blood. 2005;105(1):67‐73. [DOI] [PubMed] [Google Scholar]
- 39. Faivre L, Guardiola P, Lewis C, et al. Association of complementation group and mutation type with clinical outcome in fanconi anemia. European Fanconi Anemia Research Group. Blood. 2000;96(13):4064‐4070. [PubMed] [Google Scholar]
- 40. Auerbach AD, Smogorzewska A. Fanconi Anemia Mutation Database. International Fanconi Anemia Registry (IFAR). 2023. https://www2.rockefeller.edu/fanconi/mutate/
- 41. Kalb R, Neveling K, Hoehn H, et al. Hypomorphic mutations in the gene encoding a key Fanconi anemia protein, FANCD2, sustain a significant group of FA‐D2 patients with severe phenotype. Am J Hum Genet. 2007;80(5):895‐910. [DOI] [PMC free article] [PubMed] [Google Scholar]
Associated Data
This section collects any data citations, data availability statements, or supplementary materials included in this article.
Supplementary Materials
Appendix S1: Supporting information.
Data Availability Statement
The data that support the findings of this study are available on request from the corresponding author. The data are not publicly available due to privacy or ethical restrictions.