

Abstract
Introduction:
With the aging of the United States population, unintentional injuries among older adults, and especially falls-related injuries, are an increasing public health concern.
Methods:
We analyzed emergency department (ED) data from the Nation wide Emergency Department Sample, 2006–2011. We examined unintentional injury trends by 5-year age groups, sex, mechanism, body region, discharge disposition, and primary payer. For 2011, we estimated the medical costs of unintentional injury and the distribution of primary payers, plus rates by injury mechanisms and body regions injured by 5-year age groups.
Results:
From 2006 to 2011, the age-adjusted annual rate of unintentional injury-related ED visits among persons aged ≥65 years increased significantly from 7987 to 8163, per 100,000 population. In 2011, 65% of injuries were due to falls. Rates for fall-related injury ED visits increased with age and the highest rate was among those aged ≥100. Each year, about 85% of unintentional injury-related ED visits in this population were expected to be paid by Medicare. In 2011, the estimated lifetime medical cost of unintentional injury-related ED visits among those aged ≥65 years was $40 billion.
Conclusion:
Increasing rates of ED-treated unintentional injuries, driven mainly by falls among older adults, will challenge our health care system and increase the economic burden on our society. Prevention efforts to reduce falls and resulting injuries among adults aged ≥65 years have the potential to increase wellbeing and reduce health care spending, especially the costs covered by Medicare.
Practical applications:
With the aging of the U.S. population, unintentional injuries, and especially fall-related injuries, will present a growing challenge to our health care system as well as an increasing economic burden. To counteract this trend, we must implement effective public health strategies, such as increasing knowledge about fall risk factors and broadly disseminating evidence-based injury and fall prevention programs in both clinical and community settings.
Keywords: Unintentional injury, Older adults, Elderly, Emergency department, Falls
1. Introduction
In the United States, the number of older adults (those aged 65 years and older) is expected to increase from 54 million, or 17% of the population in 2015, to 83 million, or 23% of the population, in 2030 (U.S. Census, 2014). Injury is the eighth leading cause of death among older adults (Centers for Disease Control and Prevention [CDC], 2013a). In 2011, older adults accounted for over 20.3 million hospital emergency department (ED) visits and 25% of these visits were for unintentional injuries (NCHS, 2011). Clearly, unintentional injuries among older adults are an important public health concern.
Among older adults, falling is the leading mechanism of both fatal and nonfatal unintentional injuries (Centers for Disease Control and Prevention [CDC], 2014). In 2011, unintentional falls accounted for 22,901 injury deaths and 2.4 million nonfatal injuries treated in EDs (Centers for Disease Control and Prevention [CDC], 2013c). Unintentional fall injury rates increase sharply with age and these injuries are associated with significant morbidity, limited mobility, decreased physical functioning, and loss of independence (Lo, Brown, Sawyer, Kennedy, & Allman, 2014; Sterling, O'Connor, & Bonadies, 2001; Stevens, 2005).
This study provides nationally representative data on trends in unintentional injury rates for ED visits among persons aged ≥65 years, with an emphasis on fall-related injuries.
2. Methods
Data on hospital ED visits for unintentional injuries were from the U.S. Agency for Healthcare Research and Quality, Healthcare Cost and Utilization Project (HCUP)–National Emergency Department Sample (NEDS). HCUP–NEDS, is the largest all-payer ED database publicly available in the United States. Injury diagnoses and external causes of injury are coded using ICD-9-CM (International Classification of Diseases, Ninth revision, Clinical Modification) codes.
Although NEDS provides ICD-9-CM codes for up to 15 diagnoses per ED visit, injuries were identified using the first-listed, or principal, diagnosis codes to avoid multiple counting of discharge records.(HCUP, 2006) The ICD-9-CM codes used to identify injuries were: 800–908, 909.0–909.2, 909.4, 909.9, 995.5, 910–994, and 995.80–995.85. The ICD-9-CM external cause codes (E-codes) used to define unintentional injuries were E800–E869 and E880–E929. Specific mechanisms of injury were defined using the first-listed E-code in the ED record and applying the Centers for Disease Control and Prevention's (CDC) recommended framework of E-code groupings (Centers for Disease Control and Prevention [CDC], 2011b). Diagnosis code groupings for the primary body region injured were defined using the Barell matrix (Centers for Disease Control and Prevention [CDC], 2011a).
Analysis variables included age, sex, mechanism of injury, and primary body part injured. Also included were patients’ discharge disposition from the ED and the expected primary payer.
Data were weighted to provide national estimates of annual numbers and rates per 100,000 population. From 2006 through 2011, age-adjusted rates were calculated based on the U.S. U.S. Census Bureau's bridged-race postcensal population estimates of the resident population (Centers for Disease Control and Prevention [CDC], 2013b). Rates were age-adjusted by 5-year age groups to the standard 2000 U.S. population. Joinpoint regression software from the National Cancer Institute (NCI, 2014) was used to calculate the average annual percent changes (AAPCs) in unintentional injury incidence rates from 2006 to 2011. AAPCs were considered significantly different from zero for p-values <0.05. All statistical analyses were performed using SAS Systems for Windows, version 9.3 (SAS Institute, Cary, NC).
Lifetime medical costs (in 2013 dollars) for unintentional injury-related ED visits were estimated based on weighted 2011 HCUP-NEDS data for older adults treated in hospital EDs using the Web-based Injury Statistics Query and Reporting System (WISQARS; Centers for Disease Control and Prevention [CDC], 2013a). Methods for using WISQARS to estimate medical costs, including facility and non-facility costs, have been described elsewhere (Lawrence & Miller, 2014).
3. Results
3.1. Trends in unintentional injury-related ED visits –2006 to 2011
Table 1 shows the trends in rates of unintentional injury-related ED visits from 2006 to 2011 by age, sex, injury mechanism, body region injured, and disposition. The annual rates among adults aged 65 years and older increased significantly from 7987 to 8164 per 100,000 population. The average annual percent change (AAPC) was 0.5 (p < 0.004).
Table 1.
Age adjusted annual rates per 100,000 population of unintentional injury-related emergency department visits for persons aged 65 and older, United States, 2006–2011§.
| Rate | AAPC* | P-value of AAPC | ||||||
|---|---|---|---|---|---|---|---|---|
| 2006 | 2007 | 2008 | 2009 | 2010 | 2011 | |||
| Total | 7987 | 7917 | 8086 | 8097 | 8145 | 8164 | 0.5 | 0.004 |
| Age group | ||||||||
| 65–69 | 5390 | 5409 | 5391 | 5402 | 5343 | 5351 | −0.2 | 0.075 |
| 70–74 | 5985 | 5948 | 6000 | 6024 | 6033 | 6064 | 0.3 | 0.013 |
| 75–79 | 7430 | 7392 | 7473 | 7512 | 7669 | 7652 | 0.7 | 0.009 |
| 80–84 | 10,058 | 9932 | 10,162 | 10,147 | 10,419 | 10,455 | 1.0 | 0.012 |
| 85–89 | 13,862 | 13,857 | 14,351 | 14,426 | 14,570 | 14,661 | 1.2 | 0.003 |
| 90–94 | 18,118 | 18,162 | 18,789 | 18,865 | 18,857 | 18,848 | 0.9 | 0.029 |
| 95–99 | 20,660 | 21,374 | 21,608 | 21,259 | 22,238 | 21,794 | 1.0 | 0.057 |
| 100+ | 21,785 | 22,509 | 23,056 | 21,754 | 21,937 | 22,375 | 0.1 | 0.928 |
| Sex | ||||||||
| Male | 6530 | 6519 | 6624 | 6610 | 6658 | 6699 | 0.5 | 0.004 |
| Female | 9056 | 9044 | 9175 | 9202 | 9274 | 9284 | 0.6 | 0.003 |
| Injury mechanism | ||||||||
| Falls | 5057 | 5105 | 5260 | 5321 | 5319 | 5341 | 1.1 | 0.048 |
| Motor vehicles | 520 | 503 | 490 | 469 | 475 | 452 | −2.6 | 0.001 |
| Struck by/against | 429 | 413 | 415 | 420 | 431 | 427 | 0.3 | 0.491 |
| Cut/pierce | 408 | 387 | 375 | 367 | 364 | 367 | −2.2 | <0.000 |
| Overexertion | 355 | 339 | 333 | 315 | 309 | 230 | −3.3 | <0.000 |
| Poisoning | 97 | 98 | 106 | 107 | 111 | 112 | 3.1 | 0.003 |
| Hot object/substance | 39 | 40 | 37 | 36 | 38 | 36 | −1.4 | 0.111 |
| Fire/flame | 16 | 14 | 16 | 18 | 17 | 15 | 1.0 | 0.677 |
| Other | 1064 | 1069 | 1051 | 1042 | 1080 | 1112 | 0.8 | 0.200 |
| Body region injured | ||||||||
| Extremities | 4312 | 4266 | 4242 | 4143 | 4115 | 4119 | −1.0 | 0.003 |
| Upper extremity | 2032 | 2007 | 1982 | 1933 | 1938 | 1948 | −0.9 | 0.019 |
| Lower extremity | 1358 | 1359 | 1352 | 1338 | 1339 | 1342 | −0.3 | 0.029 |
| Hip | 922 | 8,99 | 908 | 872 | 838 | 829 | −2.2 | 0.002 |
| Head & neck (non-TBI) | 1589 | 1609 | 1677 | 1788 | 1827 | 1844 | 3.4 | 0.001 |
| Torso | 872 | 866 | 875 | 865 | 864 | 867 | −0.1 | 0.334 |
| Spine & upper back | 536 | 534 | 556 | 541 | 554 | 552 | 0.6 | 0.117 |
| TBI | 246 | 263 | 295 | 318 | 329 | 323 | 5.9 | <0.0001 |
| Unclassified | 433 | 434 | 440 | 442 | 456 | 459 | 1.3 | 0.002 |
| Disposition of patient | ||||||||
| Home | 5782 | 5873 | 6016 | 6050 | 6116 | 6142 | 1.3 | <0.0001 |
| Admitted | 1523 | 1530 | 1556 | 1524 | 1493 | 1439 | −1.0 | 0.026 |
| Transferred | 402 | 418 | 464 | 484 | 499 | 542 | 6.1 | 0.0002 |
| Left against medical advice | 23 | 24 | 24 | 24 | 23 | 25 | 1.1 | 0.251 |
| Died | 5 | 4 | 5 | 5 | 4 | 7 | 2.8 | 0.470 |
| Destination unknown | 252 | 123 | 21^ | 9^ | 10 | 10 | −49.3 | 0.006 |
TBI: traumatic brain injury.
Data are from the US Agency for Healthcare Research and Quality, Healthcare Cost and Utilization Project—National Emergency Department Sample.
Average Annual percent change (AAPC) calculated by using Joinpoint regression analysis.
If the relative standard error was over 30% or equal to 0, the value of the estimate was considered unreliable and was not reported.
Annual rates increased significantly for each age group from 70–74 to 90–94 (p < 0.05). The greatest rate increase occurred among people aged 85–89 years (AAPC = 1.2) followed by those aged 80–84 years (AAPC = 1.0). Rates of unintentional injury-related ED visits for both males and females increased significantly over the study period (AAPC = 0.5 for males, AAPC = 0.6 for females, p < 0.05).
Falls were the most frequent unintentional injury mechanism followed by motor vehicle (MV) injuries. Rates of fall-related ED visits increased significantly (AAPC = 1.1, p < 0.05) while motor vehicle injury rates decreased significantly (AAPC = −2.6, p < 0.05).
The highest rates were for injuries of the extremities followed by other head and neck injuries. Over the study period, the rates for TBI and other head and neck injuries increased significantly (AAPC = 5.9 and 3.4 respectively, p < 0.05). In contrast, the rates for extremity injuries decreased significantly (AAPC = −1.0, p < 0.05), with the largest decrease associated with hip fractures (AAPC = −2.2, p < 0.05).
Each year disposition rates were highest for patients discharged to home followed by hospital admission.
In 2011, the estimated total lifetime medical cost of unintentional injury-related ED visits among people 65 years and older was $40.8 billion ($12,129/visit). This included $33.3 billion ($40,620/visit) for those admitted or transferred and $7.5 billion ($2942/visit) for those discharged to home.
3.2. Fall related injury ED visits in 2011—from 65 to 100+ years age
Rates for falls were much higher than for other mechanisms and also increased sharply with age, reaching a peak among people aged 95–99 years (Fig. 1). The fall rate among people aged 95–100+ was more than seven times higher than that of people aged 65–69 years. Rates for other unintentional injury mechanisms showed no significant change with age.
Fig. 1.

Rates for unintentional injury-related emergency department visits for persons aged 65 and older by age group and mechanism of injury, United States, 2011. (Data are from the US Agency for Healthcare Research and Quality, Healthcare Cost and Utilization Project—National Emergency Department Sample.)
About 80% of fall-related injuries included TBI, non-TBI head and neck injury, extremity fractures, hip fractures and other extremity injury (Fig. 2). The highest rates were for non-TBI head and neck injuries. All types of fall-related injury ED visits increased with age with the sharpest rate increases for hip fractures and head and neck injuries. People aged 90+ had hip fracture rates 24 times higher, head and neck injury rates 12 times higher, and TBI rates 8 times higher than people aged 65–69.
Fig. 2.
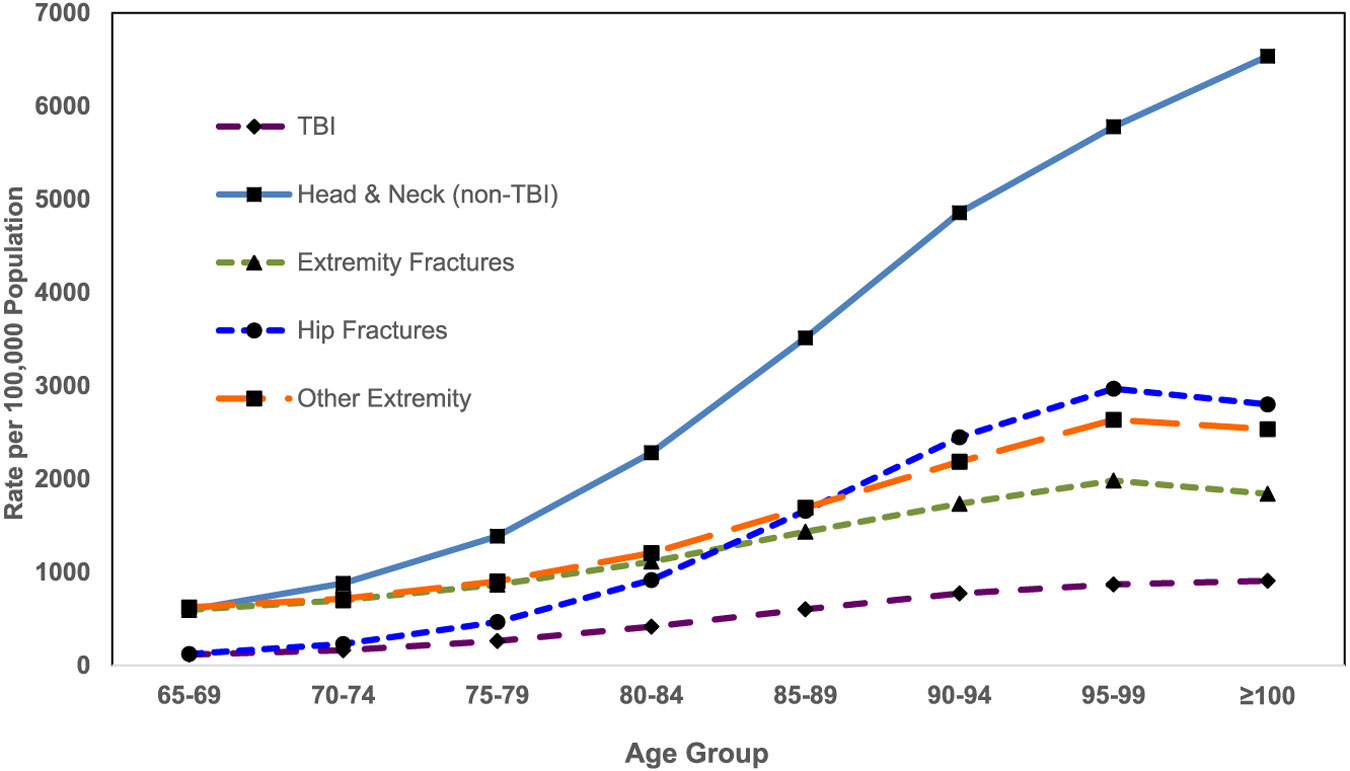
Rates of unintentional fall-related injury emergency department visits for persons aged 65 and older by age group and body region injured, United States, 2011. (474,830 (21.5%) weighted records with other than listed body region and/or nature of injury are not displayed. Data are from the US Agency for Healthcare Research and Quality, Healthcare Cost and Utilization Project—National Emergency Department Sample.)
The proportion of unintentional injury-related ED visits in which Medicare was the expected payer varied by age. The percentage increased from 71.5% among those aged 65–69 years to 93.3% among those 90 years and older (Fig. 3). Conversely, the percentage for private payers decreased significantly, from 20.2% among those aged 65–69 years to 4.5% for those 90 years and older (p < 0.001).
Fig. 3.

Proportion of unintentional injury-related emergency department visits for persons aged 65 and older by age group and expected primary payer, United States, 2011. (Data are from the US Agency for Healthcare Research and Quality, Healthcare Cost and Utilization Project—National Emergency Department Sample.)
4. Discussion
Every year, about three million older adults are treated in EDs for unintentional injuries. From 2006 to 2011, the rate of unintentional injury-related ED visits increased significantly. Much of this increase was due to an increase in the rate of fall-related injuries.
In 2011, falls comprised 65% of ED visits for unintentional injuries among older adults. Rates of ED visits due to falls, as well as serious fall-related injuries, increased rapidly with age, reaching a peak around age 95, with the exception of TBI and head and neck injuries, which continued to increase.
Other studies have observed an increase in fall injury rates. In Canada, fall-related injury rates among older adults increased about 6% a year from 2002 to 2009 (Hill, Pinto, Nathens, & Fowler, 2014). From 2006 to 2010, about 85% of injuries that required hospital admission each year in Canada were due to falls (PHAC, 2014).
The increase in fall rates may be a result of people living longer. People born in 1929–1931 had an average life expectancy of 59.2 years while people born in 1941–1951 had an average life expectancy of 68.1 years (Shrestha, 2005). Declines in muscle strength with age contribute to increased likelihood of falls among older adults (Papa, Foreman, & Dibble, 2015). Many older adults also are living longer with chronic medical conditions, such as arthritis and diabetes, and taking multiple medications, all factors that can increase fall risk (Helgadottir, Laflamme, Monarrez-Espino, & Moller, 2014; Sturnieks et al., 2004; Tilling, Darawil, & Britton, 2006; Tinetti et al., 2014).
The U.S. Census estimates that there are now about six million persons aged 85 years and older and this number may reach 19 million in 2050 (U.S. Census, 2014). Such an increase in the oldest portion of our population, along with the documented increase in the rate of unintentional injuries, will mean a substantial increase in injuries, especially fall-related injuries, which will place a significant burden on our health care system.
In 2011, the estimated total lifetime medical cost for unintentional injury-related ED visits among older adults was $40 billion. The percentage for which Medicare was the expected payer increased with age, from 70% among people aged 65–69 years to 92% among people aged 90 and older. The need for Medicare to provide coverage will become increasingly important as our population ages.
Because falls are the major cause of unintentional injuries among older adults, the costs of fall injuries will continue to increase and to challenge our health care system. Other developed countries with aging populations are facing similar challenges. Annual costs associated with falls were over 470 million pounds in Scotland (population five million; Craig et al., 2013) and 675.4 million euros in The Netherlands (population 16 million; Hartholt et al., 2012). The economic burden of falls should be a driver for implementing falls interventions.
This study has several limitations. First, because NEDS reports one discharge record per ED visit and includes revisits for the same injury incident, these data represent patient visits rather than individual patients. Second, results were based only on the principal diagnosis and the first-listed external cause code. While we may have missed a number of relevant diagnoses, this approach allowed us to avoid double or multiple counting discharge records when the ED visits had two more injury ICD-9 codes.
5. Conclusion
With the aging of the U.S. population, unintentional injuries, and especially fall-related injuries, present a growing challenge to our health care system as well as an increasing economic burden. To counteract this trend, we must implement effective public health strategies, such as increasing knowledge about fall risk factors and broadly disseminating evidence-based injury and fall prevention programs in both clinical and community settings (Stevens, 2005).
Biographies
Xinyao de Grauw received her MD and PhD in neuroscience in China and is a MPH 2016 candidate at Rollins School of Public Health, Emory University. She was a guest researcher and an intern at Injury Center at the Centers for Disease Control and Prevention in 2014 and 2015, respectively. Her research interests include injury prevention, especially traumatic brain injury, epilepsy and older adult falls. Dr. de Grauw has published over twenty peer-reviewed journal articles and has contributed a chapter on the diagnosis of brain diseases using CT and MRI technology.
Joseph Lee Annest, PhD, MS, retired as the Director of the Office of Statistics and Programming, in the National Center for Injury Prevention and Control, CDC after more than 33 years of federal public service. Among his other accomplishments, Dr. Annest provided federal leadership in establishing the National Electronic Injury Surveillance System—All Injury Program (NEISS-AIP) that provides national estimates of nonfatal injuries treated in U.S. hospital emergency departments and in developing and maintaining the Web-based Injury Statistics Query and Reporting System (WISQARS™) that provides national and state data on fatal and nonfatal injuries in the United States.
Judy A Stevens received her PhD from Emory University and joined the Injury Center at the Centers for Disease Control and Prevention in 1996 as an epidemiologist in the Division of Unintentional Injury Prevention. Now semi-retired, Dr. Stevens continues to focus on older adult falls and fall prevention. As a national expert, she has conducted epidemiologic research on fatal and nonfatal falls. In addition to her research, Dr. Stevens has provided technical assistance and oversight to CDC-funded studies, conducted by universities and state health departments, that develop, implement, and evaluate older adult fall prevention programs. Dr. Stevens has published over eighty peer-reviewed journal articles and has contributed chapters on older adult falls to six textbooks. She also has developed resources for healthcare providers as well as educational materials for older adults and their caregivers.
Likang Xu, MD, MS, is a Mathematical Research Statistician in the National Center for Injury Prevention and Control, CDC. He received his MD degree from Tongji Medical University in Wuhan, China and his MS degree in biostatistics from University of Alabama at Birmingham. His expertise is in study design, data management, and statistical analyses.
Victor Coronado MD, MPH, is a medical officer at the Centers for Disease Control and Prevention. He received his MD from the Federico Villarreal University, Lima, Peru. Dr. Coronado received a Master in Public Health from Tulane University School of Public Health and Tropical Medicine. Dr. Coronado is an experienced neuro-epidemiologist and researcher. His current research interests include injury, emerging tropical diseases, and travel related medicine.
Footnotes
The Journal of Safety Research has partnered with the Office of the Associate Director for Science, Division of Unintentional Injury Prevention in the National Center for Injury Prevention & Control at the Centers for Disease Control and Prevention (CDC) in Atlanta, Georgia, USA, to briefly report on some of the latest findings in research from the CDC. This report is the 38th in a series of CDC articles
The findings and conclusions in this report are those of the authors and do not necessarily represent the official position of the Centers for Disease Control and Prevention
Conflicts of interest to report
None.
References
- Census, U. S. (2014). 2014 National Population Projections. Retrieved from http://www.U.S.Census.gov/population/projections/data/national/2014/summarytables.html.
- Centers for Disease Control and Prevention [CDC] (2011a). Injury Data and Resources. Tools and Frameworks September 9, 2011. Retrieved from http://www.cdc.gov/nchs/injury/injury_tools.htm. [Google Scholar]
- Centers for Disease Control and Prevention [CDC] (2011b). Recommended framework of E-code groupings for presenting injury mortality and morbidity data. April 29, 2014. Retrieved from http://www.cdc.gov/injury/wisqars/ecode_matrix.html.
- Centers for Disease Control and Prevention [CDC] (2013a). 10 leading causes of injury deaths by age group highlighting unintentional injury deaths, United States—2013 Retrieved from http://www.cdc.gov/injury/images/lc-charts/leading_causes_of_injury_deaths_highlighting_unintentional_injury_2013-a.gif [Google Scholar]
- Centers for Disease Control and Prevention [CDC] (2013b). Bridged-race population estimates. Data files and documentation. June 24, 2014. Retrieved from http://www.cdc.gov/nchs/nvss/bridged_race/data_documentation.htm.
- Centers for Disease Control and Prevention [CDC] (2013c). Nonfatal injury reports. March 28, 2013. 2001–2013. Retrieved from http://webappa.cdc.gov/sasweb/ncipc/nfirates2001.html.
- Centers for Disease Control and Prevention [CDC] (2014). National Center for Injury Prevention and Control. Web-based Injury Statistics Query and Reporting System (WISQARS) April 1, 2015. Retrieved from http://www.cdc.gov/injury/wisqars/nonfatal.html. [Google Scholar]
- Craig J, Murray A, Mitchell S, Clark S, Saunders L, & Burleigh L (2013). The high cost to health and social care of managing falls in older adults living in the community in Scotland. Scottish Medical Journal, 58(4), 198–203. 10.1177/0036933013507848. [DOI] [PubMed] [Google Scholar]
- Hartholt KA, Polinder S, Van der Cammen TJ, Panneman MJ, Van der Velde N, Van Lieshout EM, … Van Beeck EF (2012). Costs of falls in an ageing population: a nationwide study from The Netherlands (2007–2009). Injury, 43(7), 1199–1203. 10.1016/j.injury.2012.03.033. [DOI] [PubMed] [Google Scholar]
- HCUP (2006). Frequency and Costs of Hospital Admissions for Injury, 2004 Retrieved from http://www.hcup-us.ahrq.gov/reports/statbriefs/sb18.pdf. [PubMed]
- Helgadottir B, Laflamme L, Monarrez-Espino J, & Moller J (2014). Medication and fall injury in the elderly population; do individual demographics, health status and lifestyle matter? BMC Geriatrics, 14, 92. 10.1186/1471-2318-14-92. [DOI] [PMC free article] [PubMed] [Google Scholar]
- Hill AD, Pinto R, Nathens AB, & Fowler RA (2014). Age-related trends in severe injury hospitalization in Canada. J Trauma Acute Care Surg, 77(4), 608–613. 10.1097/TA.0000000000000412. [DOI] [PubMed] [Google Scholar]
- Lawrence BR, & Miller TR (2014). Medical and work loss cost estimation methods for the WISQARS cost of injury module. Retrieved from http://www.pire.org/documents/WisqarsCostMethods.pdf. [Google Scholar]
- Lo AX, Brown CJ, Sawyer P, Kennedy RE, & Allman RM (2014). Life-space mobility declines associated with incident falls and fractures. Journal of the American Geriatrics Society, 62(5), 919–923. 10.1111/jgs.12787. [DOI] [PMC free article] [PubMed] [Google Scholar]
- NCHS (2011). National hospital ambulatory medical care survey: 2011 emergency department summary tables. Retrieved from http://www.cdc.gov/nchs/data/ahcd/nhamcs_emergency/2011_ed_web_tables.pdf.
- NCI (2014). 29 Apr 2015). Joinpoint Trend Analysis Software Retrieved from http://surveillance.cancer.gov/joinpoint/.
- Papa EV, Foreman KB, & Dibble LE (2015). Effects of age and acute muscle fatigue on reactive postural control in healthy adults. Clin Biomech. Avon: Bristol. 10.1016/j.clinbiomech.2015.08.017. [DOI] [PMC free article] [PubMed] [Google Scholar]
- PHAC (2014). SeniorS' FallS in Canada: Second Report. Retrieved from Ottawa, Canada: http://www.phac-aspc.gc.ca/seniors-aines/publications/public/injury-blessure/seniors_falls-chutes_aines/assets/pdf/seniors_falls-chutes_aines-eng.pdf [Google Scholar]
- Shrestha LB (2005). CRS report for congress (RL32792). Retrieved from http://www.cnie.org/nle/crsreports/05mar/RL32792.pdf. [Google Scholar]
- Sterling DA, O'Connor JA, & Bonadies J (2001). Geriatric falls: injury severity is high and disproportionate to mechanism. J Trauma, 50(1), 116–119 Retrieved from http://www.ncbi.nlm.nih.gov/pubmed/11231681. [DOI] [PubMed] [Google Scholar]
- Stevens JA (2005). Falls among older adults—Risk factors and prevention strategies. Journal of Safety Research, 36(4), 409–411. 10.1016/j.jsr.2005.08.001. [DOI] [PubMed] [Google Scholar]
- Sturnieks DL, Tiedemann A, Chapman K, Munro B, Murray SM, & Lord SR (2004). Physiological risk factors for falls in older people with lower limb arthritis. J Rheumatol, 31(11), 2272–2279 Retrieved from http://www.ncbi.nlm.nih.gov/pubmed/15517643. [PubMed] [Google Scholar]
- Tilling LM, Darawil K, & Britton M (2006). Falls as a complication of diabetes mellitus in older people. Journal of Diabetes and its Complications, 20(3), 158–162. 10.1016/j.jdiacomp.2005.06.004. [DOI] [PubMed] [Google Scholar]
- Tinetti ME, Han L, Lee DS, McAvay GJ, Peduzzi P, Gross CP, … Lin H (2014). Antihypertensive medications and serious fall injuries in a nationally representative sample of older adults. JAMA Intern Med, 174(4), 588–595. 10.1001/jamainternmed.2013.14764. [DOI] [PMC free article] [PubMed] [Google Scholar]