

Abstract
Background
The stress hyperglycemia ratio (SHR) has recently gained attention as a marker for acute hyperglycemia, which has been linked to adverse clinical outcomes. However, its independent role in the development of type 2 diabetes (T2D) remains understudied. This cohort study aimed to assess the association between SHR and the incidence of T2D.
Methods
The study included 8978 participants aged 45 or older, free of diabetes at baseline, from the China Health and Retirement Longitudinal Study (CHARLS). Incident T2D up to December 31, 2020, was the primary outcome. Participants were divided into SHR quartiles, and Cox proportional hazards regression and fine-gray competing risk models were used to assess SHR’s association with T2D onset, adjusting for fasting glucose and HbA1c.
Results
The mean age of participants was 59.0 ± 9.5 years, and 51.5% were women. Over a mean follow-up of 7.8 years, 1084 participants developed T2D. Cox regression analysis revealed that individuals in the highest SHR quartile had a significantly higher risk of T2D onset compared to those in the lowest quartile (HR 1.48, 95% CI 1.26–1.75, P for trend < 0.001). Stratified analyses by sex, obesity, and smoking showed consistent results. Adding SHR to fasting glucose and HbA1c models improved the AUC for T2D prediction (DeLong Test, P = 0.013).
Conclusion
SHR is independently associated with incident T2D, suggesting its potential use in the risk stratification and prediction for T2D, beyond glucose and HbA1c.
Supplementary Information
The online version contains supplementary material available at 10.1186/s12933-024-02567-7.
Keywords: Stress hyperglycemia ratio (SHR), Diabetes, Glucose, HbA1c
Background
Type 2 diabetes (T2D) has become one of the most prevalent non-communicable diseases worldwide, contributing to a significant burden of morbidity, mortality, and healthcare costs. The prevalence of diabetes is estimated over 500 million cases globally [1]. Traditionally, fasting glucose, glycated hemoglobin (HbA1c), and insulin resistance have been key biomarkers used to diagnose and predict T2D [2]. Stress-induced hyperglycemia occurs due to an illness that leads to insulin resistance, decreased insulin secretion, and elevated blood glucose [3]. Acute stress-induced hyperglycemia has gained attention as a potentially significant indicator of long-term metabolic dysregulation.
The stress hyperglycemia ratio (SHR), a novel marker that reflects the extent of acute hyperglycemia relative to chronic glycemic control, is emerging as a valuable tool in various clinical settings [4]. The blood glucose level at admission cannot reveal the chronic glucose level, and HbA1c is a well-established marker of glycemia over the previous 3 months, reflecting the estimated average glucose concentration. Initially studied in patients with critical illnesses, e.g., myocardial infarction, acute coronary syndrome, and heart failure, SHR has shown predictive value for adverse outcomes, such as increased mortality and rehospitalization [5–8]. Despite these insights, limited research has explored the effects of SHR in the general population. Recently, SHR is claimed as a risk factor for mortality in diabetic or pre-diabetic population [4]. However, the relationship between the SHR and the onset of T2D remains unclear.
Understanding the role of SHR in T2D onset may provide a new biomarker for early identification of high-risk individuals. This study aimed to explore the independent association between SHR and incident T2D, using data from the China Health and Retirement Longitudinal Study (CHARLS), a large, nationally representative cohort. We hypothesized that elevated SHR would be associated with an increased risk of developing T2D, even after accounting for traditional risk factors like fasting glucose and HbA1c.
Methods
Data source and study population
This current study was a secondary analysis using data from China Health and Retirement Longitudinal Study (CHARLS). CHARLS (http://charls.pku.edu.cn/) is a national project aiming to investigate the policy and health related data among adults aged 45 years or older and solve the population aging issue. There are five surveys between 2011 and 2020, with participants recruited from both rural and urban residence using multistage stratified probability proportional-to-size sampling strategy. Details of the study design and cohort profile have been previously described [9]. CHARLS data have been widely used in the epidemiolocal research [10–12].
Following the study design of previous study [12, 13], the first survey (2011–2012) was set as baseline and participants were then followed at four subsequent visits (2013–2014, 2015–2016, 2017–2018, 2019–2020). Participants with no history of cardiovascular diseases, cancer, or T2D were primarily included in the current analysis. People lacking sociodemographic characteristics (age and sex) and necessary blood tests (glucose and HbA1c) or lost to follow-up were excluded. Then, a total of 8978 participants were included in the final analysis (Figure S1).
The CHARLS study was performed in accordance with the principles of the Declaration of Helsinki and was approved by the Institutional Review Board of Peking University (IRB00001052-11015). All participants provided written informed consent before participating in the CHARLS study. This study was conducted following the Strengthening the Reporting of Observational Studies in Epidemiology (STROBE) reporting guidelines.
Exposures
Fasting venous blood samples were collected by medical staff from the Chinese Centre for Disease Control and Prevention based on the standard protocol. These assays were performed at the Youanmen Center for Clinical Laboratory of Capital Medical University. Plasma glucose was analyzed using enzymatic colormetric test, and HbA1c was tested using Boronate affinity high-performance liquid chromatography (HPLC). The coefficient of variation (CV) of blood marker measurement was 0.9% for glucose and 1.9% for HbA1c. The SHR was calculated by the formula [FPG (mmol/L)]/[1.59 * HbA1c (%)-2.59] [14]. All patients were classified into four groups (Q1, Q2, Q3, and Q4) by quartile of SHR, with Q1 as the reference group.
Ascertainment of T2D
The study outcome was the incidence of T2D. In line with previous studies [15, 16], incident T2D events were defined using physician-diagnosis records assessed by the standardized questions: “Have you been told by a doctor that you have been diagnosed with T2D?” or “Have you been taking insulin or hypoglycemia medications?” The outcomes were assessed by rigorously trained interviewers through standardized questionnaires that are harmonized to international leading aging surveys in the Health and Retirement Study (HRS) [17, 18]. Quality control of data recording and checking was conducted to ensure data reliability.
Covariates
Baseline measurements of age, sex, education level, marital status, residence location, BMI, smoking, and drinking were included as covariates in the current study. Educational level was categorized as “primary education,” “secondary education or above”. Marital status included “married” and “others.” Residence location included “urban” and “rural.” Smoking status was defined as “never smoking”, “current smoker” and “former smoker”. Body mass index (BMI) was calculated as weight (in kilograms)/height2 (in meters squared) [19]. Obesity was defined as BMI ≥ 28.0 km/m2. Hypertension and dyslipidemia were self-reported as the physician-diagnosis history or using medications.
Statistical analysis
Data are described as the means and standard deviation (SD) for continuous variables. Frequency with percentage was used to describe categorical variables. P values were calculated by one-way ANOVA for continuous variables and by Pearson’s chi-square test for categorical variables. We computed the person-time of follow-up for each participant from the date of the baseline to the end of follow-up of the T2D diagnosis, death, or the end of follow-up (2019–2020 survey), whichever came first. The log-rank test and Kaplan–Meier (K–M) survival analyses were performed to explore differences in T2D incidence between the four groups. A multivariate Cox proportional hazards regression model was applied to calculate the calculate the hazard ratio (HR) with 95% confidence interval (CI), considering the time-to-event framework using age as time scale [20]. The proportional hazards assumption was tested using Schoenfeld residuals, and no potential violation was observed. Age (continuous), sex were adjusted in model 1, and in model 2, residence (rural, urban), education level (primary, secondary or above), marital status (married, others), smoking status (current, former or never), current drinking (yes, no), obesity (yes, no), hypertension (yes, no), and dyslipidemia (yes, no) were further adjusted to account for the impacts of demographic, lifestyle, and comorbidity. To explore the association between SHR and T2D, Cox proportional hazards regression models with restricted cubic spline (RCS) analyses were performed with four knots. The reference point is set as the median value of variables among the corresponding populations. Subgroup analyses were also performed to assess the influence of SHR on T2D incidence in different subgroups stratified by sex, obesity and smoking status. Sensitivities analyses were performed by repeating the analysis using the complete dataset without missing data, considering death as the competing event of incident T2D by using Fine-Gray sub-distribution models, or adjusting FPG and HbA1c to test the independent association between SHR and T2D. We calculated the time-dependent Harrell’s C-index (95% CI) to evaluate the additive capacity of SHR for predicting new-onset T2D beyond glucose and HbA1c, and compared the C‐index difference using DeLong Test [21].
All statistical analyses were performed using R software (version 4.2.1). Cox regression analysis was performed using the ‘survival’ package, and the time-dependent Harrell’s C-index was calculated using the ‘riskRegression’ package. A two-sided P value < 0.05 was considered statistically significant.
Results
Table 1 shows the baseline characteristics of the participants. A total of 8978 participants in CHARLS from 2011 to 2020 were included in the final analyses. The mean (SD) age was 59.0 (9.5) years, including 4,620 (51.5%) females. Compared to the lowest SHR quartile, those of the highest SHR quartile were older, more males, tend to be current drinker, and have hypertension (P < 0.05).
Table 1.
Characteristics of 8 978 participants at baseline, 2011
| Overall | Q1 | Q2 | Q3 | Q4 | P value | |
|---|---|---|---|---|---|---|
| Participants, No | 8978 | 2245 | 2245 | 2245 | 2243 | |
| Age, years | 58.99 (9.52) | 58.97 (9.41) | 58.75 (9.41) | 58.78 (9.59) | 59.47 (9.65) | 0.043 |
| Sex, female | 4620 (51.5) | 1157 (51.5) | 1197 (53.3) | 1188 (52.9) | 1078 (48.1) | 0.002 |
| Residence | 0.004 | |||||
| Rural | 7498 (83.5) | 1906 (84.9) | 1850 (82.4) | 1836 (81.8) | 1906 (85.0) | |
| Urban | 1480 (16.5) | 339 (15.1) | 395 (17.6) | 409 (18.2) | 337 (15.0) | |
| Marriage, married | 7966 (88.7) | 1990 (88.6) | 2010 (89.5) | 1990 (88.6) | 1976 (88.1) | 0.497 |
| Educational level | 0.028 | |||||
| Primary | 6210 (69.2) | 1595 (71.0) | 1544 (68.8) | 1505 (67.0) | 1566 (69.8) | |
| Secondary or above | 2768 (30.8) | 650 (29.0) | 701 (31.2) | 740 (33.0) | 677 (30.2) | |
| Smoking | 0.016 | |||||
| Current | 2745 (31.2) | 734 (33.5) | 660 (30.0) | 647 (29.4) | 704 (32.1) | |
| Never | 5338 (60.8) | 1307 (59.6) | 1367 (62.1) | 1369 (62.3) | 1295 (59.1) | |
| Quit | 703 (8.0) | 152 (6.9) | 176 (8.0) | 182 (8.3) | 193 (8.8) | |
| Current drinking | 3143 (35.0) | 742 (33.1) | 735 (32.8) | 798 (35.6) | 868 (38.7) | < 0.001 |
| BMI, kg/m2 | 23.28 (3.73) | 23.06 (3.83) | 23.26 (3.60) | 23.39 (3.66) | 23.42 (3.82) | 0.011 |
| Obesity | 767 (10.0) | 186 (9.7) | 187 (9.7) | 197 (10.3) | 197 (10.5) | 0.79 |
| SBP, mmHg | 130.14 (21.46) | 128.19 (21.48) | 129.64 (21.48) | 129.82 (21.22) | 132.94 (21.40) | < 0.001 |
| DBP, mmHg | 75.65 (12.17) | 74.93 (12.40) | 75.27 (12.20) | 75.87 (12.13) | 76.54 (11.86) | < 0.001 |
| Hypertension | 1835 (20.4) | 415 (18.5) | 419 (18.7) | 484 (21.6) | 517 (23.0) | < 0.001 |
| Dyslipidemia | 546 (6.1) | 103 (4.6) | 127 (5.7) | 169 (7.5) | 147 (6.6) | < 0.001 |
| Glucose, mg/dL | 107.2 (28.9) | 91.6 (15.6) | 100.8 (12.7) | 106.1 (18.1) | 129.6 (12.6) | < 0.001 |
| HbA1c, % | 5.19 (0.66) | 5.47 (0.63) | 5.23 (0.45) | 5.09 (0.61) | 4.98 (0.80) | < 0.001 |
| SHR | 1.06 (0.23) | 0.84 (0.09) | 0.98 (0.03) | 1.08 (0.03) | 1.35 (0.26) | < 0.001 |
| Uric acid, mg/dL | 4.47 (1.25) | 4.44 (1.22) | 4.39 (1.21) | 4.40 (1.23) | 4.65 (1.33) | < 0.001 |
| eGFR, ml/minute/1.73 m2 | 100.60 (15.36) | 100.68 (15.24) | 101.34 (14.91) | 101.08 (14.97) | 99.28 (16.22) | < 0.001 |
Data are presented as the mean (SD) or number (%), as appropriate
BMI was calculated as weight in kilograms divided by height in meters squared. Obesity was defined as BMI ≥ 28.0 km/m2
SHR was calculated by the formula [FPG (mmol/L)]/[1.59 * HbA1c (%)-2.59]
SD standard deviation, BMI body mass index, SHR stress hyperglycemia ratio, eGFR estimated glomerular filtration rate
During a mean follow-up of 7.8 years, 1,084 participants developed T2D. Figure 1 displays the Kaplan–Meier curves of the cumulative incidence of T2D in the overall study participants. Table 2 shows the associations of the SHR index with incident T2D events. After adjusting for potential confounders (in model 2), people in the highest SHR quartile had a significantly higher risk of T2D onset compared to those in the lowest quartile (HR 1.48, 95% CI 1.26–1.75, P for trend < 0.001). The association magnitudes were similar in males and females. Similar results were observed when stratified by obesity and smoking status (Table S1). Figure 2 suggests a U-shaped dose-responsive relationships of SHR and T2D risk, and the inflection point of the lowest T2D risk was 1.
Fig. 1.
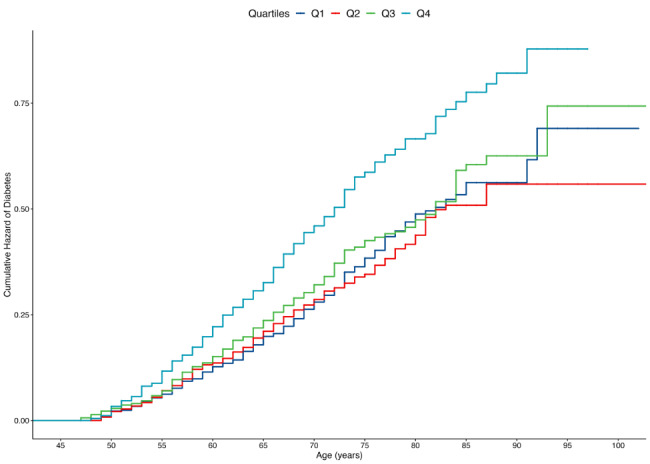
Cumulative hazard risk of diabetes by baseline SHR groups
Table 2.
Association of SHR and risk of diabetes stratified by sex, 2011 to 2020
| Model 1 | Model 2 | |||
|---|---|---|---|---|
| HR (95% CI) | P value | HR (95% CI) | P value | |
| Overall | ||||
| SHR, Q1 | 1 (reference) | |||
| Q2 | 0.964 (0.806–1.155) | 0.693 | 0.950 (0.793–1.137) | 0.574 |
| Q3 | 1.083 (0.908–1.291) | 0.374 | 1.037 (0.869–1.237) | 0.688 |
| Q4 | 1.512 (1.283–1.781) | < 0.001 | 1.483 (1.258–1.748) | < 0.001 |
| P for trend | < 0.001 | 1.164 (1.083–1.250) | < 0.001 | |
| Males | ||||
| SHR, Q1 | 1 (reference) | |||
| Q2 | 0.949 (0.715–1.259) | 0.716 | 0.913 (0.688–1.211) | 0.527 |
| Q3 | 1.198 (0.916–1.566) | 0.187 | 1.127 (0.86–1.476) | 0.385 |
| Q4 | 1.523 (1.186–1.956) | 0.001 | 1.486 (1.155–1.911) | 0.002 |
| P for trend | < 0.001 | 1.249 (1.116–1.397) | < 0.001 | |
| Females | ||||
| SHR, Q1 | 1 (reference) | |||
| Q2 | 0.971 (0.768–1.226) | 0.802 | 0.974 (0.771–1.231) | 0.826 |
| Q3 | 1.001 (0.792–1.262) | 0.998 | 0.971 (0.769–1.227) | 0.807 |
| Q4 | 1.530 (1.231–1.901) | < 0.001 | 1.493 (1.201–1.856) | < 0.001 |
| P for trend | < 0.001 | < 0.001 | ||
Model 1: age, sex were adjusted; model 2: further adjusting for residence, marriage, education level, smoking status, current drinking, obesity, hypertension and dyslipidemia
HR hazard ratio, CI confidence interval, SHR stress hyperglycemia ratio
Fig. 2.
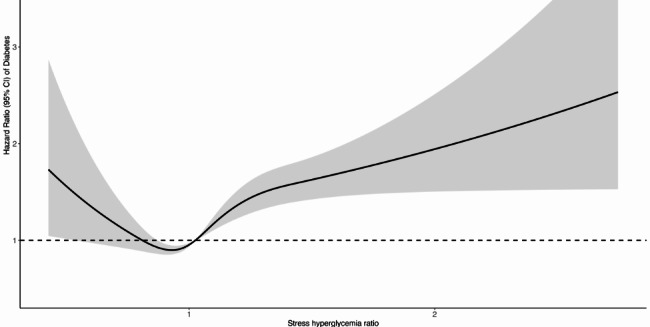
Dose–response relationship of risk of diabetes and SHR level. Cox proportional hazards regression models with restricted cubic spline (RCS) analyses were performed with four knots. The reference point is set as the median value of SHR
Results were consistent among sensitivity analyses. After repeating the analysis among 7,619 participants, people in the third quartile (HR 1.22, 95% CI 1.01–1.48, P for trend 0.04) and highest quartile (HR 1.60, 95% CI 1.28–1.99, P for trend < 0.001) of SHR had a significantly higher risk of T2D onset compared to those in the lowest. Figure S2 presents the Kaplan–Meier curves of the cumulative incidence of T2D and the competing risk of death. Using Fine-Gray sub-distribution models, the effect sizes of SHR quartiles were attenuated with statistical significance (Table S2). After additionally adjusting for FPG and HbA1c, SHR was still independently associated with a higher risk of T2D.
We calculated time-dependent Harrell’s C-indices to assess the predictive performance of the model for T2D incidence after adding SHR to fasting glucose and HbA1c (Fig. 3). These indices provide a measure of the model’s ability to discriminate between individuals who develop T2D and those who do not over time. By incorporating SHR, we observed an improvement in the C-indices, suggesting enhanced predictive accuracy of the model for incident T2D when accounting for acute hyperglycemia in addition to traditional glycemic markers. During the whole follow-up period, the C-indices significantly increased from 0.727 (95% CI 0.707–0.748) to 0.736 (95% CI 0.716–0.756) by DeLong Test (Z = − 2.492, P = 0.013).
Fig. 3.

Time-dependent predictive capacity of SHR beyond fasting glucose and HbA1c for predicting the onset of diabetes
Discussion
In this large, population-based cohort study, we found that an elevated SHR was independently associated with an increased risk of developing T2D. Participants in the highest quartile of SHR had a 60% greater risk of T2D onset compared to those in the lowest quartile, even after adjusting for fasting glucose and HbA1c levels. These findings suggest that SHR may reflect an aspect of metabolic stress not fully captured by traditional glycemic markers, i.e., glucose and HbA1c, thus offering additional prognostic value in predicting T2D.
Our findings align with prior research demonstrating SHR’s role in predicting adverse outcomes in critically ill patients [22, 23], further extending its relevance to T2D risk. SHR is a potential predictor of adverse outcomes in patients with sepsis [24], short-term and long-term all-cause mortality among acute myocardial infarction (AMI) patients [25], poor prognosis for patients with acute coronary syndrome [26, 27], delirium in older hospitalized patients [28], acute kidney injury in patients with congestive heart failure [29], and short -term mortality in patients in the cardiac ICU [30]. Among the community-based participants, Ding et al., found that SHR is related to all-cause and cardiovascular mortality in people living with diabetes or prediabetes based on the NHANES data [4]. Using the NHANES data, Fengjuan et al., found that SHR can be used as a predictor of diabetes mellitus mortality in the general adult population [31]. Our study extended the relevance of SHR to chronic metabolic health and highlighted its prognostic value in predicting T2D.
Stratified analyses by sex, obesity status, and smoking history revealed consistent associations, reinforcing the robustness of SHR as a predictor of T2D across different subgroups. Notably, the addition of SHR to predictive models incorporating fasting glucose and HbA1c improved the area under the curve (AUC), indicating that SHR adds discriminatory power for identifying individuals at higher risk for T2D. Similarly, the mortality prediction was improved in the diabetic individuals with the incorporation of SHR into the Global Registry of Acute Coronary Events (GRACE) score [5]. This has important clinical implications, as early identification of at-risk individuals could allow for timely intervention, potentially delaying or preventing the onset of T2D.
We observed a J-shaped association between SHR and T2D risk, highlighting the clinical importance of preventing hypoglycemia or the recognition of relative glucose insufficiency in those with high HbA1c. Consistent with our findings, a study reported the J-shaped associations with adverse clinical outcomes in diabetic inpatients with pneumonia [32]. The SHR also exhibited a U-shaped relationship with 28-day all-cause mortality and in-hospital mortality in critically ill patients with sepsis [24]. The U-shaped associations of SHR with all-cause mortality and diabetes mellitus mortality were also suggested [31]. Similarly, a U-shaped relationship between SHR and acute kidney injury in patients with congestive heart failure was observed, which signified a critical threshold at an SHR value of 0.98 [29]. Notably, we identified an inflection point at an SHR value of 1.0 for predicting the T2D onset in the general population.
The observed association between SHR and T2D can be explained by several potential mechanisms. SHR reflects the body’s acute glycemic response to stress, which may exacerbate underlying insulin resistance, a key driver of T2D development [33]. Stress hyperglycemia is independently related to levels of cortisol and cytokines that might impair glucose homeostasis [34, 35]. Systematic inflammation (white blood cells, neutrophil counts, neutrophil-to-lymphocyte ratio, C-reactive protein), closely associated with SHR, is a potential factor linking elevated SHR and risk of T2D [32, 36]. Elevated SHR could also signal a state of greater vulnerability to glycemic fluctuations, which over time, may contribute to beta-cell dysfunction and impaired glucose regulation [37]. Stress hyperglycemia and glycemic variability can both reflect dramatic increases and acute fluctuations in blood glucose [7].
Our study has several strengths, including its large sample size, long follow-up duration, and the use of a well-established cohort. However, some limitations should be considered. First, although SHR is a useful marker of acute hyperglycemia, it may not fully capture the complexity of long-term glycemic control, and the potential for reverse causation cannot be ruled out in observational studies. Additionally, we did not have data on certain lifestyle factors, such as diet and physical activity, which may influence SHR and T2D risk. Third, the diagnosis of T2D was self-reported due to that the medical records and regularly scheduled blood sampling tests were not available in the CHARLS. However, some other large-scale studies, such as the English Longitudinal Study of Aging, found that self-reported diagnosis of diseases had good agreement with medical records. Last, the results and implications regarding the SHR and T2D need further validation in other populations and ethnic groups.
In conclusion, this study provides evidence that SHR is a significant independent predictor of incident T2D. Incorporating SHR into clinical practice could enhance risk stratification for T2D. Future research should focus on elucidating the biological mechanisms underlying the relationship between SHR and T2D and determining whether interventions targeting acute hyperglycemia could mitigate long-term T2D risk.
Electronic supplementary material
Below is the link to the electronic supplementary material.
Acknowledgements
This study used data from China Health and Retirement Longitudinal Study (CHARLS). We would like to thank the CHARLS research team for the time and effort into the CHARLS project.
Author contributions
Literature search: CC. Cui, JY. Song, N. Han; Study conception and design: WQ. Xu, LY. Zhang; Data collection: C. Sheng; Data analysis and interpretation: CC. Cui, GD. Xin, XF. Cui; Manuscript writing and reviewing: CC. Cui; Study supervision: L. Liu, LL. Yu.
Funding
This work is supported by the Jilin Province Science Foundation (YDZJ202501ZYTS769) and Yangfan Project (XHYF202404).
Availability of data and materials
No datasets were generated or analysed during the current study.
Declarations
Competing interests
The authors declare no competing interests.
Footnotes
Publisher’s note
Springer Nature remains neutral with regard to jurisdictional claims in published maps and institutional affiliations.
Contributor Information
Guangda Xin, Email: xingd@jlu.edu.cn.
Xiaofeng Cui, Email: xfcui@jlu.edu.cn.
Lili Yu, Email: yulili@jlu.edu.cn.
References
- 1.Sun H, Saeedi P, Karuranga S, Pinkepank M, Ogurtsova K, Duncan BB, Stein C, Basit A, Chan JCN, Mbanya JC, et al. IDF diabetes atlas: global, regional and country-level diabetes prevalence estimates for 2021 and projections for 2045. Diabetes Res Clin Pract. 2022;183: 109119. [DOI] [PMC free article] [PubMed] [Google Scholar]
- 2.Yin B, Ding L, Chen Z, Chen Y, Zhu B, Zhu Y. Combining HbA1c and insulin resistance to assess the risk of gestational diabetes mellitus: a prospective cohort study. Diabetes Res Clin Pract. 2023;199: 110673. [DOI] [PubMed] [Google Scholar]
- 3.Vedantam D, Poman DS, Motwani L, Asif N, Patel A, Anne KK. Stress-induced hyperglycemia: consequences and management. Cureus. 2022;14(7): e26714. [DOI] [PMC free article] [PubMed] [Google Scholar]
- 4.Ding L, Zhang H, Dai C, Zhang A, Yu F, Mi L, Qi Y, Tang M. The prognostic value of the stress hyperglycemia ratio for all-cause and cardiovascular mortality in patients with diabetes or prediabetes: insights from NHANES 2005–2018. Cardiovasc Diabetol. 2024;23(1):84. [DOI] [PMC free article] [PubMed] [Google Scholar]
- 5.Luo J, Xu S, Li H, Li Z, Gong M, Qin X, Zhang X, Hao C, Liu X, Zhang W, et al. Prognostic impact of stress hyperglycemia ratio in acute myocardial infarction patients with and without diabetes mellitus. Nutr Metab Cardiovasc Dis. 2022;32(10):2356–66. [DOI] [PubMed] [Google Scholar]
- 6.Zhou Q, Yang J, Wang W, Shao C, Hua X, Tang YD. The impact of the stress hyperglycemia ratio on mortality and rehospitalization rate in patients with acute decompensated heart failure and diabetes. Cardiovasc Diabetol. 2023;22(1):189. [DOI] [PMC free article] [PubMed] [Google Scholar]
- 7.He HM, Zheng SW, Xie YY, Wang Z, Jiao SQ, Yang FR, Li XX, Li J, Sun YH. Simultaneous assessment of stress hyperglycemia ratio and glycemic variability to predict mortality in patients with coronary artery disease: a retrospective cohort study from the MIMIC-IV database. Cardiovasc Diabetol. 2024;23(1):61. [DOI] [PMC free article] [PubMed] [Google Scholar]
- 8.Zeng G, Song Y, Zhang Z, Xu J, Liu Z, Tang X, Wang X, Chen Y, Zhang Y, Zhu P, et al. Stress hyperglycemia ratio and long-term prognosis in patients with acute coronary syndrome: a multicenter, nationwide study. J Diabetes. 2023;15(7):557–68. [DOI] [PMC free article] [PubMed] [Google Scholar]
- 9.Zhao Y, Hu Y, Smith JP, Strauss J, Yang G. Cohort profile: the China health and retirement longitudinal study (CHARLS). Int J Epidemiol. 2014;43(1):61–8. [DOI] [PMC free article] [PubMed] [Google Scholar]
- 10.Gao K, Cao LF, Ma WZ, Gao YJ, Luo MS, Zhu J, Li T, Zhou D. Association between sarcopenia and cardiovascular disease among middle-aged and older adults: findings from the China health and retirement longitudinal study. EClinicalMedicine. 2022;44: 101264. [DOI] [PMC free article] [PubMed] [Google Scholar]
- 11.Wu Z, Zhang H, Miao X, Li H, Pan H, Zhou D, Liu Y, Li Z, Wang J, Liu X, et al. High-intensity physical activity is not associated with better cognition in the elder: evidence from the China health and retirement longitudinal study. Alzheimers Res Ther. 2021;13(1):182. [DOI] [PMC free article] [PubMed] [Google Scholar]
- 12.Cui C, Liu L, Qi Y, Han N, Xu H, Wang Z, Shang X, Han T, Zha Y, Wei X, et al. Joint association of TyG index and high sensitivity C-reactive protein with cardiovascular disease: a national cohort study. Cardiovasc Diabetol. 2024;23(1):156. [DOI] [PMC free article] [PubMed] [Google Scholar]
- 13.Cui C, Liu L, Zhang T, Fang L, Mo Z, Qi Y, Zheng J, Wang Z, Xu H, Yan H, et al. Triglyceride-glucose index, renal function and cardiovascular disease: a national cohort study. Cardiovasc Diabetol. 2023;22(1):325. [DOI] [PMC free article] [PubMed] [Google Scholar]
- 14.Roberts GW, Quinn SJ, Valentine N, Alhawassi T, O’Dea H, Stranks SN, Burt MG, Doogue MP. Relative hyperglycemia, a marker of critical illness: introducing the stress hyperglycemia ratio. J Clin Endocrinol Metab. 2015;100(12):4490–7. [DOI] [PubMed] [Google Scholar]
- 15.Zou X, Zhou X, Zhu Z, Ji L. Novel subgroups of patients with adult-onset diabetes in Chinese and US populations. Lancet Diabetes Endocrinol. 2019;7(1):9–11. [DOI] [PubMed] [Google Scholar]
- 16.Song Y, Zhu C, Shi B, Song C, Cui K, Chang Z, Gao G, Jia L, Fu R, Dong Q, et al. Social isolation, loneliness, and incident type 2 diabetes mellitus: results from two large prospective cohorts in Europe and East Asia and Mendelian randomization. EClinicalMedicine. 2023;64: 102236. [DOI] [PMC free article] [PubMed] [Google Scholar]
- 17.Fernandez JR, Montiel Ishino FA, Williams F, Slopen N, Forde AT. Hypertension and diabetes status by patterns of stress in older adults from the US health and retirement study: a latent class analysis. J Am Heart Assoc. 2022;11(12): e024594. [DOI] [PMC free article] [PubMed] [Google Scholar]
- 18.Heisler M, Cole I, Weir D, Kerr EA, Hayward RA. Does physician communication influence older patients’ diabetes self-management and glycemic control? Results from the health and retirement study (HRS). J Gerontol A Biol Sci Med Sci. 2007;62(12):1435–42. [DOI] [PubMed] [Google Scholar]
- 19.He W, Li Q, Yang M, Jiao J, Ma X, Zhou Y, Song A, Heymsfield SB, Zhang S, Zhu S. Lower BMI cutoffs to define overweight and obesity in China. Obesity (Silver Spring). 2015;23(3):684–91. [DOI] [PubMed] [Google Scholar]
- 20.Thiébaut AC, Bénichou J. Choice of time-scale in Cox’s model analysis of epidemiologic cohort data: a simulation study. Stat Med. 2004;23(24):3803–20. [DOI] [PubMed] [Google Scholar]
- 21.DeLong ER, DeLong DM, Clarke-Pearson DL. Comparing the areas under two or more correlated receiver operating characteristic curves: a nonparametric approach. Biometrics. 1988;44(3):837–45. [PubMed] [Google Scholar]
- 22.Zhang C, Shen HC, Liang WR, Ning M, Wang ZX, Chen Y, Su W, Guo TT, Hu K, Liu YW. Relationship between stress hyperglycemia ratio and allcause mortality in critically ill patients: results from the MIMIC-IV database. Front Endocrinol (Lausanne). 2023;14:1111026. [DOI] [PMC free article] [PubMed] [Google Scholar]
- 23.Huang YW, An YH, Yin XS, Li ZP. Association of the stress hyperglycemia ratio and clinical outcomes in patients with cardiovascular diseases: a systematic review and meta-analysis. Eur Rev Med Pharmacol Sci. 2022;26(24):9258–69. [DOI] [PubMed] [Google Scholar]
- 24.Yan F, Chen X, Quan X, Wang L, Wei X, Zhu J. Association between the stress hyperglycemia ratio and 28-day all-cause mortality in critically ill patients with sepsis: a retrospective cohort study and predictive model establishment based on machine learning. Cardiovasc Diabetol. 2024;23(1):163. [DOI] [PMC free article] [PubMed] [Google Scholar]
- 25.Liu J, Zhou Y, Huang H, Liu R, Kang Y, Zhu T, Wu J, Gao Y, Li Y, Wang C, et al. Impact of stress hyperglycemia ratio on mortality in patients with critical acute myocardial infarction: insight from American MIMIC-IV and the Chinese CIN-II study. Cardiovasc Diabetol. 2023;22(1):281. [DOI] [PMC free article] [PubMed] [Google Scholar]
- 26.Yang J, Zheng Y, Li C, Gao J, Meng X, Zhang K, Wang W, Shao C, Tang YD. The impact of the stress hyperglycemia ratio on short-term and long-term poor prognosis in patients with acute coronary syndrome: insight from a large cohort study in Asia. Diabetes Care. 2022;45(4):947–56. [DOI] [PubMed] [Google Scholar]
- 27.Xu W, Song Q, Wang X, Zhao Z, Meng X, Xia C, Xie Y, Yang C, Guo Y, Zhang Y, et al. Association of stress hyperglycemia ratio and in-hospital mortality in patients with coronary artery disease: insights from a large cohort study. Cardiovasc Diabetol. 2022;21(1):217. [DOI] [PMC free article] [PubMed] [Google Scholar]
- 28.Song Q, Dai M, Zhao Y, Lin T, Huang L, Yue J. Association between stress hyperglycemia ratio and delirium in older hospitalized patients: a cohort study. BMC Geriatr. 2022;22(1):277. [DOI] [PMC free article] [PubMed] [Google Scholar]
- 29.Li L, Ding L, Zheng L, Wu L, Hu Z, Liu L, Yao Y. Relationship between stress hyperglycemia ratio and acute kidney injury in patients with congestive heart failure. Cardiovasc Diabetol. 2024;23(1):29. [DOI] [PMC free article] [PubMed] [Google Scholar]
- 30.Li L, Ding L, Zheng L, Wu L, Hu Z, Liu L, Zhang Z, Zhou L, Yao Y. U-shaped association between stress hyperglycemia ratio and risk of all-cause mortality in cardiac ICU. Diabetes Metab Syndr. 2024;18(1): 102932. [DOI] [PubMed] [Google Scholar]
- 31.Yan F, Zhao L, Quan X, Zhu J. Association between stress hyperglycemia ratio and diabetes mellitus mortality in American adults: a retrospective cohort study and predictive model establishment based on machine learning algorithms (NHANES 2009–2018). Diabetol Metab Syndr. 2024;16(1):79. [DOI] [PMC free article] [PubMed] [Google Scholar]
- 32.Liu B, Chen Y, Yu L, Zhou M. Stress hyperglycemia ratio is associated with systemic inflammation and clinical outcomes in diabetic inpatients with pneumonia on admission. J Diabetes. 2023;15(7):545–56. [DOI] [PMC free article] [PubMed] [Google Scholar]
- 33.Barbu E, Mihaila A, Filippi A, Stoenescu A, Ciortan L, Butoi E, Beiu C, Popescu MN, Balanescu S. Stress, hyperglycemia, and insulin resistance correlate with neutrophil activity and impact acute myocardial infarction outcomes. Cureus. 2024;16(7): e63731. [DOI] [PMC free article] [PubMed] [Google Scholar]
- 34.Da Porto A, Tascini C, Colussi G, Peghin M, Graziano E, De Carlo C, Bulfone L, Antonello M, Sozio E, Fabris M, et al. Relationship between cytokine release and stress hyperglycemia in patients hospitalized with COVID-19 infection. Front Med (Lausanne). 2022;9: 988686. [DOI] [PMC free article] [PubMed] [Google Scholar]
- 35.Bordbar MR, Taj-Aldini R, Karamizadeh Z, Haghpanah S, Karimi M, Omrani GH. Thyroid function and stress hormones in children with stress hyperglycemia. Endocrine. 2012;42(3):653–7. [DOI] [PubMed] [Google Scholar]
- 36.Feng X, Yu F, Wei M, Luo Y, Zhao T, Liu Z, Huang Q, Tu R, Li J, Zhang B, et al. The association between neutrophil counts and neutrophil-to-lymphocyte ratio and stress hyperglycemia in patients with acute ischemic stroke according to stroke etiology. Front Endocrinol (Lausanne). 2023;14:1117408. [DOI] [PMC free article] [PubMed] [Google Scholar]
- 37.Rakipovski G, Raun K, Lykkesfeldt J. Fluctuating hyperglycaemia increases oxidative stress response in lean rats compared to sustained hyperglycaemia despite lower glycaemic exposure. Diab Vasc Dis Res. 2011;8(4):295–8. [DOI] [PubMed] [Google Scholar]
Associated Data
This section collects any data citations, data availability statements, or supplementary materials included in this article.
Supplementary Materials
Data Availability Statement
No datasets were generated or analysed during the current study.