Abstract
We have studied the binding of neomycin to a 171mer RNA (ψ-RNA) from the packaging region of the LAI strain of human immunodeficiency virus type-1, HIV-1 (LAI). The RNase I footprinting studies reveal that the primary binding site for the drug is in stem–loop 1, which contains the dimer initiation site of HIV-1. Loading this site with neomycin causes a structural change in the RNA, allowing nucleotides in the neighboring stem–loop 2 to participate in the drug site. Drug binding to secondary sites induces structural changes in other stem–loops of the RNA. Footprinting plots, showing cutting at a site as a function of drug concentration, were analyzed using a two-state model to obtain relative site-specific binding constants. Circular dichroism measurements show that neomycin binding to ψ-RNA changes the intensity of the strong negative CD band at 208 nm, confirming that neomycin induces structural changes. Melting studies of the RNA showed melting transitions in the absence of drug at 28.2, 37.2, 47.4, 55.5 and 60.8°C. Only the first two were affected by drug binding, the reason for this being explained by our analysis.
INTRODUCTION
The possibility of targeting RNA with drugs as a means of controlling viral infections is gaining considerable attention (1–5). Similarly to proteins, large RNA molecules fold into complex structures providing unique binding surfaces for drugs. Since RNA function often depends on folding and the folded structure of RNA depends on sequence, it may be possible to design agents that control RNA function by targeting specific RNA structures.
The aminoglycosides are drugs which bind to RNA (4,5). Interest in these agents stems from their well-known antibacterial effects, which they exert by binding to the A-site on rRNA and blocking protein synthesis. Since the aminoglycosides can easily change their shape, they can bind to a variety of different RNA sites. While much has been learned about aminoglycosides interacting with small RNA molecules (6–16), less is known about their ability to bind to and change the structure of large RNA targets.•
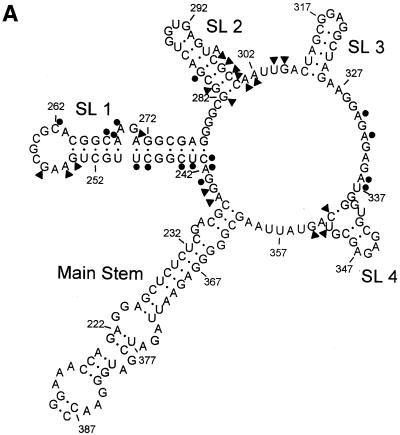
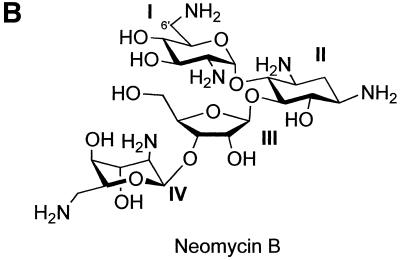
Earlier, we outlined the theory and experimental procedures for obtaining binding constants from aminoglycoside–RNA footprinting data (17,18) and absorption measurements (19). We studied a segment of RNA from the packaging region or ψ element of HIV-1 (strain LAI) (Fig. 1A) (20). Since this region of RNA is important in a number of steps in the life cycle of the virus (21), it is a potential target for AIDS-directed drugs. In this report we have studied binding of the aminoglycoside drug neomycin B (Fig. 1B) to the ψ-RNA, using quantitative RNase I footprinting, circular dichroism (CD) and UV melting techniques.
Figure 1.
(A) The proposed structure of the ψ-RNA. It includes: a main stem, formed by HIV-1 (LAI) coding sequences, flanking SL 1 and SL 4; SL 1, which contains the dimer initiation site, 5′-GCGCGC; SL 2, which has the 5′ splice donor site of HIV; SL 3, SL 4 and the start codon of the gag gene at positions 236–238. The circles indicate nucleotides that are involved in binding neomycin, i.e. exhibit type 1 footprinting plots. The triangles indicate nucleotides that exhibit structural changes (enhancements) in the presence of neomycin, i.e. type 2 or type 3 footprinting plots. (B) The structure of neomycin B.
MATERIALS AND METHODS
Footprinting
The RNA was synthesized using template DNA and T7 RNA polymerase in the presence of the four ribonucleotide triphosphates and, after purification, was 5′-end-labeled with 32P (17,18). Analysis revealed that although a 176mer was targeted, a pentamer in the DNA template was not transcribed. The ψ-RNA is a 171mer, missing the sequence 5′-AAAUU at positions 303–307 of the HIV (LAI) genome. This is reflected in the indexing shown in Figure 1A.
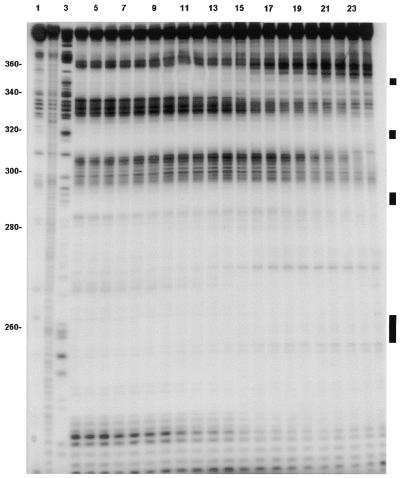
The footprinting experiments were carried out in a total volume of 10 µl in 10 mM Tris–HCl pH 7 buffer (17,18). The enzyme RNase I was chosen over other enzymes and chemical cleavage agents because it cuts at many sites in the RNA and exhibits reproducible cleavage characteristics, essential for quantitative studies. The footprinting solutions were made by adding a small amount of radiolabeled RNA (∼0.05 µM) to 1.1 µM unlabeled RNA (ɛ260 = 1.2 × 10⁶ M–1 cm–1), adding drug, waiting 30 min for equilibration and adding 1 µl of the enzyme (0.04 U). The cutting reactions, conducted at room temperature (∼21°C), were stopped by addition of 5 µl of 8 M urea (National Diagnostics) loading buffer. Prior to denaturing PAGE, samples were heated to 95°C for 5 min and immediately placed on ice. A 9% gel allowed for separation of the smaller (<100 nt), fast migrating oligonucleotides, whereas a 6% gel was used to resolve the larger oligomers (>100 nt). Binding/enhancement events could be detected in the region from 230 to ∼380 of the RNA. After electrophoresis, the radioactive fragments were detected by autoradiography and the resulting photographic film (Figs 2 and 3) scanned to obtain spot intensities (17,18). The intensities were corrected for cutting and loading errors for each lane (<15%) and control lane intensities were subtracted. The resulting intensities, plotted versus drug concentration for each RNase I cutting site on the 171mer, yield the footprinting plots. Some are shown in Figure 4 and all are summarized in Table 1. They were analyzed as described below.
Figure 2.
Footprinting autoradiogram (6% polyacrylamide gel) of neomycin B and ψ-RNA using RNase I as the cleavage agent. Lane 1, RNA alone; lane 2, base hydrolysis ladder; lane 3, a G ladder generated using RNase T1. Other lanes contain neomycin B concentrations (µM) as follows: lane 4, 0; lane 5, 1; lane 6, 2; lane 7, 3; lane 8, 4; lane 9, 5; lane 10, 6; lane 11, 7; lane 12, 8; lane 13, 9; lane 14, 10; lane 15, 11; lane 16, 12; lane 17, 13; lane 18, 14; lane 19, 15; lane 20, 16; lane 21, 17; lane 22, 18; lane 23, 20; lane 24, 25. The black bars on the right show approximate locations of the loops for SL 1 (bottom), SL 2, SL 3 and SL 4 (top).
Figure 3.
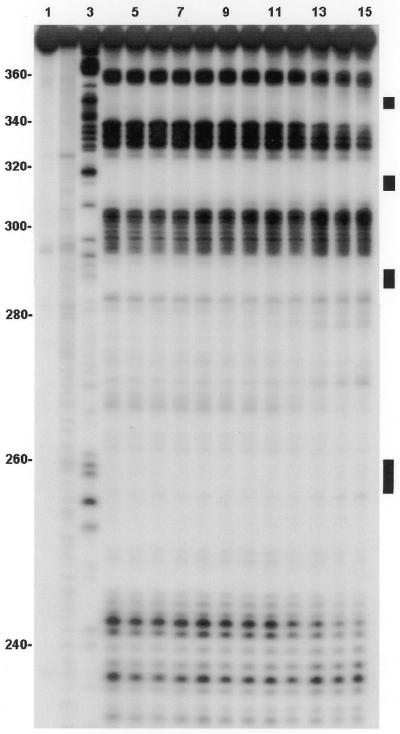
Footprinting autoradiogram (9% polyacrylamide gel) of neomycin B and ψ-RNA using RNase I as the cleavage agent. Lane 1, RNA alone; lane 2, base hydrolysis ladder; lane 3, a G ladder generated using RNase T1. Other lanes contain neomycin B concentrations (µM) as follows: lane 4, 0; lane 5, 1; lane 6, 2; lane 7, 3; lane 8, 4; lane 9, 5; lane 10, 6; lane 11, 7; lane 12, 8; lane 13, 10; lane 14, 12; lane 15, 14. Black bars on the right identify the loop regions of SL 1 (bottom), SL 2, SL 3 and SL 4 (top).
Figure 4.
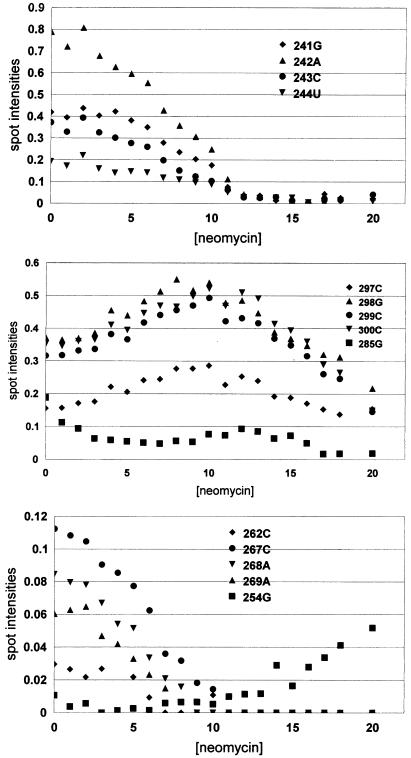
Selected footprinting plots (spot intensity versus µM drug concentration) of neomycin B interacting with ψ-RNA using RNase I as the cleavage agent. The site numbers refer to Figure 1A.
Table 1. Summary of footprinting plot behaviors.
| From 9% gel | From 6% gel | ||
|---|---|---|---|
| Site | Typea | Site | Typea |
| 235A | 4 | ||
| 236C | 4 | ||
| 237G | 4 | ||
| 238C | 4 | ||
| 239A | 3 | ||
| 240G | 3 | ||
| 241G | 1 | 241G | 1c |
| 242A | 1 | 242A | 1c |
| 243C | 1 | 243C | 1c |
| 244U | 1 | 244U | 1c |
| 245C | 1 | 245C | 1c |
| 248C | 1 | 248C | 1c |
| 249U | 1 | 249U | 1c |
| 254G | 3 | 254G | 3 |
| 255A | 3 | 255A | 3 |
| 257G | 3 | ||
| 262C | 1 | 262C | 1d |
| 267C | 1 | 267C | 1d |
| 268A | 1 | 268A | 1d |
| 269A | 1 | 269A | 1d |
| 271A | 3 | 271A | 3 |
| 282G | 3b | 282G | 2 |
| 283G | 2 | ||
| 285G | 1e, 2 | ||
| 297C | 2 | ||
| 298G | 2 | ||
| 299C | 2 | ||
| 300C | 2 | ||
| 301A | 2 | ||
| 302A | 2 | ||
| 309U | 2 | ||
| 310G | 2 | ||
| 330A | 1f | ||
| 332A | 1f | ||
| 336A-337U | 1f | ||
| 338–340G | 4 | ||
| 351U | 3 | ||
| 352C | 3 | ||
| 354G | 3 | ||
aType 1 plots show intensity decreasing with drug concentration. Type 2 plots show intensity increasing with drug concentration to a maximum, followed by a decrease. Type 3 plots show intensity increasing with drug concentration for the entire range investigated. Type 4 plots show no systematic change in intensity with drug concentration.
bThis may in fact be type 2, as found for the 6% gel, but the 9% gel does not go to as high a drug concentration as does the 6% gel.
cK = 2.7 × 10⁵ M–1.
dK = 4.5 × 10⁵ M–1.
eK = 5.6 × 10⁵ M–1.
fK = 1.2 × 10⁵ M–1.
Circular dichroism
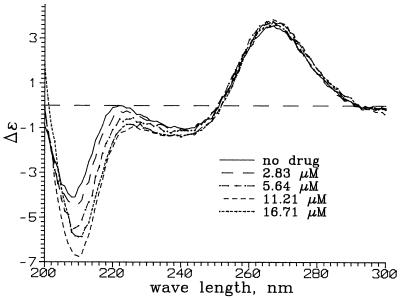
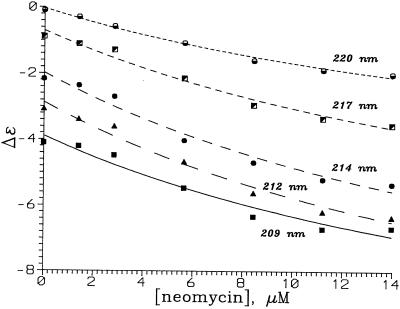
The CD spectra were collected at room temperature (21 ± 0.2°C) using an Aviv model 202 CD instrument. Scans were from 300 to 200 nm with a resolution of 1 nm, with data sampling every 2 s. The 1 cm cell contained 250 µl of a 0.5 µM solution of the RNA in 10 mM Tris–HCl pH 7 buffer. Control experiments showed that the spectroscopic changes occurred within the time of mixing after addition of the drug. The final neomycin concentrations for the solutions were 0, 1.4, 2.8, 5.6, 8.4, 11.2, 14.0, 16.7, 19.4, 22.1, 24.8, 27.5 and 32.8 µM. The spectra were corrected for dilution, which was <10% at the end of the titration. The value of Δɛ, in M–1 cm–1 nucleotide–1, was calculated using Δɛ = ψ/(32.98)(171)lM, where ψ is the observed ellipticity in degrees, l is the path length and M is the concentration of the RNA in mol l–1. Neomycin itself does not exhibit a CD spectrum in the wavelength range studied. The CD spectra of the ψ-RNA in the presence of various amounts of neomycin are shown in Figure 5 and CD as a function of drug concentration for selected wavelengths is shown in Figure 6.
Figure 5.
CD spectra of ψ-RNA in the presence of neomycin B. The quantity Δɛ has units of M–1 cm–1 nucleotide–1.
Figure 6.
Plots showing Δɛ (M–1 cm–1 nucleotide–1) as a function of neomycin concentration at different wavelengths. Lines are best fits to the two-state model using a single K for all wavelengths.
UV melting studies
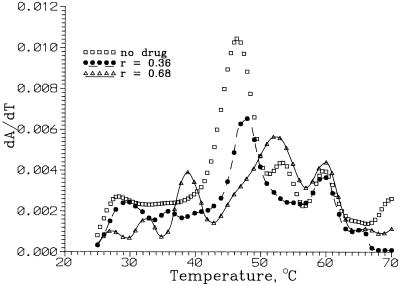
The UV melting data were obtained using a Beckman Coulter DU 640 spectrophotometer at 260 nm. The melting studies were carried out in the temperature range 20–80°C using a scan rate of 0.2°C min–1. Samples were prepared by briefly degassing 520 µl of the 10 mM Tris–HCl pH 7 buffer using a vacuum, adding 1.7 µl of a stock RNA solution and mixing using a micropipette. A 250 µl aliquot was transferred into each of two 1 cm path length cells and the concentration of RNA (0.5 µM) determined optically. After addition of a small amount of a stock solution of the drug (neomycin does not absorb at 260 nm) and mixing with a micropipette, the solution was equilibrated for 20 min prior to carrying out the melting experiment. The values of [drug]/[RNA] were 0, 0.20, 0.25, 0.36, 0.50, 0.68, 0.75 and 1.0. After correcting the absorbance data for dilution due to addition of the drug (<2%), the first derivative of absorbance with respect to temperature, dA/dT, was calculated using Lagrange interpolation. Three plots of dA/dT are shown in Figure 7. Each plot was fitted to a sum of Gaussians using Peak Fit 4 (Jandel Scientific). The melting temperatures were the positions of these peaks.
Figure 7.
Representative first derivative melting curves, dA/dT, for ψ-RNA in the absence and presence of neomycin B (r = [neomycin]/[RNA]). A is absorbance at 260 nm. Each is a least squares fit to a sum of Gaussian peaks. For the r = 0 curve, the peaks are centered at 28.2, 37.2, 47.4, 55.5 and 60.8°C. Peak centers for the other curves are in Table 2.
RNA secondary structure prediction
A prediction of the secondary structure of the ψ-RNA was obtained using the Mfold v.3.0 algorithm offered at http://bioinfo.math.rpi.edu (22). Folding was done at 37°C with 1 M NaCl, specifying that the regions between stem–loop 3 (SL 3) and SL 4, and SL 4 and the main stem, be single stranded. These constraints are consistent with the cutting pattern of RNase I in these regions. The lowest energy structure found using Mfold (see Fig. 1A) has the four major features, SL 1 to SL 4, found by Clever et al. (20) and Zeffman et al. (23) in the packaging region. The presence of SL 1 to SL 4 in the ψ-RNA is consistent with cutting by RNase T1 at the guanine sites in the loops (18). Cutting by RNase T1 in the loop of SL 1 (see Figs 2 and 3) indicates that the loop is single stranded and that the RNA is monomeric. The monomeric form of ψ-RNA is consistent with our earlier work on monomer/dimer equilibria of HIV sequences (24). The work of Muriaux et al. (25) also showed that, under the conditions of our footprinting studies, long RNA transcripts from the packaging region are monomeric. Furthermore, a transcript related to ψ-RNA (156mer) was found to be monomeric under the conditions of our footprinting experiments (A. Paoletti, personal communication).
Since the footprinting and CD studies in this report were done at a different temperature (21°C) and ionic strength (10 mM Tris–HCl pH 7) from those employed in the folding program Mfold (22), the true secondary structure of the ψ-RNA is unknown. The structure in Figure 1A should be considered a ‘working model’ on which binding/structural information for neomycin are summarized.
RESULTS
Footprinting
Some of the footprinting plots obtained from the 6% and 9% gels are shown in Figure 4. The behavior of each of the plots is summarized in Table 1. It is clear that the primary binding site for neomycin is mostly located in the loop and stem region of SL 1. Four nucleotides in this region, C262, C267, A268 and A269, exhibit decreased cutting as drug is added to the system (type 1 behavior). A site in SL 2, G285, also exhibits type 1 behavior. Secondary binding sites, with lower values of K, affect nucleotides G241, A242, C243, U244, C245, C248, U249, A330, A332, A336 and U337. The latter are mainly located in the linker region between the main stem and SL 1 and in the region between SL 3 and SL 4 (Fig. 1A).
Apparent binding constants for these sites were calculated using the previously described two-state model (18), which assumes that only a single site binds the drug. This is the case for the primary binding site. For a secondary site, the total drug concentration in the model should be reduced by the amount of drug already bound to stronger sites, i.e. by the RNA concentration; the correction is small. For the sites G241–U249, grouped together, the model yielded K = 2.7 × 10⁵ M–1; for the sites C262–A269, grouped together, it yielded K = 4.5 × 10⁵ M–1 (primary binding site). Site G285 gave K = 5.6 × 10⁵ M–1 and the sites A330–U337, grouped together, yielded K = 1.2 × 10⁵ M–1. The relative uncertainty in each K, estimated as the change which increases the deviation of calculated from experimental intensities by 10%, is about one-third.
Binding of neomycin to ψ-RNA produces two kinds of enhancement footprinting plots. Nucleotides that exhibit type 2 plots (cutting intensity increases with drug concentration to a maximum, followed by a decrease) are G282, G283, C297, G298, C299, C300, A301, A302, U309 and G310. These sites, located in the lower stem portion of SL 2 and in the region between SL 2 and SL 3, experience a structural change as the highest affinity site in the stem of SL 1 binds neomycin. Sites that exhibit type 3 footprinting plots (intensity increases with drug concentration for the entire range investigated) are A239, G240, G254, A255, G257, A271, U351, C352 and G354. They are in the ‘linker’ between the main stem and SL 1, in the loop and stem of SL 1 and near SL 4. For all the type 3 sites, the increase in cutting is small at low drug concentration, indicating that they experience little change in structure while the highest affinity site in SL 1 is loading drug. However, cutting at these sites increases more rapidly with drug concentrations >9 µM, indicating that later drug binding events cause these nucleotides to undergo a structural change. In this range of drug concentration, the type 2 sites in SL 2 exhibit decreased cutting. Site G285 exhibits unusual behavior (Fig. 4). At low drug concentration it exhibits strong binding (K = 5.6 × 10⁵ M–1), but at higher drug concentration, cutting at the site increases and finally decreases. This nucleotide appears to be involved in the high affinity drug site in the stem of SL 1, but drug binding to a secondary site may cause a structural change which makes G285 accessible to cleavage by RNase I. Some nucleotides (A235, C236, G237, C238 and G338–340), in the main stem and near SL 4, show no change in RNase I cutting intensity with neomycin concentration.
Circular dichroism
CD spectra of the ψ-RNA in the presence of neomycin are shown in Figure 5. The spectrum of the RNA is A-form (26), with a strong positive band at 266 nm, a strong negative band at 208 nm and a weaker negative band at ∼240 nm. Neomycin in the concentration range 0–14 µM intensifies the band at 208 nm. We fitted CD intensities for 17 wavelengths in the region 204–220 nm and drug concentrations 0, 1.4, 2.8, 5.1, 8.4, 11.2 and 14 µM to a two-state binding model, assuming a single value of K. The best fit was obtained for K = 4.4 × 10⁵ M–1. The CD changes at high drug concentration (loss of band intensity) were not analyzed. Unlike the case of paromomycin (18), CD does not show evidence for a stronger neomycin binding event at low drug concentration.
UV melting studies
Figure 7 shows melting profiles (dA/dT) for RNA alone and RNA with two different neomycin concentrations. Temperatures of melting transitions were obtained from fits of dA/dT to a sum of Gaussians. For RNA alone, four determinations were made. All showed a strong melting transition at 47.4 ± 1.0°C (T3) and four weaker transitions at 28.2 ± 0.8°C (T1), 37.2 ± 1.8°C (T2), 55.5 ± 1.4°C (T4) and 60.8 ± 1.2°C (T5). Table 2 shows melting temperatures for various r = [drug]/[RNA]. Errors are probably ∼1°C. It is seen that T1 increases with r, leveling off at ∼31°C for r ≈ 0.3. The second temperature T2 increases with r more rapidly than T1, leveling off at ∼40°C for r ≈ 0.2. The temperatures of the other three transitions are not much changed by added neomycin.
Table 2. Melting transitions for ψ-RNA in the presence of neomycin.
| r valuea | T1 | T2 | T3 | T4 | T5 |
|---|---|---|---|---|---|
| 0.0b | 28.2 ± 0.8 | 37.2 ± 1.8 | 47.4 ± 1.0 | 55.5 ± 1.4 | 60.8 ± 1.2 |
| 0.20 | 29.0 | 40.6 | 47.6 | 54.8 | 60.6 |
| 0.25 | 30.8 | 40.6 | 47.4 | 56.2 | 65.2 |
| 0.36 | 32.4 | 38.8 | 46.5 | 52.8 | 60.0 |
| 0.50 | 31.9 | 40.1 | 47.7 | 53.4 | 59.0 |
| 0.68 | 32.2 | 38.5 | 50.4 | 54.2 | 60.2 |
| 0.75 | 28.7 | 36.0 | 48.6 | 53.6 | 59.7 |
| 1.00 | 30.6 | 36.3 | 48.8 | 55.1 | 61.0 |
ar is the ratio of drug concentration to RNA concentration.
bAverage and standard deviation of four runs.
DISCUSSION
Three experimental techniques have been employed to study the binding of neomycin B to the packaging region of HIV-1. Each gives somewhat different information about the effects of binding. Footprinting is the only technique capable of revealing the location of drug binding on the ψ-RNA.
From the type 1 footprinting plots (decreased cutting with increased drug concentration), nucleotides at positions 241–249, 262–269, 330–337 and 285 are blocked by neomycin binding. By fitting a two-state model to the footprinting plots for each region, site-specific drug binding constants may be determined. For the three regions and 285 we found K = 2.7 × 10⁵, 4.5 × 10⁵, 1.2 × 10⁵ and 5.6 × 10⁵ M–1, respectively.
If there is competition between neomycin and RNase I for a site, the binding constants derived from footprinting data will be lower than the true values. Evidence for competition is that the values of K obtained from the footprinting experiments are much lower than those obtained for neomycin interacting with small RNA constructs (27,28). While it may be argued that the differences in K are due to the different RNA targets used, the footprinting-derived binding constant of paromomycin toward Ψ-RNA is also lower than its true value (18), obtained using CD and absorption, by more than an order of magnitude. As expected, the largest binding constant for neomycin is higher, by a factor of three, than the largest K for paromomycin. This is probably related to the fact that of the two drugs, neomycin has the greater positive charge (27,28).
Interestingly, the primary binding site for neomycin, at nucleotides 262–269 in the stem of SL 1 and at 285 in SL 2, is a secondary binding site for paromomycin (18). Since the only difference between the two drugs is the group on the 6′ position of ring I (Fig. 1B) (for neomycin, an amino group; for paromomycin, a hydroxyl), the difference in specificity between the drugs is surprising. It is strongly suggested that ring I of the drug faces towards RNA (6–8,10) and not into the solvent, as is the case for neomycin bound to the tau exon 10 splicing regulatory element (9). The diversity of interaction sequences and bound drug conformations for the aminoglycosides (6–10) make it impossible to speculate on the structure of the neomycin–ψ-RNA complex based on footprinting data.
Type 2 footprinting plots, for which cutting increases with drug concentration, reaches a maximum and decreases (Fig. 4), are common with neomycin. The increase appears to be due to a structural change in the RNA induced by drug binding at a location other than that being observed. The subsequent decrease may be due to another structural change caused by drug binding to a secondary site or to drug binding at the observed site. As noted below, the former is more likely for neomycin binding to the ψ-RNA. The structural change causing increased cleavage, by making nucleotides in SL 2 more accessible, occurs over the range of drug concentrations for which the highest affinity site binds drug. While this site involves nucleotides in SL 1, G285 or the nearby looped-out nucleotide A296 may also be involved. As shown in Figure 4, G285 exhibits a sharp decrease in cutting while C262, C267, A268 and A269 exhibit strong decreases, indicating that part of SL 2 is involved in the primary site. As these sites bind drug, nucleotides in the lower stem region of SL 2 and between SL 2 and SL 3 undergo a structural change. The change may be caused by G285 moving to the drug site in SL 1. Interestingly, in the drug concentration range 6–12 µM cutting at G285 increases (Fig. 4), indicating that loading secondary sites with neomycin makes G285 accessible to cleavage by RNase I.
Structural changes similar to those observed with ψ-RNA, but on a smaller scale, occur with neomycin interacting with a small RNA aptamer (8). In the neomycin–aptamer complex the drug is encapsulated in a binding pocket by a looped-out RNA base, which serves as a cap to anchor the drug in place. Binding of neomycin to the aptamer causes part of the RNA to rearrange to form a cap for the drug. Interestingly, we see little structural change for nucleotides near the primary site (G254, A255, G257 and A271) or for those farther away in sequence (A239, G240, U351, C352 and G354) when the primary site is loading with drug. These nucleotides give type 3 footprinting plots with a modest increase in cutting for low drug concentrations. For drug concentrations for which the secondary sites bind neomycin, the nucleotides in the stem of SL 2 and sites having type 3 plots undergo additional structural change.
The CD studies were undertaken to verify the existence of drug-induced structural changes in RNA. The ψ-RNA shows a CD spectrum which is A-form (26), having a strong positive band near 266 nm and a weaker negative band near 240 nm. The addition of drug, up to ∼14 µM concentration, causes the former to strengthen and the latter to weaken, indicating a structural change in the RNA. For concentrations >14 µM, the changes reverse and overall band intensity decreases. These effects may be due to additional drug binding or to loss of RNA from solution by precipitation, and were not analyzed quantitatively.
CD intensities for 17 wavelengths between 204 and 220 nm and seven drug concentrations between 0 and 14 µM were fitted to a two-state binding model. Assuming that the CD at all wavelengths responded to the same binding event, the value of K was found to be 4.3 × 10⁵ M–1. Since this is an average for the binding events that occur over this concentration range (three such events were found in the footprinting experiments), K for the highest affinity site must exceed 4.3 × 10⁵ M–1.
Plots of CD intensity versus neomycin concentration DT for each wavelength seem smooth and monotonic for DT < 14 µM. In contrast, similar plots for paromomycin (18) show CD intensities changing very rapidly with DT < 2 µM, indicating a distinct binding event with a large value of K.
Melting studies should also give information about drug binding (29). Let ΔHj and ΔSj be the enthalpy and entropy differences between the melted and unmelted domain j, giving the domain a melting temperature of Tj = ΔHj/ΔSj. Since A, the absorbance at 260 nm, increases most rapidly with temperature (T) near a Tj, the first derivative dA/dT has a maximum at each Tj. As shown in Figure 7, the ψ-RNA exhibits five melting transitions between 25 and 75°C.
Neomycin binding to the unmelted domain j increases its entropy and/or decreases its enthalpy. Since the melted domain (single stranded) binds drug poorly, Tj is increased by drug binding. The observed dA/dT curve is the weighted average of curves for RNA with and without bound drug. The fraction of RNA molecules with drug bound at domain j increases with free drug concentration, DF, and the binding constant for the domain, Kj (which depends on temperature). Thus increasing DF should increase Tj, as observed for the lowest melting transition, T1, for ψ-RNA (Table 2).
The interpretation of the effect of neomycin on subsequent melting transitions is more complicated because of the way the melting experiment was conducted. Raising the temperature above T1 causes domain 1 to melt, losing the bound drug, but also decreases K1. Detailed model calculations show that the melting temperature increases with drug concentration but, because of the decrease in K1, T1 levels off when only a small fraction of domains 1 have drug bound. When domain 1 loses drug, DF increases, increasing drug binding to other domains of the RNA. This may be the reason why T2 increases more rapidly with drug concentration than does T1. Since raising the temperature decreases all Kj, there may be no drug bound to domain j when T approaches the higher Tj. This is probably why T3, T4 and T5 are not affected by drug concentration (Table 2). Correlating the melting data with the footprinting results and identifying the melting domains with the binding regions found in footprinting will require additional study.
In summary, the footprinting experiments show that the highest affinity neomycin site on ψ-RNA is in the stem of SL 1 at nucleotide positions 262–269, but 285 on the neighboring stem loop SL 2 is also part of the site. The participation of 285 in the primary site appears to cause structural changes in the lower stem region of SL 2 and between SL 2 and SL 3. The largest binding constants obtained for neomycin (from type 1 plots) were for site G285 (K = 5.6 × 10⁵ M–1) and for sites C262–A269 (K = 4.5 × 10⁵ M–1) but, due to competition between the drug and RNase I, these values are lower than their true values. Binding regions with lower values of K are associated with G241–U249, mostly in the stem of SL 1, and A330–U337, in the linker region between SL 3 and SL 4. Loading these sites with drug makes 285, which was part of the strong drug site, susceptible to cleavage by RNase I.
The CD measurements show that ψ-RNA binds drug and that the drug binding induces a structural change. From the dependence of CD intensity on drug concentration (0–14 µM), one can derive a binding constant for the relevant binding event of 4.4 × 10⁵ M–1. This is considerably smaller than the largest K found for paromomycin from CD measurements (18). Since neomycin is expected to bind better than paromomycin (27,28) it is suggested that the strongest binding event for neomycin has no effect on the CD spectrum. Similarly to the CD measurements, the UV absorption measurements show the effect of a strong binding event for paromomycin but not for neomycin. Apparently, the strongest neomycin binding event does not induce the same kind of structural change as the corresponding event for paromomycin. As noted, the primary binding sites for the two drugs on ψ-RNA are different. Considering the structural similarity between the drugs, this difference is remarkable.
For ψ-RNA in the absence of drug, five melting transitions were observed, with melting temperatures Tj between 28 and 61°C. Drug binding raises the two lowest Ti by several degrees (Table 2), but has no effect on the others. This is probably because the Ki decrease with temperature, so that drug is not bound when one reaches the higher Ti. The values of T1 and T2 level off when the drug concentration is less than one-third the RNA concentration. This cannot be due to saturation of the binding sites with drug; calculations show that it is a consequence of the decrease in drug binding constants with temperature.
Acknowledgments
ACKNOWLEDGEMENTS
We thank M. Zuker (RPI) and D. Turner (University of Rochester) for helpful comments concerning the use of the folding program, Mfold. We also thank NSF-REU (CHE 9987838) for financial support to J.M.S. The research was supported in part by the NIH (GM32691 to P. N. Borer) and in part by the Chemistry Department.
REFERENCES
- 1.Wilson W.D. and Li,K. (2000) Targeting RNA with small molecules. Curr. Med. Chem., 7, 73–98. [DOI] [PubMed] [Google Scholar]
- 2.Gallego J. and Varani,G. (2001) Targeting RNA with small-molecule drugs: therapeutic promise and chemical challenges. Acc. Chem. Res., 10, 836–843. [DOI] [PubMed] [Google Scholar]
- 3.Hermann T. (2000) Strategies for the design of drugs targeting RNA and RNA-protein complexes. Angew. Chem. Int. Ed., 39, 1890–1904. [DOI] [PubMed] [Google Scholar]
- 4.Walter F., Vicens,Q. and Westhof,E. (1999) Aminoglycoside-RNA interactions. Curr. Opin. Chem. Biol., 3, 694–704. [DOI] [PubMed] [Google Scholar]
- 5.Schroeder R., Waldsich,C. and Wank,H. (2000) Modulation of RNA function by aminoglycoside antibiotics. EMBO J., 19, 1–9. [DOI] [PMC free article] [PubMed] [Google Scholar]
- 6.Recht M.I., Douthwaite,S., Dahlquist,K.D. and Puglisi,J.D. (1999) Effect of mutations in the A site of 16S rRNA on aminoglycoside antibiotic-ribosome interaction. J. Mol. Biol., 286, 33–43. [DOI] [PubMed] [Google Scholar]
- 7.Vicens Q. and Westhof,E. (2001) Crystal structure of paromomycin docked into the eubacterial ribosomal decoding A site. Structure, 9, 647–658. [DOI] [PubMed] [Google Scholar]
- 8.Jaing L., Majumdar,A., Hu,W., Jaishree,T.J., Xu,W. and Patel,D.J. (1999) Saccharide-RNA recognition in a compex formed between neomycin B and a RNA aptamer. Struct. Fold. Des., 7, 817–827. [DOI] [PubMed] [Google Scholar]
- 9.Varani L., Spillantini,M.G., Goedert,M. and Varani,G. (2000) Structural basis for recognition of the RNA major groove in the tau exon 10 splicing regulatory element by aminoglycoside antibiotics. Nucleic Acids Res., 28, 710–719. [DOI] [PMC free article] [PubMed] [Google Scholar]
- 10.Faber C., Sticht,H., Schweimer,K. and Rösch,P. (2000) Structural rearrangements of HIV-1 Tat-responsive RNA upon binding of neomycin B. J. Biol. Chem., 275, 20660–20666. [DOI] [PubMed] [Google Scholar]
- 11.Lacourciere K.A., Stivers,J.T. and Marino,J.P. (2000) Mechanism of neomycin and Rev peptide binding to the Rev responsive element of HIV-1 as determined by fluorescence and NMR spectroscopy. Biochemistry, 39, 5630–5641. [DOI] [PubMed] [Google Scholar]
- 12.Tok J.B.-H., Dunn,L.J. and Des Jean,R.C. (2001) Binding of dimeric aminoglycosides to the HIV-1 Rev responsive element (RRE) RNA construct. Bioorg. Med. Chem. Lett., 11, 1127–1131. [DOI] [PubMed] [Google Scholar]
- 13.Ryu D.H. and Rando,R.R. (2001) Aminoglycoside binding to human and bacterial A-site rRNA decoding region constructs. Bioorg. Med. Chem. Lett., 9, 2601–2608. [DOI] [PubMed] [Google Scholar]
- 14.Mei H.-Y., Cui,M., Heldsinger,A., Lemrow,S.M., Loo,J.A., Sannes-Lowery,K.A., Sharmeen,L. and Czarnik,A.W. (1998) Inhibitors of protein-RNA complexation that target the RNA: specific recognition of human immunodeficiency virus type-1 TAR RNA by small organic molecules. Biochemistry, 37, 14204–14212. [DOI] [PubMed] [Google Scholar]
- 15.Kirk S.R., Luedtke,N.W. and Tor,Y. (2001) 2-Aminopurine as a real time probe of enzymatic cleavage and inhibition of hammerhead ribozymes. Bioorg. Med. Chem. Lett., 9, 2295–2301. [DOI] [PubMed] [Google Scholar]
- 16.Llano-Sotelo B. and Chow,C.S. (1999) RNA-aminoglycoside antibiotic interactions: fluorescence detection of binding and conformational change. Bioorg. Med. Chem. Lett., 9, 213–216. [DOI] [PubMed] [Google Scholar]
- 17.McPike M., Goodisman,J. and Dabrowiak,J.C. (2001) Drug-RNA footprinting. Methods Enzymol., 340, 431–449. [DOI] [PubMed] [Google Scholar]
- 18.Sullivan J.M., Goodisman,J. and Dabrowiak,J.C. (2002) Absorption studies on aminoglycoside binding to the packaging region of human immunodeficiency virus type-1. Bioorg. Med. Chem. Lett., 12, 615–618. [DOI] [PubMed] [Google Scholar]
- 19.McPike M.P., Goodisman,J. and Dabrowiak,J.C. (2002) Footprinting and circular dichroism studies on paromomycin binding to the packaging region of human immunodeficiency virus type-1. Bioorg. Med. Chem., in press. [DOI] [PubMed] [Google Scholar]
- 20.Clever J., Sasssetti,C. and Parslow,T.G. (1995) RNA secondary structure and binding sites for gag gene products in the 5′ packaging signal of human immunodeficiency virus type 1. J. Virol., 69, 2101–2109. [DOI] [PMC free article] [PubMed] [Google Scholar]
- 21.Coffin J.M., Hughes,S.H. and Varmus,H.E. (1997) Retroviruses. Cold Spring Harbor Laboratory Press, Cold Spring Harbor, NY.
- 22.Mathews D.H., Sabina,J., Zuker,M. and Turner,D.H. (1999) Expanded sequence dependence of thermodynamic parameters improves prediction of RNA secondary structure. J. Mol. Biol. 288, 911–940. [DOI] [PubMed] [Google Scholar]
- 23.Zeffman A., Hassard,S., Varani,G. and Lever,A. (2000) The major HIV-1 packaging signal is an extended bulged stem loop whose structure is altered on interaction with the Gag polyprotein. J. Mol. Biol., 297, 877–893. [DOI] [PubMed] [Google Scholar]
- 24.Shubsda M.F., McPike,M.P., Goodisman,J. and Dabrowiak,J.C. (1999) Monomer-dimer equilibrium constants of RNA in the dimer initiation site of human immunodeficiency virus type-1. Biochemistry, 38, 10147–10157. [DOI] [PubMed] [Google Scholar]
- 25.Muriaux D., Fossé,P. and Paoletti,J. (1996) A kissing complex together with a stable dimer is involved in the HIV-1Lai RNA dimerization process in vitro. Biochemistry, 35, 5075–5082. [DOI] [PubMed] [Google Scholar]
- 26.Rigl C.T., Lloyd,D.H., Tsou,D.S., Gryaznov,S.M. and Wilson,W.D. (1997) Structural RNA mimetics: N3′→P5′ phosphoramidate DNA analogs of HIV-1 RRE and TAR RNA form A-type helices that bind specifically to Rev and Tat-related peptides. Biochemistry, 36, 650–659. [DOI] [PubMed] [Google Scholar]
- 27.Tok J.B.-H., Wong,W. and Baboolal,N. (2002) Binding of aminoglycoside antibiotics with modified A-site 16S rRNA construct containing non-nucleotide linkers. Bioorg. Med. Chem. Lett., 12, 365–370. [DOI] [PubMed] [Google Scholar]
- 28.Cho J. and Rando,R.R. (1999) Specificity in the binding of aminoglycosides to HIV-RRE RNA. Biochemistry, 38, 8548–8554. [DOI] [PubMed] [Google Scholar]
- 29.Draper D.E., Xing,Y. and Laing,L.G. (1995) Thermodynamics of RNA unfolding: stabilization of a ribosomal RNA tertiary structure by thiostrepton and ammonium ion. J. Mol. Biol., 249, 231–238. [DOI] [PubMed] [Google Scholar]


