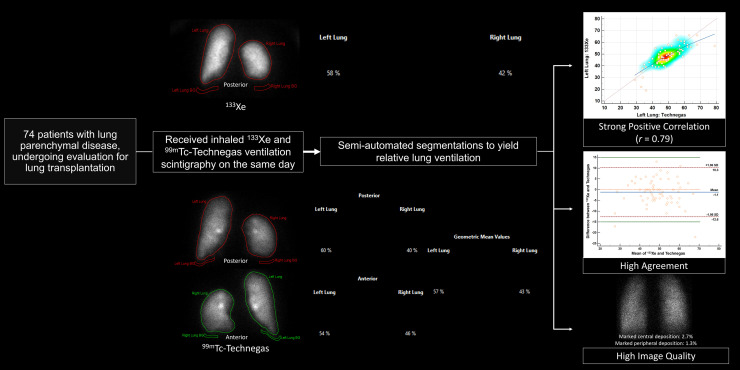
Visual Abstract
Keywords: 99mTc-Technegas, 133Xe, scintigraphy, quantification, differential, pulmonary
Abstract
99mTc-Technegas was recently approved by the U.S. Food and Drug Administration as a radiopharmaceutical for ventilation scintigraphy. However, there are currently no data comparing the quantification of relative lung ventilation with 99mTc-Technegas with that performed using the standard approach with inhaled 133Xe. Methods: We performed a secondary analysis of data from prospectively recruited participants in a phase 3 trial undergoing evaluation for lung transplantation who received both 133Xe and 99mTc-Technegas ventilation imaging. The 133Xe and 99mTc-Technegas images were analyzed asynchronously using semiautomatic segmentation to extract the relative lung ventilation percentages. The anterior and posterior 99mTc-Technegas images were analyzed to derive 3 sets of relative ventilation percentages (posterior, anterior, and geometric mean data) and compared with the values from posterior 133Xe images. We evaluated for correlation and agreement between the relative lung ventilation percentages obtained using these 2 radiopharmaceuticals. Results: In a cohort of 74 participants, we found a strong positive correlation in the relative lung ventilation quantified using 133Xe with that using 99mTc-Technegas. A high level of agreement was demonstrated on the Bland–Altman plot comparing the 2 imaging modalities. Seventy-two of 74 participants (97.3%) had their relative ventilation percentage measurements within ±15% for 133Xe and 99mTc-Technegas. The differences in relative ventilation measurements were within the 95% CI limits of the mean for 70 of 74 participants (94.6%) and within a narrower ±10% threshold for 68 of 74 participants (91.9%), again reflecting the comparability of the 2 techniques. The strongest correlation coefficient (r = 0.79) was observed between the relative ventilation percentages obtained from 133Xe and posterior 99mTc-Technegas images. The geometric mean method had a slightly lower but still comparable correlation (r = 0.77), and as expected, the correlation with the anterior 99mTc-Technegas images was worst (r = 0.70). Conclusion: We showed a strong positive correlation and high agreement between the relative lung ventilation percentages obtained using 133Xe and 99mTc-Technegas. These data provide important clinical evidence supporting the use of 99mTc-Technegas for quantification of relative lung ventilation.
Lung ventilation quantification is a critical component in the management of patients with various pulmonary conditions, particularly in the preoperative and postoperative evaluation of those undergoing lung resection and lung transplantation (1–4). For instance, the preoperative functional data help guide surgery, with the worse functioning lung removed first in bilateral lung transplantation to avoid the requirement for cardiac bypass (5). Serial comparison of relative lung ventilation can also help in the assessment of therapeutic effectiveness and determine longitudinal trends in lung function. Forced expiratory volume in 1 s, a common measure of lung ventilation, is an independent predictor of morbidity in patients undergoing lobar or sublobar pulmonary resection or pneumonectomy (6,7). However, preoperative measurement of the forced expiratory volume in 1 s does not permit evaluation of differential pulmonary ventilation and does not highlight regional differences, especially in the setting of chronic obstructive pulmonary disease. Traditionally, this quantification has been achieved using 133Xe, a radioactive gas that has served as the standard for evaluating regional lung function, especially in patients with borderline-low baseline reserves (8). The distribution of 133Xe in early wash-in during tidal breathing closely approximates the minute ventilation rate, whereas its distribution at the end of wash-in approximates the lung volume (9,10). Notably, quantification of relative lung ventilation with another radiopharmaceutical, aerosolized 99mTc-diethylenetriamine pentaacetate (99mTc-DTPA), is challenging, especially because of increased central airway deposition in patients with obstructive lung disease, which leads to suboptimal imaging and limits the accuracy of differential ventilation quantification.
In contrast,99mTc-Technegas (Cyclomedica Ltd.), which is composed of ultrafine carbon nanoparticles labeled with 99mTc, offers distinct advantages in terms of particle size (<0.1 μm vs. ∼2 μm for 99mTc-DTPA) and distribution (11). The smaller particle size of 99mTc-Technegas allows for better peripheral lung deposition, even in the presence of obstructive lung pathology, potentially leading to more accurate and reliable imaging. With its recent U.S. Food and Drug Administration approval, it is anticipated that 99mTc-Technegas will be increasingly used for lung ventilation scintigraphy, both for assessment of acute or chronic pulmonary thromboembolism and for quantification of relative lung ventilation. However, there are no data available currently to assess the performance of 99mTc-Technegas for relative quantification of lung ventilation, when compared with the established standard method with 133Xe.
Therefore, we performed a head-to-head comparison of relative lung ventilation quantification with 99mTc-Technegas and 133Xe in a cohort of prospectively enrolled pretransplant patients, offering a unique opportunity to directly assess the performance of these 2 radiopharmaceuticals in a clinical setting. By analyzing participants who were imaged with both 99mTc-Technegas and 133Xe and quantifying lung ventilation with each method, this study aimed to provide crucial data that could influence clinical practice. Again, the focus on quantification is particularly significant in the context of presurgical planning as well as longitudinal postoperative assessments, for which accurate estimates of residual lung function are essential for minimizing postoperative complications, ensuring optimal patient outcomes, and monitoring lung function recovery and guiding rehabilitation. A secondary objective of the study was to visually assess the quality of the 99mTc-Technegas images in terms of homogeneity of tracer distribution and deposition of the tracer in the central and peripheral airways.
MATERIALS AND METHODS
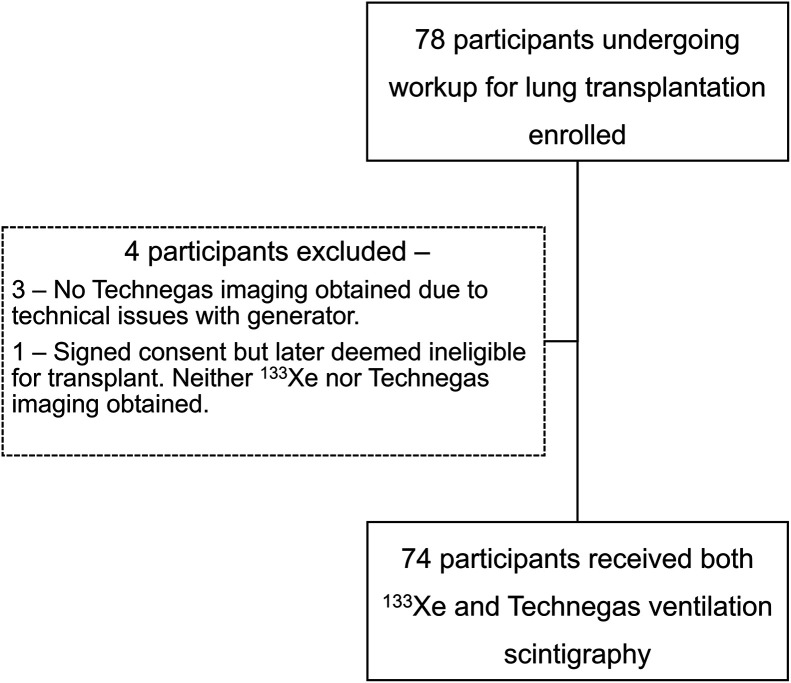
We performed a secondary analysis of imaging and demographic data from a subset of participants recruited prospectively in a phase 3, single-arm, fixed-sequence trial (NCT03054870) who underwent lung ventilation scintigraphy with both 133Xe and 99mTc-Technegas as part of their pre–lung-transplant workup at our center between September 2017 and January 2020 (Fig. 1). The objective of this phase 3 trial was to demonstrate the noninferiority of 99mTc-Technegas compared with the standard 133Xe for lung ventilation scintigraphy. Lung perfusion scintigraphy was also performed using 99mTc-macroaggregated albumin, but those results were not included for the purposes of the current study. The detailed inclusion and exclusion criteria of the trial are available publicly (supplemental materials, available at http://jnm.snmjournals.org). All participants at our institution had an underlying nononcologic pulmonary disease (e.g., interstitial lung disease or chronic obstructive pulmonary disease) and were being considered for lung transplantation. The study participants first inhaled approximately 370–1,110 MBq (10–30 mCi) of 133Xe, and planar ventilation scintigraphy was performed. Per our standard protocol, this consisted of a continuous dynamic acquisition (20-s frames) of upright tidal breathing for 3 min of wash-in (1 min each sequentially in the posterior, right posterior oblique, and left posterior oblique projections) followed by 5 min of washout (2 min in the posterior projection and 1 min each sequentially in the right posterior oblique, left posterior oblique, and posterior projections). On the same day, after completion of 133Xe imaging, the participants inhaled approximately 40.7 MBq (1.1 mCi) of 99mTc-Technegas in the supine position and planar ventilation scintigraphy in multiple projections was performed.
FIGURE 1.
Study workflow.
The current study of existing data was approved by the Institutional Review Board (202401060) with waiver of informed consent. Two experienced nuclear medicine physicians analyzed the 133Xe and 99mTc-Technegas ventilation images. Quantification of relative lung ventilation with 133Xe was performed by generating semiautomated regions of interest (ROIs) for each lung and a subjacent background region on the posterior image of the first 40 s of wash-in during tidal breathing (Fig. 2) using Hermes software (Hermes Medical Solutions). The differential lung ventilation was calculated from the background-corrected counts in each lung and expressed as the percentage of total ventilation in each lung. Quantification with 99mTc-Technegas was performed in a similar fashion, except that the ROIs were drawn on both anterior and posterior images, and we recorded the output percentages obtained using the posterior image alone and anterior image alone, as well as using the geometric mean method (square root of the product of percentages obtained in the anterior and posterior images) (Fig. 2). The analyses were performed asynchronously for the 133Xe and 99mTc-Technegas imaging, with a different observer for each of these radiopharmaceuticals to avoid any potential bias while manipulating the ROIs. The images were also visually assessed on 3 domains: overall homogeneity of tracer distribution, tracer deposition in the central airways, and tracer deposition in the peripheral airways. A score of 0–3 was given for each domain, with 0 indicating no heterogeneity and no increased central or peripheral deposition, 1 indicating mild heterogeneity and mildly increased central/peripheral deposition, 2 indicating moderate heterogeneity and moderately increased central/peripheral deposition, and 3 indicating severe heterogeneity and markedly increased central or peripheral deposition.
FIGURE 2.
Planar scintigraphy images obtained after inhalation of 133Xe in posterior projection (A) and 99mTc-Technegas in posterior and anterior projections (B) in patient with representative images of semiautomated ROIs used for deriving relative ventilation percentages. Measured relative ventilation of left lung was 58% with 133Xe, 60% on posterior 99mTc-Technegas image, and 57% with 99mTc-Technegas geometric mean. BG = background.
The relative lung ventilation contributions are reported as percentages for the left and right lungs. We performed correlation tests to assess for a trend between the relative percentages obtained using 133Xe and 99mTc-Technegas and created scatterplots. A Bland–Altman test was performed to compare the relative lung ventilation percentages obtained with 133Xe with those obtained with 99mTc-Technegas on a per-patient basis and to assess for agreement (12). The differences in percentages obtained using the 2 techniques were plotted against the mean of the percentages. We selected ±15% as a maximal threshold of differences in percentages between these 2 techniques for the Bland–Altman plot. Although we performed these tests for the left and right lungs separately for the sake of completeness, we recognize that these comparisons are providing the same information, essentially a zero-sum game. Additionally, we deliberately chose not to perform a paired t test in this setting, as the test compares the means of the 2 sets of observations and thus is not reliable for studying the differences at an individual level. The paired t test may suggest good agreement due to similar means of observations even when large differences exist in individual observations (13). The statistical analyses were performed using MedCalc, version 22.021 (MedCalc Software), for Microsoft Windows. A P value of less than 0.05 was considered significant.
RESULTS
In total, 78 participants were enrolled at our site in the prospective phase 3 trial. Of these, 74 participants had both 133Xe and 99mTc-Technegas imaging results available for interpretation (Fig. 1), and they formed the final cohort for this study. Among these 74 participants, 50 were male and 24 were female. The mean age of the participants was 58.1 y (range, 20–82 y).
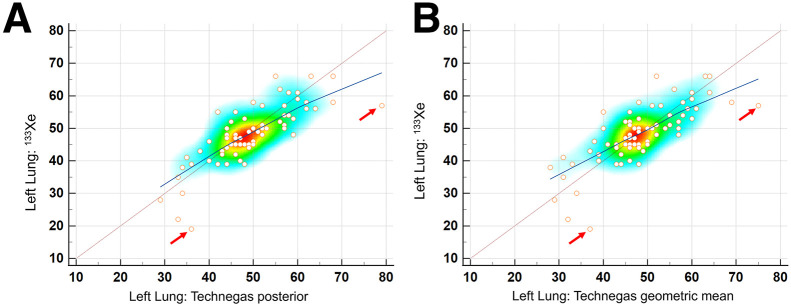
The relative lung ventilation percentages obtained using 133Xe and posterior 99mTc-Technegas images showed a strong positive correlation (r = 0.79, P < 0.0001) (Fig. 3). Similar strong correlations were noted when using the geometric mean or the anterior image 99mTc-Technegas results, although the corresponding correlation coefficients were lower than that for the posterior images (Table 1 shows the values for the left lung). No sex-specific or age-specific differences were noted in the correlation coefficients.
FIGURE 3.
Scatterplots showing comparison of relative left lung ventilation percentages obtained on posterior 133Xe images with those obtained using 99mTc-Technegas on posterior image (A) and with geometric mean method (B). Heat map shows maximal clustering of sampled data points in region of 40%–55%. Dotted maroon line represents line of equality. Blue line represents trend line with local regression smoothing and span of 90%. Note strong positive correlation between relative ventilation percentage of left lung as measured on posterior projection 133Xe images with posterior projection 99mTc-Technegas images, with trend line close to line of equality. Scatterplot helps in identifying overall trend as well as outliers (those with >15% difference, marked by arrows). Relatively lower slope toward higher percentages is likely due to fewer data points and effect from outlier.
TABLE 1.
Correlation Coefficients for Relative Ventilation of Left Lung Expressed as Percentage as Measured on Posterior Projection 133Xe and 99mTc-Technegas Images
| Parameter | r | P |
|---|---|---|
| Left lung: 133Xe and posterior 99mTc-Technegas | 0.79 (95% CI, 0.69–0.86) | <0.0001 |
| Left lung: 133Xe and geometric mean from 99mTc-Technegas | 0.77 (95% CI, 0.65–0.85) | <0.0001 |
| Left lung: 133Xe and anterior 99mTc-Technegas | 0.70 (95% CI. 0.56–0.80) | <0.0001 |
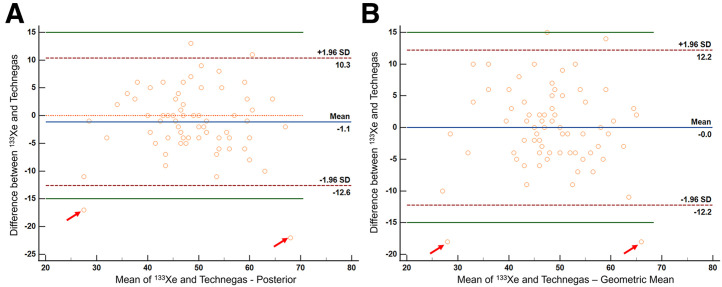
A Bland–Altman plot comparing the relative lung ventilation percentages obtained using 133Xe and posterior 99mTc-Technegas images showed that the 2 methods were comparable, with no evidence of systematic bias (P = 0.1) (Fig. 4). It also showed that 72 of 74 participants (97.3%) had their relative ventilation percentage measurements within ±15% for 133Xe and 99mTc-Technegas (Fig. 4). Further, the differences in relative ventilation measurements were within the 95% CI limits of the mean for 70 of 74 participants (94.6%) and within a narrower ±10% threshold for 68 of 74 participants (91.9%), again reflecting the comparability of the 2 techniques. An additional Bland–Altman plot comparing the relative lung ventilation with 133Xe versus the 99mTc-Technegas geometric mean method showed similar results (Fig. 4).
FIGURE 4.
Bland–Altman plot showing comparison of relative left lung ventilation percentages obtained on posterior 133Xe and 99mTc-Technegas images (A: posterior 99mTc-Technegas; B: geometric mean 99mTc-Technegas). Vertical axis shows difference between percentages obtained from 133Xe and 99mTc-Technegas, whereas horizontal axis is mean of 2 percentages. Orange line is line of equality, denoting no difference in percentages obtained using 2 methods. Blue line represents mean difference between 133Xe and 99mTc-Technegas percentages. Green lines represent ±15% difference limits. Maroon lines represent 95% CI limits for mean. 2 outliers with >15% difference in percentages are marked with rd arrows.
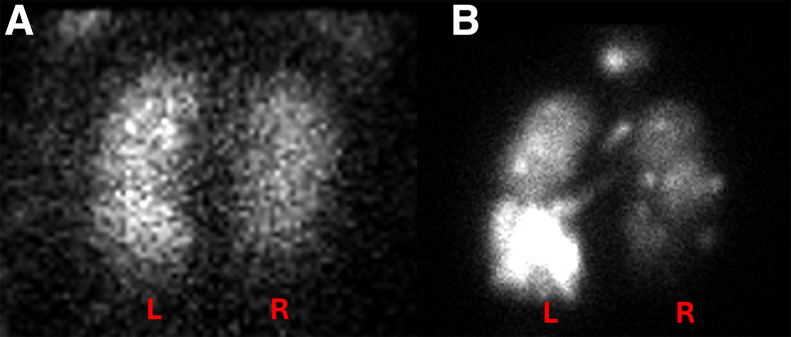
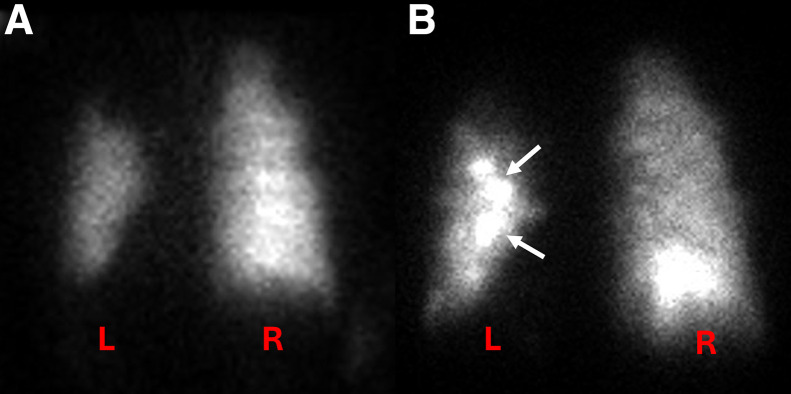
We identified 2 outliers for whom the percentage difference was more than 15% and re-reviewed their images. One participant had a poor-quality 133Xe study and also had significant clumping of 99mTc-Technegas, likely related to his severe pulmonary disease (Fig. 5). The left lung ventilation measured for this participant was 57% on 133Xe, 79% on posterior 99mTc-Technegas, and 75% on geometric-mean 99mTc-Technegas. The other participant had increased central deposition of 99mTc-Technegas, likely related to his obstructive pulmonary disease (Fig. 6). The left lung ventilation measured for this participant was 19% on 133Xe, 36% on posterior 99mTc-Technegas, and 37% on geometric-mean 99mTc-Technegas. We attempted to reanalyze the 99mTc-Technegas image by manipulating the ROI to exclude the region of central deposition in the left lung, which yielded a relative ventilation of 20% for the left lung on the posterior image.
FIGURE 5.
Posterior planar images obtained after inhalation of 133Xe (A) and 99mTc-Technegas (B) in patient with >15% discordance between relative ventilation percentages obtained using 2 techniques. Note overall heterogeneity of 133Xe distribution with visual suggestion of relatively better ventilated left lung (A). Heterogeneity is more marked on 99mTc-Technegas image (B), which, in addition to prominent left–right lung ventilation difference, also highlights relatively better ventilated left lower lung than left upper lung. Measured relative ventilation of left lung was 57% on 133Xe and 79% on 99mTc-Technegas.
FIGURE 6.
Posterior planar images obtained after inhalation of 133Xe (A) and 99mTc-Technegas (B) in patient with >15% discordance between relative ventilation percentages obtained using the 2 techniques. Although appearance looks largely similar, note increased central deposition of 99mTc-Technegas in left lung (B, arrows) and increased activity in right lung base. Measured relative ventilation of left lung was 19% on 133Xe and 36% on 99mTc-Technegas.
The visual scoring of 99mTc-Technegas images showed that 54 of 74 participants (73%) had either no or mild central deposition of the tracer. Severe heterogeneity of tracer distribution was seen in 5 of 74 participants (6.7%), whereas markedly increased central deposition was seen in 2 (2.7%) and markedly increased peripheral deposition was seen in 1 (1.3%) (Table 2).
TABLE 2.
Visual Assessment of 99mTc-Technegas Images in Terms of Homogeneity of Radiotracer Distribution and Deposition of Radiotracer in Central and Peripheral Airways
| Parameter | Score 0 (n) | Score 1 (n) | Score 2 (n) | Score 3 (n) |
|---|---|---|---|---|
| Heterogeneity* | 19 | 28 | 22 | 5 |
| Central deposition† | 37 | 17 | 18 | 2 |
| Peripheral deposition† | 50 | 15 | 8 | 1 |
Heterogeneity scoring: 0 = homogeneous, 1 = mildly heterogeneous, 2 = moderately heterogeneous, 3 = severely heterogeneous.
Central or peripheral deposition scoring: 0 = no central/peripheral deposition, 1 = mildly increased deposition, 2 = moderately increased deposition, 3 = markedly increased deposition.
DISCUSSION
Traditionally, quantitative lung ventilation scintigraphy has been performed with 133Xe to assess relative lung ventilation during the initial portion of the wash-in phase (9). The challenges with 133Xe ventilation imaging include the inability to acquire SPECT data because of the rapidly changing distribution of tracer during the phases when relative ventilation data could be acquired (early wash-in or washout), instead relying on a few planar views to determine regional ventilation differences; low photon energy of 81 keV with abundance of around 36%; and the requirement that the patient be ambulatory and able to cooperate with a multiview planar acquisition if such is desired (14,15). Prior studies have shown that SPECT/CT imaging of lung ventilation has a higher sensitivity, accuracy, and interreader reproducibility than planar ventilation scintigraphy (16–18). Until recently in the United States, ventilation SPECT/CT clinically was possible only with aerosolized 99mTc-DTPA, which performs poorly in patients with obstructive pulmonary diseases (19). Although 99mTc-Technegas has been used worldwide for scintigraphic assessment of lung ventilation since 1986, it was only recently approved for clinical use by the U.S. Food and Drug Administration (on September 29, 2023) (20). Prior studies from outside the United States have shown that 99mTc-Technegas outperforms 99mTc-DTPA in terms of image quality in patients with obstructive pulmonary disease, as the former has significantly lower deposition in the central airways and a more homogeneous distribution in the peripheral lung parenchyma (19).
Consequently, it is of clinical importance to determine whether 99mTc-Technegas ventilation scintigraphy will yield results comparable to those obtained with 133Xe for quantification of relative lung ventilation, in addition to other standard indications for diagnosing acute pulmonary embolism or chronic thromboembolic disease. Our study showed a strong positive correlation (r = 0.79) and high agreement between the relative lung ventilation percentages derived using 133Xe and those derived using 99mTc-Technegas in prospectively recruited participants undergoing a pretransplantation workup. This evidence supports the interchangeability of these 2 radiopharmaceuticals for quantifying relative lung ventilation. We observed that 70 of 74 (94.6%) participants had their relative lung ventilation within the ±15% threshold and that around 92% of participants had their relative lung ventilation within a narrower ±10% threshold.
We compared the relative lung ventilation obtained with posterior 133Xe images with the posterior, anterior, and geometric mean 99mTc-Technegas data. Although each of the 3 methods for quantifying relative ventilation on 99mTc-Technegas correlated strongly with that of 133Xe, it is not surprising that the highest correlation coefficient was with the posterior 99mTc-Technegas images (Table 1). The Bland–Altman plot showed similar highest agreement between the 133Xe and posterior projection 99mTc-Technegas and the lowest agreement between the 133Xe and anterior projection 99mTc-Technegas. Additionally, the geometric mean method had a similar performance to that using the posterior image alone. Although a formal statistical analysis was not feasible to compare the performance of these 3 techniques (using anterior or posterior or geometric mean), these results suggest that the use of the posterior 99mTc-Technegas image would be preferred over the use of the anterior image for quantification of relative lung ventilation. In practice, however, it seems logical to use the geometric mean data to obviate situations where the anteroposterior distribution of ventilation significantly differs between the right and left lungs.
We identified 2 outliers on the Bland–Altman plot that had more than a 15-point difference between the 133Xe- and 99mTc-Technegas–derived relative lung ventilation percentages (Fig. 4). One participant had a poor-quality 133Xe image, likely related to suboptimal breathing efforts with severe heterogeneity on 99mTc-Technegas (visual score, 3) and increased central and peripheral tracer deposition (Fig. 5). The relative ventilation of the left lung for this participant was lower on 133Xe (57%) compared with 99mTc-Technegas (79% on the posterior image). Visually, it appears that the ventilation of the right lung is more severely impaired than is apparent on the 133Xe quantification, and the 99mTc-Technegas image may better represent the relative lung ventilation. Because of the lack of ground truth other than the data with 133Xe, it is difficult to definitively establish which image is closer to the truth in this case. The second participant had a relatively homogeneous distribution of 133Xe, but with a mildly heterogeneous appearance of the 99mTc-Technegas distribution (score, 1) and moderately increased central deposition (score, 2) (Fig. 6). The relative ventilation of the left lung for this participant was lower with 133Xe (19%) than with 99mTc-Technegas (36% on the posterior projection). Visually, it appears that the increased central deposition of 99mTc-Technegas in the left lung may have contributed to the higher measured relative left lung ventilation. We attempted to re-analyze this case by manipulating the ROI to exclude the region of central deposition in the left lung, which yielded a relative lung ventilation of 20% with 99mTc-Technegas, much closer to the 19% obtained with 133Xe. Thus, in patients with moderate to marked central deposition of the radiotracer, excluding those regions manually might prevent an overestimation of the ipsilateral relative lung ventilation. Additionally, use of SPECT/CT instead of, or in addition to, planar imaging can be helpful in quantifying relative lung and lobar ventilation, especially in patients with an inhomogeneous distribution of the tracer.
Finally, our secondary objective was to visually assess the 99mTc-Technegas images to determine the homogeneity of distribution and central/peripheral deposition. Most (73%) of the participants had no or a mild central deposition of 99mTc-Technegas, which is consistent with the prior reports and one of the major advantages of 99mTc-Technegas over 99mTc-DTPA aerosol (19). Given that our study population consisted of patients with severe pulmonary parenchymal diseases being evaluated for lung transplantation, the relatively higher heterogeneity of 99mTc-Technegas distribution is not unexpected (Table 2).
Our study had certain limitations. These include the inherent limitations with a retrospective study, although we performed the secondary analyses in the prospectively recruited cohort. There was no ground truth or follow-up reference standard to compare the performance of both 133Xe and 99mTc-Technegas. However, the primary objective of the study was to assess whether 99mTc-Technegas yields comparable relative lung ventilation to that with 133Xe—a question that we were able to answer satisfactorily. Despite these limitations, the present study provides conclusive data on the comparability of quantification of relative lung ventilation with 99mTc-Technegas and 133Xe. With the recent Food and Drug Administration approval of 99mTc-Technegas, it is expected that the use of 99mTc-Technegas for both quantitative and qualitative assessment of lung ventilation will increase in the United States, and thus our study will provide clinical evidence to support use in the former indication.
CONCLUSION
99mTc-Technegas–derived relative lung ventilation has a strong positive correlation and high agreement with the relative lung ventilation derived from 133Xe. Both the relative lung ventilation derived using the posterior image of 99mTc-Technegas and using the geometric mean method have high agreement with that of 133Xe and can be used for quantitative assessment of lung ventilation. Patients with severe obstructive pulmonary disease with moderate or marked central deposition of 99mTc-Technegas may benefit from selective exclusion of the areas of central deposition in the ROIs to prevent overestimation of the ipsilateral relative lung ventilation.
DISCLOSURE
No potential conflict of interest relevant to this article was reported.
ACKNOWLEDGMENTS
We thank Jennifer Frye, CNMT, for her assistance with conduct of the phase 3 trial at our institution and regulatory aspects of this secondary study. We would also like to thank Cyclomedica Australia Pty Ltd. for funding the Open Access costs for this article.
KEY POINTS
QUESTION: Is the performance of 99mTc-Technegas similar to that of 133Xe for quantification of relative lung ventilation?
PERTINENT FINDINGS: We performed secondary analyses in a prospectively recruited cohort of participants undergoing pre–lung transplantation evaluation in a phase 3 trial who received both 133Xe and 99mTc-Technegas ventilation imaging. We found a strong positive correlation (r = 0.79) and high agreement in the relative lung ventilation quantified using 133Xe with that using 99mTc-Technegas, with 72 of 74 participants (97.3%) having their relative ventilation percentage measurements within ±15% for 133Xe and 99mTc-Technegas.
IMPLICATIONS FOR PATIENT CARE: Our results suggest that inhaled 99mTc-Technegas can be used interchangeably with 133Xe for quantification of relative lung ventilation.
REFERENCES
- 1. Wernly JA, DeMeester TR, Kirchner PT, Myerowitz PD, Oxford DE, Golomb HM. Clinical value of quantitative ventilation-perfusion lung scans in the surgical management of bronchogenic carcinoma. J Thorac Cardiovasc Surg. 1980;80:535–543. [PubMed] [Google Scholar]
- 2. Herzog SA, Jacobson AF. Comparison of quantitative ventilation-perfusion lung scan results using different xenon-133 ventilation images. J Nucl Med Technol. 1995;23:258–261. [Google Scholar]
- 3. Morice RC, Jimenez CA, Eapen GA, Mehran RJ, Keus L, Ost D. Using quantitative breath sound measurements to predict lung function following resection. J Cardiothorac Surg. 2010;5:81. [DOI] [PMC free article] [PubMed] [Google Scholar]
- 4. Derenoncourt PR, Felder GJ, Royal HD, et al. Ventilation-perfusion scan: a primer for practicing radiologists. Radiographics. 2021;41:2047–2070. [DOI] [PubMed] [Google Scholar]
- 5. Elgharably H, Javorski MJ, McCurry KR. Bilateral sequential lung transplantation: technical aspects. J Thorac Dis. 2021;13:6564–6575. [DOI] [PMC free article] [PubMed] [Google Scholar]
- 6. Beckles MA, Spiro SG, Colice GL, Rudd RM; American College of Chest Physicians. The physiologic evaluation of patients with lung cancer being considered for resectional surgery. Chest. 2003;123(suppl):105S–114S. [DOI] [PubMed] [Google Scholar]
- 7. Piai DB, Quagliatto R, Jr, Toro I, Cunha Neto C, Etchbehere E, Camargo E. The use of SPECT in preoperative assessment of patients with lung cancer. Eur Respir J. 2004;24:258–262. [DOI] [PubMed] [Google Scholar]
- 8. Dollery CT, Hugh-Jones P, Matthews CME. Use of radioactive xenon for studies of regional lung function. Br Med J. 1962;2:1006–1016. [DOI] [PMC free article] [PubMed] [Google Scholar]
- 9. Secker-Walker RH, Alderson PO, Hill RL, Markham J, Baker J, Potchen EJ. The measurement of regional ventilation during tidal breathing: a comparison of two methods in healthy subjects, and patients with chronic obstructive lung disease. Br J Radiol. 1975;48:181–189. [DOI] [PubMed] [Google Scholar]
- 10. Secker-Walker RH, Alderson PO, Wilhelm J, Hill RL, Markham J. Regional ventilation-perfusion relationships. Respiration. 1975;32:265–276. [DOI] [PubMed] [Google Scholar]
- 11. Currie GM, Bailey DL. A technical overview of Technegas as a lung ventilation agent. J Nucl Med Technol. 2021;49:313–319. [DOI] [PubMed] [Google Scholar]
- 12. Bland JM, Altman DG. Statistical methods for assessing agreement between two methods of clinical measurement. Lancet. 1986;1:307–310. [PubMed] [Google Scholar]
- 13. Pandis N. Why using a paired t test to assess agreement is problematic? Am J Orthod Dentofacial Orthop. 2021;160:767–768. [DOI] [PubMed] [Google Scholar]
- 14. Roach PJ, Schembri GP, Bailey DL. V/Q scanning using SPECT and SPECT/CT. J Nucl Med. 2013;54:1588–1596. [DOI] [PubMed] [Google Scholar]
- 15. Parker JA, Coleman RE, Grady E, et al. SNM practice guideline for lung scintigraphy 4.0. J Nucl Med Technol. 2012;40:57–65. [DOI] [PubMed] [Google Scholar]
- 16. Stein PD, Freeman LM, Sostman HD, et al. SPECT in acute pulmonary embolism. J Nucl Med. 2009;50:1999–2007. [DOI] [PubMed] [Google Scholar]
- 17. Reinartz P, Wildberger JE, Schaefer W, Nowak B, Mahnker AH, Buell U. Tomographic imaging in the diagnosis of pulmonary embolism: a comparison between V/Q lung scintigraphy in SPECT technique and multislice spiral CT. J Nucl Med. 2004;45:1501–1508. [PubMed] [Google Scholar]
- 18. Bajc M, Olsson CG, Olsson B, Palmer J, Jonson B. Diagnostic evaluation of planar and tomographic ventilation/perfusion lung images in patients with suspected pulmonary emboli. Clin Physiol Funct Imaging. 2004;24:249–256. [DOI] [PubMed] [Google Scholar]
- 19. Jögi J, Jonson B, Ekberg M, Bajc M. Ventilation-perfusion SPECT with 99mTc-DTPA versus Technegas: a head-to-head study in obstructive and nonobstructive disease. J Nucl Med. 2010;51:735–741. [DOI] [PubMed] [Google Scholar]
- 20. TECHNEGAS (kit for the preparation of technetium Tc 99m-labeled carbon inhalation aerosol) [package insert]. Cyclomedica Australia Pty Ltd.; 2023.


