

Abstract
Background
Polymerase delta-interacting protein 2 (Poldip2) is a novel regulator of vascular permeability that has been shown to be involved in aggravating blood–brain barrier (BBB) disruption following stroke; however, the underlying mechanisms are unknown. While endothelial tight junctions (TJ) are critical mediators of BBB permeability, the effect of Poldip2 on TJ function has not been elucidated yet. Here, we aim to define the mechanism by which Poldip2 mediates BBB disruption, specifically focusing on phosphorylation and stabilization of the TJ integral protein ZO-1.
Methods and Results
Cerebral ischemia was induced in endothelial-specific Poldip2 knockout mice and controls. Cerebral vascular permeability was assessed by Evans blue dye extravasation. Endothelial-specific Poldip2 deletion abolished Evans blue dye extravasation after ischemia induction. In vitro permeability assays demonstrated that Poldip2 knockdown suppressed TNF-α-induced endothelial cell (EC) permeability. Immunofluorescence staining showed that Poldip2 depletion prevented TNF-α-induced ZO-1 disruption at interendothelial junctions. Conversely, Poldip2 overexpression increased endothelial permeability, loss of ZO-1 localization at cell–cell junctions and enhanced reactive oxygen species (ROS) production. Treatment with the antioxidant N-acetyl cysteine (NAC) reduced Poldip2-induced ZO-1 disruption at inter interendothelial junctions. Immunoprecipitation studies demonstrated Poldip2 overexpression induced tyrosine phosphorylation of ZO-1, which was prevented by treatment with NAC or MitoTEMPO, a mitochondrial ROS scavenger.
Conclusions
These data reveal a novel mitochondrial ROS-driven mechanism by which Poldip2 induces ZO-1 tyrosine phosphorylation and promotes EC permeability following cerebral ischemia.
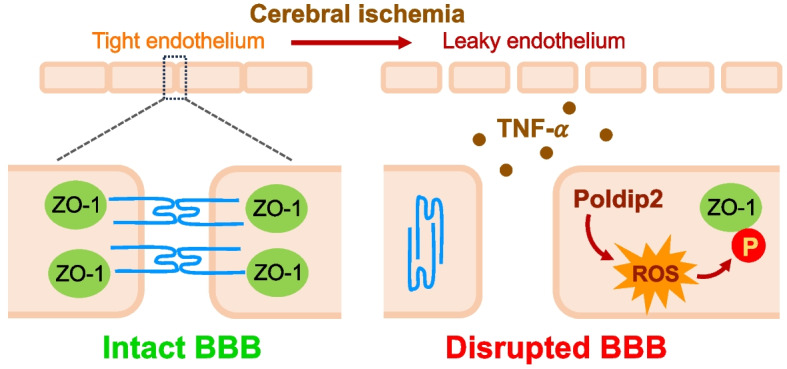
Graphical Abstract
Supplementary Information
The online version contains supplementary material available at 10.1186/s12964-024-01982-3.
Keywords: Blood–brain barrier, Poldip2, ZO-1, Reactive oxygen species, Brain endothelial cells
Introduction
The blood–brain barrier (BBB) is a unique structure formed by glial cells, pericytes, neurons and brain endothelial cells (ECs) [1]. Brain ECs constitute the most critical BBB component and form a continuous physical barrier that lines cerebral blood vessels [2, 3]. This physical barrier functions as a paracellular gate restricting diffusion based on size and charge [4]. Tight junctions (TJ) are the main regulators of paracellular permeability in the endothelium and primarily consist of an intricate combination of transmembrane proteins (occludin and claudins) that interact with scaffolding proteins of the junctional complex such as zonula occludens protein 1 (ZO-1), ZO-2 and ZO-3. These scaffolding proteins anchor the junctional complex to the actin cytoskeleton [5–7].
The junctional protein ZO-1 is a 220 kDa peripheral membrane protein whose protein–protein interaction domains (PDZ, SH3, and GuK) facilitate its binding to other junctional and cytoskeletal proteins and play a crucial role in maintaining the structure of TJs [8, 9]. Redox regulation of ZO-1 plays a central role in its stability at the interendothelial border. Studies performed in epithelial CaCo-2 cells isolated from colon adenocarcinoma demonstrated that oxidative stress induces tyrosine phosphorylation of occludin and ZO-1 leading to dissociation of the occludin–ZO-1 complexes from the intercellular junctions via a tyrosine kinase-dependent mechanism [10, 11]. Similar results have been found in human umbilical vein endothelial cells (HUVECs) [12]. While ZO-1 phosphorylation plays a critical role in the disassembly of TJs and barrier disfunction; a detailed understanding of how dynamic ZO-1 phosphorylation is regulated on a molecular basis and how ZO-1 post-translational modifications affect its distribution and stability is currently lacking.
Polymerase δ-interacting protein 2 (Poldip2, also known as PDIP38 and mitogenin 1) was originally recognized to bind DNA polymerase-δ and proliferating cell nuclear antigen (PCNA) [13]. Additional studies implicated Poldip2 in focal adhesion turnover, regulation of stress fibers and mitochondrial dynamics [14–17]. Moreover, Poldip2 regulates mitochondrial reactive oxygen species (ROS) production [18] and increases NADPH oxidase 4 (Nox4) activity, leading to generation of ROS [19], which in turn act as signaling molecules via direct oxidation of proteins [20]. Our previous work focusing on the role of Poldip2 in stroke demonstrated that mice with heterozygous whole-body deletion of Poldip2 were protected against BBB disruption induced by cerebral ischemia [21]. We also showed that Poldip2 depletion decreased the permeability of brain endothelial cells (ECs) in response to lipopolysaccharide (LPS) stimulation [22]. These results demonstrate an important role for Poldip2 in BBB function during stroke and sepsis and a beneficial effect of reduced Poldip2, presumably in the endothelium. However, the mechanisms by which Poldip2 regulates EC barrier function and junctional complexes are still completely unknown.
Based on previous evidence that Poldip2 regulates the actin cytoskeleton and ROS production in other cell types and the fact that ZO-1 is redox sensitive and interacts with cytoskeletal proteins to maintain TJs in ECs, in this study we hypothesized that the mechanism by which Poldip2 mediates brain EC permeability is via ROS-dependent phosphorylation of the TJ protein ZO-1 to alter brain EC monolayer permeability. To investigate the specific role of endothelial Poldip2 in BBB disruption, we used our newly developed endothelial-specific Poldip2 knockout mice and in vitro studies with brain ECs. We found that endothelial-specific Poldip2 knockout mice exhibited reduced BBB permeability following cerebral ischemia. Our in vitro data suggest that Poldip2 knockdown protects against TNF-α-induced increase in brain EC permeability by inhibition of ZO-1 redistribution away from interendothelial junctions. Conversely, Poldip2 overexpression leads to a decrease in ZO-1 localization at the interendothelial junction, which is prevented in the presence of an antioxidant. We further show that Poldip2 overexpression induces ROS-mediated tyrosine phosphorylation of ZO-1. Importantly, this response is abrogated following treatment with a mitochondrial ROS scavenger. These data reveal a novel mitochondrial ROS-driven mechanism by which Poldip2 induces ZO-1 tyrosine phosphorylation and promotes increased EC permeability following cerebral ischemia.
Materials and methods
Animals
A new line of Poldip2 conditional knockout mice was generated by homologous recombination in embryonic stem cells and characterized in detail elsewhere [23]. Briefly, floxed Poldip2 mice were crossed with constitutive Cdh5-Cre transgenics on the C57BL/6 background (The Jackson Laboratory Stock number 006137) to generate Poldip2 EC-/- mice and their littermate controls (Poldip2 EC +/+), which were used for experiments. Mice were genotyped using a conventional PCR method. Studies involving animals were carried out in compliance with the ARRIVE guidelines. All experimental protocols and animal handling procedures were approved by the Institutional Animal Care and Use Committee at Emory University (protocol reference number: 201700864). Ethical approval was received before conducting the study.
Animal model of cerebral ischemia
Cerebral ischemia was induced in 10- to 14-week-old male mice using a transient cerebral hypoxia model as previously described [24]. Male mice were selected primarily because of the neuroprotective effects of gonadal hormones in female mice [25]. Briefly, mice were anesthetized with isoflurane in medical air (21% oxygen delivered at 0.5 L/min with 3% isoflurane for induction and 1.5% for maintenance). The right common carotid artery (RCCA) was exposed and transiently occluded by two releasable knots. To induce cerebral ischemia, medical air in the inhalation mixture was replaced with 7.5% oxygen balanced by nitrogen for 30 min. A rectal probe was connected to a temperature controller system with heating lamps and core body temperature was maintained at 37.5 ± 0.5 °C during the procedure. At the end of the hypoxic stimulation, the inhalation mixture was switched back to medical air and the RCCA knots were released. Sham-operated control mice underwent exposure and manipulation of the RCCA under anesthesia, without vascular occlusion or hypoxia.
BBB permeability assays
Alterations in the brain vascular permeability were determined in Poldip2 EC +/+ and Poldip2 EC-/- by the evaluation of Evans blue dye extravasation into the brain tissue by a blinded observer. Twenty-four hours after cerebral ischemia induction, mice received an i.v. injection of 2% Evans blue (Sigma-Aldrich, St Louis, MO) solution diluted in normal saline (4 mL/kg of body weight). The dye was allowed to circulate for 1 h. Mice were perfused with 50 mL of ice-cold phosphate-buffered saline (PBS) and their brains were removed and divided into ipsilateral and contralateral hemispheres. Evans blue was extracted at 55 °C overnight with formamide and its concentration was quantified spectrophotometrically in the supernatant at 620 nm and normalized to hemisphere weight, as previously described [21, 22].
RNA extraction and RT-qPCR
Total RNA was purified with the RNeasy Plus kit (Qiagen, Chatsworth, CA). Reverse transcription was performed using Protoscript II reverse transcriptase (New England Biolabs, Ipswich, MA) with random primers. cDNA was amplified with primers against ribosomal protein L13A (RPL, a housekeeping gene used for data normalization) (5′-ATGACAAGAAAAAGCGGATG-3′, 5′-CTTTTCTGCCTGTTTCCGTA-3′) and TNF-α (5′-CTATGTCTCAGCCTCTTCTC-3′, 5′-CATTTGGGAACTTCTCATCC-3′) using Biotium 2X Forget-Me-Not EvaGreen qPCR Master Mix with Low ROX (Biotium, Fremont, CA). Reactions were carried out in 96 wells qPCR plates, using a QuantStudio 7 Flex System (Thermo Fisher Scientific, Waltham, MA) Real-Time qPCR System. Data analysis was performed using the mak3i module of the qpcR software library [26, 27] in the R environment [28].
Cell culture
Primary rat brain microvascular endothelial cells (RBMECs, passages 4–6, Cell Biologics; Cat No. RA-6023) were cultured on dishes coated with 0.1% gelatin from bovine skin (Sigma; Cat No. G6650). Culture medium was supplemented with 2% fetal bovine serum, endothelial cell growth factors, and antibiotics (Cell Biologics; Cat No. M1266-Kit). Media were changed every 2 days. In each experiment, cultures exposed to recombinant rat TNF-α (10 ng/ml; Biotechne, Cat No. 510-RT) were compared with cells exposed to PBS control conditions. TNF-α was chosen as the stimulus because it is a classic cytokine released following stroke and an important regulator of EC permeability [29].
Trypan blue assay
Confluent RBMECs were treated with PBS or TNF-α (10 ng/ml) for six hours. RBMECs were gently rinsed with PBS, trypsinized in 0.05% Trypsin–EDTA (Gibco; Cat No. 25300054) and resuspended in cell growth media. Cells were then incubated with 10 μL of 0.4% solution of trypan blue dye (in PBS, pH 7.40; Gibco; Cat No. 15250–061) for one minute at room temperature. Total cell counts and viability was determined using a BIO-RAD TC20 automated Cell Counter.
Small interfering RNA
RBMECs at 60–80% confluence were transfected with rat siPoldip2 (sense 5′-GUCUAUUGGUGGCGAUACU[dT][dT]−3′ antisense 5′-AGUAUCGCCACCAAUAGAC[dT][dT]−3′; Sigma), siZO-1 (sense 5′-GAAGCUAUAUGAACGGUCU[dT][dT]−3′ antisense 5′-AGACCGUUCAUAUAGCUUC[dT][dT]−3′; Sigma) or control siRNA (siControl, MISSION siRNA Universal Negative Control #1; Sigma; Cat No. SIC001). Cells were washed with Hanks’ balanced salt solution (HBSS) and incubated with 100 nM of siRNA and Lipofectamine RNAiMAX Reagent (Invitrogen; Cat No. 13778150) in Opti-MEM reduced serum media (Gibco; Cat No. 31985–070). After incubating for 6 h, Opti-MEM was replaced with complete culture medium for an additional 48 h until cells were subjected to TNF-α or PBS stimulation. Gene silencing was confirmed by immunoblotting.
Adenovirus transduction
The pAdTrackCMV vector [30], containing the green fluorescent protein (GFP) gene, was used to prepare adenoviruses expressing either GFP only (AdGFP, control for AdPoldip2) or both GFP and C-terminal myc-tagged human Poldip2 (AdPoldip2). In the latter virus, Poldip2 and GFP expressions are driven by independent promoters [14, 24]. RBMECs at 80–90% confluence were transduced with recombinant adenovirus at 37 °C and 5% CO2 in serum-free medium. Following incubation for 3 h, the same volume of serum-free medium was added and incubated overnight. Media were then replaced, and cells were allowed to recover for 48 h before the experiments. Transduction efficiency ranged from 80 to 90% and was visualized by GFP just prior to experiments. For experiments in which Poldip2 was overexpressed and cells were treated with 20 mM N-acetyl cysteine (NAC, 2 M stock solution was first diluted 1:10 in ddH2O and then further diluted 1:10 in culture medium), confluent monolayers were transduced with AdPoldip2 or AdGFP and treated 48 h later with 20 mM NAC or PBS for 24 h.
FITC-dextran in vitro permeability assays
To assess RBMEC permeability, we utilized the HTS Transwell-24 well permeable support system (0.4 μm pore size, Corning; Cat No. 3396). RBMECs were transfected with either siPoldip2 or siControl sequence and 24 h later seeded at confluency (4 × 10⁴ cells/well) on insert membranes that had been preincubated with complete culture medium for 2 h at 37 °C. Confluent monolayers were treated with 10 ng/ml TNF-α added to the upper chamber for 3 h at 37 °C. Following treatment, transwell inserts were gently rinsed with warm HBSS and placed in a 24-well plate containing 600 μl of HBSS per well. Next, 200 μl of 1 mg/ml fluorescein isothiocyanate (FITC)-dextran (molecular weight 4000; Sigma; Cat No. 46944) was added to the upper chamber and allowed to incubate at 37 °C for 15 min. FITC-dextran intensity in the lower chamber was spectrophotometrically evaluated in a clear bottom black-walled microplate at 485 nm excitation and 520 nm emission [22].
Trans-monolayer permeability assay
A biotinylated collagen I solution (prepared as previously described [31]) was added to each well of a 12-well plate and incubated overnight at 4 °C. After the adsorption step, the plate was washed twice with of HBSS (37 °C) and further incubated with full medium for 1 h at 37 °C. RBMECs were transfected with either siPoldip2 or siControl and 24 h later seeded to confluency (1 × 10⁵ cells/well) on biotinylated collagen-coated plates. Confluent monolayers of RBMECs were then treated with TNF-α (10 ng/ml) or PBS for 6 h and FITC-avidin solution (Molecular Probes; Cat No. A821) was added directly to the culture medium at the final concentration of 25 μg/ml for 4 min. For the trans-monolayer permeability assays in which Poldip2 was overexpressed, RBMECs were transduced with viruses expressing AdPoldip2 or AdGFP as described above and kept in regular media for 48 h. Cells were then seeded to confluency on biotinylated collagen-coated plates. After 24 h, Rhodamine Red-X conjugated NeutrAvidin (Molecular Probes; Cat No. A6378) was added directly to the culture medium at the final concentration of 25 μg/ml for 4 min. Unbound fluorescence was washed out with 500 μl HBSS, pH 7.4, 37 °C (two cycles, 10 s each). Next, 500 μl of a 3.7% paraformaldehyde (PFA) solution was added for 10 min. Cells were then washed with 500 μl HBSS (three cycles, 10 s each) and 500 μl of PBS was added in each well. An Olympus microscope was used to measure matrix-bound fluorescent avidin (excitation 488 nm and emission 535 nm for FITC-avidin; excitation 570 nm and emission 590 nm for Rhodamine red conjugated neutravidin). Gaps between cells were measured by imaging of fluorescent avidin binding to the substrate.
Trans-endothelial electrical resistance (TEER)
RBMECs (80% confluent) were transfected with siControl or siPoldip2 and seeded to confluency (6 × 10⁴ cells/well) 48 h later in the upper chamber of a transwell permeable support (0.4 μm pore, 12 mm diameter, Corning). Twenty-four hours later, monolayers were exposed to TNF-α (10 ng/mL) added to both the bottom and top chambers for 3 h at 37 °C. For TEER measurements with Poldip2 overexpression, RBMECs were transduced with viruses expressing AdPoldip2 or AdGFP as described above. Forty-eight hours after transduction, RBMECs were seeded in the upper chamber of the transwells and allowed to recover for 24 h. Resistance was measured using STX2 chopstick electrodes connected to an EVOM2 voltohmmeter (World Precision Instruments, Berlin, Germany). The TEER (Ω × cm2) was calculated by subtracting the resistance of a blank membrane from the measured resistance, and multiplying it by the membrane surface area. Each individual experiment consisted of 2 replicates (derived from a single preparation of RBMECs). Data are reported as fold change of control (siControl PBS treated cells).
Western blot
RBMECs were lysed in a buffer containing 50 mM HEPES, 50 mM NaCl, 5 mM EDTA, 10 μg/ml aprotinin, 10 μg/ml leupeptin, 1 mM PMSF, and Halt phosphatase inhibitor cocktail (Thermo Fisher; Cat No.78428). Samples were placed on ice for 30 min and then sonicated for 10 s. Total protein concentration was assayed using the Bradford assay. Equal quantities of protein were aliquoted, and samples were brought to equal volumes in SDS sample buffer before boiling for 10 min at 100 °C. Samples were resolved in polyacrylamide gels and transferred to nitrocellulose membranes with a 0.45 μm pore size (Life science; Cat No. 10600003). Membranes were then blocked in 5% bovine serum albumin (BSA) for 1 h before overnight incubation with primary antibodies diluted in Tris-buffered saline with 0.1% tween (TBST). Primary antibodies were: anti-Poldip2 monoclonal rabbit Ab (Abcam; Cat No. Ab181841; 1:2000), anti-ZO-1 polyclonal rabbit Ab (Invitrogen; Cat No. 61–7300; 1:1000), and anti-tubulin polyclonal rabbit Ab (Abcam; Cat No. Ab6046; 1:5000). Blots were washed with TBST for 15 min before incubation with anti-rabbit horseradish peroxidase-conjugated secondary antibody (Cell Signaling; Cat No. 7074S) for 1 h. Bands were visualized using enhanced chemiluminescence (Thermo Fisher; Cat No. 34580) and detected with Amersham Hyperfilm ECL (GE). Detected bands were scanned, and densitometry was performed using ImageJ.
Immunofluorescence
Immunocytochemistry was carried out as described previously [22]. RBMECs were plated on glass coverslips, transfected with siControl or siPoldip2 and after 48 h, stimulated with TNF-α for 3 h. Alternatively, for immunofluorescence studies involving Poldip2 overexpression, RBMECs were plated on glass coverslips and transduced with AdGFP or AdPoldip2 for 72 h. For immunofluorescence experiments involving NAC treatment, RBMECs transduced with AdGFP or AdPoldip2 adenoviruses for 48 h were treated with PBS or NAC (20 mM) for 24 h prior to immunofluorescence staining. Cells were then washed twice in HBSS and fixed in 3.7% PFA diluted in HBSS for 10 min at room temperature. Cells were further washed in PBS (3 times) and permeabilized in PBS containing 0.2% Triton X-100 for 5 min, followed by three washes in PBS for 2 min each. Blocking was performed in 0.5% BSA diluted in PBS for 30 min. Anti-ZO-1 polyclonal rabbit Ab was diluted 1:1000 in blocking buffer and coverslips were incubated overnight at 4 °C with gentle rocking. The following day, coverslips were rinsed in blocking buffer (three washes, 5 min each) before incubation with anti-rabbit secondary (Alexa Fluor 633) antibody (1:500 dilution; Invitrogen; Cat No. A-21070) and DAPI (1:1000 dilution, 1 mg/mL stock solution; Thermo Fisher; Cat No. 62247) for 1 h. Cells were then rinsed three times (5 min each) in PBS. Finally, coverslips were mounted on glass slides using Fluoromount-G (Southern Biotech; Cat No. 0100–01). Negative control samples were incubated with secondary antibodies only.
Quantification of ZO-1 staining using the junction analyzer program (JAnaP)
Images were acquired on a Zeiss LSM 800 Airyscan laser scanning confocal microscope and the Zen blue software. To quantitatively analyze immunofluorescent images of ZO-1 cell–cell junctions, we used the JAnaP software, as described previously [32]. Briefly, a threshold value was identified to differentiate between regions with and without immunofluorescently tagged ZO-1. Following manual tracing of the outline of individual cells, the software quantified the proportions of continuous, punctate or perpendicular junctions. The junction feature was considered continuous if Path Length was more than the defined Minimum Length. Otherwise it was grouped as punctate or perpendicular junctions, which was categorized based on the ‘‘relative aspect ratio’’ of that feature calculated as the tip-to-tip distance (thickness measure) divided by the Path Length. Additional morphological parameters were also calculated and analyzed, including cell perimeter and area.
Amplex red assay
Extracellular H2O2 levels were detected using an Amplex Red assay kit (Molecular Probes; Cat No. A22188) according to manufacturer’s instructions [33]. RBMECs were seeded in 60 mm dishes and transduced with AdPoldip2 or AdGFP. Seventy-two hours later, monolayers were incubated with Amplex red (100 μM) and horseradish peroxidase (0.2 U/ml) for 4 h at 37 °C in Krebs-HEPES buffer (HBSS, in mM: NaCl 98.0, KCl 4.7, NaHCO3 25.0, MgSO4 1.2, KH2PO4 1.2, CaCl2 2.5, D-glucose 11.1 and HEPES-Na 20.0) protected from light. Fluorescence was measured (excitation 530 nm, emission 590 nm) using a Synergy H1 microplate reader (BioTek). Background fluorescence, determined in a control reaction without sample, was subtracted from each value. H2O2 concentration was calculated using H2O2 standards and normalized to total protein, measured using the Bradford assay (Bio-Rad). Data was finally expressed as micromolar per milligram of protein.
Immunoprecipitation
RBMECs were transduced with AdGFP or AdPoldip2 for 72 h and protein was extracted in 500 μL of lysis buffer as described above. Alternatively, for in vitro immunoprecipitation experiments involving antioxidants, after transduction with AdGFP or AdPoldip2 adenoviruses for 48 h RBMECs were treated with PBS, NAC (20 mM) for 24 h or MitoTEMPO (1 mM) for 6 h. Protein concentration was measured using the Bradford assay and the extracts, containing 4.0–5.0 mg protein/ml, were pre-cleared (4 °C for 30 min) with protein-G agarose (30 μL/mg; Santa Cruz Biotechnologies; Cat No. sc-2002). After centrifugation at 1,000 × g for 5 min, the supernatant was immunoprecipitated with mouse monoclonal anti-phosphotyrosine (BD Transduction Laboratories; Cat No. 610000) antibody (3 μg /mg) or normal mouse IgG (Santa Cruz Biotechnologies; Cat No. sc-2025) in the presence of protein-G agarose at 4 °C for 2.5 h. Immune complex-bound beads were washed three times with cold PBS, centrifuged, and resuspended in 2 × SDS sample buffer. Samples were boiled for 15 min and proteins separated by SDS-PAGE for immunoblotting using the anti-ZO-1 polyclonal rabbit antibody. Densitometric analysis of specific bands was performed using the ImageJ software.
Data analysis and statistics
The Shapiro–Wilk test was used to assess data distribution. Data were considered non-normally distributed if the P value was less than 0.05. Data are shown as mean ± standard error of the mean (SEM). Significance of normally distributed data was determined by an unpaired t test for single comparisons and two-way analysis of variance (ANOVA) followed by Tukey’s post hoc test for multiple comparisons. Non-normally distributed data are analyzed by a nonparametric Kruskal–Wallis test with Dunn’s post-hoc analysis. A threshold of P < 0.05 was considered significant. For FITC-dextran transwell experiments, biotin-avidin transmembrane experiments and TEER measurements, results are expressed as mean fold change relative to control. All statistics were calculated using Prism 7 (GraphPad) software.
Results
Endothelial-specific Poldip2 deletion protects against BBB permeability after cerebral ischemia
Given the previously described effect of heterozygous whole-body deletion of Poldip2 on BBB permeability [22], we sought to investigate the contribution of cell type-specific endothelial Poldip2 to BBB disruption after cerebral ischemia induction in vivo. Poldip2 EC-/- mice, along with their Poldip2 EC + / + littermate controls, were subjected to cerebral ischemia and Evans blue dye extravasation was used to assess changes in vascular permeability. We found that the large increase in Evans blue extravasation observed in Poldip2 EC + / + mice was significantly reduced in Poldip2 EC-/- mice (Fig. 1A).
Fig. 1.

Endothelial Poldip2 depletion protects against increased EC permeability in vivo and vitro. A Endothelial-specific deletion of Poldip2 protects against BBB permeability after cerebral ischemia in vivo. The bar graph represents means ± SEM of 4–5 mice per group. One-way ANOVA, *P < 0.05 vs. Poldip2 EC + / + sham mice, and #P < 0.05 vs. Poldip2 EC + /+ ischemic mice. B Down-regulation of Poldip2 after siRNA transfection was verified by western blotting. Bars represent mean ± SEM of 3 independent experiments. Unpaired t test, *P < 0.05. C In vitro RBMECs were transfected with siPoldip2 or siControl, seeded on transwell inserts, and treated with TNF-α (10 ng/mL) or PBS for 3 h before incubation with FITC-dextran. FITC-dextran diffusion into the lower chamber was quantified spectrophotometrically to assess changes in permeability. The graph depicts FITC-dextran concentration expressed as fold change relative to siControl + PBS. Bars represent mean ± SEM of 3–4 independent experiments. Two-way ANOVA, ***P < 0.001 vs. siControl + PBS, #P < 0.05 vs. siControl + TNF-α. D RBMECs grown in 12-well plates coated with biotinylated gelatin were transfected with Poldip2 or siControl and treated with TNF-α (10 ng/ml) or PBS for 6 h. FITC-avidin was added and the area of fluorescent gaps between cells was analyzed using ImageJ. Bars represent mean ± SEM of 4 independent experiments. Two-way ANOVA, ***P < 0.001 vs. siControl + PBS, ###P < 0.001 vs. siControl + TNF-α. E TEER was measured after a 3 h treatment with TNF-α. TEER measurements were reported as fold change relative to the siControl + PBS value. Data are presented as mean ± SEM. RBMECs initial baseline monolayers resistance was > 200 Ω × cm2. Experiments were carried out in duplicate wells (derived from a single preparation of RBMECs) and were repeated 5 times. Two-way ANOVA, ***P < 0.001 vs. siControl + PBS, ##P < 0.01 vs. siControl + TNF-α
Poldip2 depletion decreases TNF-α-induced brain endothelial cell barrier dysfunction in vitro
Before moving to an in vitro system, we wanted to confirm whether TNF-α levels are elevated in our cerebral ischemia model in vivo. Brains from C57BL/6 mice were harvested for RNA purification 24 h after cerebral ischemia induction. TNF-α mRNA levels were indeed increased in the cerebral cortex, when compared to sham control samples (Supplemental Fig. 1).
To further investigate mechanism in vitro, we exposed RBMECs in culture to 10 ng/ml recombinant rat TNF-α for 6 h. In these conditions, endothelial cell viability was not affected, as demonstrated by the trypan blue assay (Supplemental Fig. 1). In addition, TNF-α had no effect on Poldip2 protein expression (Supplemental Fig. 1).
We proceeded to measure endothelial permeability after depletion of Poldip2 using siRNA. Poldip2 gene silencing was first confirmed using immunoblotting (Fig. 1B). Permeability was then measured using three different well-established in vitro assays: FITC-dextran, paracellular avidin leakage, and transendothelial electrical resistance (TEER) measurements. In the FITC-dextran assay, the paracellular flux of fluorescent dye across RBMECs monolayers was significantly increased after treatment with TNF-α for 3 h. This effect was attenuated by Poldip2 knockdown (Fig. 1C). Similarly, using the biotin-avidin permeability assay, we confirmed that Poldip2 depletion inhibited RBMECs permeability induced by a 6 h TNF-α stimulation (Fig. 1D). Finally, in the TEER assay, RBMEC transfected with siControl and seeded on transwells as monolayers, presented a sharp decrease in electrical resistance after treatment with TNF-α for 3 h, consistent with increased permeability. However, this response was significantly attenuated in siPoldip2-transfected monolayers, thus confirming the results of the two previous assays (Fig. 1E).
Poldip2 deficiency inhibits TNF-α-induced ZO-1 redistribution from the interendothelial area
Because ZO-1 is one of the major components of tight junctions and a known regulator of paracellular permeability in endothelial cells [34, 35], we then hypothesized that Poldip2 depletion would affect ZO-1 expression or redistribution. In a first set of experiments, we observed no significant change in ZO-1 protein expression in RBMECs treated with TNF-α from 3 to 18 h (Supplemental Fig. 1). In a second set of experiments, RBMECs transfected with either siPoldip2 or siControl were stimulated with TNF-α for 3 h, before evaluation of ZO-1 staining by immunofluorescence. Consistent with a role for Poldip2 in regulating ZO-1, our data demonstrated that Poldip2 depletion significantly attenuated TNF-α-induced ZO-1 disruption and movement away from regions of cell–cell contact, thus resulting in preservation of continuous junctions (Fig. 2). No change was observed in punctate or perpendicular junctions. Importantly, transfection with siPoldip2 did not affect cell morphology (Supplemental Fig. 2).
Fig. 2.

Poldip2 knockdown inhibits TNF-α-induced ZO-1 redistribution away from the interendothelial border. RBMECs were transfected with siPoldip2 or siControl and treated with TNF-α (10 ng/mL) or PBS for 3 h. RBMECs were then fixed and incubated with antibodies against ZO-1(red) and DAPI (blue). Immunofluorescence microscopy was used to examine ZO-1 localization. To quantify ZO-1 distribution at cell junctions, 3 fields were randomly selected from each coverslip, and analyzed using the JAnaP software. White boxes in upper panels indicate which cells are analyzed in lower panels. Junction types detected by the software are either punctate (magenta), perpendicular (green), or continuous (blue). The stacked bar graph represents means ± SEM from 3 independent experiments (28–43 cells per experimental condition). Statistical analysis of continuous junctions was performed using Kruskal–Wallis test with Dunn’s post-hoc analysis, **** P < 0.0001 vs. siControl + PBS, #P < 0.05 vs. siControl + TNF-α
Poldip2 overexpression induces brain EC permeability and reduces localization of ZO-1 at the interendothelial area
To further explore the possibility that Poldip2 mediates endothelial permeability and ZO-1 disruption, RBMECs were transduced with viruses expressing both Poldip2 and GFP or GFP alone. Successful transduction of RBMECs was evident from GFP images and Poldip2 overexpression was confirmed by immunoblotting (Fig. 3A). The detection of a 42 kDa, in addition to the 37 kDa band, denotes the presence of Poldip2-myc protein from which the N-terminus has not yet been cleaved [19]. Seventy-two hours post transduction, Poldip2 overexpression significantly increased the permeability of RBMECs monolayers, as evaluated by the paracellular avidin leakage assay (Fig. 3B). We also conducted TEER measurements upon Poldip2 overexpression and found that AdPoldip2-transduced monolayers exhibited a decreased TEER, when compared to monolayers transduced with AdGFP, indicating increased permeability (Fig. 3C). The effect of Poldip2 overexpression on ZO-1 localization at interendothelial area was further evaluated by immunofluorescence. Poldip2 overexpression significantly decreased localization of continuous ZO-1 at interendothelial junctions (Fig. 3D) and had no effect on cell morphology (Supplemental Fig. 3).
Fig. 3.

Poldip2 overexpression increases EC monolayer permeability and decreases localization of ZO-1 at cell–cell junctions. RBMECs were transduced with AdPoldip2 or AdGFP. A Micrographs showing expression of GFP in confluent RBMECs transduced with adenoviruses (left panels). Up-regulation of Poldip2 after transduction was quantified by western blotting (right panels). The bar graph represents means ± SEM of 3 independent experiments normalized to β-tubulin. Unpaired t test, ***P < 0.001. B RBMECs were seeded on 12-well plates coated with biotinylated gelatin and allowed to recover for 24 h. FITC-avidin was incubated for 4 min and fluorescent areas were determined by light microscopy. Bars represent mean ± SEM of 4 independent experiments. Unpaired t test, *P < 0.05. C RBMECs were seeded on transwell inserts and allowed to recover for 24 h. TEER was measured. Data was reported as fold change of AdGFP value and bars represent mean ± SEM of 4 independent experiments. *P < 0.05. D Representative immunofluorescence images of ZO-1 (red) and DAPI (blue). Quantification was performed using JAnaP software as in Fig. 2. The stacked bar graph represents means ± SEM from 3 independent experiments (n = 28 cells analyzed for AdGFP and AdPoldip2 respectively). Statistical analysis of continuous junctions was performed using unpaired t-test, ****P < 0.0001
Poldip2 overexpression enhances H2O2 production in brain endothelial cells
Because Poldip2 has been shown to promote mitochondrial [36] as well as overall cellular ROS production in other cell types [17], we hypothesized that Poldip2 also increases ROS in RBMECs. To test this hypothesis, we first used the Amplex Red H2O2 assay. As shown in Fig. 4, overexpressing Poldip2 with AdPoldip2 caused a significant increase in H2O2 production, when compared to RBMECs transduced with control AdGFP.
Fig. 4.
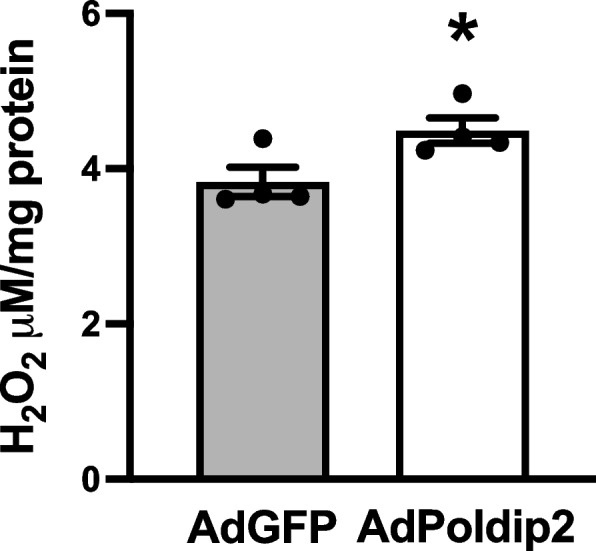
Poldip2 overexpression enhances H2O2 production. The Amplex Red assay was used to measure H2O2 generated from RBMECs that were transduced with AdGFP or AdPoldip2 72 h prior to the assay. H2O2 concentration was calculated using H2O2 standards and normalized to total protein. Bars are mean ± SEM of 4 independent experiments. Unpaired t test, *P < 0.05
Antioxidant NAC inhibits ZO-1 redistribution induced by Poldip2 overexpression
To specifically evaluate the role of ROS in mediating ZO-1 disruption, we compared the effects of Poldip2 overexpression on ZO-1 redistribution in the presence or absence of the antioxidant NAC. RBMECs were transduced with AdPoldip2 or AdGFP, treated with either PBS or NAC for 24 h and ZO-1 disruption was evaluated by immunofluorescence. ZO-1 disruption induced by Poldip2 overexpression was abolished in the presence of NAC (Fig. 5), suggesting that it requires ROS.
Fig. 5.

Antioxidant NAC inhibits ZO-1 redistribution induced by Poldip2 overexpression. RBMECs were transduced with AdPoldip2 or AdGFP. Forty-eight hours after transduction cells were treated with NAC (20 mmol/L) or PBS for 24 h. Immunofluorescence microscopy was used to quantify ZO-1 localization in 4 fields randomly selected from each coverslip, using JAnaP software, as described in Fig. 3. The stacked bar graph represents means ± SEM from 3 independent experiments (18–28 cells per experimental condition). Statistical analysis of continuous junctions was performed using two-way ANOVA with Tukey’s post-hoc analysis, ****P < 0.0001 vs. AdGFP + PBS. ####P < 0.0001 vs. AdPoldip2 + PBS
Poldip2 overexpression induces ROS-mediated tyrosine phosphorylation of ZO-1
Previous studies have shown that H2O2-induced disruption of junctional proteins was associated with phosphorylation of ZO-1 on tyrosine residues [10]. ZO-1 phosphorylation is an important mechanism regulating its redistribution and subsequent increases in permeability. Therefore, we investigated the effect of Poldip2 overexpression on tyrosine phosphorylation of ZO-1. RBMECs were transduced with AdPoldip2 or AdGFP. Cell lysates were immunoprecipitated with anti-phosphotyrosine (PY20) or control immunoglobulin G (IgG) antibodies, and probed for ZO-1. Poldip2 overexpression in RBMECs significantly induced tyrosine phosphorylation of ZO-1 (Fig. 6A). Because ZO-1 can produce multiple bands, additional experiments were performed to confirm the identity of the 220 kDa band observed in Fig. 6A. Cultured RBMECs were transfected with siZO-1 or siControl and treated with H2O2 as a positive control to stimulate ZO-1 phosphorylation. As shown in Supplemental Fig. 4, the 220 kDa band detected after immunoprecipitation with phosphotyrosine antibodies was indeed attenuated after treatment with siZO-1. We further showed that the antioxidant NAC inhibited tyrosine phosphorylation of ZO-1 mediated by Poldip2 overexpression (Fig. 6B). Efficiency of RBMEC transduction and Poldip2 overexpression is shown in Fig. 6C. Overall, our results suggest that Poldip2-mediated ZO-1 phosphorylation at the inter-endothelial area is ROS-dependent.
Fig. 6.

Poldip2 mediates tyrosine phosphorylation of ZO-1 and Poldip2 mediated tyrosine phosphorylation of ZO-1 is inhibited by NAC. A RBMECs were transduced with AdPoldip2 or AdGFP. Seventy-two hours after transduction, cell lysates were immunoprecipitated with anti-phosphotyrosine (PY20) or control IgG antibodies, and bound protein was examined by immunoblotting with ZO-1 antibody. The indicated arrow identifies the bands of ZO-1 in immunoprecipitated proteins. The intensity of the tyrosine phosphorylated ZO-1 bands in AdGFP and AdPoldip2 were compared. The bar graph represents means ± SEM (n = 5). Unpaired t test, ****P < 0.0001. B After transduction with AdGFP or AdPoldip2 adenoviruses for 48 h, RBMECs were treated with PBS or NAC (20 mM) for 24 h. Cell lysates were immunoprecipitated with PY20 or control IgG antibodies, and bound protein was examined by immunoblotting with ZO-1 antibody. The indicated arrow identifies the bands of ZO-1 in immunoprecipitated proteins. The bar graph represents means ± SEM (n = 4). One-way ANOVA, *P < 0.05 vs. AdGFP, ##P < 0.01 vs. AdPoldip2. C Micrographs showing expression of GFP in confluent RBMECs transduced with adenoviruses (left panel). Poldip2 overexpression after transduction was confirmed by western blotting
Poldip2-induced tyrosine phosphorylation of ZO-1 is mediated by mitochondrial ROS formation
NAC is widely used to decrease ROS formation, but it is considered a generic ROS inhibitor and does not provide insight into the source of ROS. Given the previously reported effects of Poldip2 on mitochondrial ROS formation [18], we sought to test the contribution of Poldip2-mediated mitochondrial ROS production to ZO-1 phosphorylation. RBMECs were transduced with AdPoldip2 or AdGFP and treated with MitoTEMPO, a mitochondrial ROS scavenger [18]. In response to Poldip2 overexpression, RBMECs exhibited an increased tyrosine phosphorylation of ZO-1 as shown by increased PY20 immunoprecipitation; however, this response was attenuated in cells treated with MitoTEMPO (Fig. 7), indicating that mitochondrial ROS are mechanistically responsible for Poldip2-mediated tyrosine phosphorylation of ZO-1.
Fig. 7.

Poldip2-mediated tyrosine phosphorylation of ZO-1 is inhibited by the mitochondrial ROS scavenger MitoTEMPO. After transduction with AdGFP or AdPoldip2 adenoviruses for 48 h, RBMECs were treated with PBS or MitoTEMPO (1 mM) for 6 h. Cell lysates were immunoprecipitated with PY20 or control IgG antibodies, and bound protein was examined by immunoblotting with ZO-1 antibody. The indicated arrow identifies the bands of ZO-1 in immunoprecipitated proteins. The bar graph represents means ± SEM (n = 3). One-way ANOVA, *P < 0.05 vs. AdGFP
Discussion
In this study, we identified a novel role for endothelial Poldip2 in mediating permeability via regulation of the TJ protein ZO-1. In vivo endothelial-specific Poldip2 depletion reduced the pathological BBB permeability increase induced by cerebral ischemia. Our in vitro results using RBMECs suggested Poldip2 knockdown prevents TNF-α-induced barrier dysfunction and ZO-1 redistribution away from cell–cell junctions. Conversely, Poldip2 overexpression enhanced mitochondrial-derived H2O2 production, which by promoting ZO-1 tyrosine phosphorylation, contributed to ZO-1 disruption at the inter-endothelial area. To our knowledge this is the first study identifying the mechanism of the profound effect of Poldip2 on TJ regulation.
As the gatekeeper of the central nervous system (CNS), the BBB plays an important physiological role in the regulation of paracellular permeability, ion balance, nutrient transport, and brain hemodynamics [3, 37]. We recently discovered that heterozygous deletion of Poldip2, a newly-identified protein that regulates important fundamental cellular processes, protects against BBB disruption and edema induced by stroke [21, 22]. The whole-body nature of the knock-out, however, did not allow us to determine the cellular contributors within the BBB that were responsible for the observed phenotype. Since ECs are essential components of the BBB and provide the first line of defense of the CNS, in this study, we focused on understanding how endothelial Poldip2 affects barrier function. Our data indicated that, similar to our previously published results in whole-body Poldip2 knock-out mice, BBB permeability was dramatically reduced in Poldip2 EC-/- mice when compared to littermate controls, suggesting that endothelial Poldip2 modulates barrier function and BBB integrity. Likewise, our in vitro investigation using RBMECs demonstrated that siRNA-mediated Poldip2 knockdown prevented a TNF-α-induced increase in EC permeability.
Based on the observations that Poldip2 regulates RBMEC barrier function and regulates the actin cytoskeleton in other cell types [16, 17], we decided to investigate whether Poldip2 affects the distribution of the prototypical molecular integrator ZO-1, whose interactions with the actin cytoskeleton are critical to TJ stabilization and EC barrier function [38]. Our in vitro data indicate that Poldip2 deletion prevents TNF-α-induced ZO-1 redistribution away from inter-endothelial junctions. ZO-1 is a major cytoskeletal organizer in ECs, which not only determines the overall distribution of F-actin but also the recruitment of force-stimulating junctional proteins and force-transmitting cytoskeletal linkers to junctional proteins, a critical determinant of endothelial cell contact integrity [34, 39]. Therefore, our data indicate that Poldip2 plays a crucial role in regulating junctional homeostasis by regulating ZO-1 tyrosine phosphorylation and, thereby, ZO-1 distribution. Although other studies have shown that TNF-α treatment decreases ZO1 expression in human retinal endothelial cells [40] and in human brain endothelial cells [41], we only saw a small, not statistically significant decrease in ZO1 levels in RBMECs stimulated with TNF-α and, therefore, conclude that the tyrosine-phosphorylate resistribution of ZO-1 is the major regulatory mechanism.
One of the most interesting findings in our study is that Poldip2 overexpression contributes to redox regulation of ZO-1, potentially through the regulation of mitochondrial ROS production. Posttranslational modifications of junctional proteins have been shown influence TJ assembly and integrity [42]. All membrane-associated guanylate kinase (MAGUKs) family members, including ZO-1, ZO-2 and ZO-3, have an SH3 domain, a region of homology to guanylate kinase and a 90 amino acid PDZ domain that is likely involved in interaction with actin and other signaling molecules. Additionally, these proteins share a conserved tyrosine residue (position 621 in human ZO-1), followed by a putative SH2 domain recognition sequence [43]. ROS formation induces an increase in tyrosine phosphorylation of ZO-1 and in paracellular permeability, which is prevented by tyrosine kinase inhibitors [10, 44]. Our results thus provide additional mechanistic insight by showing that Poldip2 promotes mitochondrial ROS-mediated tyrosine phosphorylation of ZO-1. While previous studies have shown that Poldip2 regulates mitochondrial ROS formation [18], to our knowledge, our report is the first to show that redox regulation of ZO-1 phosphorylation is mediated by mitochondrial-specific ROS production. Although the mechanism by which Poldip2 regulates mitochondrial ROS requires further investigation, these data are critical not only in furthering our understanding of how Poldip2 regulates brain endothelial cell permeability, but also in identifying potential new therapeutic targets in the Poldip2 pathway.
Future directions for our studies include to determine whether Poldip2 regulates additional junctional proteins, such as occludin and claudins. Moreover, in addition to tyrosine phosphorylation, ZO-1 redistribution at the inter-endothelial area was also reported to correlate with serine and threonine phosphorylation [45]. Further investigation will be required to determine whether Poldip2 also mediates phosphorylation of ZO-1 at serine and threonine. Future studies should also explore which tyrosine kinase(s) and phosphatase(s) are responsible for Poldip2-mediated ZO-1 phosphorylation. Previous studies have shown that several tyrosine kinases and phosphatases appear to bind and use ZO-1 as a substrate [46–48], but wether any of these are involved in BBB stability remains to be confirmed. Finally, in our cell culture experiments, brain ECs were stimulated with TNF-α to mimic in vivo cerebral ischemia. However, several other cytokines as well as hypoxia have been shown to be involved in cerebral ischemia-induced BBB disruption and further investigation will be required to determine whether they also utilize Poldip2.
In summary, our data clearly show that increased mitochondrial ROS production by Poldip2 plays a crucial role in disrupting endothelial barrier function by promoting phosphorylation of the TJ protein ZO-1. These discoveries provide novel insight into the mechanism by which Poldip2 regulates junctional proteins, and identify potential new therapeutic targets to improve endothelial barrier function in neurological diseases associated with increased BBB permeability.
Supplementary Information
Supplemental Fig. 1. Cerebral ischemia induces TNF-α upregulation in the cerebral cortex and TNF-α treatment has no effect on cell viability or Poldip2 and ZO-1 protein expression in cultured RBMECs. A TNF-α mRNA levels were measured in cerebral cortex 24 h after cerebral ischemia induction in C57BL/6 mice. The bar graph represents means ± SEM. Unpaired t test, *** P < 0.001. B RBMEC viability in response to 10 ng/ml TNF-α treatment for 6 h was determined by the trypan blue assay. The bar graph represents means ± SEM of 5 independent experiments. C Poldip2 and D ZO-1 protein levels were assessed by western blotting in RBMECs. Bars represent mean ± SEM of 3 independent experiments.
Supplemental Fig. 2. Effect of Poldip2 knockdown on RBMEC morphology. A The average cell perimeter and B area were calculated using the JAnaP software (n=37 cells analyzed for siControl group and n=28 cells analyzed for siPoldip2 group). Bars represent means ± SEM.
Supplemental Fig. 3. Effect of Poldip2 overexpression on RBMEC morphology. A The average cell perimeter and B area were calculated using the JAnaP software (n=28 cells analyzed for AdGFP and AdPoldip2 group respectively). Bars represent means ± SEM.
Supplemental Fig. 4. ZO-1 knockdown attenuated H2O2 stimulated ZO-1 phosphorylation. RBMECs were transfected with siControl or siZO-1 and 48 h later stimulated with H2O2 for 4 h. Cell lysates were immunoprecipitated with PY20 or control IgG antibodies, and probed for ZO-1. The indicated arrow identifies the bands of ZO-1 in immunoprecipitated proteins. Down-regulation of ZO-1 after siRNA knockdown was verified by immunoblotting. The intensity of the tyrosine phosphorylated ZO-1 bands in siControl + H2O2 and siZO-1 + H2O2 were compared. The bar graph represents means ± SEM. Unpaired t test, *** P < 0.001.
Supplementary Material 5. Uncropped gels.
Abbreviations
- BBB
Blood–brain barrier
- CNS
Central nervous system
- EC
Endothelial cell
- FITC
Fluorescein isothiocyanate
- GFP
Green fluorescent protein
- HBSS
Hanks’ balanced salt solution
- JAnaP
Junction Analyzer Program
- LPS
Lipopolysaccharide
- MAGUKs
Membrane-associated guanylate kinase homologs
- NAC
N-acetyl cysteine
- Nox4
NADPH oxidase 4
- PBS
Phosphate-buffered saline
- PCNA
Proliferating cell nuclear antigen
- Poldip2
Polymerase (DNA-directed) delta-interacting protein 2
- RBMEC
Rat brain microvascular endothelial cells
- RCCA
Right common carotid artery
- ROS
Reactive oxygen species
- TEER
Trans-endothelial electrical resistance
- TJ
Tight junction
- TNF-α
Tumor necrosis factor
- ZO-1
Zonula occludens protein 1
Authors’ contributions
M.S.H. conceived of and designed the study. K.W. performed in vitro studies in RBMECs. MSH did the in vivo experiments. M.S.H. and K.W. wrote and edited the manuscript. H.Q. provided assistance in performing in vitro immunofluorescence and performed FITC-dextran permeability assays. R.H. performed immunoprecipitation studies using the mitochondrial ROS scavenger. D.E. and C.S. provided technical expertise and helped with TEER measurements in vitro. J.M. helped edit the manuscript. B.L. helped with mouse breeding colony maintenance and strategies, provided technical assistance on assays, and helped edit the manuscript. K.K.G. provided expertise, helped with conceptual design, and edited the manuscript. All authors read and approved the final manuscript.
Funding
This study was supported by NIH grant 1R01NS127964, P01 HL095070, HL152167, and DK110409. Keke Wang was funded by The China Scholarship Council (CSC) (No. 201806280493).
Data availability
All data supporting the conclusions of this study are included in this article.
Declarations
Competing interests
The authors declare no competing interests.
Footnotes
Publisher’s Note
Springer Nature remains neutral with regard to jurisdictional claims in published maps and institutional affiliations.
References
- 1.Varatharaj A, Galea I. The blood-brain barrier in systemic inflammation. Brain Behav Immun. 2017;60:1–12. [DOI] [PubMed] [Google Scholar]
- 2.McConnell HL, Kersch CN, Woltjer RL, Neuwelt EA. The Translational Significance of the Neurovascular Unit. J Biol Chem. 2017;292:762–70. [DOI] [PMC free article] [PubMed] [Google Scholar]
- 3.Hawkins BT, Davis TP. The blood-brain barrier/neurovascular unit in health and disease. Pharmacol Rev. 2005;57:173–85. [DOI] [PubMed] [Google Scholar]
- 4.Zihni C, Mills C, Matter K, Balda MS. Tight junctions: from simple barriers to multifunctional molecular gates. Nat Rev Mol Cell Biol. 2016;17:564–80. [DOI] [PubMed] [Google Scholar]
- 5.Abdullahi W, Tripathi D, Ronaldson PT. Blood-brain barrier dysfunction in ischemic stroke: targeting tight junctions and transporters for vascular protection. Am J Physiol Cell Physiol. 2018;315:C343–56. [DOI] [PMC free article] [PubMed] [Google Scholar]
- 6.Forster C. Tight junctions and the modulation of barrier function in disease. Histochem Cell Biol. 2008;130:55–70. [DOI] [PMC free article] [PubMed] [Google Scholar]
- 7.Stamatovic SM, Johnson AM, Keep RF, Andjelkovic AV. Junctional proteins of the blood-brain barrier: New insights into function and dysfunction. Tissue Barriers. 2016;4: e1154641. [DOI] [PMC free article] [PubMed] [Google Scholar]
- 8.Fanning AS, Jameson BJ, Jesaitis LA, Anderson JM. The tight junction protein ZO-1 establishes a link between the transmembrane protein occludin and the actin cytoskeleton. J Biol Chem. 1998;273:29745–53. [DOI] [PubMed] [Google Scholar]
- 9.Beutel O, Maraspini R, Pombo-Garcia K, Martin-Lemaitre C, Honigmann A. Phase Separation of Zonula Occludens Proteins Drives Formation of Tight Junctions. Cell. 2019;179(923–936): e911. [DOI] [PubMed] [Google Scholar]
- 10.Rao RK, Basuroy S, Rao VU, Karnaky KJ Jr, Gupta A. Tyrosine phosphorylation and dissociation of occludin-ZO-1 and E-cadherin-beta-catenin complexes from the cytoskeleton by oxidative stress. Biochem J. 2002;368:471–81. [DOI] [PMC free article] [PubMed] [Google Scholar]
- 11.Basuroy S, Seth A, Elias B, Naren AP, Rao R. MAPK interacts with occludin and mediates EGF-induced prevention of tight junction disruption by hydrogen peroxide. Biochem J. 2006;393:69–77. [DOI] [PMC free article] [PubMed] [Google Scholar]
- 12.Chattopadhyay R, Dyukova E, Singh NK, Ohba M, Mobley JA, Rao GN. Vascular endothelial tight junctions and barrier function are disrupted by 15(S)-hydroxyeicosatetraenoic acid partly via protein kinase C epsilon-mediated zona occludens-1 phosphorylation at threonine 770/772. J Biol Chem. 2014;289:3148–63. [DOI] [PMC free article] [PubMed] [Google Scholar]
- 13.Liu L, Rodriguez-Belmonte EM, Mazloum N, Xie B, Lee MY. Identification of a novel protein, PDIP38, that interacts with the p50 subunit of DNA polymerase delta and proliferating cell nuclear antigen. J Biol Chem. 2003;278:10041–7. [DOI] [PubMed] [Google Scholar]
- 14.Huff LP, Kikuchi DS, Faidley E, Forrester SJ, Tsai MZ, Lassegue B, Griendling KK. Polymerase-delta-interacting protein 2 activates the RhoGEF epithelial cell transforming sequence 2 in vascular smooth muscle cells. Am J Physiol Cell Physiol. 2019;316:C621–31. [DOI] [PMC free article] [PubMed] [Google Scholar]
- 15.Brown DI, Lassegue B, Lee M, Zafari R, Long JS, Saavedra HI, Griendling KK. Poldip2 knockout results in perinatal lethality, reduced cellular growth and increased autophagy of mouse embryonic fibroblasts. PLoS ONE. 2014;9: e96657. [DOI] [PMC free article] [PubMed] [Google Scholar]
- 16.Datla SR, McGrail DJ, Vukelic S, Huff LP, Lyle AN, Pounkova L, Lee M, Seidel-Rogol B, Khalil MK, Hilenski LL, et al. Poldip2 controls vascular smooth muscle cell migration by regulating focal adhesion turnover and force polarization. Am J Physiol Heart Circ Physiol. 2014;307:H945-957. [DOI] [PMC free article] [PubMed] [Google Scholar]
- 17.Lyle AN, Deshpande NN, Taniyama Y, Seidel-Rogol B, Pounkova L, Du P, Papaharalambus C, Lassegue B, Griendling KK. Poldip2, a novel regulator of Nox4 and cytoskeletal integrity in vascular smooth muscle cells. Circ Res. 2009;105:249–59. [DOI] [PMC free article] [PubMed] [Google Scholar]
- 18.Forrester SJ, Xu Q, Kikuchi DS, Okwan-Duodu D, Campos AC, Faidley EA, Zhang G, Lassegue B, Sadikot RT, Griendling KK, Hernandes MS. Poldip2 deficiency protects against lung edema and vascular inflammation in a model of acute respiratory distress syndrome. Clin Sci (Lond). 2019;133:321–34. [DOI] [PMC free article] [PubMed] [Google Scholar]
- 19.Hernandes MS, Lassegue B, Griendling KK. Polymerase delta-interacting Protein 2: A Multifunctional Protein. J Cardiovasc Pharmacol. 2017;69:335–42. [DOI] [PMC free article] [PubMed] [Google Scholar]
- 20.Schieber M, Chandel NS. ROS function in redox signaling and oxidative stress. Curr Biol. 2014;24:R453-462. [DOI] [PMC free article] [PubMed] [Google Scholar]
- 21.Hernandes MS, Lassegue B, Hilenski LL, Adams J, Gao N, Kuan CY, Sun YY, Cheng L, Kikuchi DS, Yepes M, Griendling KK. Polymerase delta-interacting protein 2 deficiency protects against blood-brain barrier permeability in the ischemic brain. J Neuroinflammation. 2018;15:45. [DOI] [PMC free article] [PubMed] [Google Scholar]
- 22.Kikuchi DS, Campos ACP, Qu H, Forrester SJ, Pagano RL, Lassegue B, Sadikot RT, Griendling KK, Hernandes MS. Poldip2 mediates blood-brain barrier disruption in a model of sepsis-associated encephalopathy. J Neuroinflammation. 2019;16:241. [DOI] [PMC free article] [PubMed] [Google Scholar]
- 23.Lassegue B, Kumar S, Mandavilli R, Wang K, Tsai M, Kang DW, Demos C, Hernandes MS, San Martin A, Taylor WR, et al. Characterization of Poldip2 knockout mice: Avoiding incorrect gene targeting. PLoS ONE. 2021;16: e0247261. [DOI] [PMC free article] [PubMed] [Google Scholar]
- 24.Eidson LN, Gao Q, Qu H, Kikuchi DS, Campos ACP, Faidley EA, Sun YY, Kuan CY, Pagano RL, Lassegue B, et al. Poldip2 controls leukocyte infiltration into the ischemic brain by regulating focal adhesion kinase-mediated VCAM-1 induction. Sci Rep. 2021;11:5533. [DOI] [PMC free article] [PubMed] [Google Scholar]
- 25.Manwani B, McCullough LD. Sexual dimorphism in ischemic stroke: lessons from the laboratory. Womens Health (Lond). 2011;7:319–39. [DOI] [PMC free article] [PubMed] [Google Scholar]
- 26.Ritz C, Spiess AN. qpcR: an R package for sigmoidal model selection in quantitative real-time polymerase chain reaction analysis. Bioinformatics. 2008;24:1549–51. [DOI] [PubMed] [Google Scholar]
- 27.Boggy GJ, Woolf PJ. A mechanistic model of PCR for accurate quantification of quantitative PCR data. PLoS ONE. 2010;5: e12355. [DOI] [PMC free article] [PubMed] [Google Scholar]
- 28.Core Team. R: A language and environment for statistical computing. R Foundation for Statistical Computing, Vienna, Austria. 2023. https://www.R-project.org/.
- 29.Pan W, Kastin AJ. Tumor necrosis factor and stroke: role of the blood-brain barrier. Prog Neurobiol. 2007;83:363–74. [DOI] [PMC free article] [PubMed] [Google Scholar]
- 30.He TC, Zhou S, da Costa LT, Yu J, Kinzler KW, Vogelstein B. A simplified system for generating recombinant adenoviruses. Proc Natl Acad Sci U S A. 1998;95:2509–14. [DOI] [PMC free article] [PubMed] [Google Scholar]
- 31.Dubrovskyi O, Birukova AA, Birukov KG. Measurement of local permeability at subcellular level in cell models of agonist- and ventilator-induced lung injury. Lab Invest. 2013;93:254–63. [DOI] [PMC free article] [PubMed] [Google Scholar]
- 32.Gray KM, Katz DB, Brown EG, Stroka KM. Quantitative Phenotyping of Cell-Cell Junctions to Evaluate ZO-1 Presentation in Brain Endothelial Cells. Ann Biomed Eng. 2019;47:1675–87. [DOI] [PubMed] [Google Scholar]
- 33.Audi SH, Friedly N, Dash RK, Beyer AM, Clough AV, Jacobs ER. Detection of hydrogen peroxide production in the isolated rat lung using Amplex red. Free Radic Res. 2018;52:1052–62. [DOI] [PMC free article] [PubMed] [Google Scholar]
- 34.Tornavaca O, Chia M, Dufton N, Almagro LO, Conway DE, Randi AM, Schwartz MA, Matter K, Balda MS. ZO-1 controls endothelial adherens junctions, cell-cell tension, angiogenesis, and barrier formation. J Cell Biol. 2015;208:821–38. [DOI] [PMC free article] [PubMed] [Google Scholar]
- 35.Rodgers LS, Beam MT, Anderson JM, Fanning AS. Epithelial barrier assembly requires coordinated activity of multiple domains of the tight junction protein ZO-1. J Cell Sci. 2013;126:1565–75. [DOI] [PMC free article] [PubMed] [Google Scholar]
- 36.Cheng X, Kanki T, Fukuoh A, Ohgaki K, Takeya R, Aoki Y, Hamasaki N, Kang D. PDIP38 associates with proteins constituting the mitochondrial DNA nucleoid. J Biochem. 2005;138:673–8. [DOI] [PubMed] [Google Scholar]
- 37.Sandoval KE, Witt KA. Blood-brain barrier tight junction permeability and ischemic stroke. Neurobiol Dis. 2008;32:200–19. [DOI] [PubMed] [Google Scholar]
- 38.Wittchen ES, Haskins J, Stevenson BR. Protein interactions at the tight junction. Actin has multiple binding partners, and ZO-1 forms independent complexes with ZO-2 and ZO-3. J Biol Chem. 1999;274:35179–85. [DOI] [PubMed] [Google Scholar]
- 39.Vestweber D. VE-cadherin: the major endothelial adhesion molecule controlling cellular junctions and blood vessel formation. Arterioscler Thromb Vasc Biol. 2008;28:223–32. [DOI] [PubMed] [Google Scholar]
- 40.Barros Ferreira L, Ashander LM, Ma Y, Appukuttan B, Williams KA, Best G, Smith JR. Effects of tumor necrosis factor-alpha and interleukin-1beta on human retinal endothelial cells. Cytokine. 2024;173: 156407. [DOI] [PubMed] [Google Scholar]
- 41.TNF-alpha and IL-1beta Modulate Blood-Brain Barrier Permeability and Decrease Amyloid-beta Peptide Efflux in a Human Blood-Brain Barrier Model R. Versele, E. Sevin, F. Gosselet, L. Fenart and P. Candela. Int J Mol Sci.2022;23(18).10.3390/ijms231810235. [DOI] [PMC free article] [PubMed]
- 42.Gonzalez-Mariscal L, Tapia R, Chamorro D. Crosstalk of tight junction components with signaling pathways. Biochim Biophys Acta. 2008;1778:729–56. [DOI] [PubMed] [Google Scholar]
- 43.Van Itallie CM, Balda MS, Anderson JM. Epidermal growth factor induces tyrosine phosphorylation and reorganization of the tight junction protein ZO-1 in A431 cells. J Cell Sci. 1995;108(Pt 4):1735–42. [DOI] [PubMed] [Google Scholar]
- 44.Rao RK, Baker RD, Baker SS, Gupta A, Holycross M. Oxidant-induced disruption of intestinal epithelial barrier function: role of protein tyrosine phosphorylation. Am J Physiol. 1997;273:G812-823. [DOI] [PubMed] [Google Scholar]
- 45.Rochfort KD, Cummins PM. The blood-brain barrier endothelium: a target for pro-inflammatory cytokines. Biochem Soc Trans. 2015;43:702–6. [DOI] [PubMed] [Google Scholar]
- 46.Festa BP, Chen Z, Berquez M, Debaix H, Tokonami N, Prange JA, Hoek GV, Alessio C, Raimondi A, Nevo N, et al. Impaired autophagy bridges lysosomal storage disease and epithelial dysfunction in the kidney. Nat Commun. 2018;9:161. [DOI] [PMC free article] [PubMed] [Google Scholar]
- 47.Sallee JL, Burridge K. Density-enhanced phosphatase 1 regulates phosphorylation of tight junction proteins and enhances barrier function of epithelial cells. J Biol Chem. 2009;284:14997–5006. [DOI] [PMC free article] [PubMed] [Google Scholar]
- 48.Drexler HCA, Vockel M, Polaschegg C, Frye M, Peters K, Vestweber D. Vascular Endothelial Receptor Tyrosine Phosphatase: Identification of Novel Substrates Related to Junctions and a Ternary Complex with EPHB4 and TIE2. Mol Cell Proteomics. 2019;18:2058–77. [DOI] [PMC free article] [PubMed] [Google Scholar]
Associated Data
This section collects any data citations, data availability statements, or supplementary materials included in this article.
Supplementary Materials
Supplemental Fig. 1. Cerebral ischemia induces TNF-α upregulation in the cerebral cortex and TNF-α treatment has no effect on cell viability or Poldip2 and ZO-1 protein expression in cultured RBMECs. A TNF-α mRNA levels were measured in cerebral cortex 24 h after cerebral ischemia induction in C57BL/6 mice. The bar graph represents means ± SEM. Unpaired t test, *** P < 0.001. B RBMEC viability in response to 10 ng/ml TNF-α treatment for 6 h was determined by the trypan blue assay. The bar graph represents means ± SEM of 5 independent experiments. C Poldip2 and D ZO-1 protein levels were assessed by western blotting in RBMECs. Bars represent mean ± SEM of 3 independent experiments.
Supplemental Fig. 2. Effect of Poldip2 knockdown on RBMEC morphology. A The average cell perimeter and B area were calculated using the JAnaP software (n=37 cells analyzed for siControl group and n=28 cells analyzed for siPoldip2 group). Bars represent means ± SEM.
Supplemental Fig. 3. Effect of Poldip2 overexpression on RBMEC morphology. A The average cell perimeter and B area were calculated using the JAnaP software (n=28 cells analyzed for AdGFP and AdPoldip2 group respectively). Bars represent means ± SEM.
Supplemental Fig. 4. ZO-1 knockdown attenuated H2O2 stimulated ZO-1 phosphorylation. RBMECs were transfected with siControl or siZO-1 and 48 h later stimulated with H2O2 for 4 h. Cell lysates were immunoprecipitated with PY20 or control IgG antibodies, and probed for ZO-1. The indicated arrow identifies the bands of ZO-1 in immunoprecipitated proteins. Down-regulation of ZO-1 after siRNA knockdown was verified by immunoblotting. The intensity of the tyrosine phosphorylated ZO-1 bands in siControl + H2O2 and siZO-1 + H2O2 were compared. The bar graph represents means ± SEM. Unpaired t test, *** P < 0.001.
Supplementary Material 5. Uncropped gels.
Data Availability Statement
All data supporting the conclusions of this study are included in this article.