

Abstract
Objective
Electronic health applications (apps) allow patients with rheumatoid arthritis (RA) to report patient‐reported outcomes (PROs) between visits. However, almost no data exist on patients’ report of pain between visits and how that correlates with change in function and/or modifications to medication.
Methods
Patients with RA from one rheumatology practice provided data as part of a study of an app. Patients answered PRO short forms using the app, including the Patient‐Reported Outcomes Measurement Information System pain interference and physical function questionnaires. Each PRO was answered every eight days. We assessed the frequency of significant worsening in pain using the minimally clinically important difference (MCID) of ≥5 points. Logistic regression assessed whether worsening in pain was associated with functional declines and/or RA medication changes.
Results
Among 150 patients with RA using the app, 83 patients qualified for analysis; the mean age was 62 years, and 82% were female. The median number of pain interference PROs answered per patient was 37 over 52 weeks. Using the first five pain interference PRO responses as the baseline, 60 (72%) patients experienced worsening of at least the MCID, with a median duration of 16 days. The odds ratio (OR) relating significantly worsening pain to declines in function over the next 42 days was 2.71 (95% confidence interval [CI] 1.12–6.89). Worsening pain was not significantly associated with changes to RA medication (OR 1.59, 95% CI 0.62–4.17).
Conclusion
Clinically significant increases in pain among patients with RA are commonly associated with reductions in function but not with RA medication changes.
INTRODUCTION
Close monitoring of disease activity and management of long‐term medications are essential aspects of managing chronic conditions, such as rheumatoid arthritis (RA). In clinical care, treatment recommendations are primarily based on patient and physician assessments of disease activity at the time of a visit. Patient‐reported outcomes (PROs) are commonly measured in research settings, but digital health tools increasingly allow PROs to be measured and communicated between patient and provider in routine care. 1 , 2 , 3 Various electronic health applications (apps) have been developed to facilitate an interface that is compelling to users and serves as a valid and reliable method of PRO collection. Several proof‐of‐concept studies provide an essential basis for medical apps being used more broadly throughout routine health care. 1 , 4 One study shows that approximately two‐thirds of patients with RA are willing to use mobile health apps to better monitor and manage their chronic disease, and approximately two‐thirds of patients with RA are adherent with answering PROs using an app. 5
PROs can provide patients and their providers the opportunity to help monitor symptoms and determine when new interventions might be most useful. Brief (“short form”) PRO measures have been developed and validated as part of the Patient‐Reported Outcomes Measurement Information System (PROMIS). Pain interference (“pain”) and physical function (“function”) have been shown to be the most important PROMIS domains for patients with RA. 6 , 7 Pain interference has been measured in patients with RA, and minimally clinically important difference (MCID) thresholds have been established. 8 MCIDs provide a benchmark to define important changes in pain; these may be used to define thresholds for changes in therapy. Function has been measured using the PROMIS short form in patients with RA; they report a lower‐than‐average function compared with the general population (43 vs 50 on a 100‐point scale). 9
As noted, the development and diffusion of digital health tools provides the possibility of adopting PROs into routine care of RA. These PROs can be measured consistently between visits and not just at the time of a visit. Such longitudinal measurement might allow for more efficient care: visits when needed because of significantly worsening pain and/or function and not at a prespecified routine frequency. However, the literature provides little information on the longitudinal pattern of PRO measures between visits and how increases in PROs, such as pain, impact patient's function and RA medication decisions, factors that may inform visit timing. In this report, we describe longitudinal patterns of pain, function, and medication changes from data generated as part of a study of a mobile health app in RA.
PATIENTS AND METHODS
Study design and participants
Participants were recruited from the Brigham and Women's Hospital Arthritis Center in Boston, Massachusetts. The cohort of patients was recruited between 2021 and 2022 for a research study aimed at improving the efficiency of RA care via a mobile health app. 10 Patient selection criteria included a diagnosis of RA from a rheumatologist, at least two visits to a rheumatologist in the 12 months before the date of consent, access to a personal phone or tablet that allowed for installation of an app, age ≥18 years, and proficiency in English to facilitate consent and interaction with the app. Patients gave written informed consent either in person or over the telephone and were provided with a link to download the app. On successful download, patients received push notifications from the app to inform them of available questionnaires to complete. After patients downloaded the app and answered their first questionnaire, they were given a $25 gift card and considered part of the study population.
Minimal use of the app was required for inclusion in our analyses. To be included, patients must have answered the pain interference PRO at least five times to establish a baseline. Additionally, we required at least half of the available pain interference PRO scores to be answered (17 questionnaires) in addition to the baseline for a total of 22 pain scores.
PROs
The National Institutes of Health (NIH) has developed item banks intended to evaluate and standardize PRO measurements across various populations and conditions. The NIH's PROMIS, a program created to collect and report clinical research information, was used to measure pain (PROMIS pain interference – short form 4a) and function (PROMIS function – short form 4a) scores. 9 , 11 , 12 , 13 Each questionnaire was four items and was answered via the RA PRO app. These short forms were used in the app study because of their efficient means of collecting daily information on the impact of RA symptoms. Patients received notifications to answer the relevant questionnaire every eight days. This analysis focuses on the pain interference PRO as the main exposure, and the physical function PRO as one of our two main outcomes.
We used MCID values found in the literature to assess clinically significant changes in the PROs. 8 , 14 We classified the MCID as a ≥5‐point change from the baseline average, which is half the SD of PROMIS metrics in which scores have a mean of 50 and an SD of 10. This MCID has been identified in prior work as significant changes in pain interference scores. 12 , 15 , 16 A ≥5‐point worsening (increase in pain or decrease in functioning) was used in the analyses.
We described the incidence of a ≥5‐point increase in the pain interference PRO (ie, the MCID) after a baseline was established. To account for variability among the first few PROs patients answered, we established baseline by averaging the first five data points. 17 Any subsequent pain interference PRO measurement that was ≥5 points higher than the baseline average was considered to have reached the MCID.
Outcomes of interest and covariates
The two outcomes in our analysis were (1) a reduction in physical function and (2) a change to RA medication. We defined a reduction in function as the first ≥5‐point reduction in the PROMIS function PRO compared with baseline, 18 which was calculated using the same method as the pain interference PROs. Patients with this outcome were required to have 22 function scores (5 baseline plus 17 additional). RA medication changes comprised any of the following: substitution or addition of a disease‐modifying antirheumatic drug (DMARD), an increase in dosage or frequency of administration of a DMARD or oral glucocorticoid, or intensification in route (ie, oral to subcutaneous) for methotrexate during the study compared to the year before study initiation. Any of these modifications were counted as one change to a patient's medication from baseline (one year before study initiation) to the study period.
We also extracted data from the electronic health record (EHR) regarding patient characteristics, including demographics, RA characteristics, and medications. Data for variables with changing values (eg, C‐reactive protein [CRP], citrullinated peptide antibody, rheumatoid factor) were collected from information in the EHR recorded within 12 months of starting to use the app.
Statistical analysis
We first described the population of patients included in these analyses using descriptive statistics, means, medians, and percentages. We also described the population of patients from the RA PRO app study that was excluded and included patients from the PROs pain interference analysis. Next, we calculated PRO averages and SDs to describe baseline variability. We assessed the correlation between pain interference and physical function at baseline. Then we examined the number of individuals who had ≥5‐point increases in the pain interference PRO at any time, how many times their pain scores were reported at this threshold, and the duration of the increase as measured by consecutive scores. Patients were considered to have consecutive eight‐day cycles of significantly increased pain even if they had a missing cycle.
We used a nested case‐control design with incidence density sampling to evaluate the association between pain interference increases and subsequent functional declines. 19 , 20 We identified case patients as individuals with at least one decrease in physical function of ≥5 points. If they had multiple decreases, the first one after the baseline period was chosen as the outcome. We then identified matched controls as individuals who had a function score available in the same eight‐day PRO cycle as the case patient's functional decrease but had no decrease themselves.
Because of the nature of incidence density sampling, controls were able to become cases as time went on. We then identified which individuals had a ≥5‐point increase in their pain interference PRO in the 42 days before the function outcome. We used a 42‐day lag to account for five eight‐day cycles of PRO questionnaires (40 days). Because the function form gets sent to patients 2 days after the pain form, we added a 2‐day buffer so we would have five complete PRO cycles for each patient; thus, we arrived at a 42‐day lag. A graphical description of this method is shown in Supplemental Figure 1. Logistic regression models adjusted for age, sex, time between pain increase and functional decline, and baseline function score were constructed to evaluate the association between pain increases and functional declines. We also created logistic regression models additionally adjusted for the Deyo–Charlson Comorbidity Index and depression status.
The same sampling methods were used to construct a cohort of individuals with RA medication changes. The first medication change was used as the outcome of interest, and incidence density sampling was used to select controls who did not have medication changes during the same time period. The exposure of interest was again a ≥5‐point increase in pain in the 42 days before the medication change. Adjusted logistic regression models were constructed.
Significance testing was performed using two‐sided test with P < 0.05 as the threshold of statistical significance. This study was approved by the Mass General Brigham Institutional Review Board. All analyses were conducted using R program (version 4.2.2; R Group for Statistical Computing).
RESULTS
A total of 83 adults were enrolled in the RA app study and completed >50% of their available questionnaires between September 2021 and June 2023. The sample reflected a spectrum of patients with RA who differed by age, race and ethnicity, rheumatologist, and disease characteristics (Table 1). Participants were mostly female (82%) and White (93%) and had a mean age of 62 (SD 11) years. Disease duration was variable, with 7% of patients having early disease (less than two years) and 93% having established disease (more than two years). More than half of participants were on a conventional synthetic DMARD (csDMARD; 67%), and about half were on a biologic DMARD (58%). The median of the first five pain interference PROs, or baseline, was found to be 55 (interquartile range [IQR] 12.8). The distribution of baseline pain interference and physical function is shown in Supplemental Figure 2. The correlation between pain interference and physical function at baseline was found to be −0.96 (P < 0.001).
Table 1.
Baseline characteristics and demographics of 83 patients with RA*
| Characteristic a | N = 83 |
|---|---|
| Sex, n (%) | |
| Female | 68 (82) |
| Male | 15 (18) |
| Age, mean (SD), y | 62 (11) |
| Race and ethnicity, n (%) | |
| Asian | 2 (2.4) |
| Black | 2 (2.4) |
| Other or declined | 2 (2.4) |
| White | 77 (93) |
| Comorbidities | |
| Deyo–Charlson comorbidity index, mean (SD) | 1.5 (1.2) |
| Hypertension, n (%) | 25 (30) |
| Obesity, n (%) | 17 (20) |
| Depression, n (%) | 8 (9.6) |
| Osteoporosis | 16 (19) |
| Medications, n (%) | |
| csDMARDs | 56 (67) |
| btsDMARDs | 48 (58) |
| NSAIDs | 12 (14) |
| Opioids | 15 (18) |
| Glucocorticoids | 27 (33) |
| Laboratory values | |
| CRP, mean (SD), mg/L a | 5 (12) |
| ACPA, positive, n (%) a | 36 (57) |
| RF, positive, n (%) a | 34 (55) |
| Either ACPA or RF, n (%) | 43 (52) |
| Pain interference, mean (SD) | 53 (7) |
| Physical function, mean (SD) | 44 (8) |
Seropositivity refers to the presence of RF and anti‐CCP (or ACPA) in the blood. ACPA, anti–citrullinated protein antibody; anti‐CCP, anti–cyclic citrullinated peptide; btsDMARD, biologic/targeted synthetic disease‐modifying antirheumatic drug; CRP, C‐reactive protein; csDMARD, conventional synthetic disease‐modifying antirheumatic drug; NSAID, nonsteroidal anti‐inflammatory drug; RA, rheumatoid arthritis; RF, rheumatoid factor.
Missing values for CRP (n = 1), ACPA (n = 20), and RF (n = 21).
The first five pain interference PRO data points were averaged to form a comparative baseline score. The average SD of baseline pain scores is 2.89, and the SD range is 0 to 7.79. Forty‐one (49%) patients had an increase or decrease of ≥5 points during the baseline period.
Figure 1 depicts the time course and frequency of clinically significant changes in PROMIS pain interference scores. The cumulative incidence curve (see Figure 1A) depicts patients’ ≥5‐point MCID incidence rate during the duration of the study period, with 72% reaching this at least once during follow‐up. The number of clinically significant increases in pain per person are shown in Figure 1B. Among the 60 people who had at least 1 clinically significant increase in pain, the median number of times they exceeded the MCID threshold was five. Figure 1C shows the distribution of time in eight‐day cycles spent above the MCID among the 60 people with at least one MCID, revealing a median pain duration of two PRO cycles (equivalent to 16 days). Figure 2 is a parallel figure and shows similar statistics for physical function: a cumulative incidence curve, a graph of the number of significant functional decreases, and the duration of consecutive clinically significant decreases in function.
Figure 1.
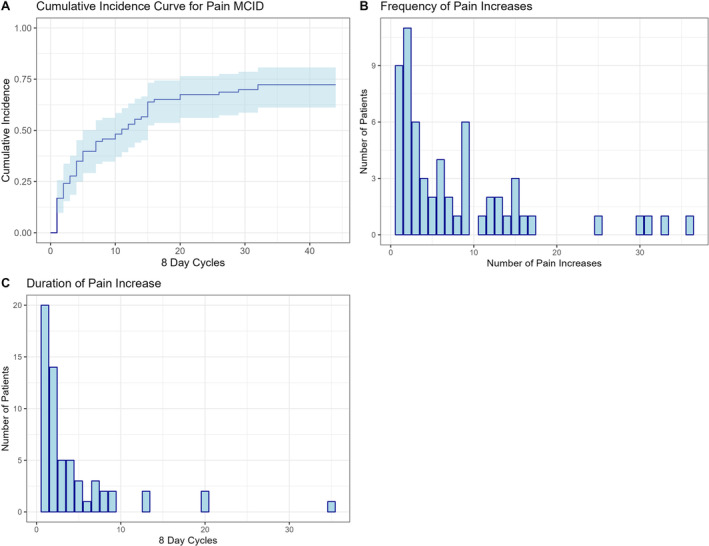
The time course and frequency of clinically significant changes in Patient‐Reported Outcomes Measurement Information System pain interference across the 12‐month study period. (A) This cumulative incidence curve shows the time (number of eight‐day cycles) until the first clinically significant increase in pain. (B) This histogram illustrates the frequency of clinically significant increases in pain. (C) This histogram illustrates the duration of consecutive clinically significant pain increases in eight‐day cycles at the patient level. In panels A and C, the x‐axis shows the eight‐day cycles over the 12 months. MCID, minimally clinically important difference.
Figure 2.

The time course and frequency of clinically significant Patient‐Reported Outcomes Measurement Information System function decreases across the 12‐month study period. (A) This cumulative incidence curve shows the time (number of eight‐day cycles) until the first clinically significant decrease in physical function. (B) This histogram illustrates the frequency at the patient level of clinically significant decreases in function. (C) This histogram illustrates the duration of consecutive clinically significant functional decreases in eight‐day cycles at the patient level. In panels A and C, the x‐axis shows the eight‐day cycles over the 12 months. MCID, minimally clinically important difference.
The PROMIS function scores of patients who had significant increases in pain are summarized in Table 2. Throughout the 12‐month study period, there were a total of 47 decreases in function scores that surpassed the MCID. Twenty‐one (45%) of these declines were preceded by a clinically significant pain increase in the 42 days prior. Seven patients had a functional decline within 8 days of an MCID, 7 patients had a functional decline within 9 to 16 days of an MCID, 6 patients had a functional decline within 17 to 24 days of an MCID, 9 patients had a functional decline within 25 to 32 days of an MCID, and 18 patients had a functional decline within 33 to 42 days of an MCID. Of the 47 participants who had a functional decline, 37 (79%) had multiple declines. The median duration of a functional decline was four (IQR 1–7) days. Table 3 shows the results of the multivariable regression model adjusted for age, sex, time between pain increase and functional decline, and baseline function score. Individuals with a ≥5‐point increase in pain interference had 3.42 higher odds (95% confidence interval [CI] 1.31–9.61) of having a functional decline within 42 days compared to those who did not have a pain increase. Supplemental Table 1 shows the same logistic regression models additionally adjusted for comorbidity index and depression, with little change to the pain increase odds ratio (OR 3.51, 95% CI 1.33–9.97).
Table 2.
Description of functional declines and medication changes among individuals with eligible pain and function scores*
| Characteristic | Patients, n = 81 (functional decline) | Patients, n = 83 (medication changes) |
|---|---|---|
| Individuals with at least one functional decline surpassing MCID, n (%) | 47 (58) | – |
| Patients with more than one functional decline (n = 47), n (%) | 37 (79) | – |
| Duration of functional declines among those with any functional decline (n = 47), mean (SD), days | 6.332 (7.6) | – |
| Individuals with at least one medication change, n (%) | – | 41 (49) |
| Types of medication changes among those who had any change (n = 41), n (%) | – | – |
| Corticosteroid dosage increase | – | 17 (41) |
| Etanercept addition | – | 5 (12) |
| Methotrexate addition or dosage increase | – | 4 (10) |
| Hydroxychloroquine addition or dosage increase | – | 4 (10) |
| Adalimumab addition | – | 4 (10) |
| Other medication changes | – | 7 (17) |
| Individuals with more than one medication change, n (%) | – | 13 (32) |
n for functional declines is 81 and not 83 because two people did not report enough function measures. Rheumatoid arthritis medication increases are composed of any of the following: substitution or addition of a DMARD, an increase in dosage or frequency of administration of a DMARD or oral glucocorticoid, or intensification in route (ie, oral to subcutaneous) for methotrexate. A clinically significant increase in pain is defined in the text. Medication changes listed as “other” include tocilizumab (n = 1), certolizumab pegol (n = 1), sarilumab (n = 1), abatacept (n = 2), infliximab (n = 1), and tofacitinib (n = 1). DMARD, disease‐modifying antirheumatic drug; MCID, minimally clinically important difference, defined as ≥5.
Table 3.
Logistic regression results for clinically important declines in function after clinically important increases in pain among patients with RA*
| OR | 95% CI | |
|---|---|---|
| Pain increase | 3.42 | 1.31–9.61 |
| Sex | ||
| Female | 1.00 (ref) | 1.00 (ref) |
| Male | 0.39 | 0.12–1.17 |
| Age, per year increase | 1.00 | 0.96–1.04 |
| Days between pain increase and functional decline | 1.02 | 0.98–1.07 |
| Baseline function score | 0.98 | 0.92–1.03 |
CI, confidence interval; OR, odds ratio; RA, rheumatoid arthritis; ref, reference.
Medication changes of patients are summarized in Table 2. The most common RA medication changes were new glucocorticoid usage (ie, patient was not using glucocorticoids during the one year before study initiation but started using it during the study period). Throughout the 12‐month study period, there were 41 medication changes. Seventeen (41%) of the medication changes were preceded by a ≥5‐point increase in pain within 42 days. The distribution of the most frequent medication changes is as follows: 17 patients increased their glucocorticoid dosage or frequency, five patients had an addition of etanercept, four patients increased their methotrexate dosage or frequency, and four patients had an addition of hydroxychloroquine. Five patients had a medication increase within 9 to 16 days of an MCID, 4 patients had a medication increase within 17 to 24 days of an MCID, eight patients had a medication increase within 25 to 32 days of an MCID, and 24 patients had a medication increase within 33 to 42 days of an MCID. Among the 41 individuals with any medication change, 13 (32%) had more than one change. Table 4 shows the results of the multivariable regression model adjusted for age and sex. The OR for the association between increasing pain and medication changes was not statistically significant (OR 2.02, 95% CI 0.74–5.88). The addition of comorbidity index and depression to the model did not change the significance of the pain increase (OR 2.00, 95% CI 0.72–5.93).
Table 4.
Logistic regression results for increased treatment after clinically important increases in pain among patients with RA*
| Characteristic | OR | 95% CI |
|---|---|---|
| Pain increase | 2.02 | 0.74–5.88 |
| Sex | ||
| Female | 1.00 (ref) | 1.00 (ref) |
| Male | 0.99 | 0.29–3.39 |
| Age as per year increase | 1.04 | 0.99–1.10 |
| Days between pain increase and increased treatment | 1.03 | 0.99–1.09 |
CI, confidence interval; OR, odds ratio; RA, rheumatoid arthritis; ref, reference.
Supplemental Table 2 describes the baseline characteristics of patients from the RA PRO app study who were excluded and included patients from the PROs pain interference analysis. Although most of the demographics are similarly distributed across cohorts, there are some notable differences among comorbidities, medications, and laboratory values; obesity (excluded 6%, included 13%), csDMARDs (excluded 55%, included 67%), nonsteroidal anti‐inflammatory drugs (excluded 27%, included 14%), CRP (excluded SD 3.3 mg/L, included SD 11.5 mg/L), and anti–citrullinated protein antibody (positive; excluded 46%, included 57%).
DISCUSSION
Although much has been written about PROs in RA, there is close to no information on longitudinal pain assessments recorded via PROs and how these may impact patient function and RA medication. We investigated how the pain interference scores recorded on a PRO app might impact function and changes to RA medication. We determined that patients with minimally clinically important increases in pain had a greater than two times odds of also experiencing a minimally clinically important decrease in function. Another interesting occurrence was that pain interference and physical function were highly correlated during the baseline period despite this association being outside our intended observation window. We also observed that patients with minimally clinically important increases in pain were not significantly more likely to have a change in medication, but the statistical power for this association was limited.
The set of analyses conducted using PRO data from a mobile health app offers some relevant insights. We identified a significant association between increasing pain and subsequent decreasing function, which can allow a physician to anticipate and inform their patients on best strategies for mitigating functional declines. It was surprising to see that pain reported almost weekly was not significantly associated with RA medication changes. Although the statistical power was limited, it is possible that the worsening pain was too brief in some instances to cause a medication change, or it may be the case that rheumatologists considered certain pain episodes to be unrelated to the patient's RA and thus did not require a change in medication. If one assumes that the RA medication changes occurred at appropriate times, the current results suggest that routine PRO pain interference measures demonstrating worsening levels do not always warrant medication changes. It is also possible that pain is not the only driver of medication changes and that other PROs can influence the outcome. Although not definitive, these results suggest the importance of a clinician's interpretation of worsening pain via PROs. Pain interference is perhaps not sufficient alone to warrant physician‐guided medication changes. Thus, a better understanding of physician management modeling will ensure an improved use of PRO‐collecting apps. Whereas several rheumatic disease app studies focus on workflow impacts and the logistical considerations of PRO data collection, 2 , 3 , 21 the current study suggests the importance of identifying how PRO collection may be most useful and relevant to clinical situations by pointing out how symptom changes might be predicted, as well as potential hesitations to changing medications.
Other studies researching health apps have focused on identifying factors conducive to the successful adoption by both patients and physicians. These studies point out the importance of accounting for health literacy while developing and/or curating questionnaires or employing technology that is easy to use for patients and physicians. Agreeing on meaningful thresholds for the PROs will allow easier use of the collected data by patients and clinicians. 15 , 22 Few prior research studies with apps have focused on how detected trends might influence care management. 6 As health apps become more widely used in monitoring and managing chronic diseases, it is important to employ such advancements in the clinic to improve the efficiency of care; the ability to use PROs to predict symptoms, such as functional decline, ought to contribute to creating more intentional appointments rather than following a fixed appointment schedule or frequency.
This study is not without limitations. The patient sample was all from one rheumatology practice, and all had agreed to participate in an app study. An initial limitation is the lack of diversity in our study cohort, as well as the fact that our EHRs do not include information on education or socioeconomic status. Differences between cohorts of patients that were included and excluded from our analysis were also observed, such as csDMARD use and CRP laboratory values being higher in the included cohort. We offer the explanation that sicker individuals may be more compelled to participate in a study to regularly track their symptoms. Another limiting factor is that disease activity measurements are not incorporated in this analysis. A potential limitation is that the baseline pain interference scores being used to calculate baseline periods are inevitably variable, which we see in our results. An additional limitation is that our selected lag time is not informed by specific literature. The period of 42 days is based on our study design and allows ample time for a physical function outcome to be observed following any potential pain increases, but we recognize that 42 days is somewhat arbitrary.
Another limiting aspect of this study is the lack of accessibility to prescription filling information. During both the baseline period (12 months before the study period) and during the study period, RA medication changes were tracked using the EHR and by manually extracting medication data; however, some glucocorticoid data are not accurately reported in the EHR. 23 Furthermore, we did not include analgesics in the medication changes tracking outcome because they are often used as needed. Thus, it is possible that analgesics were used by patients instead of new RA treatments. Using PROMIS short forms as a method of PRO collection also poses a limitation because of the sacrifice in reliability that is made to reduce user response burden. 24 Short forms are not perfectly correlated with the original PROMIS instruments, and higher SEs are associated with the point estimates of four‐item questionnaires compared to the longer forms. The physical function 4a form also does not account for some symptoms involved with RA, such as upper extremities items. We also acknowledge that physical function and pain interference have some overlap, which could explain their strong correlation. Another limitation is that the distribution of physical function measures may have been limited by a ceiling effect known to occur in the physical function 4a form. 25 Additionally, patients may have experienced multiple increases in pain interference, but we focused the analyses on the first episode. We also recognize that rheumatologists overseeing the implementation of the research app into clinical care may have reservations about using patient app data to inform their decisions, such as prompting changes to medication. Lastly, we acknowledge that this analysis could benefit from investigating multiple outcomes per patients to further investigate pain interference, which could be done by looking at associations with additional PROs or other changes in disease status.
This is one of the first attempts at identifying and quantifying trends in RA PROs collected longitudinally using a mobile health app. Determining how such data should impact clinical care is critical for ongoing efforts to integrate health apps into routine clinical care. Our findings that physicians are not statistically more likely to make a medication change after their patient has experienced an increase in pain may seem surprising. However, it may be explained by clinicians who may think that a short form PRO is not useful for decision‐making and thus may be less likely to view PRO results, or they might want pain PROs to be corroborated by a physical examination before making a medication change. Alternatively, we found that increasing pain does lead to decreasing function. This is a helpful association that physicians can use to predict and inform patients of potential upcoming functional declines and discuss how to mitigate them. Collecting PROs can lead to valuable insights on how a patient is managing their RA, and we look forward to future research on longitudinal PRO data collected from mobile health apps.
AUTHOR CONTRIBUTIONS
All authors were involved in drafting the article or revising it critically for important intellectual content, and all authors approved the final version to be published. Dr Solomon had full access to all of the data in the study and takes responsibility for the integrity of the data and the accuracy of the data analysis.
Study concept and design
Altwies, Santacroce, Solomon.
Acquisition of data
Altwies, Santacroce, Stratton, Ellrodt, Solomon.
Analysis and interpretation of data
Altwies, Santacroce, Marrugo, Rudin, Solomon.
Supporting information
Disclosure form:
Supplemental Figure 1:Example Scenario for Incidence Density Sampling.
Supplemental Table 2: Baseline characteristics of patients from the RA PRO App study excluded and included in PROs Pain analysis.
Supplemental Table 1: Logistic regression results for decreases in function additionally adjusted for Comorbidity Index and Depression.
Supplemental Table 3: Logistic regression results for increased treatment additionally adjusted for Comorbidity Index and Depression.
Supplemental Figure 2: Baseline Pain Interference and Physical Function.
Supported by the Rheumatology Research Foundation, which is supported by the NIH (grant P30‐AR‐072577 [VERITY]).
Authors Altwies and Santacroce are co‐first authors and contributed equally to this work.
Additional supplementary information cited in this article can be found online in the Supporting Information section (https://acrjournals.onlinelibrary.wiley.com/doi/10.1002/acr2.11768).
Author disclosures are available at https://onlinelibrary.wiley.com/doi/10.1002/acr2.11768.
REFERENCES
- 1. Nelson EC, Eftimovska E, Lind C, et al. Patient reported outcome measures in practice. BMJ 2015;350:g7818. [DOI] [PubMed] [Google Scholar]
- 2. Bingham CO III, Noonan VK, Auger C, et al. Montreal Accord on Patient‐Reported Outcomes (PROs) use series ‐ paper 4: patient‐reported outcomes can inform clinical decision making in chronic care. J Clin Epidemiol 2017;89:136–141. [DOI] [PMC free article] [PubMed] [Google Scholar]
- 3. Snyder CF, Aaronson NK, Choucair AK, et al. Implementing patient‐reported outcomes assessment in clinical practice: a review of the options and considerations. Qual Life Res 2012;21(8):1305–1314. [DOI] [PubMed] [Google Scholar]
- 4. Richter JG, Nannen C, Chehab G, et al. Mobile app‐based documentation of patient‐reported outcomes ‐ 3‐months results from a proof‐of‐concept study on modern rheumatology patient management. Arthritis Res Ther 2021;23(1):121. [DOI] [PMC free article] [PubMed] [Google Scholar]
- 5. Knitza J, Simon D, Lambrecht A, et al. Mobile health usage, preferences, barriers, and ehealth literacy in rheumatology: patient survey study. JMIR Mhealth Uhealth 2020;8(8):e19661. [DOI] [PMC free article] [PubMed] [Google Scholar]
- 6. Nowell WB, Gavigan K, Kannowski CL, et al. Which patient‐reported outcomes do rheumatology patients find important to track digitally? A real‐world longitudinal study in ArthritisPower. Arthritis Res Ther 2021;23(1):53. [DOI] [PMC free article] [PubMed] [Google Scholar]
- 7. Bacalao EJ, Greene GJ, Beaumont JL, et al. Standardizing and personalizing the treat to target (T2T) approach for rheumatoid arthritis using the Patient‐Reported Outcomes Measurement Information System (PROMIS): baseline findings on patient‐centered treatment priorities. Clin Rheumatol 2017;36(8):1729–1736. [DOI] [PubMed] [Google Scholar]
- 8. Bartlett SJ, Gutierrez AK, Andersen KM, et al. Identifying minimal and meaningful change in a patient‐reported outcomes measurement information system for rheumatoid arthritis: use of multiple methods and perspectives. Arthritis Care Res (Hoboken) 2022;74(4):588–597. [DOI] [PMC free article] [PubMed] [Google Scholar]
- 9. Bartlett SJ, Orbai AM, Duncan T, et al. Reliability and validity of selected PROMIS measures in people with rheumatoid arthritis. PLoS One 2015;10(9):e0138543. [DOI] [PMC free article] [PubMed] [Google Scholar]
- 10. Solomon DH, Dalal AK, Landman AB, et al. Development and testing of an electronic health record‐integrated patient‐reported outcome application and intervention to improve efficiency of rheumatoid arthritis care. ACR Open Rheumatol 2022;4(11):964–973. [DOI] [PMC free article] [PubMed] [Google Scholar]
- 11. Cella D, Choi SW, Condon DM, et al. PROMIS® adult health profiles: efficient short‐form measures of seven health domains. Value Health 2019;22(5):537–544. [DOI] [PMC free article] [PubMed] [Google Scholar]
- 12. Amtmann D, Cook KF, Jensen MP, et al. Development of a PROMIS item bank to measure pain interference. Pain 2010;150(1):173–182. [DOI] [PMC free article] [PubMed] [Google Scholar]
- 13. Rose M, Bjorner JB, Gandek B, et al. The PROMIS Physical Function item bank was calibrated to a standardized metric and shown to improve measurement efficiency. J Clin Epidemiol 2014;67(5):516–526. [DOI] [PMC free article] [PubMed] [Google Scholar]
- 14. Revicki D, Hays RD, Cella D, et al. Recommended methods for determining responsiveness and minimally important differences for patient‐reported outcomes. J Clin Epidemiol 2008;61(2):102–109. [DOI] [PubMed] [Google Scholar]
- 15. Bingham CO III, Butanis AL, Orbai AM, et al. Patients and clinicians define symptom levels and meaningful change for PROMIS pain interference and fatigue in RA using bookmarking. Rheumatology (Oxford) 2021;60(9):4306–4314. [DOI] [PMC free article] [PubMed] [Google Scholar]
- 16. Nagaraja V, Mara C, Khanna PP, et al. Establishing clinical severity for PROMIS® measures in adult patients with rheumatic diseases. Qual Life Res 2018;27(3):755–764. [DOI] [PMC free article] [PubMed] [Google Scholar]
- 17. Falligant JM, McNulty MK, Kranak MP, et al. Evaluating sources of baseline data using dual‐criteria and conservative dual‐criteria methods: A quantitative analysis. J Appl Behav Anal 2020;53(4):2330–2338. [DOI] [PMC free article] [PubMed] [Google Scholar]
- 18. Norman GR, Sloan JA, Wyrwich KW. Interpretation of changes in health‐related quality of life: the remarkable universality of half a standard deviation. Med Care 2003;41(5):582–592. [DOI] [PubMed] [Google Scholar]
- 19. Lubin JH, Gail MH. Biased selection of controls for case‐control analyses of cohort studies. Biometrics 1984;40(1):63–75. [PubMed] [Google Scholar]
- 20. Robins JM, Gail MH, Lubin JH. More on Biased selection of controls for case‐control analyses of cohort studies. Biometrics 1986;42(2):293–299. [PubMed] [Google Scholar]
- 21. Lavallee DC, Austin E, Franklin PD. How can health systems advance patient‐reported outcome measurement? Jt Comm J Qual Patient Saf 2018;44(8):439–440. [DOI] [PMC free article] [PubMed] [Google Scholar]
- 22. Noonan VK, Lyddiatt A, Ware P, et al. Montreal Accord on Patient‐Reported Outcomes (PROs) use series ‐ paper 3: patient‐reported outcomes can facilitate shared decision‐making and guide self‐management. J Clin Epidemiol 2017;89:125–135. [DOI] [PubMed] [Google Scholar]
- 23. Hua C, Buttgereit F, Combe B. Glucocorticoids in rheumatoid arthritis: current status and future studies. RMD Open 2020;6(1):e000536. [DOI] [PMC free article] [PubMed] [Google Scholar]
- 24. Validation. Health Measures. Accessed July 12, 2023. https://www.healthmeasures.net/explore‐measurement‐systems/promis/measure‐development‐research/validation
- 25. Jensen RE, Potosky AL, Reeve BB, et al. Validation of the PROMIS physical function measures in a diverse US population‐based cohort of cancer patients. Qual Life Res 2015;24(10):2333–2344. [DOI] [PMC free article] [PubMed] [Google Scholar]
Associated Data
This section collects any data citations, data availability statements, or supplementary materials included in this article.
Supplementary Materials
Disclosure form:
Supplemental Figure 1:Example Scenario for Incidence Density Sampling.
Supplemental Table 2: Baseline characteristics of patients from the RA PRO App study excluded and included in PROs Pain analysis.
Supplemental Table 1: Logistic regression results for decreases in function additionally adjusted for Comorbidity Index and Depression.
Supplemental Table 3: Logistic regression results for increased treatment additionally adjusted for Comorbidity Index and Depression.
Supplemental Figure 2: Baseline Pain Interference and Physical Function.