

ABSTRACT
Background:
Ovarian tumors are the most prevalent neoplasms worldwide, affecting women of all ages. According to Globocan’s 2022 projections, by 2050, the number of women diagnosed with ovarian cancer worldwide will increase by over 55% to 503,448. The number of women dying from ovarian cancer is projected to increase to 350,956 each year, an increase of almost 70% from 2022.
Aims and Objectives:
The aim of this study was to analyze the various histopathological spectra of ovarian tumors according to the latest 2020 WHO classification and to assess the age distribution, frequency of incidence, and laterality of different subtypes of ovarian tumors.
Materials and Methods:
This retrospective study included 190 cases of histopathologically proven ovarian tumors reported by the pathology department from March 2020 to March 2024 at the Rajendra Institute of Medical Sciences, Ranchi, Jharkhand, India.
Results:
A total of 190 cases were studied, 154 (81.1%) were benign, 8 (4.2%) were borderline, and 28 (14.7%) cases were malignant. Surface epithelial tumors (SETs) were the most common (n = 139, 73.2%), followed by germ cell tumors (GCTs) (n = 38, 20%). Serous cystadenomas (n = 63, 33%) were the most common benign tumors, whereas the most common malignant tumors were serous carcinomas ( n=11, 5.7% ). Most ovarian tumors (n = 45, 23.68%) occurred in the 31–40-year-old age group.
Conclusion:
The present study showed various histopathological patterns of ovarian tumors. This study indicated a slight increase in the prevalence of malignant ovarian tumors in the middle-aged group and and a relative increase in the percentage of SETs over GCTs in recent years in our tertiary care center in Jharkhand, India. With limited resources in our institute, histopathological examination remains the mainstay for the early diagnosis of these tumors and their timlely and appropriate management.
Categories: Pathology.
Keywords: Germ cell tumors, histopathological spectrum, ovarian tumors, surface epithelial tumors, WHO
Introduction
Globally,ovarian cancer is the significant cause of higher morbidity and mortality rates among women. It is the eighth most common cancer among women worldwide and the eighth most common cause of cancer-related death in women.[1]
Ovarian cancer is a global concern, and according to the Global Cancer Observatory (GLOBOCON) 2022, 324,603 women have been reported to have ovarian cancer worldwide. By 2050, the number of women diagnosed with ovarian cancer worldwide will increase from 55% to 503448 anually.[2]
The Indian Cancer Registry data project states that the ovary is one of the most important locations for carcinoma, and approximately 8.7% of the cancers in India are due to ovarian causes.[3] Ovarian cancer ranks as the third most common gynecological cancer, followed by cervical and uterine cancers, and has the worst prognosis.[1,4] Ovarian cancer’s highest death rate is due to a lack of specific signs, symptoms, and effective screening methods, which leads to diagnosis during the late stages of the disease and hence is named the silent killer.[5,6] According to the cell of origin, ovarian tumors can arise from epithelium, sexual cord-stromal cells, germ cells, connective tissue, and metastatic non-ovarian cells exhibiting various clinical and histomorphological characteristics.[7]
The majority of ovarian tumors are benign and usually occur in women aged 20 to 45, while malignant tumors are more prevalent in women aged 40 to 65 and tend to have a poorer prognosis.[8] The risk factors for ovarian cancer are increasing age, nulliparity, genetic factors, postmenopausal hormonal therapy, obesity, and cigarette smoking.[9,10,11] Familial genetic syndromes have been shown to be the strongest risk factors influencing ovarian cancer, accounting for 10–12% of all cases.[12,13]
This study was performed to meet the aim of analyzing histopathological variations of ovarian tumors in our tertiary care center, categorizing them according to the latest World Health Organization’s (WHO) 2020 classification, and also further analyzing the prevalence, age distribution, and laterality of various ovarian tumors.
Materials and Methods
This observational retrospective study was conducted in the histopathology section of the Pathology Department, RIMS, Ranchi, India. An analysis of all ovarian specimens histopathologically diagnosed as ovarian tumors over 4 years, from March 2020 to March 2024, was retrieved and assessed. A total of 190 cases were analyzed. As the study was record-based, the ethics committee has waived the requirement of informed consent for both adult and minor datasets. The ethical clearance was granted by the Institutional Ethics Committee, RIMS, Ranchi, India. (approval number: Memo No. 143, IEC, RIMS).
Inclusion criteria
All ovary biopsy specimens (total hysterectomy, unilateral or bilateral salpingo-oophorectomy, and unilateral or bilateral ovarian cystectomy) received in the histopathology laboratory that were histopathologically diagnosed as ovarian tumors.
Exclusion criteria
Tumor-like lesions were excluded from analysis.
The staining was performed with hematoxylin and eosin. Each case was studied with respect to age, laterality, gross and microscopic findings of the tumor. Ovarian tumors were classified according to the 2020 World Health Organization (WHO) histological classification system.
The data were gathered and sorted using a Microsoft Excel 2013 based on the distribution of tumors as SETs, GCTs, Sex Cord-Stromal tumors (SCSTs), and miscellaneous (metastatic) tumors. Statistical analysis was performed by using the latest version of the Statistical Package for Social Science (SPSS) version 20 for frequencies.
Results
This retrospective observational study included a total of 190 cases. The maximum number of patients was observed in the fourth decade of life, and the age range lies between 8 and 72 years, as shown in Figure 1 and Table 1. The majority of the cases were benign (n = 154, 81.1%), followed by malignant tumors (n = 28, 14.7%), and borderline tumors (n = 8, 4.2%), as illustrated in Table 1.
Figure 1.

A Flowchart showing the overall methodology of the studyRIMS, Rajendra Institute of Medical Sciences
Table 1.
Age-wise distribution of the number of cases and biological behavior of ovarian tumors
| Age range | Benign (n, %) | Borderline (n, %) | Malignant (n, %) | Total (n, %) |
|---|---|---|---|---|
| 0-10 | 5 (2.6%) | 0 | 0 | 5 (2.6%) |
| 11-20 | 24 (12.6%) | 0 | 5 (2.6%) | 29 (15.3%) |
| 21-30 | 36 (19%) | 0 | 4 (2.1%) | 40 (21.1%) |
| 31-40 | 37 (19.5%) | 2 (1.1%) | 6 (3.2%) | 45 (23.7%) |
| 41-50 | 26 (13.7%) | 5 (2.6%) | 6 (3.2%) | 37 (19.4%) |
| 51-60 | 17 (9%) | 1 (0.5%) | 4 (2.1%) | 22 (11.7%) |
| 61-70 | 8 (4.2%) | 0 | 3 (1.5%) | 11 (5.7%) |
| 71-80 | 1 (0.5%) | 0 | 0 | 1 (0.5%) |
| Total (n, %) | 154 (81.1%) | 8 (4.2%) | 28 (14.7%) | 190 (100%) |
These ovarian tumors were classified according to the latest WHO classification for 2020 and categorized according to age. SETs constituted the majority of 139 (73.2%) cases, followed by GCTs (n = 38, 20%), SCSTs (n = 11, 5.7%), and 2 (1.1) cases of metastatic tumors [Table 2].
Table 2.
Age-wise distribution of ovarian tumors according to WHO 2020 classification
| Age (Yr) | Surface epithelial tumor (n, %) | Germ cell tumors (n, %) | Sex cord-stromal tumors (n, %) | Miscellaneous tumors (metastatic) (n, %) | Total number (n, %) |
|---|---|---|---|---|---|
| 0-10 | 1 (0.5%) | 3 (1.6%) | 1 (0.5%) | 0 | 5 (2.6%) |
| 11-20 | 13 (6.8%) | 10 (5.3%) | 5 (2.6%) | 1 (0.5%) | 29 (15.3%) |
| 21-30 | 32 (16.8%) | 7 (3.7%) | 1 (0.5%) | 0 | 40 (21.1%) |
| 31-40 | 33 (17.4%) | 10 (5.3%) | 2 (1.1%) | 0 | 45 (23.7%) |
| 41-50 | 34 (17.9%) | 3 (1.5%) | 0 | 0 | 37 (19.4%) |
| 51-60 | 16 (8.4%) | 4 (2.1%) | 1 (0.5%) | 1 (0.5%) | 22 (11.7%) |
| 61-70 | 10 (5.3%) | 0 | 1 (0.5%) | 0 | 11 (5.7%) |
| 71-80 | 0 | 1 (0.5%) | 0 | 0 | 1 (0.5%) |
| Total | 139 (73.2%) | 38 (20%) | 11 (5.7%) | 2 (1.1%) | 190 (100%) |
Figure 2.

Distribution of the number of cases of ovarian tumors in different age groups
In our study, SETs consisted of 139 cases (73.2%). Among these SETs, serous tumors accounted for 76 (40%) cases, mucinous tumors for 59 (31.1%) cases, Brenner tumors for 3 (1.6%) cases, and clear cell tumors for 1 case (0.5%). Of 76 (40%) cases of serous tumors, 64 (33.5%) were benign, 1 (0.5%) was borderline, and 11 (5.7%) were malignant. About 63 (33%) cases were serous cystadenomas, 8 (4.2%) cases were HGSCA, 3 (1.5%) cases were LGSCA [Image 1], and 1 (0.5%) case each consisted serous adenofibroma and serous borderline tumor. Mucinous tumors comprised 59 (31.1%) cases of total cases, among which 47 (25%) cases were benign mucinous cystadenomas, while mucinous borderline tumors and mucinous carcinomas were 7 (3.7%) cases and 5 (2.6%) cases, respectively. There were 2 (1.1%) cases of benign brenner tumors [Image 2] and 1 (0.5%) case of malignant brenner tumors [Image 3 and Table 3].
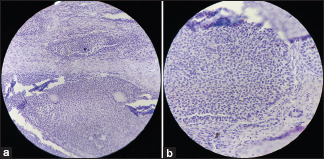
Image 1.

Low grade serous carcinoma (a) H&E, 20X; Papillary pattern with tumor cells showing moderate nuclear atypia and low mitotic index. (b) H&E, 40X; Numerous psammoma bodies
Image 2.

Benign brenner tumor (a) H&E, 20X; Nests of transitional epithelial cells surrounded by fibrous stroma. (b) H&E, 40X; A nest of transitional epithelial cells, with cells showing grooved nuclei (coffee bean appearance)
Image 3.

Malignant brenner tumor (a) H&E, 20X; (b) H&E, 40X; Stromal invasion by clusters of tumor cells with irregular margins and single cells
Table 3.
Distribution of surface epithelial tumors
| Types of tumor | Benign (n, %) | Borderline (n, %) | Malignant (n, %) | Total (n, %) |
|---|---|---|---|---|
| Serous tumor | 64 (33.6%) | 1 (0.5%) | 11 (5.7%) | 76 (40%) |
| Mucinous tumor | 47 (24.7%) | 7 (3.6%) | 5 (5%) | 59 (31.1%) |
| Endometrioid tumor | 0 | 0 | 0 | 0 |
| Clear cell tumor | 0 | 0 | 1 (0.5%) | 1 (0.5%) |
| Brenner tumor | 2 (1.1%) | 0 | 1 (0.5%) | 3 (1.6%) |
| Other carcinomas | 0 | 0 | 0 | 0 |
| Total (n) | 113 (59.4%) | 8 (4.2%) | 18 (9.4%) | 139 (73.2%) |
Germ cell tumors (GCTs) were ranked as the second most prevalent tumors (n=38, 20%) after SETs in our study. Among them, 33 (17.4%) cases were mature cystic teratomas, 2 (1.1%) cases were dysgerminomas, and 1 (0.5%) case each of immature teratomas, yolk sac tumors [Image 4], and mixed GCT were also observed [Table 4].
Image 4.

Yolk sac tumor (a) H&E, 20X; Schiller-Duval body. (b) H&E, 40X; Microcystic pattern: variable sized microcysts lined by primitive tumor cells with varying amounts of clear to eosinophilic cytoplasm. Few cells showing signet ring like morphology
Table 4.
Distribution of germ cell tumors
| Type of tumor | Number (n) | Percentage (%) |
|---|---|---|
| Mature teratoma | 33 | 17.4% |
| Immature teratoma | 1 | 0.5% |
| Dysgerminoma | 2 | 1.1% |
| Yolk sac tumor | 1 | 0.5% |
| Embryonal carcinoma | 0 | 0 |
| Choriocarcinoma | 0 | 0 |
| Mixed germ cell tumor | 1 | 0.5% |
| Monodermal teratomas | 0 | 0 |
| Germ cell sex cord-stromal tumors | 0 | 0 |
| Total | 38 | 20% |
Sex cord-stromal tumors (n=11, 5.78%) were categorized as pure stromal tumors, comprising 7 (3.6%) cases, 3 (1.57%) cases of pure sex cord-stromal tumors, and 1 (0.52%) case of mixed-sex cord-stromal tumors. Among the pure stromal tumors, 5 (2.63%) cases were fibromas and one case each of thecomas and sclerosing stromal tumors. Among pure sex cord-stromal tumors, 2 (1.1%) were AGCT [Image 5] and one (0.5%) was JGCT.A single case of Sertoli-Leydig cell tumor was also observed, and was classified as a mixed-sex cord-stromal tumor [Table 5].
Image 5.
Adult granulosa cell tumor (a) H&E, 20X; Diffuse growth of tumor cells with angulated and pale nuclei. (b) H&E, 40X; Diffuse growth of tumor cells with angulated and pale nuclei. Few cells showing nuclear groove
Table 5.
Distribution of sex cord-stromal tumors
| Type of sex cord-stromal tumor | Subtype of sex cord-stromal tumor | Number (n) | Percentage (%) | Total (n, %) |
|---|---|---|---|---|
| Pure stromal tumor | Fibroma | 5 | 2.63% | |
| Thecoma | 1 | 0.52% | 7 (3.6%) | |
| Sclerosing stromal tumor | 1 | 0.52% | ||
| Pure sex cord-stromal tumor | Adult granulosa cell tumor | 2 | 1.05% | |
| Juvenile granulosa cell tumor | 1 | 0.52% | 3 (1.57%) | |
| Mixed-sex cord-stromal tumor | Sertoli-Leydig cell tumor | 1 | 0.52% | 1 (0.52%) |
| Total (n) | 11 | 5.78% | 11 (5.78%) |
2 (1%) cases comprised metastatic tumors, including 1 (0.5%) case each of well-differentiated adenocarcinoma and Krukenberg tumor [Image 6], in which the primary tumor was carcinoma stomach, and the patient was already on treatment.
Image 6.

Krukenberg tumor (a & b) H&E, 20X; Signet ring cells with cytoplasmic mucin vacuoles infiltrating ovarian stroma
Among benign tumors, the highest number of cases were serous cystadenomas (n = 66, 33%), followed by mucinous cystadenomas (n = 47, 25%), and then mature cystic teratomas [Image 7] (n = 33, 17%).
Image 7.

Mature cystic teratoma (a) H&E, 20X; Intestinal glands within fibrous stroma. (b) H&E, 40X; Cartilage and fibroadipose tissue
Among malignant tumors, HGSCA had a maximum of 8 (4.2%) cases, followed by LGSCA (n = 3, 1.57%) and mucinous carcinomas (n = 5, 2.6%). Adult granulosa cell tumor (AGCT), dysgerminoma, and metastatic tumors comprise 2 (1.1%) cases each, followed by clear cell carcinoma [Image 8], malignant brenner tumor, juvenile granulosa cell tumor (JGCT), immature teratoma, yolk sac tumor, and mixed GCT, each constituting 1 (0.5%) case. Of the eight cases of borderline tumors, mucinous tumors comprised 7 (3.7%) cases, followed by serous borderline tumors (n=1, 0.5%).
Image 8.

Clear cell carcinoma (a) H&E, 20X; Tubulocystic pattern : lined by a single layer of hobnail and cuboidal cells. (b) H&E, 40X; Solid pattern : nested cluster of polyhedral cells separated by delicate septa exhibiting clear to eosinophilic cytoplasm
In the size range of the majority of ovarian tumors, 70 (36.1%) cases were in the range of 11-20 cm, followed by 64 (33.7%) cases and 40 (21%) cases in the range of 6 cm to 10 cm and 0 cm to 5 cm, respectively. 16 (8.4%) cases were observed between 20 cm and 30 cm.
The majority of the cases were unilateral (n = 178, 93.7%), of which 90 (47.3%) were right-sided and 88 (46.3%) were left-sided. In our study, both bilateral cases and cases of unknown laterality were 6 (3.15%) cases each.
Discussion
In total, 190 cases were reviewed. The mean age at which all ovarian tumors were diagnosed was 36 years (SD ± 15.4). The majority of ovarian tumors (45%) occured in the fourth decade of life, in the age group of 31-40 years. This is in contrast to the studies done by Dr. Ramesh Kumar Srivastava et al.[14] and Mehra et al.[15] where the majority of ovarian tumors were observed in the third decade of life.
Most of the tumors were benign (n = 154, 81.1%) and occurred most frequently in the age range of 31–40 years (n = 37, 19.4%), followed by malignant tumors (n = 28, 14.7%), occurring in the age range of 31–40 years and 41–50 years, with 6 (3.1%) cases in each group. Benign cases were somewhat in concordance (32.2% of cases in the age group of 20–40 years), but malignant cases (14.6% of cases in the age group of 41–60 years) were in contrast to the findings of Farag et al.[16] studies.
Two other comparative studies were also performed, among the different types of percentage incidence of ovarian tumors. In our study, we found that most of the ovarian tumors were benign (81.1%), followed by malignant (14.7%) and borderline (4.2%). Our present study correlated with most of the studies done previously, like Batool et al.,[17] Poonam Sharma et al.,[18] Akakpo et al.[19], and many others, but not with Gupta et al.,[20] as here borderline tumors were more prevalent than malignant tumors [Table 6].
Table 6.
Comparison of the percentage incidence of ovarian tumors in various studies
| Authors | Benign tumors (%) | Borderline tumors (%) | Malignant tumors (%) |
|---|---|---|---|
| Amita S Patel et al.[21] | 93.2% | 0.6% | 6.2% |
| Asmeet Kaur et al.[3] | 73.9% | 3.6% | 22.4% |
| Batool et al.[17] | 80.2% | 2.82% | 14.61% |
| Poonam Sharma et al.[18] | 89.6% | 3.6% | 9.8% |
| Sampurna et al.[22] | 66% | 3.5% | 30.5% |
| Thakkar N et al.[23] | 84.5% | 2.3% | 13.2% |
| Sawant A et al.[7] | 75.7% | 6.6% | 18.2% |
| Singh S et al.[24] | 80.8% | 1.6% | 20% |
| Hathila et al.[25] | 62.3% | 4.4% | 33.3% |
| Maheshwari V et al.[26] | 71.7% | 4.4% | 23.7% |
| Gupta N et al.[20] | 72.9% | 22.9% | 4.2% |
| Pilli GS et al.[27] | 76% | 2.8% | 21% |
| Badge A et al.[28] | 74% | 5% | 21% |
| Mehra et al.[15] | 69% | 5.4% | 24.5% |
| Farag et al.[16] | 64.4% | 6.2% | 29.4% |
| Akakpo et al.[19] | 57% | 8% | 35% |
| Present Study | 81.1% | 4.2% | 14.7% |
A second comparative study was performed between the different histopathological types of ovarian tumors. It was found that surface epithelial tumors (SETs) were the most common histological type of ovarian tumors, followed by GCT, and sex cord-stromal tumors, which was in concordance with most of the studies. However, Dr Ramesh Kumar Srivastava et al.[14] did not correlate with our study, in which GCTs were the largest in number. Akakpo et al.[19] study also showed slight more predominance of GCT [Table 7].
Table 7.
Comparison of different histopathological types of ovarian tumors
| Authors | Surface epithelial tumors | Germ cell tumors | Sex cord-stromal tumors | Miscellaneous (Metastatic) |
|---|---|---|---|---|
| Poonam Sharma et al.[18] | 69.6% | 25% | 4.1% | 0 |
| Singh S et al.[24] | 69.1% | 25.8% | 4.1% | 0 |
| Sampurna et al.[22] | 66% | 3.5% | 30.5% | 2% |
| Batool et al.[17] | 63% | 29% | 6% | 0.5% |
| Hathila et al.[25] | 76.7% | 13.03% | 10% | 0 |
| Sawant A et al.[7] | 84.8% | 9.1% | 6.1% | 0 |
| Amita S Patel et al.[21] | 77.7% | 18.5% | 3.8% | 0 |
| Gupta N et al.[20] | 65.6% | 23.9% | 8.3% | 0 |
| Pilli GS et al.[27] | 71% | 21% | 7% | 0.7% |
| Mehra et al.[15] | 70% | 20.9% | 2.7% | 6.4% |
| Dr Ramesh Kumar Srivastava et al.[14] | 29.60% | 57.65% | 10.71% | 2.04% |
| Farag et al.[16] | 59.4% | 23% | 9% | 8.7% |
| Akakpo et al.[19] | 40.7% | 41.9% | 15.2% | 1.1% |
| Present Study | 73.2% | 20% | 5.7% | 1.1% |
Limitations
Our study is a retrospective study and exclusively focuses on the histopathological subtype of ovarian tumors diagnosed on the basis of morphological findings using H and E stains.
The limitation of this study was the relatively small sample size, which limited our ability to effectively categorize tumor cases. We did not include biochemical assessments of tumor markers, immunohistochemistry, or genetic studies due to resource restrictions, although TP53 mutations have been identified in approximately 97% of high-grade serous carcinomas that are evaluated at the time of diagnosis using routine immunohistochemistry[29] and mutations such as FOXL2 have been found useful in diagnosing AGCT.[30] The study’s findings must be considered within the framework of its inherent limitations. Ancillary studies are required for easy and precise diagnosis. Further research involving molecular and genetic studies can aid in the better classification of ovarian tumors.
Conclusion
In this study, the majority of ovarian tumors were SETs, followed by GCTs, and sex cord-stromal tumors. Benign ovarian tumors were the most common, followed by malignant tumors. Most ovarian tumors occurred in the fourth decade of life. Benign cases were also predominantly observed in the fourth decade, but there was a slight predominance of malignant cases in the fourth and fifth decades of life. Therefore, it is essential to study the various factors that could affect the prevalence of ovarian tumors and their association with histopathological types. Newer techniques, including molecular studies, are on the rise; however, in institutes with limited resources, histopathological examination remains the backbone for the diagnosis of ovarian tumors.
Conflicts of interest
There are no conflicts of interest.
Funding Statement
Nil
References
- 1.Sung H, Ferlay J, Siegel RL, Laversanne M, Soerjomataram I, Jemal A, Bray F. Global cancer statistics 2020: GLOBOCAN estimates of incidence and mortality worldwide for 36 cancers in 185 countries. CA Cancer J Clin. 2021;71:209–9. doi: 10.3322/caac.21660. [DOI] [PubMed] [Google Scholar]
- 2.Cancer tomorrow [Internet] [[Last accessed on 2024 May 13]]. Available from: https://gco.iarc.fr/tomorrow/en/dataviz/tables?cancers=25&single_%20unit=10000&years=2050%20%E2%80%93%20accessed%2028%20February .
- 3.Kaur A, Faujdar M, Kariya T, Gupta S. Histomorphological spectrum of ovarian tumors in a tertiary care hospital. Ann Women Child Health. 2017;3:A52–61. [Google Scholar]
- 4.Coburn SB, Bray F, Sherman ME, Trabert B. International patterns and trends in ovarian cancer incidence, overall and by histologic subtype. Int J Cancer. 2017;140:2451–60. doi: 10.1002/ijc.30676. [DOI] [PMC free article] [PubMed] [Google Scholar]
- 5.Jacobs IJ, Menon U. Progress and challenges in screening for early detection of ovarian cancer. Mol Cell Proteomics. 2004;3:355–66. doi: 10.1074/mcp.R400006-MCP200. [DOI] [PubMed] [Google Scholar]
- 6.Badgwell D, Bast RC. Early detection of ovarian cancer. Dis Markers. 2007;23:397–410. doi: 10.1155/2007/309382. [DOI] [PMC free article] [PubMed] [Google Scholar]
- 7.Sawant A, Mahajan S. Histopathological study of ovarian lesions at a tertiary health care institute. MVP J Med Sci. 2017;4:26. [Google Scholar]
- 8.McCluggage WG, Singh N, Gilks CB. Key changes to the World Health Organization (WHO) classification of female genital tumours introduced in the 5th edition (2020) Histopathology. 2022;80:762–78. doi: 10.1111/his.14609. [DOI] [PubMed] [Google Scholar]
- 9.Clarke-Pearson DL. Screening for ovarian cancer. N Engl J Med. 2009;361:170–7. doi: 10.1056/NEJMcp0901926. [DOI] [PubMed] [Google Scholar]
- 10.Hanby AM, Walker C, Tavassoli FA, Devilee P. WHO Classification of Tumours series-volume IV. Vol. 6. Lyon, France: IARC Press. Breast Cancer Research; 2004. Pathology and genetics: Tumours of the breast and female genital organs. doi:10.1186/bcr788. [Google Scholar]
- 11.Cannistra SA. Cancer of the ovary. N Engl J Med. 2004;351:2519–29. doi: 10.1056/NEJMra041842. [DOI] [PubMed] [Google Scholar]
- 12.Pruthi S, Gostout BS, Lindor NM. Identification and management of women with BRCA mutations or hereditary predisposition for breast and ovarian cancer. Mayo Clin Proc. 2010;85:1111–20. doi: 10.4065/mcp.2010.0414. [DOI] [PMC free article] [PubMed] [Google Scholar]
- 13.Jelovac D, Armstrong DK. Recent progress in the diagnosis and treatment of ovarian cancer. CA Cancer J Clin. 2011;61:183–203. doi: 10.3322/caac.20113. [DOI] [PMC free article] [PubMed] [Google Scholar]
- 14.Halder D. A histopathological spectrum of ovarian lesions:as studied in RIMS- a tertiary care hospital in Jharkhand. J Med Sci Clin Res. 2019;7 Available from: https://doi.org/10.18535/jmscr/v7i5.84 . [Google Scholar]
- 15.Mehra P, Aditi S, Prasad KM, Bariar NK. Histomorphological analysis of ovarian neoplasms according to the 2020 WHO Classification of Ovarian Tumors: A distribution pattern in a tertiary care center. Curēus. 2023;15:e38273. doi: 10.7759/cureus.38273. doi:10.7759/cureus.38273. [DOI] [PMC free article] [PubMed] [Google Scholar]
- 16.Farag NH, Alsaggaf ZH, Bamardouf NO, Khesfaty DM, Fatani MM, Alghamdi MK, et al. The histopathological patterns of ovarian neoplasms in different age groups: A retrospective study in a tertiary care center. Curēus. 2022;14 doi: 10.7759/cureus.33092. doi:10.7759/cureus.33092. [DOI] [PMC free article] [PubMed] [Google Scholar]
- 17.Batool A, Rathore Z, Jahangir F, Javeed S, Nasir S, Chughtai AS. Histopathological spectrum of ovarian neoplasms: A single-center study. Curēus. 2022;14:e27486. doi: 10.7759/cureus.27486. doi:10.7759/cureus. 27486. [DOI] [PMC free article] [PubMed] [Google Scholar]
- 18.Sharma P, Bharadwaj S. Histomorphological spectrum of ovarian tumours in a tertiary care centre in Nort h India. J Med Sci Clin Res. 2019;7:841–5. [Google Scholar]
- 19.Akakpo PK, Derkyi-Kwarteng L, Gyasi RK, Quayson SE, Naporo S, Anim JT. A pathological and clinical study of 706 primary tumours of the ovary in the largest tertiary hospital in Ghana. BMC Womens Health. 2017;17:34. doi: 10.1186/s12905-017-0389-8. doi:10.1186/s12905-017-0389-8. [DOI] [PMC free article] [PubMed] [Google Scholar]
- 20.Gupta N, Bisht D, Agarwal AK, Sharma VK. Retrospective and prospective study of ovarian tumours and tumour-like lesions. Indian J Pathol Microbiol. 2007;50:525–7. [PubMed] [Google Scholar]
- 21.Patel AS, Patel JM, Shah KJ. Ovarian tumors-Incidence and histopathological spectrum in tertiary care center, Valsad. IAIM. 2018;5:84–93. [Google Scholar]
- 22.Sampurna K, Jyothi B. Histomorphological spectrum of ovarian tumors-A tertiary care center experience. Asian J Med Sci. 2022;13:111–7. [Google Scholar]
- 23.Thakkar NN, Shah SN. Histopathological study of ovarian lesions. Int J Sci Res. 2015;4:1745–9. [Google Scholar]
- 24.Singh S, Saxena V, Khatri SL, Gupta S, Garewal J, Dubey K. Histopathological evaluation of ovarian tumors. Imperial J Interdiscip Res. 2016;2:435–9. [Google Scholar]
- 25.Hathila R, Nishal A, Shah P, Patel M, Bajaj JH. Histomorphological spectrum of ovarian lesions in a tertiary care institute in Gujarat with special emphasis on ovarian tumors. Int J Sci Study. 2020;8:93–100. [Google Scholar]
- 26.Maheshwari V, Tyagi SP, Saxena K, Tyagi N, Sharma R, Aziz M, Hameed F. Surface epithelial tumours of the ovary. Indian J Pathol Microbiol. 1994;37:75–85. [PubMed] [Google Scholar]
- 27.Pilli GS, Suneeta KP, Dhaded AV, Yenni VV. Ovarian tumours: A study of 282 cases. J Indian Med Assoc. 2002;100:420–3. [PubMed] [Google Scholar]
- 28.Badge SA, Sulhyan KR, Gosavi AV. Histopathological study of ovarian tumors. IMSEAR. 2013. Available from: https://pesquisa.bvsalud.org/portal/resource/pt/sea-157546 .
- 29.Ahmed AA, Etemadmoghadam D, Temple J, Lynch AG, Riad M, Sharma R, et al. Driver mutations in TP53 are ubiquitous in high grade serous carcinoma of the ovary. J Pathol. 2010;221:49–56. doi: 10.1002/path.2696. [DOI] [PMC free article] [PubMed] [Google Scholar]
- 30.Sun M, Giuliany R, Yorida E, Jones S, Varhol R, Swenerton KD. Mutation of FOXL2 in granulosa-cell tumors of the ovary. N Engl J Med. 2009;360:2719–29. doi: 10.1056/NEJMoa0902542. [DOI] [PubMed] [Google Scholar]